The Impact and Inefficiency of the Corporate Income...
26
The Impact and Inefficiency of the Corporate Income Tax: Evidence from State Organizational Form Data Austan Goolsbee University of Chicago, G.S.B., American Bar Foundation, and N.B.E.R. July 31, 2002 Abstract By double taxing the income of corporate firms but not unincorporated firms, taxes can play an important role in a firm's choice of organizational form. The sensitivity of the organizational form decision to tax rates can also be used to approximate the efficiency cost of the corporate income tax. This paper uses new cross-sectional data on organizational form across states compiled in the Census of Retail Trade to estimate this sensitivity. The results document a significant impact of the relative taxation of corporate to personal income on the share of economic activity that is done by corporations including sales, employment, and the number of firms. The impacts are substantially larger than those found in the previous empirical literature based on time-series data. JEL Classification: H25 Business Taxes L22 Firm Organization and Market Structure Keywords: Corporate Taxation, Organizational Form, Taxation, Deadweight Loss I wish to thank William Gentry, Roger Gordon and participants and the TAPES conference for helpful comments, Justin Brookshaw, Tina Lam, and Young Kim for research assistance and the National Science Foundation, the Sloan Foundation and the American Bar Foundation for financial support.
Transcript of The Impact and Inefficiency of the Corporate Income...

The Impact and Inefficiency of the Corporate Income Tax: Evidence from State Organizational Form Data
Austan Goolsbee
University of Chicago, G.S.B., American Bar Foundation,
and N.B.E.R.
July 31, 2002
Abstract
By double taxing the income of corporate firms but not unincorporated firms, taxes can play an important role in a firm's choice of organizational form. The sensitivity of the organizational form decision to tax rates can also be used to approximate the efficiency cost of the corporate income tax. This paper uses new cross-sectional data on organizational form across states compiled in the Census of Retail Trade to estimate this sensitivity. The results document a significant impact of the relative taxation of corporate to personal income on the share of economic activity that is done by corporations including sales, employment, and the number of firms. The impacts are substantially larger than those found in the previous empirical literature based on time-series data. JEL Classification: H25 Business Taxes
L22 Firm Organization and Market Structure Keywords: Corporate Taxation, Organizational Form, Taxation, Deadweight Loss I wish to thank William Gentry, Roger Gordon and participants and the TAPES conference for helpful comments, Justin Brookshaw, Tina Lam, and Young Kim for research assistance and the National Science Foundation, the Sloan Foundation and the American Bar Foundation for financial support.

1. Introduction The corporate income tax generates a distortion by double taxing corporate income. In
other words, corporations typically pay income tax on income earned at the corporate level and
then shareholders pay personal income tax upon the income when it is distributed to them. The
fact that the taxation of corporate income generally exceeds that of personal income raises the
question of how distortionary the corporate income tax is—the magnitude of the deadweight loss
(DWL) of the corporate income tax.
The issue is central to standard work on the subject such as Harberger (1966), Shoven
(1976) or Ballard et al. (1985). In these models, some sectors (e.g., manufacturing) are assumed
to be corporate sectors and other sectors to be non-corporate. A tax on the corporate sector will
lead to shifting to other sectors and this generates a deadweight loss (DWL). The models are
then simulated in computable general equilibrium models and tend to suggest relatively small
efficiency costs—less than 20 percent of the revenue generated.
A more recent literature has sought to consider the efficiency costs of the corporate
income tax in a different setting. In particular, Gravelle and Kotlikoff (1988; 1989; 1993) point
out that there can be both corporate and noncorporate production in the same sector. Taxing
corporate income may lead to much more shifting within sector between organizational forms
than across different sectors. Using such a model they predict an extremely large DWL from the
corporate income tax, frequently in excess of 100 percent of the revenue generated. The key
determinant of the DWL in these models is how much firms in the same industry shift to non-
corporate forms in response to the corporate income tax and this is an empirically testable idea.
In principle, it should be possible to estimate the efficiency loss from the corporate
income tax by examining how much a corporate tax increase induces firms to shift out of

corporate form. This is the subject of Gordon and Mackie-Mason (1990; 1994; 1997) and
Goolsbee (1998) specifically. It is also implicit in the large literature on how corporate taxes
affect organizational form decisions such as Ayers et al. (1996), Carroll and Joulfaian (1997),
Gentry (1994), Fullerton and Rogers (1993), Scholes and Wolfson (1990; 1991; 1992), and
Plesko (1995; 1997). The results in Gordon and Mackie-Mason and in Goolsbee indicate that
across different time periods, there does not seem to be much shifting in response to tax rates,
suggesting that the DWL of the corporate income tax is relatively modest overall. (i.e., low
shifting implies low distortions).
An underlying empirical problem in much of this literature comes from data constraints.
Variation in corporate tax rates over the past 30 years has been almost. Further, the standard
approach has been to look at time-series type regressions, typically at a highly aggregated level,
though sometimes with a limited panel of firm level data. The problem is that when the
corporate tax rate changes, such as in 1986, many other aspects of the tax code change, as well,
making it difficult to be sure that one is picking up the effect of tax rates.
This paper turns to a new data source to identify the impact of the corporate income tax
using cross-sectional variation in corporate tax rates in order to avoid the typical problems of the
time-series based literature. It does this by looking at variations in corporate income taxes across
states and combining that with unpublished data from the Department of the Census on the
organizational form by 3 and 4 digit SIC code in the retail trade sector across states in 1992.
Although the census data have some problems that traditional tax data do not have, and
although there the impact of state and federal corporate income taxes may differ (since firms
have an easier time moving to different jurisdictions to avoid state taxes, for example) this cross-
sectional approach allows for a direct estimate of the impact of tax rates on corporate incentives

to incorporate while controlling for aggregate factors. As a further matter, there is considerable
interest in the subject of state corporate income taxes themselves.
This paper will examine the impact of corporate income taxes on firms' choice of
organizational form decisions and the implied efficiency cost of the corporate income tax in 5
sections. Section 2 gives an overview of the way taxes may affect the organizational form
choice and presents a simple model deriving the relative tax term. Section 3 summarizes the
specification estimated in the paper and the data used. Section 4 presents the regression results.
Section 5 concludes.
2. Overview of organizational form choices
A. Institutional Background
An enterprise that conducts business does not have to declare itself to be a corporation
and thus can avoid any double taxation. The firm can be organized as a sole proprietorship or as
a partnership in which case any income earned will flow through to the partners' or proprietor's
individual income tax. Although this type of flow through entity would appear to have a tax
advantage for most types of business entities, there are important non-tax factors that lead most
business assets to end up in corporate form. The two most important are limited liability and
access to capital markets. The investors and managers of corporations do no t risk their
individual assets or income when they take part in a firm. They are only liable for the amount
that they have invested in the company. Corporations also have the right to trade on organized
exchanges and typically have easier access to both debt and equity. Discussion of other non-tax
factors relating to organizational form choices can be found in Guenther (1992) or Scholes et al
(2002).

It is important to note some exceptions to this simple dichotomy of form choice. The
first is that within the corporate sector, starting in 1958, certain firms could become S
corporations (as opposed to the traditional C corporations). Income from S corporations are flow
through entities like traditional partnerships, eliminating the double taxation without losing the
limited liability. S corporations limit the number of shareholders to . More details on the
comparison of S and C corporations can be found in Gordon and Mackie-Mason (1997). Recent
years have seen a considerable expansion in hybrid organizational forms such as the Limited
Liability Partnership, etc. which somewhat blur the lines between forms. At the time of this
sample (1992), all such forms other than S corporations were rare or non-existant and, as I will
indicate below, S corporations were not especially numerous in the retail sector.
B. A Simple Theory of Organizational Form
The stylized model of a firm's decision about whether to incorporate here follows the
work of Gordon and Mackie-Mason (1994) with some extensions. Assume, for simplicity, that
the income generated by a firm, Y, is the same regardless of organization type and that there is
some relative non-tax benefit G associated with being a corporation which is itself a function of
firm characteristics, x. The non-tax benefit is assumed to be non-taxable (e.g., something like
the value of limited liability). The after-tax income from operating as a corporation each period
is then
)1)(1)(1()( eFC
STCC tttYxGI −−−+=

where STCt is the state corporate income tax rate, F
Ct is the federal corporate income tax rate and te
is the tax rate on equity income.1 That is, a firm gets G plus income net of corporate and equity
taxes and the state tax is deductible from the federal.2
The after tax income from a noncorporate firm is then
)1)(1( FP
STPNC ttYI −−= .
where STPt is the state personal income tax rate facing the marginal investor and F
Pt is the federal
personal income tax rate facing the marginal investor. In words, a noncorporate firm gets no G
but pays only personal income taxes on the income.
Clearly, the firm will prefer the corporate form whenever
)~)~1(~()( PeCC ttttYxG −−+>
where it~ is the full marginal tax rate on income type i—i.e., accounting for state and federal
taxation—according to
Fi
STi
Fi
STii ttttt −+=~ .
In the case where the effective rate of taxation on equity is zero, all that matters is the
relative taxation of corporate versus personal income. The model illustrates that the key tax
determinant of the decision of whether to incorporate is the relative taxation of corporate versus
personal income. While each of these tax components can, to some degree, be measured, the
sign of the relationship depends on whether taxable income is greater than zero and this fact that
1 I will exclude discussion of the payroll tax whose method of payment differs for corporations versus partnerships/proprietorships but whose total burden is equal. 2 This is sufficient for almost all states. In five small states, however, at the time of the sample—Alabama, Iowa, Louisiana, Maryland, and North Dakota—the previous year's federal taxes are also deductible from the state taxes. I account for this in the empirical work.

is not observed in the census data. I will have to use proxies for profitability to examine whether
this prediction is born out in the data.
This model is most relevant for small, entrepreneurial type firms. In particular, it is not a
good approximation for multi-state firms. When a firm conducts business in multiple states, its
marginal tax rate becomes a weighted average of tax rates in all the states it does business in
according to the apportionment formula (see Gordon & Wilson, 1986; Goolsbee and Maydew,
2000). The evidence will, indeed, show that the empirical model fits much better in industries
with a small number of establishments per firm.
3. Data
A. Specification
The basic regression of the paper will explain the corporate share of industry activity Y,
say employment or revenue, for state s and industry i according to
ississiTotalis
Corporateis ZXTAXY
Yεβα +Λ+Γ++= '')( ,
where TAX is the measure of the relative taxation of corporate income from the model
above, )~)~1(~( PeCC tttt −−+ , X is a vector if state-industry characteristics that may influence the
gains to incorporation, and Z is a vector of state level factors that may influence the likelihood of
incorporation. 3
B. Data on Organizational Form Across States and Industries
3 The right hand side share variable is censored at 0 and 1 in a few cases (1-3 percent or the state-industries). In the results below I will use the linear regression model for simplicity, especially in dealing with the fixed effects. I have checked the results but using a Tobit estimator with censoring at 0 and 1 and the results were virtually identical.

The data on organizational form come from the Census of Retail Trade for 1992. This
economic census is conducted every five years and is meant to provide comprehensive coverage
of the sector. Retail trade, being primarily a non-tradeable, may not be representative of other
sectors of the economy. It may, for example, be more sensitive to organizational form decisions
than other industries are (for those industries, it is easier to change the location of production).
That said, retail trade is an enormous sector on its own accord. In 1992, total sales in the retail
trade sectors included in this sample exceeded $1.7 Trillion and employment was almost 17.5
million. This was divided between 8 broad classes of retail trade as shown in table 1. According
to the BEA, in 1992 retail trade made up almost 9 percent of national GDP and the BLS reports
that it employed about 16.5 percent of the nation's workforce.
The census of retail trade asks firms about their organizational form. The choices are
corporate, partnership, sole proprietorship, and other. I will use the sum of all the non-corporate
categories as the non-corporate share. One drawback of the Census data compared to tax return
data is that the Census does not distinguish any of the hybrid organizational forms, most
importantly, it does not differentiate S corporations from C corporations. The S corps are flow
through entities so changes to the relative tax term may lead businesses to shift from C to S
corporations in response to the tax but this will not show up as a change in the Census data since
the firm will remain a corporation in both cases. This will no doubt bias the estimated impact of
taxes on organizational form choices toward zero in the current sample. It is not possible to
determine how important a factor this is because there is no publicly available information on the
share of S corporations by state. The Statistics of income for 1992 for the entire nation,
however, shows that the share of corporate returns in the wholesale and retail trade sector that
are S corporations is about 20 percent. The share of total revenues in the corporate sector from S

corporations is about 5 percent. On average, then, the misclassification of corporations is
relatively small, though they may be more sensitive on the margin than are other corporations.
Similarly, there is no income information in the data because it is establishment based
and income is fundamentally a firm-level concept. This will prevent all but the most crude proxy
for the differential responses of gain versus loss firms.
I received a special tabulation from the Census Bureau for each reported SIC code and
each variable (employment, payroll, sales, firms, establishments) the totals by organizational
form type. I will use the corporate share of the industry total as the dependent variable in the
regressions. These special tabulations are subject to non-disclosure requirements meaning that
the Census does not reveal information that could be used to learn about specific companies. So,
for example, SIC code 5943, Stationery Stores is missing information on employment and sales
in several smaller states. The missing observations are concentrated among the small states and
the small industries, of course. In the 76 industries 3-digit industries, of the 1900 possible
industry-state combinations, 15 have data on the number of corporate firms and establishments
withheld for disclosure reasons. More of the employment, payroll and sales observations are
withheld with about 210 of the 1900 possible observations missing for the corporate sector in
these areas.
The data include information on the SIC codes listed in the Appendix table. I will mainly
focus on the 3 digit SIC code level, though I will also present some results at the 2- and the 4-
digit level. At lower levels of aggregation, not all the industries are covered. One of the big
advantages of looking at the retail trade data is that there are many industries with a great deal of
non-corporate activity, unlike manufacturing and some other prominent sectors. There is also a
great deal of variation in the corporate share.

B. Data on Taxes and Other Control Variables
The components of the tax term are computed as follows: the combined federal and state
tax on personal income for the marginal investor is the highest marginal rate in the state,
combining federal and state taxation, as computed by the NBER TAXSIM for the year 1992 as
reported in NBER (2002). For the corporate rate, I use the information in the Book of the States
(1994) as well as Significant Features of Fiscal Federalism (ACIR, 1994) and compute the
highest corporate marginal rate in the state, taking account of the deductibility of state taxes from
the federal and the reverse in the relevant states. Michigan does not have conventional corporate
income tax so I exclude it from the results.
The model above seems to outline the decision of the organizational choice of a small
entrepreneur. For such a person, the tax on equity is different than for a larger company. Since
small firms are unlikely to pay any dividends, however, and because there are several aspects of
capital gains that are highly favorable to small entrepreneurs (greater deductibility of losses from
ordinary income, for example), it it probably more accurate to assume the tax rate on equity is
zero. I will do that here. Results were similar assuming equity taxation at the highest state
capital gains rate, discounted for delayed realization as in Feldstein et al. (1983), instead, as
demonstrated in an earlier version of this paper (Goolsbee, 2002).
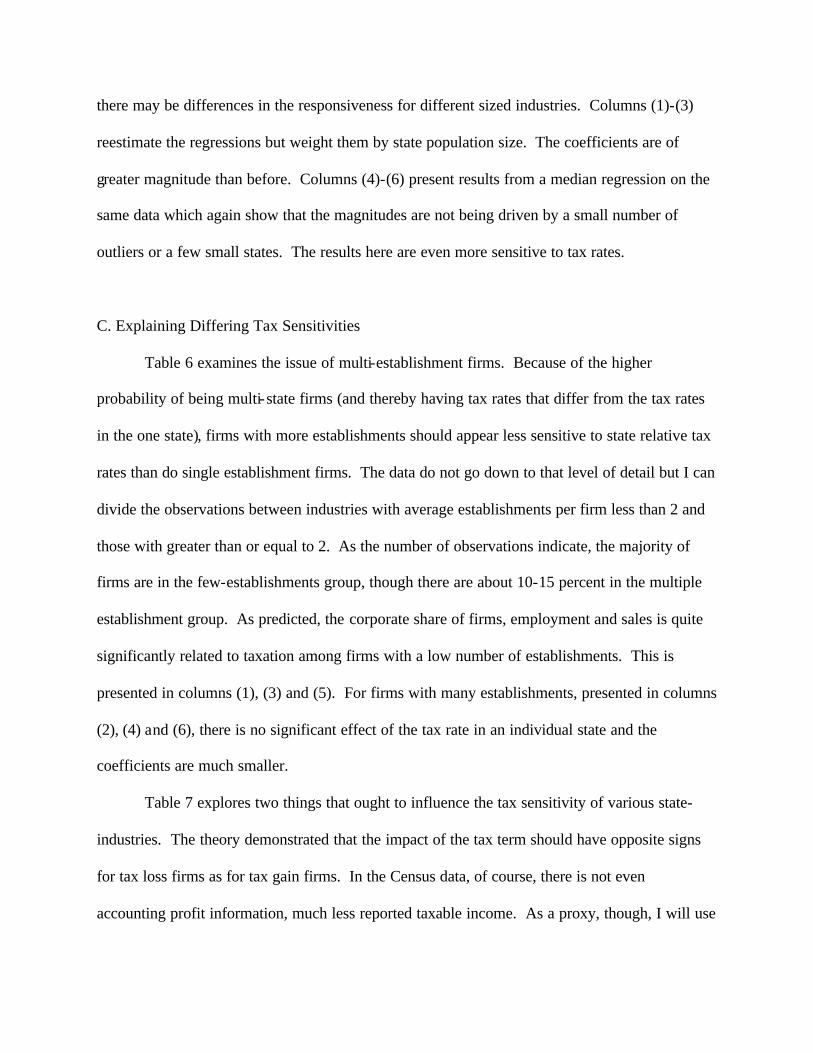
Figure 1 plots Ct~ for each state on the y-axis and Pt
~ on the x-axis. The difference
between the two is the tax term so states well above the 45 degree line like Alaska, Pennsylvania
and Connecticut tax corporate income relatively heavily compared with personal income and

places closer to or actually below the 45 degree line like South Carolina, Kansas and Vermont
tax corporate income relatively lightly.4
Industry characteristics that might influence the probability of incorporation (through,
say, increasing the value of limited liability or access to capital markets) might be average firm
size, pay, number of establishments per firm and the like. To keep things as general as possible,
I will include the log of total industry sales, employment, payroll, number of firms and number
of establishments. I tried including various ratios such as population density, sales per firm and
so on, instead of the logs and the results were the same. Note that because there are dummies for
every SIC code, the specifications fully account for any industry level variation in non-tax
reasons for incorporation.
There may also be state characteristics that might influence the probability of
incorporation in all industries. It is impossible to include state dummies since the tax rate does
not vary across industries but I will include information on the log of the Gross State Product in
the state in the year of the sample (1992) and the previous year (1991) from the BEA, the log of
the land area and the log of population in the state from the U.S. Statistical Abstract and the
share of the state population born outside the state (either domestic or foreign born) and the share
of the people born in the state that are still living in the state both at the time of the 1990 census,
calculated from U.S. Department of the Census (2002) as well as the share of the state that is
rural. The view is that state income levels or growth rates, concentration of population, tax
competition pressures from neighboring states or a higher transient/new population all might
influence the probability of incorporation. I also include the share of the state that has some
4 . The regressions will take these tax rates as exogenous. Though I do not have information about how the state tax rates were determined, I did try including other types of taxes which might be correlated with the unobserved business climate in the state such as the sales tax rate and generally did not find that it changed the results presented.

college education in the spirit of the theoretical work of Levin and Tadellis (2002). All of the
state level data, including the tax rates, summarized in Table 2.
4. Results
A. Basic Results
Results from the basic specification explaining the corporate share of firms,
establishments, employment, payroll, and sales in a given industry in a given state as a function
of the relative tax term and the other control variables are reported in table 3. This is for 38
different industries at the 3-digit SIC code level. There are SIC code dummies for the industries
so the coefficients indicate the impact that a state having a higher relative tax on corporations has
on its share of corporate activity relative to other states in that same industry. For each of the
types of economic activity, the coefficient on taxes is negative (and significant for all but one)
indicating that increasing the relative burden on corporations reduces the corporate share of
activity.
The coefficient on firms indicates that every .01 rise in the corporate income tax reduces
the corporate share of firms by .006. Interestingly, the results indicate that the share of firms
responds much more to the tax term than does the share of establishments. Similarly, the share
of employment, payroll and sales responds negatively, as well, but by less than does the number
of firms (this is especially true considering that the corporate share is higher for these variables
than for the number of firms). The number of firms may be more responsive than other
categories because state corporate tax rates are frequently progressive and a small firm can
remain in the lower marginal tax rate by simply starting a new firm rather than by growing.

The magnitudes of the tax coefficients are not precisely comparable to the effects
estimated in the literature by Gordon and Mackie-Mason (1994; 1997) or Goolsbee (1998)
because those papers dealt with the corporate share of capital or the share of reported income
whereas these are for the number of firms and establishments and the level of sales, employment
and payroll. That said, the coefficients on the tax term here are substantially larger than on the
same tax term in those papers. The coefficients of the tax term on the share of industrial activity
done by corporations here ranges from -.17 to -.60. The equivalent coefficients in the previous
literature (on the overall corporate share of capital assets) generally ranged from -.001 to -.15.
B. Robustness
Next, in table 4, I examine the results at different levels of aggregation. For brevity, I
will look at the corporate share of firms, employment and sales and leave establishments and
payroll out of the tables. The results are highly related, just as in the previous table. At the 2-
digit SIC code level, there is data is available for all of the industries, although there are only 8
SIC codes so the estimates are not estimated very precisely. The results, presented in columns
(1)-(3) show a similar pattern with similar magnitudes but larger standard errors. For a subset of
industries, there is more detailed data, i.e., down to the 4-digit SIC code level. These are
concentrated only in the 2-digit SIC codes 57, 58 and 59. Looking at these 30 industries in
columns (4)-(6) shows even larger effects than the 3-digit results did, especially for the ‘real’
factors of employment and sales.
In table 5, I deal with the robustness questions that might arise from weighting state-
industries equally despite dramatically varying sizes. In theory, since the regressions are
controlling for size of population of the state and the size of the sector, this should not matter but
there may be differences in the responsiveness for different sized industries. Columns (1)-(3)
reestimate the regressions but weight them by state population size. The coefficients are of
greater magnitude than before. Columns (4)-(6) present results from a median regression on the
same data which again show that the magnitudes are not being driven by a small number of
outliers or a few small states. The results here are even more sensitive to tax rates.
C. Explaining Differing Tax Sensitivities
Table 6 examines the issue of multi-establishment firms. Because of the higher
probability of being multi-state firms (and thereby having tax rates that differ from the tax rates
in the one state), firms with more establishments should appear less sensitive to state relative tax
rates than do single establishment firms. The data do not go down to that level of detail but I can
divide the observations between industries with average establishments per firm less than 2 and
those with greater than or equal to 2. As the number of observations indicate, the majority of
firms are in the few-establishments group, though there are about 10-15 percent in the multiple
establishment group. As predicted, the corporate share of firms, employment and sales is quite
significantly related to taxation among firms with a low number of establishments. This is
presented in columns (1), (3) and (5). For firms with many establishments, presented in columns
(2), (4) and (6), there is no significant effect of the tax rate in an individual state and the
coefficients are much smaller.
Table 7 explores two things that ought to influence the tax sensitivity of various state-
industries. The theory demonstrated that the impact of the tax term should have opposite signs
for tax loss firms as for tax gain firms. In the Census data, of course, there is not even
accounting profit information, much less reported taxable income. As a proxy, though, I will use

the ratio of total operating expenses relative to sales. Total operating expenses include payroll,
benefits, costs of goods sold, materials and supplies, depreciation, leases, fuel and electricity but
not capital expenditures. The payroll information is in the state level census data, the other
operating expenses come from the national edition of the Census of Retail Trade-Assets and
Expenditues Series. Some of those data are given at only the 2-digit level so I assume all SICs in
the same 2-digit category have the same operating expense ratio in these cases. The measure of
total expenses ranges from 71 percent of sales for Department Store Retailers to more than 98
percent of sales for Radio, Television and Music stores and for Grocery Stores.
Columns (1)-(3) interact this measure of operating expenses with the relative tax term. If
the percent of sales revenue remaining after subtracting total operating expenses is a crude
measure of profitability then the tax term should be less important in industries with higher
expense ratios. In other words, the interaction term should be positive if the measured tax term
is less important for firms making losses (i.e., with high expense ratios). The results have the
correct signs although they are clearly noisy, especially as regards employment and sales.
The last 3 columns then explore whether sensitivity to tax rates is related to the physical
size or to the population of the state. At the outset, I noted that the sensitivity to state corporate
income taxes might be greater than to federal income taxes because corporate firms can move
locations as well as change organizational status in response to local variation. In small or
sparsely populated places like Vermont, firms may react very negatively to a tax increase
whereas in a place like California they may want to remain in the market and as corporations no
matter what the cost. To explore this, I interact the tax term with the log of population and the
log of land area in the state. For the corporate share of firms in the state- industry, both variables
matter. For employment and for sales, only the physical size of the state matters. In every case,

the smaller the state, the greater is the sensitivity to relative tax differentials. The magnitudes are
quite large. Take corporate employment. For a state in the 5th percentile of the size distribution
(Connecticut), raising the relative tax term by .01 reduces the share of corporate share of firms in
the state- industry by .014. For a state in the 95th percentile, the effect is zero (the point estimate
is -.001).
5. Conclusion
Using new, cross-sectional census data across states and industries in the retail trade
sector, this paper has shown that the relative taxation of corporate to personal income plays an
important role in the share of firms, employment and sales that are done by corporations versus
partnerships and sole proprietorships. An increase in the corporate tax rate by .10 reduces the
corporate share of firms by 5-10 percent and the corporate share of sales and employment by 2-6
percent. Given the lack of data on S corporations in the census data, this is likely to be an
underestimate of the true shifting. This impact of tax rates is an order of magnitude larger than
previous estimates based on time-series variation in the tax rate and suggests a larger DWL from
corporate taxation but is still relatively modest.

Table 1: Census of Retail Summary SIC CODE
Firms Sales
(000s) Employees
(000s)
52: Building Materials & Garden Stores % Corporate
53: General Merchandise Stores
% Corporate
54: Food Stores % Corporate
55: Auto Dealers
% Corporate
56: Apparel and Accessory Stores % Corporate
57: Furniture and Home Furnishing Stores
% Corporate
58: Eating and Drinking Places % Corporate
59: Miscellaneous Retail
% Corporate
56,431 .694
11,520 .564
129,100
.478
80,213 .728
69,500 .613
82,310 .633
335,285
.538
240,015 .546
98,730 .905
245,100
.989
368,600 .904
393,300
.930
101,400 .903
92,970 .870
194,300
.791
183,400 .808
665 .887
2,076 .985
2,964 .882
1,261 .918
1,141 .905
701 .849
6,522 .791
1,764 .786
Source: Author’s calculations

Table 2: State Level Data Summary
Ln (GSP 1991) Ln (GSP 1992)
GSP Growth 1991 to 1992 % 1990 Population Born in state
% Born in the state still there in 1990 % Rural
% with Some College Education
Relative Tax Term t Corporate (including federal) t Personal (including federal) Number of observations
11.174 (1.039) 11.118 (1.040)
.058 (.026)
.610 (.141)
.635 (.084)
.318 (.147)
.452 (.066)
.035 (.021)
.391 (.020)
.356 (.024) 49
Source: Author’s calculations

Table 3: Basic Results-3 Digit SIC Code Level for Corporate Share (1)
Firms (2)
Estab (3)
Employment (4)
Payroll (5)
Sales
Tax Term
ln (GSP 91) ln (GSP 92)
% Rural % Some College % Stay in State % Born in Stay ln (land area)
ln (population) ln (employment)
ln (# firms) ln (# establish.)
ln (sales) ln (payroll)
Industry Dums.
obs R2
Mean of Dep Var
-.599 (.127)
.041 (.104) -.009 (.111) -.077 (.028) -.163 (.059) -.155 (.052) -.115 (.024) -.052 (.003) -.002 (.020) -.084 (.019) -.023 (.011) -.059 (.016) -.030 (.016) .184 (.021) Yes (38)
1783 .72
.626
-.376 (.124)
-.014 (.101) .044 (.109) -.113 (.028) -.187 (.058) -.042 (.051) -.079 (.024) -.040 (.002) -.021 (.021) -.023 (.019) -.101 (.010) .036 (.016) -.036 (.015) .131 (.020) Yes (38)
1783 .71
.698
-.299 (.115)
.011 (.094) -.003 (.100) -.093 (.026) -.185 (.053) -.055 (.046) -.037 (.022) -.022 (.002) -.018 (.019) -.028 (.019) -.035 (.010) -.049 (.015) -.045 (.014) .175 (.020) Yes (38)
1647 .66
.860
-.166 (.119)
.080 (.097) -.086 (.103) -.101 (.027) -.204 (.055) -.064 (.048) -.037 (.023) -.015 (.002) -.007 (.020) -.009 (.019) -.002 (.010) -.060 (.015) -.069 (.015) .162 (.020) Yes (38)
1647 .57
.826
-.258 (.127)
-.007 (.103) -.000 (.109) -.101 (.028) -.260 (.059) -.018 (.051) -.065 (.024) -.024 (.002) -.010 (.022) -.003 (.020) -.012 (.011) -.086 (.016) -.057 (.016) .183 (.022) Yes (38)
1647 .63
.830
Notes: The dependent variable is the corporate share of the variable listed at the top of the column. The independent variables are defined in the text. The standard errors are listed in parentheses.

Table 4: Results at Different Levels of Aggregation
(1) SIC 2-digit
Firms
(2) SIC 2-digit
Empl.
(3) SIC 2-digit
Sales
(4) SIC 4-digit
Firms
(5) SIC 4-digit
Empl.
(6) SIC 4-digit
Sales
Tax Term
Other Controls Industry Dums.
obs R2
-.489 (.202)
13 Vars Yes (8)
391 .73
-.211 (.106)
13 Vars Yes (8)
391 .79
-.196 (.170)
13 Vars Yes (8)
391 .57
-.640 (.154)
13 Vars Yes (30)
1343 .62
-.408 (.121)
13 Vars Yes (30)
1216 .70
-.359 (.147)
13 Vars Yes (30)
1216 .63
Notes: The dependent variable is the corporate share of the variable listed at the top of the column. The first three columns use a sample of 2-digit industries. The last three columns use a sample of 4-digit industries. Each of the regressions includes the same 13 covariates that were listed in the regressions of table 3. The standard errors are listed in parentheses.

Table 5: Robustness
(1) Pop weight
Firms
(2) Pop weight
Empl.
(3) Pop weight
Sales
(4) Median Firms
(5) Median Empl.
(6) Median Sales
Tax Term
Other Controls Industry Dums.
obs R2
-.448 (.150)
13 Vars Yes (38)
1783 .68
-.318 (.120)
13 Vars Yes (38)
1647 .68
-.388 (.132)
13 Vars Yes (38)
1647 .64
-.937 (.165)
13 Vars Yes (38)
1783
--
-.440 (.104)
13 Vars Yes (38)
1647
--
-.402 (.083)
13 Vars Yes (38)
1647
--
Notes: The dependent variable is the corporate share of the variable listed at the top of the column. The first three columns weight observations by state population.. The last three columns use median regressions. Each of the regressions includes the same 13 covariates that were listed in the regressions of table 3. The standard errors are listed in parentheses.
Table 6: Tax Sensitivity by Industry’s Average Firm Size (1)
<2 est/firm Firms
(2) ∃2 est/firm
Firms
(3) <2 est/firm
Empl.
(4) ∃2 est/firm
Empl.
(5) <2 est/firm
Sales
(6) ∃2 est/firm
Sales
Tax Term
Other Controls Industry Dums.
obs R2
-.684 (.133)
13 Vars
Yes
1569 .70
-.024 (.427)
13 Vars
Yes
214 .78
-.377 (.118)
13 Vars
Yes
1451 .66
-.093 (.236)
13 Vars
Yes
196 .88
-.336 (.132)
13 Vars
Yes
1451 .62
-.163 (.169)
13 Vars
Yes
196 .94
Notes: The dependent variable is the corporate share of the variable listed at the top of the column. Columns (1), (3) and (5) look at industries where firms have, on average, average fewer than 2 establishments. Columns (2), (4), and (6) show those having greater than or equal to 2. Each of the regressions includes the same 13 covariates that were listed in the regressions of table 3. The standard errors are listed in parentheses.

Table 7: Explaining Tax Sensitivity Across States and Industries (1)
Firms (2)
Empl. (3)
Sales (4)
Firms (5)
Empl. (6)
Sales
Tax Term
Tax Term Interacted with: Industry-Level Expenses/Sales
Ln (Population)
Ln (land)
Other Controls Industry Dums.
obs R2
-3.066 (1.442)
2.636 (1.534)
13 Vars Yes (38)
1783 .72
-1.729 (1.319)
1.528 (1.404)
13 Vars Yes (38)
1647 .66
-1.214 (1.456)
1.021 (1.549)
13 Vars Yes (38)
1647 .63
-6.534 (1.012)
.427
(.116)
.515 (.094)
13 Vars Yes (38)
1783 .72
-3.092 (.947)
.034 (.107)
.261
(.089)
13 Vars Yes (38)
1647 .66
-2.519 (1.047)
-.022 (.118)
.217
(.098)
13 Vars Yes (38)
1647 .63
Notes: The dependent variable is the corporate share of the variable listed at the top of the column. The first three columns interact the tax term with the expense ratio, as defined in the text. The last three columns interact the tax term with the size of the state in terms of land and population. Each of the regressions includes the same 13 covariates that were listed in the regressions of table 3. The standard errors are listed in parentheses.

APPENDIX TABLE: SIC CODES INCLUDED 2-Digit SIC code regressions 5200 Building Materials and Garden Supplies Stores 5300 General Merchandise Stores 5400 Food Stores 5500 Automotive Dealers 5600 Apparel and Accessory Stores 5700 Furniture and Homefurnishings Stores 3-Digit SIC code regressions 5210 Lumber & Other Building Mtrls Dealers 5230 Paint, Glass, and Wallpaper Stores 5250 Hardware Stores 5260 Nurseries, Lawn & Garden Stores 5270 Manufactured (Mobile) Home Dealers 5310 Department Stores 5330 Variety Stores 5390 Misc. General Merchandise Stores 5410 Grocery Stores 5420 Meat and Fish (Seafood) Markets 5430 Fruit and Vegetable Markets 5440 Candy, Nut, and Confectionery Stores 5450 Dairy Products Stores 5460 Retail Bakeries 5490 Miscellaneous Food Stores 5510 New and Used Car Dealers 5520 Used Car Dealers 5530 Auto and Home Supply Stores 5540 Gasoline Service Stations
5550 Boat Dealers 5560 Recreational Vehicle Dealers 5570 Motorcycle Dealers 5590 Automotive Dealers, N. E. C. 5610 Men's Clothing & Accessory Stores 5620 Women's Clothing Stores 5630 Women's Accessory & Specialty Stores 5640 Children's and Infants' Wear Stores 5650 Family Clothing Stores 5660 Shoe Stores 5690 Misc. Apparel and Accessory Stores 5720 Household Appliance Stores 5730 Radio, TV, Computer, & Music Stores 5910 Drug and Proprietary Stores 5920 Liquor Stores 5930 Used Merchandise Stores 5940 Miscellaneous Shopping Goods Stores 5960 Nonstore Retailers 5980 Fuel Dealers
4- Digit SIC code regressions 5712 Furniture Stores 5713 Floor Covering Stores 5714 Drapery, Curtain, Upholstery Stores 5719 Miscellaneous Homefurnishings Stores 5731 Radio, TV, and Electronics Stores 5734 Computer and Software Stores 5735 Record and Prerecorded Tape Stores 5736 Musical Instrument Stores 5812 Eating Places 5813 Drinking Places 5941 Sporting Goods and Bicycle Shops 5942 Book Stores 5943 Stationery Stores 5944 Jewelry Stores 5945 Hobby, toy, and game shops 5946 Camera and photographic supply stores 5947 Gift, novelty, and souvenir shops 5948 Luggage and leather goods stores 5949 Sewing, needlework, piece good stores 5961 Catalog and Mail-Order Houses 5962 Automatic Merchandising Machine Ops. 5963 Direct Selling Establishments 5983 Fuel Oil Dealers 5984 Liquefied Petroleum Gas Dealers 5989 Fuel Dealers, N. E. C. 5992 Florists 5993 Tobacco Stores and Stands 5994 News Dealers and Newsstands 5995 Optical Goods Stores 5999 Miscellaneous Retail Stores, N.E.C.

tcorp
Figure 1: State Tax Ratestpers
.3 .35 .4
.3
.35
.4
ALALALALALALALALALALALALALALALALALALALALALALALALALALALALALALALALALALALALALALALALALALALALALALALALALALALALALALALALALALALALALALALALALALALALALALALALALALALALALALALALALALALALALALALALALALALALALALALALALALALALALALALALALALALALALALALALALALALALALALALALALALALALALALALALALALALALALALALALALALALALALALALALALALALALALALALALALALALALALALALALALALALALALALALALALALALALALALALALALALALALALALALALALALALALALALALALALALALALALALALALALALALALALALALALALALALALALALALALALALALALALALALAL
AKAKAKAKAKAKAKAKAKAKAKAKAKAKAKAKAKAKAKAKAKAKAKAKAKAKAKAKAKAKAKAKAKAKAKAKAKAKAKAKAKAKAKAKAKAKAKAKAKAKAKAKAKAKAKAKAKAKAKAKAKAKAKAKAKAKAKAKAKAKAKAKAKAKAKAKAKAKAKAKAKAKAKAKAKAKAKAKAKAKAKAKAKAKAKAKAKAKAKAKAKAKAKAKAKAKAKAKAKAKAKAKAKAKAKAKAKAKAKAKAKAKAKAKAKAKAKAKAKAKAKAKAKAKAKAKAKAKAKAKAKAKAKAKAKAKAKAKAKAKAKAKAKAKAKAKAKAKAKAKAKAKAKAKAKAKAKAKAKAKAKAKAKAKAKAKAKAKAKAKAKAKAKAKAKAKAKAKAKAKAKAKAKAKAKAKAKAKAKAKAKAKAKAKAKAKAKAKAKAKAKAKAKAKAKAKAKAKAKAKAKAKAKAK AZAZAZAZAZAZAZAZAZAZAZAZAZAZAZAZAZAZAZAZAZAZAZAZAZAZAZAZAZAZAZAZAZAZAZAZAZAZAZAZAZAZAZAZAZAZAZAZAZAZAZAZAZAZAZAZAZAZAZAZAZAZAZAZAZAZAZAZAZAZAZAZAZAZAZAZAZAZAZAZAZAZAZAZAZAZAZAZAZAZAZAZAZAZAZAZAZAZAZAZAZAZAZAZAZAZAZAZAZAZAZAZAZAZAZAZAZAZAZAZAZAZAZAZAZAZAZAZAZAZAZAZAZAZAZAZAZAZAZAZAZAZAZAZAZAZAZAZAZAZAZAZAZAZAZAZAZAZAZAZAZAZAZAZAZAZAZAZAZAZAZAZAZAZAZAZAZAZAZAZAZAZAZAZAZAZAZAZAZAZAZAZAZAZAZAZAZAZAZAZAZAZAZAZAZAZAZAZAZAZAZAZAZAZAZAZAZAZAZAZAZAZAZAZ
ARARARARARARARARARARARARARARARARARARARARARARARARARARARARARARARARARARARARARARARARARARARARARARARARARARARARARARARARARARARARARARARARARARARARARARARARARARARARARARARARARARARARARARARARARARARARARARARARARARARARARARARARARARARARARARARARARARARARARARARARARARARARARARARARARARARARARARARARARARARARARARARARARARARARARARARARARARARARARARARARARARARARARARARARARARARARARARARARARARARARARARARARARARARARARARARARARARARARARARARARARARARARARARARARARARARARARARARARARARARARARARARAR
CACACACACACACACACACACACACACACACACACACACACACACACACACACACACACACACACACACACACACACACACACACACACACACACACACACACACACACACACACACACACACACACACACACACACACACACACACACACACACACACACACACACACACACACACACACACACACACACACACACACACACACACACACACACACACACACACACACACACACACACACACACACACACACACACACACACACACACACACACACACACACACACACACACACACACACACACACACACACACACACACACACACACACACACACACACACACACACACACACACACACACACACACACACACACACACACACACACACACACACACACACACACACACACACACACACACACACACACACACACACACACACACA
COCOCOCOCOCOCOCOCOCOCOCOCOCOCOCOCOCOCOCOCOCOCOCOCOCOCOCOCOCOCOCOCOCOCOCOCOCOCOCOCOCOCOCOCOCOCOCOCOCOCOCOCOCOCOCOCOCOCOCOCOCOCOCOCOCOCOCOCOCOCOCOCOCOCOCOCOCOCOCOCOCOCOCOCOCOCOCOCOCOCOCOCOCOCOCOCOCOCOCOCOCOCOCOCOCOCOCOCOCOCOCOCOCOCOCOCOCOCOCOCOCOCOCOCOCOCOCOCOCOCOCOCOCOCOCOCOCOCOCOCOCOCOCOCOCOCOCOCOCOCOCOCOCOCOCOCOCOCOCOCOCOCOCOCOCOCOCOCOCOCOCOCOCOCOCOCOCOCOCOCOCOCOCOCOCOCOCOCOCOCOCOCOCOCOCOCOCOCOCOCOCOCOCOCOCOCOCOCOCOCOCOCOCOCOCOCOCOCOCOCOCOCOCO
CTCTCTCTCTCTCTCTCTCTCTCTCTCTCTCTCTCTCTCTCTCTCTCTCTCTCTCTCTCTCTCTCTCTCTCTCTCTCTCTCTCTCTCTCTCTCTCTCTCTCTCTCTCTCTCTCTCTCTCTCTCTCTCTCTCTCTCTCTCTCTCTCTCTCTCTCTCTCTCTCTCTCTCTCTCTCTCTCTCTCTCTCTCTCTCTCTCTCTCTCTCTCTCTCTCTCTCTCTCTCTCTCTCTCTCTCTCTCTCTCTCTCTCTCTCTCTCTCTCTCTCTCTCTCTCTCTCTCTCTCTCTCTCTCTCTCTCTCTCTCTCTCTCTCTCTCTCTCTCTCTCTCTCTCTCTCTCTCTCTCTCTCTCTCTCTCTCTCTCTCTCTCTCTCTCTCTCTCTCTCTCTCTCTCTCTCTCTCTCTCTCTCTCTCTCTCTCTCTCTCTCTCTCTCTCTCTCTCTCTCTCTCTCT
DEDEDEDEDEDEDEDEDEDEDEDEDEDEDEDEDEDEDEDEDEDEDEDEDEDEDEDEDEDEDEDEDEDEDEDEDEDEDEDEDEDEDEDEDEDEDEDEDEDEDEDEDEDEDEDEDEDEDEDEDEDEDEDEDEDEDEDEDEDEDEDEDEDEDEDEDEDEDEDEDEDEDEDEDEDEDEDEDEDEDEDEDEDEDEDEDEDEDEDEDEDEDEDEDEDEDEDEDEDEDEDEDEDEDEDEDEDEDEDEDEDEDEDEDEDEDEDEDEDEDEDEDEDEDEDEDEDEDEDEDEDEDEDEDEDEDEDEDEDEDEDEDEDEDEDEDEDEDEDEDEDEDEDEDEDEDEDEDEDEDEDEDEDEDEDEDEDEDEDEDEDEDEDEDEDEDEDEDEDEDEDEDEDEDEDEDEDEDEDEDEDEDEDEDEDEDEDEDEDEDEDEDEDEDEDEDEDEDEDEDEDEDEDE
DCDCDCDCDCDCDCDCDCDCDCDCDCDCDCDCDCDCDCDCDCDCDCDCDCDCDCDCDCDCDCDCDCDCDCDCDCDCDCDCDCDCDCDCDCDCDCDCDCDCDCDCDCDCDCDCDCDCDCDCDCDCDCDCDCDCDCDCDCDCDCDCDCDCDCDCDCDCDCDCDCDCDCDCDCDCDCDCDCDCDCDCDCDCDCDCDCDCDCDCDCDCDCDCDCDCDCDCDCDCDCDCDCDCDCDCDCDCDCDCDCDCDCDCDCDCDCDCDCDCDCDCDCDCDCDCDCDCDCDCDCDCDCDCDCDCDCDCDCDCDCDCDCDCDCDCDCDCDCDCDCDCDCDCDCDCDCDCDCDCDCDCDCDCDCDCDCDCDCDCDCDCDCDCDCDCDCDCDCDCDCDCDCDCDCDCDCDCDCDCDCDCDCDCDCDCDCDCDCDCDCDCDCDCDCDCDCDCDCDCDCDCDCDC
FLFLFLFLFLFLFLFLFLFLFLFLFLFLFLFLFLFLFLFLFLFLFLFLFLFLFLFLFLFLFLFLFLFLFLFLFLFLFLFLFLFLFLFLFLFLFLFLFLFLFLFLFLFLFLFLFLFLFLFLFLFLFLFLFLFLFLFLFLFLFLFLFLFLFLFLFLFLFLFLFLFLFLFLFLFLFLFLFLFLFLFLFLFLFLFLFLFLFLFLFLFLFLFLFLFLFLFLFLFLFLFLFLFLFLFLFLFLFLFLFLFLFLFLFLFLFLFLFLFLFLFLFLFLFLFLFLFLFLFLFLFLFLFLFLFLFLFLFLFLFLFLFLFLFLFLFLFLFLFLFLFLFLFLFLFLFLFLFLFLFLFLFLFLFLFLFLFLFLFLFLFLFLFLFLFLFLFLFLFLFLFLFLFLFLFLFLFLFLFLFLFLFLFLFLFLFLFLFLFLFLFLFLFLFLFLFLFLFLFLFLFLFLFLGAGAGAGAGAGAGAGAGAGAGAGAGAGAGAGAGAGAGAGAGAGAGAGAGAGAGAGAGAGAGAGAGAGAGAGAGAGAGAGAGAGAGAGAGAGAGAGAGAGAGAGAGAGAGAGAGAGAGAGAGAGAGAGAGAGAGAGAGAGAGAGAGAGAGAGAGAGAGAGAGAGAGAGAGAGAGAGAGAGAGAGAGAGAGAGAGAGAGAGAGAGAGAGAGAGAGAGAGAGAGAGAGAGAGAGAGAGAGAGAGAGAGAGAGAGAGAGAGAGAGAGAGAGAGAGAGAGAGAGAGAGAGAGAGAGAGAGAGAGAGAGAGAGAGAGAGAGAGAGAGAGAGAGAGAGAGAGAGAGAGAGAGAGAGAGAGAGAGAGAGAGAGAGAGAGAGAGAGAGAGAGAGAGAGAGAGAGAGAGAGAGAGAGAGAGAGAGAGAGAGAGAGAGAGAGAGAGAGAGAGAGAGAGA
HIHIHIHIHIHIHIHIHIHIHIHIHIHIHIHIHIHIHIHIHIHIHIHIHIHIHIHIHIHIHIHIHIHIHIHIHIHIHIHIHIHIHIHIHIHIHIHIHIHIHIHIHIHIHIHIHIHIHIHIHIHIHIHIHIHIHIHIHIHIHIHIHIHIHIHIHIHIHIHIHIHIHIHIHIHIHIHIHIHIHIHIHIHIHIHIHIHIHIHIHIHIHIHIHIHIHIHIHIHIHIHIHIHIHIHIHIHIHIHIHIHIHIHIHIHIHIHIHIHIHIHIHIHIHIHIHIHIHIHIHIHIHIHIHIHIHIHIHIHIHIHIHIHIHIHIHIHIHIHIHIHIHIHIHIHIHIHIHIHIHIHIHIHIHIHIHIHIHIHIHIHIHIHIHIHIHIHIHIHIHIHIHIHIHIHIHIHIHIHIHIHIHIHIHIHIHIHIHIHIHIHIHIHIHIHIHIHIHIHIHIHIHIHI
IDIDIDIDIDIDIDIDIDIDIDIDIDIDIDIDIDIDIDIDIDIDIDIDIDIDIDIDIDIDIDIDIDIDIDIDIDIDIDIDIDIDIDIDIDIDIDIDIDIDIDIDIDIDIDIDIDIDIDIDIDIDIDIDIDIDIDIDIDIDIDIDIDIDIDIDIDIDIDIDIDIDIDIDIDIDIDIDIDIDIDIDIDIDIDIDIDIDIDIDIDIDIDIDIDIDIDIDIDIDIDIDIDIDIDIDIDIDIDIDIDIDIDIDIDIDIDIDIDIDIDIDIDIDIDIDIDIDIDIDIDIDIDIDIDIDIDIDIDIDIDIDIDIDIDIDIDIDIDIDIDIDIDIDIDIDIDIDIDIDIDIDIDIDIDIDIDIDIDIDIDIDIDIDIDIDIDIDIDIDIDIDIDIDIDIDIDIDIDIDIDIDIDIDIDIDIDIDIDIDIDIDIDIDIDIDIDIDIDIDIDIDIDID
ILILILILILILILILILILILILILILILILILILILILILILILILILILILILILILILILILILILILILILILILILILILILILILILILILILILILILILILILILILILILILILILILILILILILILILILILILILILILILILILILILILILILILILILILILILILILILILILILILILILILILILILILILILILILILILILILILILILILILILILILILILILILILILILILILILILILILILILILILILILILILILILILILILILILILILILILILILILILILILILILILILILILILILILILILILILILILILILILILILILILILILILILILILILILILILILILILILILILILILILILILILILILILILILILILILILILILILILILILILILILILILILIL
ININININININININININININININININININININININININININININININININININININININININININININININININININININININININININININININININININININININININININININININININININININININININININININININININININININININININININININININININININININININININININININININININININININININININININININININININININININININININININININININININININININININININININININININININININININININININININININININININININININININININININININININININININININININININININININININININ
IAIAIAIAIAIAIAIAIAIAIAIAIAIAIAIAIAIAIAIAIAIAIAIAIAIAIAIAIAIAIAIAIAIAIAIAIAIAIAIAIAIAIAIAIAIAIAIAIAIAIAIAIAIAIAIAIAIAIAIAIAIAIAIAIAIAIAIAIAIAIAIAIAIAIAIAIAIAIAIAIAIAIAIAIAIAIAIAIAIAIAIAIAIAIAIAIAIAIAIAIAIAIAIAIAIAIAIAIAIAIAIAIAIAIAIAIAIAIAIAIAIAIAIAIAIAIAIAIAIAIAIAIAIAIAIAIAIAIAIAIAIAIAIAIAIAIAIAIAIAIAIAIAIAIAIAIAIAIAIAIAIAIAIAIAIAIAIAIAIAIAIAIAIAIAIAIAIAIAIAIAIAIAIAIAIAIAIAIAIAIAIAIAIAIAIAIAIAIAIAIAIAIAIAIAIAIAIAIAIAIAIAIAIAIAIAIAIAIAIAIAIAIAIA
KSKSKSKSKSKSKSKSKSKSKSKSKSKSKSKSKSKSKSKSKSKSKSKSKSKSKSKSKSKSKSKSKSKSKSKSKSKSKSKSKSKSKSKSKSKSKSKSKSKSKSKSKSKSKSKSKSKSKSKSKSKSKSKSKSKSKSKSKSKSKSKSKSKSKSKSKSKSKSKSKSKSKSKSKSKSKSKSKSKSKSKSKSKSKSKSKSKSKSKSKSKSKSKSKSKSKSKSKSKSKSKSKSKSKSKSKSKSKSKSKSKSKSKSKSKSKSKSKSKSKSKSKSKSKSKSKSKSKSKSKSKSKSKSKSKSKSKSKSKSKSKSKSKSKSKSKSKSKSKSKSKSKSKSKSKSKSKSKSKSKSKSKSKSKSKSKSKSKSKSKSKSKSKSKSKSKSKSKSKSKSKSKSKSKSKSKSKSKSKSKSKSKSKSKSKSKSKSKSKSKSKSKSKSKSKSKSKSKSKSKSKSKSKS
KYKYKYKYKYKYKYKYKYKYKYKYKYKYKYKYKYKYKYKYKYKYKYKYKYKYKYKYKYKYKYKYKYKYKYKYKYKYKYKYKYKYKYKYKYKYKYKYKYKYKYKYKYKYKYKYKYKYKYKYKYKYKYKYKYKYKYKYKYKYKYKYKYKYKYKYKYKYKYKYKYKYKYKYKYKYKYKYKYKYKYKYKYKYKYKYKYKYKYKYKYKYKYKYKYKYKYKYKYKYKYKYKYKYKYKYKYKYKYKYKYKYKYKYKYKYKYKYKYKYKYKYKYKYKYKYKYKYKYKYKYKYKYKYKYKYKYKYKYKYKYKYKYKYKYKYKYKYKYKYKYKYKYKYKYKYKYKYKYKYKYKYKYKYKYKYKYKYKYKYKYKYKYKYKYKYKYKYKYKYKYKYKYKYKYKYKYKYKYKYKYKYKYKYKYKYKYKYKYKYKYKYKYKYKYKYKYKYKYKYKYKYKYKY
LALALALALALALALALALALALALALALALALALALALALALALALALALALALALALALALALALALALALALALALALALALALALALALALALALALALALALALALALALALALALALALALALALALALALALALALALALALALALALALALALALALALALALALALALALALALALALALALALALALALALALALALALALALALALALALALALALALALALALALALALALALALALALALALALALALALALALALALALALALALALALALALALALALALALALALALALALALALALALALALALALALALALALALALALALALALALALALALALALALALALALALALALALALALALALALALALALALALALALALALALALALALALALALALALALALALALALALALALALALALALALALALA
MEMEMEMEMEMEMEMEMEMEMEMEMEMEMEMEMEMEMEMEMEMEMEMEMEMEMEMEMEMEMEMEMEMEMEMEMEMEMEMEMEMEMEMEMEMEMEMEMEMEMEMEMEMEMEMEMEMEMEMEMEMEMEMEMEMEMEMEMEMEMEMEMEMEMEMEMEMEMEMEMEMEMEMEMEMEMEMEMEMEMEMEMEMEMEMEMEMEMEMEMEMEMEMEMEMEMEMEMEMEMEMEMEMEMEMEMEMEMEMEMEMEMEMEMEMEMEMEMEMEMEMEMEMEMEMEMEMEMEMEMEMEMEMEMEMEMEMEMEMEMEMEMEMEMEMEMEMEMEMEMEMEMEMEMEMEMEMEMEMEMEMEMEMEMEMEMEMEMEMEMEMEMEMEMEMEMEMEMEMEMEMEMEMEMEMEMEMEMEMEMEMEMEMEMEMEMEMEMEMEMEMEMEMEMEMEMEMEMEMEMEMEMEME
MDMDMDMDMDMDMDMDMDMDMDMDMDMDMDMDMDMDMDMDMDMDMDMDMDMDMDMDMDMDMDMDMDMDMDMDMDMDMDMDMDMDMDMDMDMDMDMDMDMDMDMDMDMDMDMDMDMDMDMDMDMDMDMDMDMDMDMDMDMDMDMDMDMDMDMDMDMDMDMDMDMDMDMDMDMDMDMDMDMDMDMDMDMDMDMDMDMDMDMDMDMDMDMDMDMDMDMDMDMDMDMDMDMDMDMDMDMDMDMDMDMDMDMDMDMDMDMDMDMDMDMDMDMDMDMDMDMDMDMDMDMDMDMDMDMDMDMDMDMDMDMDMDMDMDMDMDMDMDMDMDMDMDMDMDMDMDMDMDMDMDMDMDMDMDMDMDMDMDMDMDMDMDMDMDMDMDMDMDMDMDMDMDMDMDMDMDMDMDMDMDMDMDMDMDMDMDMDMDMDMDMDMDMDMDMDMDMDMDMDMDMDMDMD
MAMAMAMAMAMAMAMAMAMAMAMAMAMAMAMAMAMAMAMAMAMAMAMAMAMAMAMAMAMAMAMAMAMAMAMAMAMAMAMAMAMAMAMAMAMAMAMAMAMAMAMAMAMAMAMAMAMAMAMAMAMAMAMAMAMAMAMAMAMAMAMAMAMAMAMAMAMAMAMAMAMAMAMAMAMAMAMAMAMAMAMAMAMAMAMAMAMAMAMAMAMAMAMAMAMAMAMAMAMAMAMAMAMAMAMAMAMAMAMAMAMAMAMAMAMAMAMAMAMAMAMAMAMAMAMAMAMAMAMAMAMAMAMAMAMAMAMAMAMAMAMAMAMAMAMAMAMAMAMAMAMAMAMAMAMAMAMAMAMAMAMAMAMAMAMAMAMAMAMAMAMAMAMAMAMAMAMAMAMAMAMAMAMAMAMAMAMAMAMAMAMAMAMAMAMAMAMAMAMAMAMAMAMAMAMAMAMAMAMAMAMAMAMAMNMNMNMNMNMNMNMNMNMNMNMNMNMNMNMNMNMNMNMNMNMNMNMNMNMNMNMNMNMNMNMNMNMNMNMNMNMNMNMNMNMNMNMNMNMNMNMNMNMNMNMNMNMNMNMNMNMNMNMNMNMNMNMNMNMNMNMNMNMNMNMNMNMNMNMNMNMNMNMNMNMNMNMNMNMNMNMNMNMNMNMNMNMNMNMNMNMNMNMNMNMNMNMNMNMNMNMNMNMNMNMNMNMNMNMNMNMNMNMNMNMNMNMNMNMNMNMNMNMNMNMNMNMNMNMNMNMNMNMNMNMNMNMNMNMNMNMNMNMNMNMNMNMNMNMNMNMNMNMNMNMNMNMNMNMNMNMNMNMNMNMNMNMNMNMNMNMNMNMNMNMNMNMNMNMNMNMNMNMNMNMNMNMNMNMNMNMNMNMNMNMNMNMNMNMNMNMNMNMNMNMNMNMNMNMNMNMNMNMNMNMNMNMN
MSMSMSMSMSMSMSMSMSMSMSMSMSMSMSMSMSMSMSMSMSMSMSMSMSMSMSMSMSMSMSMSMSMSMSMSMSMSMSMSMSMSMSMSMSMSMSMSMSMSMSMSMSMSMSMSMSMSMSMSMSMSMSMSMSMSMSMSMSMSMSMSMSMSMSMSMSMSMSMSMSMSMSMSMSMSMSMSMSMSMSMSMSMSMSMSMSMSMSMSMSMSMSMSMSMSMSMSMSMSMSMSMSMSMSMSMSMSMSMSMSMSMSMSMSMSMSMSMSMSMSMSMSMSMSMSMSMSMSMSMSMSMSMSMSMSMSMSMSMSMSMSMSMSMSMSMSMSMSMSMSMSMSMSMSMSMSMSMSMSMSMSMSMSMSMSMSMSMSMSMSMSMSMSMSMSMSMSMSMSMSMSMSMSMSMSMSMSMSMSMSMSMSMSMSMSMSMSMSMSMSMSMSMSMSMSMSMSMSMSMSMSMSMS
MOMOMOMOMOMOMOMOMOMOMOMOMOMOMOMOMOMOMOMOMOMOMOMOMOMOMOMOMOMOMOMOMOMOMOMOMOMOMOMOMOMOMOMOMOMOMOMOMOMOMOMOMOMOMOMOMOMOMOMOMOMOMOMOMOMOMOMOMOMOMOMOMOMOMOMOMOMOMOMOMOMOMOMOMOMOMOMOMOMOMOMOMOMOMOMOMOMOMOMOMOMOMOMOMOMOMOMOMOMOMOMOMOMOMOMOMOMOMOMOMOMOMOMOMOMOMOMOMOMOMOMOMOMOMOMOMOMOMOMOMOMOMOMOMOMOMOMOMOMOMOMOMOMOMOMOMOMOMOMOMOMOMOMOMOMOMOMOMOMOMOMOMOMOMOMOMOMOMOMOMOMOMOMOMOMOMOMOMOMOMOMOMOMOMOMOMOMOMOMOMOMOMOMOMOMOMOMOMOMOMOMOMOMOMOMOMOMOMOMOMOMOMOMO
MTMTMTMTMTMTMTMTMTMTMTMTMTMTMTMTMTMTMTMTMTMTMTMTMTMTMTMTMTMTMTMTMTMTMTMTMTMTMTMTMTMTMTMTMTMTMTMTMTMTMTMTMTMTMTMTMTMTMTMTMTMTMTMTMTMTMTMTMTMTMTMTMTMTMTMTMTMTMTMTMTMTMTMTMTMTMTMTMTMTMTMTMTMTMTMTMTMTMTMTMTMTMTMTMTMTMTMTMTMTMTMTMTMTMTMTMTMTMTMTMTMTMTMTMTMTMTMTMTMTMTMTMTMTMTMTMTMTMTMTMTMTMTMTMTMTMTMTMTMTMTMTMTMTMTMTMTMTMTMTMTMTMTMTMTMTMTMTMTMTMTMTMTMTMTMTMTMTMTMTMTMTMTMTMTMTMTMTMTMTMTMTMTMTMTMTMTMTMTMTMTMTMTMTMTMTMTMTMTMTMTMTMTMTMTMTMTMTMTMTMTMTMTMT
NENENENENENENENENENENENENENENENENENENENENENENENENENENENENENENENENENENENENENENENENENENENENENENENENENENENENENENENENENENENENENENENENENENENENENENENENENENENENENENENENENENENENENENENENENENENENENENENENENENENENENENENENENENENENENENENENENENENENENENENENENENENENENENENENENENENENENENENENENENENENENENENENENENENENENENENENENENENENENENENENENENENENENENENENENENENENENENENENENENENENENENENENENENENENENENENENENENENENENENENENENENENENENENENENENENENENENENENENENENENENENENENE
NVNVNVNVNVNVNVNVNVNVNVNVNVNVNVNVNVNVNVNVNVNVNVNVNVNVNVNVNVNVNVNVNVNVNVNVNVNVNVNVNVNVNVNVNVNVNVNVNVNVNVNVNVNVNVNVNVNVNVNVNVNVNVNVNVNVNVNVNVNVNVNVNVNVNVNVNVNVNVNVNVNVNVNVNVNVNVNVNVNVNVNVNVNVNVNVNVNVNVNVNVNVNVNVNVNVNVNVNVNVNVNVNVNVNVNVNVNVNVNVNVNVNVNVNVNVNVNVNVNVNVNVNVNVNVNVNVNVNVNVNVNVNVNVNVNVNVNVNVNVNVNVNVNVNVNVNVNVNVNVNVNVNVNVNVNVNVNVNVNVNVNVNVNVNVNVNVNVNVNVNVNVNVNVNVNVNVNVNVNVNVNVNVNVNVNVNVNVNVNVNVNVNVNVNVNVNVNVNVNVNVNVNVNVNVNVNVNVNVNVNVNVNVNV
NHNHNHNHNHNHNHNHNHNHNHNHNHNHNHNHNHNHNHNHNHNHNHNHNHNHNHNHNHNHNHNHNHNHNHNHNHNHNHNHNHNHNHNHNHNHNHNHNHNHNHNHNHNHNHNHNHNHNHNHNHNHNHNHNHNHNHNHNHNHNHNHNHNHNHNHNHNHNHNHNHNHNHNHNHNHNHNHNHNHNHNHNHNHNHNHNHNHNHNHNHNHNHNHNHNHNHNHNHNHNHNHNHNHNHNHNHNHNHNHNHNHNHNHNHNHNHNHNHNHNHNHNHNHNHNHNHNHNHNHNHNHNHNHNHNHNHNHNHNHNHNHNHNHNHNHNHNHNHNHNHNHNHNHNHNHNHNHNHNHNHNHNHNHNHNHNHNHNHNHNHNHNHNHNHNHNHNHNHNHNHNHNHNHNHNHNHNHNHNHNHNHNHNHNHNHNHNHNHNHNHNHNHNHNHNHNHNHNHNHNHNHNHNH
NJNJNJNJNJNJNJNJNJNJNJNJNJNJNJNJNJNJNJNJNJNJNJNJNJNJNJNJNJNJNJNJNJNJNJNJNJNJNJNJNJNJNJNJNJNJNJNJNJNJNJNJNJNJNJNJNJNJNJNJNJNJNJNJNJNJNJNJNJNJNJNJNJNJNJNJNJNJNJNJNJNJNJNJNJNJNJNJNJNJNJNJNJNJNJNJNJNJNJNJNJNJNJNJNJNJNJNJNJNJNJNJNJNJNJNJNJNJNJNJNJNJNJNJNJNJNJNJNJNJNJNJNJNJNJNJNJNJNJNJNJNJNJNJNJNJNJNJNJNJNJNJNJNJNJNJNJNJNJNJNJNJNJNJNJNJNJNJNJNJNJNJNJNJNJNJNJNJNJNJNJNJNJNJNJNJNJNJNJNJNJNJNJNJNJNJNJNJNJNJNJNJNJNJNJNJNJNJNJNJNJNJNJNJNJNJNJNJNJNJNJNJNJNJ
NMNMNMNMNMNMNMNMNMNMNMNMNMNMNMNMNMNMNMNMNMNMNMNMNMNMNMNMNMNMNMNMNMNMNMNMNMNMNMNMNMNMNMNMNMNMNMNMNMNMNMNMNMNMNMNMNMNMNMNMNMNMNMNMNMNMNMNMNMNMNMNMNMNMNMNMNMNMNMNMNMNMNMNMNMNMNMNMNMNMNMNMNMNMNMNMNMNMNMNMNMNMNMNMNMNMNMNMNMNMNMNMNMNMNMNMNMNMNMNMNMNMNMNMNMNMNMNMNMNMNMNMNMNMNMNMNMNMNMNMNMNMNMNMNMNMNMNMNMNMNMNMNMNMNMNMNMNMNMNMNMNMNMNMNMNMNMNMNMNMNMNMNMNMNMNMNMNMNMNMNMNMNMNMNMNMNMNMNMNMNMNMNMNMNMNMNMNMNMNMNMNMNMNMNMNMNMNMNMNMNMNMNMNMNMNMNMNMNMNMNMNMNMNM
NYNYNYNYNYNYNYNYNYNYNYNYNYNYNYNYNYNYNYNYNYNYNYNYNYNYNYNYNYNYNYNYNYNYNYNYNYNYNYNYNYNYNYNYNYNYNYNYNYNYNYNYNYNYNYNYNYNYNYNYNYNYNYNYNYNYNYNYNYNYNYNYNYNYNYNYNYNYNYNYNYNYNYNYNYNYNYNYNYNYNYNYNYNYNYNYNYNYNYNYNYNYNYNYNYNYNYNYNYNYNYNYNYNYNYNYNYNYNYNYNYNYNYNYNYNYNYNYNYNYNYNYNYNYNYNYNYNYNYNYNYNYNYNYNYNYNYNYNYNYNYNYNYNYNYNYNYNYNYNYNYNYNYNYNYNYNYNYNYNYNYNYNYNYNYNYNYNYNYNYNYNYNYNYNYNYNYNYNYNYNYNYNYNYNYNYNYNYNYNYNYNYNYNYNYNYNYNYNYNYNYNYNYNYNYNYNYNYNYNYNYNYNYNY
NCNCNCNCNCNCNCNCNCNCNCNCNCNCNCNCNCNCNCNCNCNCNCNCNCNCNCNCNCNCNCNCNCNCNCNCNCNCNCNCNCNCNCNCNCNCNCNCNCNCNCNCNCNCNCNCNCNCNCNCNCNCNCNCNCNCNCNCNCNCNCNCNCNCNCNCNCNCNCNCNCNCNCNCNCNCNCNCNCNCNCNCNCNCNCNCNCNCNCNCNCNCNCNCNCNCNCNCNCNCNCNCNCNCNCNCNCNCNCNCNCNCNCNCNCNCNCNCNCNCNCNCNCNCNCNCNCNCNCNCNCNCNCNCNCNCNCNCNCNCNCNCNCNCNCNCNCNCNCNCNCNCNCNCNCNCNCNCNCNCNCNCNCNCNCNCNCNCNCNCNCNCNCNCNCNCNCNCNCNCNCNCNCNCNCNCNCNCNCNCNCNCNCNCNCNCNCNCNCNCNCNCNCNCNCNCNCNCNCNCNCNCNCNC
NDNDNDNDNDNDNDNDNDNDNDNDNDNDNDNDNDNDNDNDNDNDNDNDNDNDNDNDNDNDNDNDNDNDNDNDNDNDNDNDNDNDNDNDNDNDNDNDNDNDNDNDNDNDNDNDNDNDNDNDNDNDNDNDNDNDNDNDNDNDNDNDNDNDNDNDNDNDNDNDNDNDNDNDNDNDNDNDNDNDNDNDNDNDNDNDNDNDNDNDNDNDNDNDNDNDNDNDNDNDNDNDNDNDNDNDNDNDNDNDNDNDNDNDNDNDNDNDNDNDNDNDNDNDNDNDNDNDNDNDNDNDNDNDNDNDNDNDNDNDNDNDNDNDNDNDNDNDNDNDNDNDNDNDNDNDNDNDNDNDNDNDNDNDNDNDNDNDNDNDNDNDNDNDNDNDNDNDNDNDNDNDNDNDNDNDNDNDNDNDNDNDNDNDNDNDNDNDNDNDNDNDNDNDNDNDNDNDNDNDNDNDNDND
OHOHOHOHOHOHOHOHOHOHOHOHOHOHOHOHOHOHOHOHOHOHOHOHOHOHOHOHOHOHOHOHOHOHOHOHOHOHOHOHOHOHOHOHOHOHOHOHOHOHOHOHOHOHOHOHOHOHOHOHOHOHOHOHOHOHOHOHOHOHOHOHOHOHOHOHOHOHOHOHOHOHOHOHOHOHOHOHOHOHOHOHOHOHOHOHOHOHOHOHOHOHOHOHOHOHOHOHOHOHOHOHOHOHOHOHOHOHOHOHOHOHOHOHOHOHOHOHOHOHOHOHOHOHOHOHOHOHOHOHOHOHOHOHOHOHOHOHOHOHOHOHOHOHOHOHOHOHOHOHOHOHOHOHOHOHOHOHOHOHOHOHOHOHOHOHOHOHOHOHOHOHOHOHOHOHOHOHOHOHOHOHOHOHOHOHOHOHOHOHOHOHOHOHOHOHOHOHOHOHOHOHOHOHOHOHOHOHOHOHOHOHOHOH
OKOKOKOKOKOKOKOKOKOKOKOKOKOKOKOKOKOKOKOKOKOKOKOKOKOKOKOKOKOKOKOKOKOKOKOKOKOKOKOKOKOKOKOKOKOKOKOKOKOKOKOKOKOKOKOKOKOKOKOKOKOKOKOKOKOKOKOKOKOKOKOKOKOKOKOKOKOKOKOKOKOKOKOKOKOKOKOKOKOKOKOKOKOKOKOKOKOKOKOKOKOKOKOKOKOKOKOKOKOKOKOKOKOKOKOKOKOKOKOKOKOKOKOKOKOKOKOKOKOKOKOKOKOKOKOKOKOKOKOKOKOKOKOKOKOKOKOKOKOKOKOKOKOKOKOKOKOKOKOKOKOKOKOKOKOKOKOKOKOKOKOKOKOKOKOKOKOKOKOKOKOKOKOKOKOKOKOKOKOKOKOKOKOKOKOKOKOKOKOKOKOKOKOKOKOKOKOKOKOKOKOKOKOKOKOKOKOKOKOKOKOKOKOKOROROROROROROROROROROROROROROROROROROROROROROROROROROROROROROROROROROROROROROROROROROROROROROROROROROROROROROROROROROROROROROROROROROROROROROROROROROROROROROROROROROROROROROROROROROROROROROROROROROROROROROROROROROROROROROROROROROROROROROROROROROROROROROROROROROROROROROROROROROROROROROROROROROROROROROROROROROROROROROROROROROROROROROROROROROROROROROROROROROROROROROROROROROROROROROROROROROROROROROROROROROROROROROROROROROROROROROROROROROROROROROROR
PAPAPAPAPAPAPAPAPAPAPAPAPAPAPAPAPAPAPAPAPAPAPAPAPAPAPAPAPAPAPAPAPAPAPAPAPAPAPAPAPAPAPAPAPAPAPAPAPAPAPAPAPAPAPAPAPAPAPAPAPAPAPAPAPAPAPAPAPAPAPAPAPAPAPAPAPAPAPAPAPAPAPAPAPAPAPAPAPAPAPAPAPAPAPAPAPAPAPAPAPAPAPAPAPAPAPAPAPAPAPAPAPAPAPAPAPAPAPAPAPAPAPAPAPAPAPAPAPAPAPAPAPAPAPAPAPAPAPAPAPAPAPAPAPAPAPAPAPAPAPAPAPAPAPAPAPAPAPAPAPAPAPAPAPAPAPAPAPAPAPAPAPAPAPAPAPAPAPAPAPAPAPAPAPAPAPAPAPAPAPAPAPAPAPAPAPAPAPAPAPAPAPAPAPAPAPAPAPAPAPAPAPAPAPAPAPAPAPAPAPAPAPAPA
RIRIRIRIRIRIRIRIRIRIRIRIRIRIRIRIRIRIRIRIRIRIRIRIRIRIRIRIRIRIRIRIRIRIRIRIRIRIRIRIRIRIRIRIRIRIRIRIRIRIRIRIRIRIRIRIRIRIRIRIRIRIRIRIRIRIRIRIRIRIRIRIRIRIRIRIRIRIRIRIRIRIRIRIRIRIRIRIRIRIRIRIRIRIRIRIRIRIRIRIRIRIRIRIRIRIRIRIRIRIRIRIRIRIRIRIRIRIRIRIRIRIRIRIRIRIRIRIRIRIRIRIRIRIRIRIRIRIRIRIRIRIRIRIRIRIRIRIRIRIRIRIRIRIRIRIRIRIRIRIRIRIRIRIRIRIRIRIRIRIRIRIRIRIRIRIRIRIRIRIRIRIRIRIRIRIRIRIRIRIRIRIRIRIRIRIRIRIRIRIRIRIRIRIRIRIRIRIRIRIRIRIRIRIRIRIRIRIRIRIRIRIRIRI
SCSCSCSCSCSCSCSCSCSCSCSCSCSCSCSCSCSCSCSCSCSCSCSCSCSCSCSCSCSCSCSCSCSCSCSCSCSCSCSCSCSCSCSCSCSCSCSCSCSCSCSCSCSCSCSCSCSCSCSCSCSCSCSCSCSCSCSCSCSCSCSCSCSCSCSCSCSCSCSCSCSCSCSCSCSCSCSCSCSCSCSCSCSCSCSCSCSCSCSCSCSCSCSCSCSCSCSCSCSCSCSCSCSCSCSCSCSCSCSCSCSCSCSCSCSCSCSCSCSCSCSCSCSCSCSCSCSCSCSCSCSCSCSCSCSCSCSCSCSCSCSCSCSCSCSCSCSCSCSCSCSCSCSCSCSCSCSCSCSCSCSCSCSCSCSCSCSCSCSCSCSCSCSCSCSCSCSCSCSCSCSCSCSCSCSCSCSCSCSCSCSCSCSCSCSCSCSCSCSCSCSCSCSCSCSCSCSCSCSCSCSCSCSC
SDSDSDSDSDSDSDSDSDSDSDSDSDSDSDSDSDSDSDSDSDSDSDSDSDSDSDSDSDSDSDSDSDSDSDSDSDSDSDSDSDSDSDSDSDSDSDSDSDSDSDSDSDSDSDSDSDSDSDSDSDSDSDSDSDSDSDSDSDSDSDSDSDSDSDSDSDSDSDSDSDSDSDSDSDSDSDSDSDSDSDSDSDSDSDSDSDSDSDSDSDSDSDSDSDSDSDSDSDSDSDSDSDSDSDSDSDSDSDSDSDSDSDSDSDSDSDSDSDSDSDSDSDSDSDSDSDSDSDSDSDSDSDSDSDSDSDSDSDSDSDSDSDSDSDSDSDSDSDSDSDSDSDSDSDSDSDSDSDSDSDSDSDSDSDSDSDSDSDSDSDSDSDSDSDSDSDSDSDSDSDSDSDSDSDSDSDSDSDSDSDSDSDSDSDSDSDSDSDSDSDSDSDSDSDSDSDSDSDSDSDSDSDSD
TNTNTNTNTNTNTNTNTNTNTNTNTNTNTNTNTNTNTNTNTNTNTNTNTNTNTNTNTNTNTNTNTNTNTNTNTNTNTNTNTNTNTNTNTNTNTNTNTNTNTNTNTNTNTNTNTNTNTNTNTNTNTNTNTNTNTNTNTNTNTNTNTNTNTNTNTNTNTNTNTNTNTNTNTNTNTNTNTNTNTNTNTNTNTNTNTNTNTNTNTNTNTNTNTNTNTNTNTNTNTNTNTNTNTNTNTNTNTNTNTNTNTNTNTNTNTNTNTNTNTNTNTNTNTNTNTNTNTNTNTNTNTNTNTNTNTNTNTNTNTNTNTNTNTNTNTNTNTNTNTNTNTNTNTNTNTNTNTNTNTNTNTNTNTNTNTNTNTNTNTNTNTNTNTNTNTNTNTNTNTNTNTNTNTNTNTNTNTNTNTNTNTNTNTNTNTNTNTNTNTNTNTNTNTNTNTNTNTNTNTNTNTNTN
TXTXTXTXTXTXTXTXTXTXTXTXTXTXTXTXTXTXTXTXTXTXTXTXTXTXTXTXTXTXTXTXTXTXTXTXTXTXTXTXTXTXTXTXTXTXTXTXTXTXTXTXTXTXTXTXTXTXTXTXTXTXTXTXTXTXTXTXTXTXTXTXTXTXTXTXTXTXTXTXTXTXTXTXTXTXTXTXTXTXTXTXTXTXTXTXTXTXTXTXTXTXTXTXTXTXTXTXTXTXTXTXTXTXTXTXTXTXTXTXTXTXTXTXTXTXTXTXTXTXTXTXTXTXTXTXTXTXTXTXTXTXTXTXTXTXTXTXTXTXTXTXTXTXTXTXTXTXTXTXTXTXTXTXTXTXTXTXTXTXTXTXTXTXTXTXTXTXTXTXTXTXTXTXTXTXTXTXTXTXTXTXTXTXTXTXTXTXTXTXTXTXTXTXTXTXTXTXTXTXTXTXTXTXTXTXTXTXTXTXTXTXTXTX
UTUTUTUTUTUTUTUTUTUTUTUTUTUTUTUTUTUTUTUTUTUTUTUTUTUTUTUTUTUTUTUTUTUTUTUTUTUTUTUTUTUTUTUTUTUTUTUTUTUTUTUTUTUTUTUTUTUTUTUTUTUTUTUTUTUTUTUTUTUTUTUTUTUTUTUTUTUTUTUTUTUTUTUTUTUTUTUTUTUTUTUTUTUTUTUTUTUTUTUTUTUTUTUTUTUTUTUTUTUTUTUTUTUTUTUTUTUTUTUTUTUTUTUTUTUTUTUTUTUTUTUTUTUTUTUTUTUTUTUTUTUTUTUTUTUTUTUTUTUTUTUTUTUTUTUTUTUTUTUTUTUTUTUTUTUTUTUTUTUTUTUTUTUTUTUTUTUTUTUTUTUTUTUTUTUTUTUTUTUTUTUTUTUTUTUTUTUTUTUTUTUTUTUTUTUTUTUTUTUTUTUTUTUTUTUTUTUTUTUTUTUTUTUT
VTVTVTVTVTVTVTVTVTVTVTVTVTVTVTVTVTVTVTVTVTVTVTVTVTVTVTVTVTVTVTVTVTVTVTVTVTVTVTVTVTVTVTVTVTVTVTVTVTVTVTVTVTVTVTVTVTVTVTVTVTVTVTVTVTVTVTVTVTVTVTVTVTVTVTVTVTVTVTVTVTVTVTVTVTVTVTVTVTVTVTVTVTVTVTVTVTVTVTVTVTVTVTVTVTVTVTVTVTVTVTVTVTVTVTVTVTVTVTVTVTVTVTVTVTVTVTVTVTVTVTVTVTVTVTVTVTVTVTVTVTVTVTVTVTVTVTVTVTVTVTVTVTVTVTVTVTVTVTVTVTVTVTVTVTVTVTVTVTVTVTVTVTVTVTVTVTVTVTVTVTVTVTVTVTVTVTVTVTVTVTVTVTVTVTVTVTVTVTVTVTVTVTVTVTVTVTVTVTVTVTVTVTVTVTVTVTVTVTVTVTVTVTVT
VAVAVAVAVAVAVAVAVAVAVAVAVAVAVAVAVAVAVAVAVAVAVAVAVAVAVAVAVAVAVAVAVAVAVAVAVAVAVAVAVAVAVAVAVAVAVAVAVAVAVAVAVAVAVAVAVAVAVAVAVAVAVAVAVAVAVAVAVAVAVAVAVAVAVAVAVAVAVAVAVAVAVAVAVAVAVAVAVAVAVAVAVAVAVAVAVAVAVAVAVAVAVAVAVAVAVAVAVAVAVAVAVAVAVAVAVAVAVAVAVAVAVAVAVAVAVAVAVAVAVAVAVAVAVAVAVAVAVAVAVAVAVAVAVAVAVAVAVAVAVAVAVAVAVAVAVAVAVAVAVAVAVAVAVAVAVAVAVAVAVAVAVAVAVAVAVAVAVAVAVAVAVAVAVAVAVAVAVAVAVAVAVAVAVAVAVAVAVAVAVAVAVAVAVAVAVAVAVAVAVAVAVAVAVAVAVAVAVAVAVAVAVAVA
WAWAWAWAWAWAWAWAWAWAWAWAWAWAWAWAWAWAWAWAWAWAWAWAWAWAWAWAWAWAWAWAWAWAWAWAWAWAWAWAWAWAWAWAWAWAWAWAWAWAWAWAWAWAWAWAWAWAWAWAWAWAWAWAWAWAWAWAWAWAWAWAWAWAWAWAWAWAWAWAWAWAWAWAWAWAWAWAWAWAWAWAWAWAWAWAWAWAWAWAWAWAWAWAWAWAWAWAWAWAWAWAWAWAWAWAWAWAWAWAWAWAWAWAWAWAWAWAWAWAWAWAWAWAWAWAWAWAWAWAWAWAWAWAWAWAWAWAWAWAWAWAWAWAWAWAWAWAWAWAWAWAWAWAWAWAWAWAWAWAWAWAWAWAWAWAWAWAWAWAWAWAWAWAWAWAWAWAWAWAWAWAWAWAWAWAWAWAWAWAWAWAWAWAWAWAWAWAWAWAWAWAWAWAWAWAWAWAWAWAWAWAWAWA
WVWVWVWVWVWVWVWVWVWVWVWVWVWVWVWVWVWVWVWVWVWVWVWVWVWVWVWVWVWVWVWVWVWVWVWVWVWVWVWVWVWVWVWVWVWVWVWVWVWVWVWVWVWVWVWVWVWVWVWVWVWVWVWVWVWVWVWVWVWVWVWVWVWVWVWVWVWVWVWVWVWVWVWVWVWVWVWVWVWVWVWVWVWVWVWVWVWVWVWVWVWVWVWVWVWVWVWVWVWVWVWVWVWVWVWVWVWVWVWVWVWVWVWVWVWVWVWVWVWVWVWVWVWVWVWVWVWVWVWVWVWVWVWVWVWVWVWVWVWVWVWVWVWVWVWVWVWVWVWVWVWVWVWVWVWVWVWVWVWVWVWVWVWVWVWVWVWVWVWVWVWVWVWVWVWVWVWVWVWVWVWVWVWVWVWVWVWVWVWVWVWVWVWVWVWVWVWVWVWVWVWVWVWVWVWVWVWVWVWVWVWVWVWV
WIWIWIWIWIWIWIWIWIWIWIWIWIWIWIWIWIWIWIWIWIWIWIWIWIWIWIWIWIWIWIWIWIWIWIWIWIWIWIWIWIWIWIWIWIWIWIWIWIWIWIWIWIWIWIWIWIWIWIWIWIWIWIWIWIWIWIWIWIWIWIWIWIWIWIWIWIWIWIWIWIWIWIWIWIWIWIWIWIWIWIWIWIWIWIWIWIWIWIWIWIWIWIWIWIWIWIWIWIWIWIWIWIWIWIWIWIWIWIWIWIWIWIWIWIWIWIWIWIWIWIWIWIWIWIWIWIWIWIWIWIWIWIWIWIWIWIWIWIWIWIWIWIWIWIWIWIWIWIWIWIWIWIWIWIWIWIWIWIWIWIWIWIWIWIWIWIWIWIWIWIWIWIWIWIWIWIWIWIWIWIWIWIWIWIWIWIWIWIWIWIWIWIWIWIWIWIWIWIWIWIWIWIWIWIWIWIWIWIWIWIWIWIWI
WYWYWYWYWYWYWYWYWYWYWYWYWYWYWYWYWYWYWYWYWYWYWYWYWYWYWYWYWYWYWYWYWYWYWYWYWYWYWYWYWYWYWYWYWYWYWYWYWYWYWYWYWYWYWYWYWYWYWYWYWYWYWYWYWYWYWYWYWYWYWYWYWYWYWYWYWYWYWYWYWYWYWYWYWYWYWYWYWYWYWYWYWYWYWYWYWYWYWYWYWYWYWYWYWYWYWYWYWYWYWYWYWYWYWYWYWYWYWYWYWYWYWYWYWYWYWYWYWYWYWYWYWYWYWYWYWYWYWYWYWYWYWYWYWYWYWYWYWYWYWYWYWYWYWYWYWYWYWYWYWYWYWYWYWYWYWYWYWYWYWYWYWYWYWYWYWYWYWYWYWYWYWYWYWYWYWYWYWYWYWYWYWYWYWYWYWYWYWYWYWYWYWYWYWYWYWYWYWYWYWYWYWYWYWYWYWYWYWYWYWYWYWYWY

BIBLIOGRAPHY Ayers, B., C. Cloyd and J. Robinson (1996), “Organizational Form and Taxes: An Empirical Analysis of Small Businesses” Journal of the American Tax Association Supplement 18: 49-67. Ballard, C., J. Shoven and J. Whalley (1985), "The Total Welfare Cost of the United States Tax System: A General Equilibrium Approach" National Tax Journal 38(2) pp. 125-140. Carroll, R. and D. Joulfaian (1997), "Taxes and Corporate Choice of Organizational Form," U.S. Department of the Treasury, Office of Tax Analysis Working Paper 73, October. Feldstein, M., J. Dicks-Mireaux and J. Poterba (1983), "The Effective Tax Rate and the Pretax Rate of Return," Journal of Public Economics v. 21, pp. 129-158. Fullerton, D and D. Rogers (1993), Who Bears the Lifetime Tax Burden. Brookings, Wash. D.C. Gentry, W. (1994), “Taxes, Financial Decisions and Organizational Form: Evidence from Publicly Traded Partnerships” Journal of Public Economics v33 #2 pp. 223-244.
Goolsbee, Austan (1998), "Taxes, Organizational Form and the Deadweight Loss of the Corporate Income Tax," Journal of Public Economics, vol.69, July: 143-152.
Goolsbee, A. and E. Maydew (2000), "Coveting Thy Neighbor's Manufacturing: The Dilemma of State Income Apportionment," Journal of Public Economics, January, vol. 75(1): 125-143. Gordon, R. and J. Mackie-Mason (1990), "Effects of the Tax Reform Act of 1986 on Corporate Financial Policy and Organizational Form" pp. 91-131 in J. Slemrod, ed. Do Taxes Matter, MIT Press, Cambridge, Mass. Gordon, R. and J. Mackie-Mason (1994), "Tax Distortions to the Choice of Organizational Form" Journal of Public Economics v. 55, pp. 279-306. Gordon, R. and J. Mackie-Mason (1997), "Taxes and the Choice of Organizational Form" Journal of Finance. Gordon, R. and R. Wilson (1986), “An Examination of Multijurisdictional Corporate Income Taxation Under Formula Apportionment,” Econometrica 54(6), pp. 1357-73. Gravelle, J. and L. Kotlikoff (1988), "Does the Harberger Model Greatly Understate the Excess Burden of the Corporate Income Tax?" NBER Working Paper # 2742. Gravelle, J. and L. Kotlikoff (1989), "The Incidence and Efficiency Costs of Corporate Taxation When Corporate and Noncorporate Firms Produce the Same Good" Journal of Political Economy 97(4) pp. 749-780.

Gravelle, J. and L. Kotlikoff (1993), "Corporate Tax Incidence and Inefficiency When Corporate and Noncorporate Goods are Close Substitutes," Economic Inquiry Guenther, D. (1992), "Taxes and Organizational Form: A Comparison of Corporations and Master Limited Partnerships," The Accounting Review 67 (January): 17-45. Harberger, A. (1966), "Efficiency Effects of Taxes on Income from Capital" pp. 107-117 in M. Krzyzaniak Effects of the Corporation Income Tax. Wayne State University Press; Detroit. Levin, Jonathan and Steven Tadellis (2002), “A Theory of Partnerships,” Mimeo, Stanford University, April. Omer, T., G. Plesko, and M. Shelley (2000), "The Influence of Tax Costs on Organizational Choice in the Natural Resource Industry," Journal of the American Tax Association, 22(1), Spring: 38-55. Plesko, G. (1995), "The Role of Taxes in Organizational Choice: S Conversions After the Tax Reform Act of 1986," mimeo, M.I.T. Sloan School Scholes, M. and M. Wolfson (1990), "The Effects of Changes in Tax Laws on Corporate Reorganization Activity" Journal of Business 63(1) pp. pp. S141-S164. Scholes, M. and M. Wolfson (1991), "The Role of Tax Rules in the Recent Restructuring of U.S. Corporations" pp. 1-25 in D. Bradford ed. Tax Policy and the Economy v 5. Scholes, M., M. Wolfson, M. Erickson, E. Maydew, and T. Shevlin (2002), Taxes and Business Strategy: A Planning Approach. Englewood Cliffs: Prentice-Hall. Shoven, J. (1976), "The Incidence and Efficiency Effects of Taxes on Income from Capital" Journal of Political Economy December, pp. 1241-1283.