
Compagnie des Boissons Gazeuses_CBGS_ppt_Stage technique(nidbelkacem cbgs)
Upload
lauren-warrenCategory
view
216download
1
The ICPD Programme of Action The ICPD Programme of Action and International Migration at and International Migration at the Start of the 21st Centurythe Start of the 21st Century
Ronald C. Schoenmaeckers, Ph.D.
Scientific Director CBGS
CBGS - Population and Family Study Centre (Flemish Community, Belgium)
The objective of this presentation is to give a statistical overview on
international migration
… in not more than 20 minutes.
CBGS

“Everyone has the right to freedom of movement and residence within the borders of each state.”
“Everyone has the right to leave any country, including his own, and to return to his country.”
Article 13, Universal Declaration of Human Rights, adopted and proclaimed by the General Assembly of the UN on 10
December, 1948
CBGS

(a) To address the root causes of migration, especially those related to poverty;
(b) To encourage more co-operation and dialogue between countries of origin and countries of destination in order to maximise the benefits of migration to those concerned and increase the likelihood that migration has positive consequences for the development of both sending and receiving countries;
(c) To facilitate the reintegration process of returning migrants.
CBGS
As ‘objectives’, the PoA states (para 10.2):
(a) “Governments of countries of origin and of countries of destination should seek to make the option of remaining in one’s country viable for all people. To that end, efforts to achieve sustainable economic and social development, ensuring a better economic balance between developed and developing countries and countries with economies in transition should be strengthened” (para 10.3);
(b) “Governments of countries of destination are invited to consider the use of certain forms of temporary migration, such as short-term and project-related migrations, as a means of improving the skills of nationals of countries of origin, especially developing countries and countries with economies in transition” (para 10.5).
CBGS
As part of the list of ‘actions’ to be taken, the PoA mentions, among others:

CBGS
Trend in total migrant stock (millions), 1960-2005
By major area
0
50
100
150
200
1960
1965
1970
1975
1980
1985
1990
1995
2000
2005

CBGS
Trend in total migrant stock (millions), 1960-2005
By major area
0
50
100
150
200
1960
1965
1970
1975
1980
1985
1990
1995
2000
2005
LDR
MDR
190m
75m

CBGS
Trend in total migrant stock (millions), 1960-2005
By major area
0
50
100
150
200
1960
1965
1970
1975
1980
1985
1990
1995
2000
2005
LDR
MDR
190m
75m
• A nearly threefold increase over last 45 years
• About 63% of all migrants worldwide are in More Developed Countries

CBGS
Trend in total migrant stock (millions), 1960-2005
By major region
0
10
20
30
40
50
1960
1965
1970
1975
1980
1985
1990
1995
2000
2005

CBGS
Trend in total migrant stock (millions), 1960-2005
By major region
0
10
20
30
40
50
1960
1965
1970
1975
1980
1985
1990
1995
2000
2005
Asia

CBGS
Trend in total migrant stock (millions), 1960-2005
By major region
0
10
20
30
40
50
1960
1965
1970
1975
1980
1985
1990
1995
2000
2005
Europe
Asia

CBGS
Trend in total migrant stock (millions), 1960-2005
By major region
0
10
20
30
40
50
1960
1965
1970
1975
1980
1985
1990
1995
2000
2005
N.America
Europe
Asia

CBGS
Trend in total migrant stock (millions), 1960-2005
By major region
0
10
20
30
40
50
1960
1965
1970
1975
1980
1985
1990
1995
2000
2005
Africa
N.America
Europe
Asia

CBGS
Trend in total migrant stock (millions), 1960-2005
By major region
0
10
20
30
40
50
1960
1965
1970
1975
1980
1985
1990
1995
2000
2005
L.America
Africa
N.America
Europe
Asia

CBGS
Trend in total migrant stock (millions), 1960-2005
By major region
0
10
20
30
40
50
1960
1965
1970
1975
1980
1985
1990
1995
2000
2005
Asia
Europe
N.America
Africa
L.America
Oceania

CBGS
Trend in total migrant stock (millions), 1960-2005
By major region
0
10
20
30
40
50
1960
1965
1970
1975
1980
1985
1990
1995
2000
2005
Asia
Europe
N.America
Africa
L.America
Oceania
• Important differences between regions
• Largest relative increases are observed for Europe and Northern America

CBGS
Trend in total migrant stock (millions), 1960-2005
As percentage of the population
0%
5%
10%
15%
20%
1960
1965
1970
1975
1980
1985
1990
1995
2000
2005
World average
2.5% 3.0%

CBGS
Trend in total migrant stock (millions), 1960-2005
As percentage of the population
By major region
0%
5%
10%
15%
20%
1960
1965
1970
1975
1980
1985
1990
1995
2000
2005
Oceania (>15%)
N.America (13%)
Europe (8%)

CBGS
Trend in total migrant stock (millions), 1960-2005
Share of female migrants
42%
45%
48%
51%
54%
1960
1965
1970
1975
1980
1985
1990
1995
2000
2005
World average
47%
50%

CBGS
Trend in total migrant stock (millions), 1960-2005
Share of female migrants
By major region
42%
45%
48%
51%
54%
1960
1965
1970
1975
1980
1985
1990
1995
2000
2005
Africa
N.America
Asia

CBGS
Trend in total migrant stock (millions), 1960-2005
Share of female migrants
By major region
42%
45%
48%
51%
54%
1960
1965
1970
1975
1980
1985
1990
1995
2000
2005
Africa
N.America• In Northern America (and since shortly
also in Europe, Oceania, and Latin America) about 51% of migrants are women
• Sharp increase in the number of female migrants in Africa (while decline in Asia)
Asia

CBGS
Trend in total migrant stock (millions), 1960-2005
Share of refugees
0%
8%
16%
24%
32%
1960
1965
1970
1975
1980
1985
1990
1995
2000
2005
World average
12%(1990)
7%

CBGS
Trend in total migrant stock (millions), 1960-2005
Share of refugees
0%
8%
16%
24%
32%
1960
1965
1970
1975
1980
1985
1990
1995
2000
2005
World average
12%(1990)
7%
• Erratic pattern
• Number of refugees is function of conflict
• The latter becomes especially obvious when looking at the numbers by region

CBGS
Trend in total migrant stock (millions), 1960-2005
Share of refugees
By major region
0%
8%
16%
24%
32%
1960
1965
1970
1975
1980
1985
1990
1995
2000
2005
Africa
33% 36%
Asia
L.America

CBGS
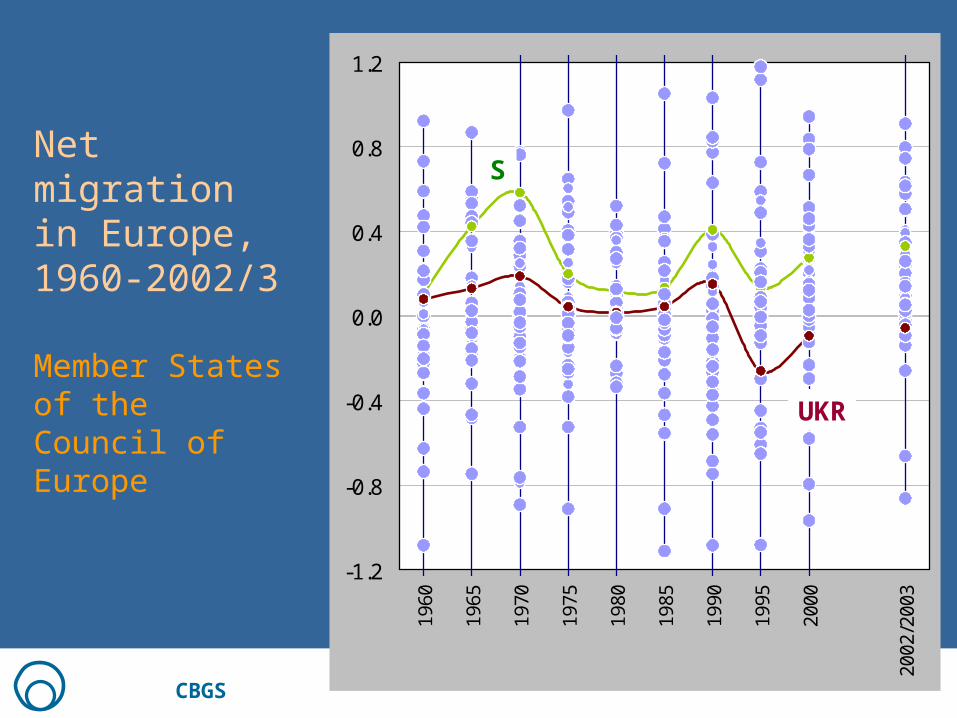
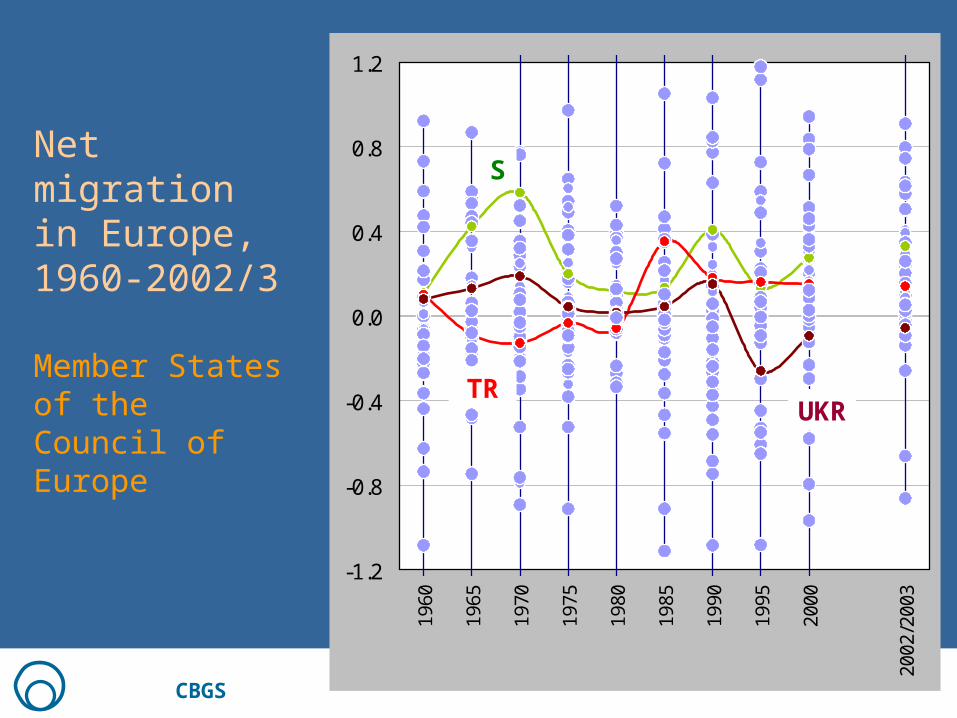
Net migration in Europe, 1960-2002/3
Net migration rate=
in-migration – out-migrationper 100 population

CBGS
Net migration in Europe, 1960-2002/3
Member States of the Council of Europe
-1.2
-0.8
-0.4
0.0
0.4
0.8
1.2
1960
1965
1970
1975
1980
1985
1990
1995
2000
2002
/200
3

CBGS
Net migration in Europe, 1960-2002/3
Member States of the Council of Europe
-1.2
-0.8
-0.4
0.0
0.4
0.8
1.2
1960
1965
1970
1975
1980
1985
1990
1995
2000
2002
/200
3
UKR

CBGS
Net migration in Europe, 1960-2002/3
Member States of the Council of Europe
-1.2
-0.8
-0.4
0.0
0.4
0.8
1.2
1960
1965
1970
1975
1980
1985
1990
1995
2000
2002
/200
3
UKR

CBGS
Net migration in Europe, 1960-2002/3
Member States of the Council of Europe
-1.2
-0.8
-0.4
0.0
0.4
0.8
1.2
1960
1965
1970
1975
1980
1985
1990
1995
2000
2002
/200
3
UKR

CBGS
Net migration in Europe, 1960-2002/3
Member States of the Council of Europe
-1.2
-0.8
-0.4
0.0
0.4
0.8
1.2
1960
1965
1970
1975
1980
1985
1990
1995
2000
2002
/200
3
UKR
CBGS
Net migration in Europe, 1960-2002/3
Member States of the Council of Europe
-1.2
-0.8
-0.4
0.0
0.4
0.8
1.2
1960
1965
1970
1975
1980
1985
1990
1995
2000
2002
/200
3
S
UKR
CBGS
Net migration in Europe, 1960-2002/3
Member States of the Council of Europe
-1.2
-0.8
-0.4
0.0
0.4
0.8
1.2
1960
1965
1970
1975
1980
1985
1990
1995
2000
2002
/200
3
TRUKR
S

CBGS
Net migration in Europe, 1960-2002/3
Member States of the Council of Europe
-1.2
-0.8
-0.4
0.0
0.4
0.8
1.2
1960
1965
1970
1975
1980
1985
1990
1995
2000
2002
/200
3
UKR
S
TR
• Relatively low net migration rate (on ‘average’, only 0.5%)
• Quite large differences between individual countries
• Important fluctuations by year
• Some ‘migrant’ countries may also be countries of destination for other countries (e.g. TR)

CBGS
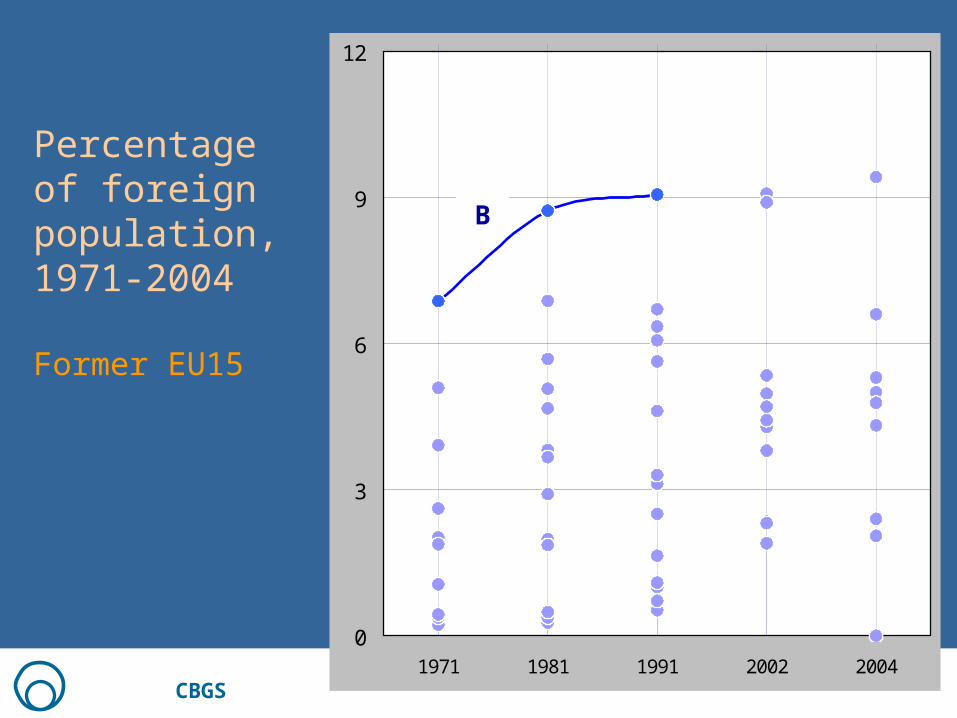
Percentage of foreign population, 1971-2004
Former EU15
0
3
6
9
12
1971 1981 1991 2002 2004
CBGS
Percentage of foreign population, 1971-2004
Former EU15
0
3
6
9
12
1971 1981 1991 2002 2004
B

CBGS
Percentage of foreign population, 1971-2004
Former EU15
0
3
6
9
12
1971 1981 1991 2002 2004
B
A

CBGS
Percentage of foreign population, 1971-2004
Former EU15
0
3
6
9
12
1971 1981 1991 2002 2004
B
A
E

CBGS
Percentage of foreign population, 1971-2004
Former EU15
0
3
6
9
12
1971 1981 1991 2002 2004
A
B
E
S

CBGS
Percentage of foreign population, 1971-2004
Former EU15
0
3
6
9
12
1971 1981 1991 2002 2004
S
B
A
E
DK

CBGS
Percentage of foreign population, 1971-2004
Former EU15
0
3
6
9
12
1971 1981 1991 2002 2004
S
B
A
E
DK
• Some countries have experienced a threefold increase since the 1970s
• However, with the exception of Luxembourg, where since 1991 proportions of more than 30% are observed (not shown), in no country the foreign population exceeds 9.5% of the total population

CBGS
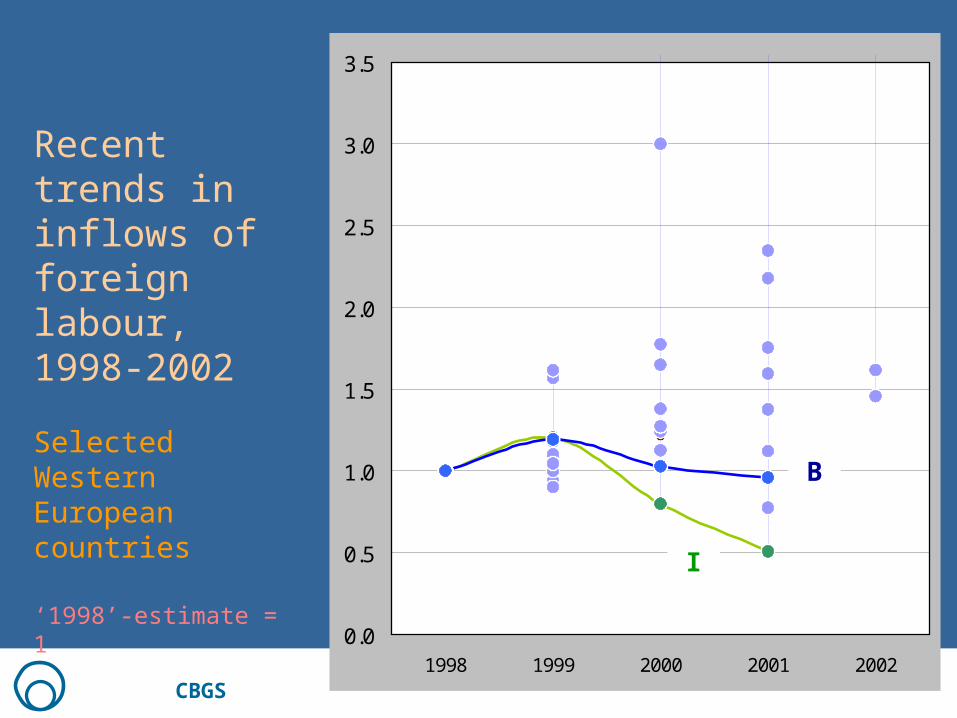
Recent trends in inflows of foreign labour, 1998-2002
Selected Western European countries
‘1998’-estimate = 1
0.0
0.5
1.0
1.5
2.0
2.5
3.0
3.5
1998 1999 2000 2001 2002

CBGS
0.0
0.5
1.0
1.5
2.0
2.5
3.0
3.5
1998 1999 2000 2001 2002
B
Recent trends in inflows of foreign labour, 1998-2002
Selected Western European countries
‘1998’-estimate = 1
CBGS
0.0
0.5
1.0
1.5
2.0
2.5
3.0
3.5
1998 1999 2000 2001 2002
B
I
Recent trends in inflows of foreign labour, 1998-2002
Selected Western European countries
‘1998’-estimate = 1

CBGS
0.0
0.5
1.0
1.5
2.0
2.5
3.0
3.5
1998 1999 2000 2001 2002
B
P
I
Recent trends in inflows of foreign labour, 1998-2002
Selected Western European countries
‘1998’-estimate = 1

CBGS
0.0
0.5
1.0
1.5
2.0
2.5
3.0
3.5
1998 1999 2000 2001 2002
B
P
I
Recent trends in inflows of foreign labour, 1998-2002
Selected Western European countries
‘1998’-estimate = 1
A

CBGS
0.0
0.5
1.0
1.5
2.0
2.5
3.0
3.5
1998 1999 2000 2001 2002
B
P
I
Recent trends in inflows of foreign labour, 1998-2002
Selected Western European countries
‘1998’-estimate = 1
A
• Fluctuations by year (depending on economic achievement)
• Differences between countries, e.g. Ireland (not shown) experiencing increases of more than x4
• The median indicates an overall increase of foreign labour migration of 12% per annum

CBGS
0.0
0.5
1.0
1.5
2.0
2.5
3.0
3.5
1998 1999 2000 2001 2002
B
P
I
Recent trends in inflows of foreign labour, 1998-2002
Selected Western European countries
‘1998’-estimate = 1
A

CBGS
Recent trends in inflows of foreign labour, 1998-2002
Selected Western European countries
‘1998’-estimate = 1
0.0
0.5
1.0
1.5
2.0
2.5
3.0
3.5
1998 1999 2000 2001 2002
P
A
B
I
Md

CBGS
Recent trends in asylum applications, 1998-2002
Selected Western European countries
‘1998’-estimate = 1
0.0
0.5
1.0
1.5
2.0
2.5
3.0
3.5
1998 1999 2000 2001 2002 2003

CBGS
Recent trends in asylum applications, 1998-2002
Selected Western European countries
‘1998’-estimate = 1
0.0
0.5
1.0
1.5
2.0
2.5
3.0
3.5
1998 1999 2000 2001 2002 2003
S

CBGS
Recent trends in asylum applications, 1998-2002
Selected Western European countries
‘1998’-estimate = 1
0.0
0.5
1.0
1.5
2.0
2.5
3.0
3.5
1998 1999 2000 2001 2002 2003
I
S

CBGS
Recent trends in asylum applications, 1998-2002
Selected Western European countries
‘1998’-estimate = 1
0.0
0.5
1.0
1.5
2.0
2.5
3.0
3.5
1998 1999 2000 2001 2002 2003
B
I
S

CBGS
Recent trends in asylum applications, 1998-2002
Selected Western European countries
‘1998’-estimate = 1
0.0
0.5
1.0
1.5
2.0
2.5
3.0
3.5
1998 1999 2000 2001 2002 2003
B
I
S
• Some countries - Italy, Belgium, and also Sweden - seem to have been able to limit the inflow of asylum seekers
• These individual ‘successes’ have not halted however the inflow of asylum seekers to Western Europe …

CBGS
Recent trends in asylum applications, 1998-2002
Selected Western European countries
‘1998’-estimate = 1
0.0
0.5
1.0
1.5
2.0
2.5
3.0
3.5
1998 1999 2000 2001 2002 2003
B
I
S

CBGS
Recent trends in asylum applications, 1998-2002
Selected Western European countries
‘1998’-estimate = 1
0.0
0.5
1.0
1.5
2.0
2.5
3.0
3.5
1998 1999 2000 2001 2002 2003
A
B
I
S

CBGS
Recent trends in asylum applications, 1998-2002
Selected Western European countries
‘1998’-estimate = 1
0.0
0.5
1.0
1.5
2.0
2.5
3.0
3.5
1998 1999 2000 2001 2002 2003
A
GR
S
I
B

CBGS
Recent trends in asylum applications, 1998-2002
Selected Western European countries
‘1998’-estimate = 1
0.0
0.5
1.0
1.5
2.0
2.5
3.0
3.5
1998 1999 2000 2001 2002 2003
A
GR
S
I
B
• These patterns suggest that the country of destination asylum seekers ‘choose’ depends on the legislation that is in effect.
• When one country ‘closes’ its borders, asylum seekers will try their luck in another one.

(a) “Many of the migration problems now confronting governments [in Europe] have resulted from a piecewise approach to specific problems, such as economic requirements, social cohesion, asylum, illegality or return” (Salt, 2005);
(b) Beginning of 2005 the European Commission published a Green Paper on ‘Economic Migration’. However, the objective is merely to get to a ‘comprehensive management strategy’ (among EU Member States) – the paper does not explicitly address the root causes of migration related to poverty;
(c) In spite of the increasing number of international migrants, countries cannot agree on organising a UN Conference on international migration.
CBGS
Some concluding remarks:

Many thanks for your attention


![4.25 BLISC Syllabus for CBGS[2]](https://static.fdocuments.net/doc/165x107/577cddcc1a28ab9e78adc420/425-blisc-syllabus-for-cbgs2.jpg)


![Icpd post 2015_linkages [autosaved]](https://static.fdocuments.net/doc/165x107/58783feb1a28ab707b8b641f/icpd-post-2015linkages-autosaved.jpg)


