The hydrogeological relationship between recharge ...
152
The hydrogeological relationship between recharge, abstraction and spring flow in the Zeerust dolomitic aquifer MR Pyburn 21235430 Dissertation submitted in fulfillment of the requirements for the degree Magister Scientiae in Environmental Sciences (specialising in Hydrology and Hydrogeology) at the Potchefstroom Campus of the North West University Supervisor: Prof I Dennis November 2015
Transcript of The hydrogeological relationship between recharge ...

The hydrogeological relationship
between recharge, abstraction and
spring flow in the Zeerust dolomitic
aquifer
MR Pyburn
21235430
Dissertation submitted in fulfillment of the requirements for the degree Magister Scientiae in Environmental Sciences
(specialising in Hydrology and Hydrogeology) at the Potchefstroom Campus of the North West University
Supervisor: Prof I Dennis
November 2015

Page i
The Hydrogeological Relationship Between Recharge, Abstraction and Spring-flow in the Zeerust Dolomitic Aquifer
ACKNOWLEDGEMENTS
The writing of this dissertation has been one of the most significant academic challenges I have
ever had to face. Without the support, patience and guidance of the following people, this
dissertation would not have been completed. It is to them that I owe my deepest gratitude.
Prof Ingrid Dennis, who undertook to act as my supervisor despite her many other
academic and professional commitments. Her wisdom, knowledge, enthusiasm and
commitment to the highest standards inspired and motivated me.
Dr. Stephan Pretorius of AGES for his mentorship and guidance during the early
stages of my career. Also for his kindness in allowing me to base my dissertation on this
project.
Johan Smit, my colleague and friend who was an inspirational figure during my
time at AGES, and who was always willing to share his knowledge and time to help me,
on this project and on many others.
Philip and Sharon Pyburn, my parents, who have always supported, encouraged
and believed in me, in all my endeavours.
Naudene my fiancée, for her love, compassion and support during my studies
and beyond.

Page ii
The Hydrogeological Relationship Between Recharge, Abstraction and Spring-flow in the Zeerust Dolomitic Aquifer
SUMMARY
Study area
The study area centres on the newly developed Vergenoegd well field (VWF) on the farm
Vergenoegd 60 JO west of Zeerust in the North West Province. The area is underlain by
dolomiteswhich are part of the Malmani Sub-Group in the Chuniespoort Group of the
Transvaal Supergroup.
The majority of the dolomite is located in quaternary catchment A31C. It forms part of the
Malmani River drainage, a part of the Marico catchment which drains northward to join
the Limpopo River system. This catchment’s western boundary also forms the
westernmost boundary of primary catchment “A”. West of this divide is the Molopo
Catchment (primary catchment “D”). The Molopo Eye is also located on the same
dolomite as the Malmani Eye (eight kilometres southwest), but drains towards the
Atlantic Ocean via the Molopo drainage system whereas the Malmani Eye drains towards
the Indian Ocean via the Malmani-Limpopo drainage system.
The study area forms part of the Crocodile West-Marico Water Management Area.
According to the hydrogeological map series of South Africa, the dolomite is described
as a Karst Type aquifer. Dolomite is known as a rock type with significant groundwater
potential due to the occurrence of groundwater in open cavities. Depending on the siting
of production boreholes, dolomite aquifers can yield in excess of 20 L/s. Dolomite
aquifers are classified as Major Aquifers according to the South African Aquifer
Classification System. The development of the Rietpoort, Uitvalgrond and Vergenoegd
well fields are testimony to the significant water potential of the Zeerust Dolomites
(Botha, 1993).
Historical work
For more than a century the groundwater potential of the dolomites west of Zeerust has
been known and investigated. The fluctuations in spring-flow emanating from the
dolomite were the most readily observable effects of change in the aquifer recharge. As
far back as pre-1906 there have been reports of spring-flow declining in the area, and
states of low water levels. It was mostly attributed to below average rainfall.
In order to optimally exploit the potential of the dolomite aquifers on a sustainable basis
(without compromising spring-flow), attempts have been made since the 1960’s to

Page iii
The Hydrogeological Relationship Between Recharge, Abstraction and Spring-flow in the Zeerust Dolomitic Aquifer
quantify the volume of water available. This is done by quantifying the volume of water
being added annually to the aquifer as a percentage of recharge.
As more farmers tapped into the groundwater potential of the dolomite aquifers, the
government saw it necessary to protect the groundwater by means of declaring a
Groundwater Control Area, effectively limiting and controlling abstraction to ensure
sustainability.
In 1965 the first case of alleged over-abstraction was investigated. A farmer alleged that
the ‘extreme weakening of the flow from the spring at Vergenoegd No. 3’ was the direct
result of excessive pumping of nearby boreholes. The report concluded that a cone of
depression could be observed around the points of abstraction, but that this did not
influence the spring-flow at that time. The weakening of the spring was due to a
combination of below average natural recharge and increased abstraction. The Zeerust
boreholes were subsequently decommissioned in 1967.
Data and interpretation
Existing data were obtained from the NGA (National Groundwater Archive), WARMS
(Water Resource Management System) containing water use data, and HYDSTRA
monitoring data. The HYDSTRA data proved the most valuable in terms of monitoring
data.
New data were sourced from the hydrocensus and monitoring runs undertaken in 2012
and form part of this study. A fieldwork trip including a monitoring run of all identified
boreholes was initiated in November 2012, while the monitoring data for the Vergenoegd
monitoring boreholes were sourced.
Although the Vergenoegd and Tweefontein Dolomite Compartment Units (DCU) have
been split by the Vergenoegd Dyke in previous literature, it was grouped together as the
Paardevlei Groundwater Management Unit (GMU) in 2009. Since the VWF boreholes
occur on both sides of the Vergenoegd Dyke, the new GMU is seen as the study area.
Three springs occur here: the Vergenoegd Spring (eyes) and the Paardenvallei Springs.
The Paardenvallei Springs’ data were more complete and did not reveal any impact from
the VWF. The fluctuations seem to be more controlled by climatic conditions, mainly
rainfall recharge.

Page iv
The Hydrogeological Relationship Between Recharge, Abstraction and Spring-flow in the Zeerust Dolomitic Aquifer
The monitoring data for the Vergenoegd Spring were insufficient to draw any significant
conclusions, but the fact that farmers downstream complained about a reduction in their
irrigation water from the spring, is indicative of a reduction in flow prior to the aquifer
being recharged in 2011-12. Although the reduction in spring-flow was predicted during
the numerical modelling of the borehole field, it was not identified during the EIA
preceding the development as having a cumulative impact on the farmers irrigating from
the canal.
Groundwater level monitoring data from various sources were used to assess the
possible impact of the abstraction on the aquifer. The monitoring boreholes located in the
Paardenvallei GMU did not reveal any adverse effect of the VWF on the water table in
the long term. In fact, the water levels prior to the borehole field development were on
par with what was measured in November of 2012. It must be noted that monitoring data
were not available for the entire period covered since the inception of the field of
boreholes, and therefore fluctuations on a shorter term is likely, as might have been the
case in 2010 when irrigation farmers complained about a decline in the Vergenoegd
Spring-flow.
The EIA Audit report submitted in 2011 (Masilo & Associates, 2011) indicated that no
correlation exists between groundwater levels and the abstraction from the borehole
field.
The calculations in this study contradict these findings. The EIA report however
concluded that the abstraction volumes from some of the production boreholes of the
VWF exceeded the recommended levels in 2010 indicating poor management of the
borehole field. It also confirmed that monitoring data are lacking and concluded that the
monitoring protocol was not fully in accordance with the 2005 modelling update and EMP
recommendations.
Conclusions
Due to the lack of monitoring data for the area, short term fluctuations cannot be
accurately be predicted. When the available monitoring data is examined, it be deduced
that there is a seasonal fluctuation in water levels as well as spring-flows and that these
two components are in relation. This fluctuation is due to the precipitation variations
between wet and dry months that affect recharge.

Page v
The Hydrogeological Relationship Between Recharge, Abstraction and Spring-flow in the Zeerust Dolomitic Aquifer
From the recharge calculations and subsequent modelling undertaken during this study,
it can be deduced that there is a high correlation between the recharge, abstraction and
spring-flow factors in this area. It is also apparent that these factors influence one
another greatly and that variance in one of the inputs will have an adverse effect on the
rest and will change the system’s response significantly, this is especially so when
abstraction rates are increased as well as when drought conditions are simulated.
Based on the available monitoring data, including spring-flow and groundwater level
data, it can be concluded that the VWF might show a long term impact on the aquifer.
It is likely that, the abstraction from the VWF reduces the spring-flow of the Vergenoegd
Springs, which in turn has a cumulative impact on the irrigation farmers receiving water
from the spring via a canal. This is especially so in the dry months when recharge is
limited. This reduction was predicted during the modelling phase. The reduction in water
levels then causes the secondary effect of sinkholes forming in the area due to
weakened dolomite stability, especially in areas where there are contributing factors,
such as pipeline leaks.
Recommendations
Monitoring of the spring-flow from the Vergenoegd Eyes must be reinstated as a matter
of priority. The irrigation farmers downstream claim that the VWF leads to a reduction in
their irrigation water from the spring, which in turn leads to loss of production, income
loss and creation of sinkholes. Other than this study, there are no data to prove that the
abstraction does not adversely affect the spring-flow from the Vergenoegd Eyes, and the
farmers might be entitled to compensation due to loss of income. This issue must be
investigated further on a legal basis.
Ngaka Modiri Molema District Municipality (NMMDM) as the Water Services Authority
and DWA as the custodians of water resources in South Africa are mandated to ensure
that proper monitoring are done. This includes monitoring of the abstraction volumes,
groundwater levels and spring-flows from the affected compartment. To ensure the
continuous monitoring of the borehole fields, the monitoring can be outsourced on a
tender basis to external contractors. The monitoring reports must be audited annually.
The management of the VWF must be audited on a catchment and national level as per
the ‘dolomite guideline’. The lack of proper and continuous monitoring data being the
most important factor hindering proper management, must be addressed.

Page vi
The Hydrogeological Relationship Between Recharge, Abstraction and Spring-flow in the Zeerust Dolomitic Aquifer
The recommendations pertaining to the operation and maintenance of the well field
made in the EIA and numerical modelling report must be adhered to (Sections 8.1.18
and 8.1.15). Similarly the findings and recommendations of the 2011 Audit report
(Section 8.2) must be implemented. In essence these recommendations are the
modelled sustainable yields (that were determined as being exceeded in the 2011 audit).
The 2011 audit then goes on to recommend that the abstraction rates immediately be
reduced to their modelled rates and that proper monitoring be instated.
Once monitoring data collection has been reinstated and a sufficient amount of time
series data has once again been recorded, a similar study to this should be completed. A
comprehensive hydrocensus should be conducted in which important data and
observations should be made. Any changes to the area should be noted and recorded. It
would be beneficial to conceptualise the system if changed and based thereupon, run
another analytical model to determine if the correlation between recharge, abstraction
and spring-flow has changed and if so, to what extent.

Page vii
The Hydrogeological Relationship Between Recharge, Abstraction and Spring-flow in the Zeerust Dolomitic Aquifer
LIST OF ABBREVIATIONS
Abbreviation Description
3D Three Dimensional
BCC Bogare Consultants Consortium
CDM Central District Municipality
CRD Cumulative Rainfall Departure
DACE Department of Agriculture, Conservation and Environment
DCU Dolomite Compartment Unit
DPEM Direct Parameter Estimation Method
DWA Department of Water Affairs
DWAF Department of Water Affairs and Forestry
CSM Conceptual Site Model
cumec Cubic metres per second
cusec Square meters per second
EIA Environmental Impact Assessment
EMP Environmental Management Plan
fasl Feet above sea level
FWR Far West Rand
GMA Groundwater Management Area
GMU Groundwater Management Unit
GPS Global Positioning System
GRU Groundwater Resource Unit
ha Hectare
HYDSTRA Monitoring database of DWA
IWRM Integrated Water Resource Management
L/s Litres per second
L/h Litres per hour
m3/a Cubic metres per annum (year)
mamsl Metres above mean sea level
mbgl Metres below ground level
Mm3 Cubic Millimetres
NGA National Groundwater Archive
NMMDM Ngaka Modiri Molema District Municipality
NWA National Water Act
NWRS National Water Resource Strategy
POI points of interest
RoD Record of Decision

Page viii
The Hydrogeological Relationship Between Recharge, Abstraction and Spring-flow in the Zeerust Dolomitic Aquifer
ToR Terms of Reference
SRTM Spatial Radar Topography Mission
SVF Saturated Volume Fluctuation
UWF Uitvalgrond Well Field
WARMS Water Resource Management System
WMA Water Management Area
VWF Vergenoegd Well Field
WBWSS Welbedacht Bulk Water Supply Scheme
WRIMS Water Resource Information Management System

Page ix
The Hydrogeological Relationship Between Recharge, Abstraction and Spring-flow in the Zeerust Dolomitic Aquifer
Table of contents
SUMMARY ................................................................................................................. II
HISTORICAL WORK ................................................................................................................... II DATA AND INTERPRETATION ..................................................................................................... III CONCLUSIONS ......................................................................................................................... IV RECOMMENDATIONS ................................................................................................................. V
1 INTRODUCTION .................................................................................................. 1
1.1 OBJECTIVES AND METHODOLOGY ................................................................................... 1 1.1.1 Objectives .......................................................................................................................... 1 1.1.2 Approach ........................................................................................................................... 1 1.1.3 Layout of dissertation ........................................................................................................ 2
2 LITERATURE REVIEW ....................................................................................... 4
2.1 HISTORICAL WORK ......................................................................................................... 4 2.1.1 Summary of historical work ............................................................................................... 4
2.2 BACKGROUND STUDY ................................................................................................... 11
3 BACKGROUND ................................................................................................. 21
3.1 REGIONAL INVESTIGATION ............................................................................................ 21 3.2 UITVALGROND WELL FIELD (UWF) ............................................................................... 21 3.3 VERGENOEGD WELL FIELD (VWF) ............................................................................... 22 3.4 STUDY AREA ................................................................................................................. 24
3.4.1 Geographic setting .......................................................................................................... 24 3.4.2 Topographic setting ......................................................................................................... 24 3.4.3 Geologic setting ............................................................................................................... 24 3.4.4 Hydrogeologic setting ...................................................................................................... 29 3.4.5 Climatic setting ................................................................................................................ 32
4 APPROACH ....................................................................................................... 38
4.1 INTRODUCTION ............................................................................................................. 38 4.2 DESK STUDY ................................................................................................................ 39
4.2.1 NGA data ......................................................................................................................... 39 4.2.2 WARMS data ................................................................................................................... 40 4.2.3 HYDSTRA data ............................................................................................................... 40 4.2.4 Monitoring data ................................................................................................................ 40 4.2.5 Data discrepancies .......................................................................................................... 40 4.2.6 Interpretation of Data ....................................................................................................... 43 4.2.7 Monitoring boreholes ....................................................................................................... 46 4.2.8 VWF and UWF combined monitoring data ...................................................................... 56
4.3 HYDROCENSUS ............................................................................................................ 61 4.3.1 Methodology .................................................................................................................... 61 4.3.2 Findings ........................................................................................................................... 61
4.4 CONCEPTUAL SITE MODEL (CSM) ................................................................................ 71 4.4.1 Preamble ......................................................................................................................... 71 4.4.2 Study area and groundwater levels ................................................................................. 71 4.4.3 Aquifer Characteristics .................................................................................................... 75 4.4.4 Groundwater Recharge Calculation ................................................................................ 75
4.5 MODELLING .................................................................................................................. 77 4.5.1 Analytical approach ......................................................................................................... 77 4.5.2 Data availability................................................................................................................ 83

Page x
The Hydrogeological Relationship Between Recharge, Abstraction and Spring-flow in the Zeerust Dolomitic Aquifer
5 CONCLUSIONS ................................................................................................. 84
6 RECOMMENDATIONS ...................................................................................... 86
7 REFERENCES ................................................................................................... 87
8 APPENDIX A: DETAILED DISCUSSION OF PREVIOUS WORK .................... 92
8.1 HISTORICAL WORK ....................................................................................................... 92 8.1.1 GH3357 (II) (Karlson, 1906) ............................................................................................ 93 8.1.2 GH0904 (Schumann, 1954) ............................................................................................. 94 8.1.3 GH0983 (Vegter, 1956) ................................................................................................... 94 8.1.4 GH1268 (Enslin, 1960) .................................................................................................... 95 8.1.5 GH0151 (Gordon-Welsh, 1961) ...................................................................................... 95 8.1.6 GH1283 (Bredenkamp, 1964) ......................................................................................... 96 8.1.7 GH1278 (Wilson, 1965) ................................................................................................... 96 8.1.8 GH3293 (Van Wyk and Mulder, 1974) .......................................................................... 100 8.1.9 GH3395 (Muller, 1981) .................................................................................................. 103 8.1.10 GH3602 (Bredenkamp, 1988) ....................................................................................... 104 8.1.11 GH3603 (Bredenkamp and Swartz, 1988) .................................................................... 105 8.1.12 GH3770 (Brink, 1992) .................................................................................................... 108 8.1.13 GH3815 (Botha, 1993) .................................................................................................. 108 8.1.14 GH3948 (Nel, 2000) ...................................................................................................... 110 8.1.15 Report No. AQS/AFRICON/2002/001 (Africon, 2002) ................................................... 111 8.1.16 Report No. 2005/0076-02 (Bogare, 2005) ..................................................................... 111 8.1.17 Report No. AQS/KHULANI/2005/001 (Khulani, 2005) ................................................... 114 8.1.18 EIA_507/2005NW_Zeerust/KGC_FSR_002 (Khulani, 2006) ........................................ 115 8.1.19 Department of Water Affairs (DWA) compartment delineation studies undertaken in 2009 116
8.2 2011 AUDIT (MASILO & ASSOCIATES, 2011) ............................................................... 120
9 APPENDIX B: RAINFALL GRAPHS ............................................................... 127
10 APPENDIX C: RECHARGE CALCULATIONS ............................................. 131
11 APPENDIX D: GROUNDWATER RESOURCE MANAGEMENT IN SOUTH
AFRICA .................................................................................................................. 133
11.1 DWA GUIDELINES ................................................................................................... 133 11.1.1 Management of dolomitic groundwater resources ......................................................... 136 11.1.2 North West Groundwater Master Plan........................................................................... 138
12 APPENDIX E: CASE STUDY INFORMATION ............................................. 139

Page xi
The Hydrogeological Relationship Between Recharge, Abstraction and Spring-flow in the Zeerust Dolomitic Aquifer
List of Figures
Figure 2-1: Springs, Topography and Drainage of the Zeerust Area ...................................................... 7 Figure 2-2: Rietpoort Wellfield ................................................................................................................. 8 Figure 2-3: Locality map of the Paardevallei Groundwater Management Unit as study area ................. 9 Figure 2-4: Welbedacht supply pipeline showing Uitvalgrond and Vergenoegd well fields ................... 10 Figure 3-1 Topography around the study area ...................................................................................... 26 Figure 3-2 Stratigraphic sequence of Malmani dolomites west of Zeerust (colours correspond to the 1:250000 geological map ...................................................................................................................... 27 Figure 3-3: Geological map of the study area ....................................................................................... 28 Figure 3-4: Hydrogeologic setting of the study area .............................................................................. 30 Figure 3-5: Weather stations used around the study area .................................................................... 33 Figure 3-6: Patched precipitation data at Marico ................................................................................... 34 Figure 3-7: Patched precipitation data at Mmabatho ............................................................................ 35 Figure 3-8 Combined rainfall data for Mmabatho and Marico ............................................................... 36 Figure 3-9: Cumulative rainfall data around the study area from six stations ....................................... 37 Figure 4-1: Boreholes obtained from existing database ........................................................................ 42 Figure 4-2: Flow data graph for Vergenoegd Spring ............................................................................. 44 Figure 4-3: Combined flow data graph for the Paardenvallei springs ................................................... 45 Figure 4-4: Groundwater level monitoring data for A3N0014 ................................................................ 47 Figure 4-5: Groundwater level monitoring data for A3N0015 ................................................................ 48 Figure 4-6: Groundwater level monitoring data for A3N0016 ................................................................ 49 Figure 4-7: Groundwater level monitoring data for A3N0017 ................................................................ 50 Figure 4-8: Groundwater monitoring data for D4N1468 ........................................................................ 51 Figure 4-9: Groundwater level monitoring data for D4N2514 ............................................................... 52 Figure 4-10: Monitoring data for D4N2515 ............................................................................................ 53 Figure 4-11: Groundwater monitoring data for D4N2516 ...................................................................... 54 Figure 4-12: Groundwater monitoring data for D4N2517 ...................................................................... 55 Figure 4-13: Groundwater level monitoring data for D4N2518 ............................................................. 56 Figure 4-14: Recovery of the aquifer after the Uitvalgrond Well Field failure as measured in monitoring boreholes ............................................................................................................................................... 57 Figure 4-15: Monitoring data of boreholes in and around the Vergenoegd Well Field .......................... 59 Figure 4-16: Monitoring borehole numbers around the Vergenoegd Well Field ................................... 60 Figure 4-17: Hydrocensus results focussing on borehole survey.......................................................... 67 Figure 4-18: Google Earth graphic indicating sinkholes relative to pipeline .......................................... 69 Figure 4-19: Study Area ........................................................................................................................ 72 Figure 4-20: Elevation profile over a regional part of the Zeerust Dolomites ........................................ 73 Figure 4-21: Conceptual model of the hydraulic relationship between the compartments on a regional scale. Based on the elevation profile in Figure 4-20 ............................................................................. 74 Figure 4-22: SVF (A3N0017) .................................................................................................................. 76 Figure 4-23: CRD (A3N0017) ................................................................................................................. 77 Figure 4-24: Calibration ......................................................................................................................... 79 Figure 4-25: Recharge versus spring flow ............................................................................................ 80 Figure 4-26: Relationship between water level and spring-flow ............................................................ 81 Figure 4-27: Impacts of abstraction ....................................................................................................... 82 Figure 4-28: Results of Scenario 3 ........................................................................................................ 83 Figure 8-1: Figure 4 from report GH3603 indicates the water levels and fluctuations in monitoring boreholes in the Rietpoort Compartment ............................................................................................ 107 Figure 8-2: Comparison in the water levels in monitoring boreholes A3N11, 12 and 13 (GH3815). .. 109 Figure 8-3: Pumping rates for borehole 21-00066 .............................................................................. 121 Figure 8-4: Pumping rates for borehole 21-00067 .............................................................................. 122 Figure 8-5: Pumping rates for borehole 21-00068 .............................................................................. 122 Figure 8-6: Pumping rates for borehole 21-00069 .............................................................................. 123 Figure 8-7: Pumping rates for borehole 21-00070 .............................................................................. 123 Figure 8-8: Pumping rates for borehole 21-00072 .............................................................................. 124

Page xii
The Hydrogeological Relationship Between Recharge, Abstraction and Spring-flow in the Zeerust Dolomitic Aquifer
Figure 10-1: SVF (A3N0015) ............................................................................................................... 131 Figure 10-2: CRD (A3N0015) .............................................................................................................. 132 Figure 11-1: Relationship between the assessment, planning and management functions at different levels (DWA, 2006b). .......................................................................................................................... 137
List of Tables
Table 1: Monitoring boreholes on record............................................................................................... 41 Table 2: List of DWA monitoring boreholes in the Paardenvallei GMU ................................................ 46 Table 3: Monitoring data from in and around the Uitvalgrond Well Field, values in mbgl ..................... 57 Table 4: Inspection of Rietpoort pumps ................................................................................................ 62 Table 5: Hydrocensus results ................................................................................................................ 65 Table 6: Results of Recharge Estimates ............................................................................................... 77 Table 7: Abstraction rates ..................................................................................................................... 80 Table 8: List of historical reports obtained from DWA’s archives ......................................................... 93 Table 9: Rainfall measured at Zeerust Jail ............................................................................................ 95 Table 10: Summary of data from Report GH1268 ................................................................................ 95 Table 11: Spring-flow for June 1960 and January 1965 ........................................................................ 97 Table 12: Measured points .................................................................................................................... 98 Table 13: Measuring points ................................................................................................................... 99 Table 14: Springs .................................................................................................................................. 99 Table 15: Hyrdocensus data ............................................................................................................... 101 Table 16: Spring-flow discharges and flow utilised ............................................................................. 103 Table 17: Spring-flows ......................................................................................................................... 104 Table 18: North West Dolomitic Groundwater Management Areas and Units (Holland and Wiegmans, 2009) ................................................................................................................................................... 119 Table 19: 2011 Audit findings .............................................................................................................. 120

Page 1
The Hydrogeological Relationship Between Recharge, Abstraction and Spring-flow in the Zeerust Dolomitic Aquifer
1 INTRODUCTION
A study was conducted of the property on which the Vergenoegd Well Field (VWF) is
located to investigate the potential impact of the bulk groundwater abstraction from the
VWF as part of the Welbedacht Bulk Water Supply Scheme (WBWSS) in light of
concern that the monitoring requirements as per the licensing conditions are not being
adhered to, and that over-abstraction is possibly taking place.
1.1 Objectives and Methodology
1.1.1 Objectives
To gather and evaluate all relevant data and information pertaining to the study
area and to determine areas where data are lacking, with the aim of determining
if the data can be used to predict short-term fluctuations in groundwater levels.
To conceptualise the issues at hand and to gain a better understanding of the
system and how all the various hydrogeological influences interact.
Demonstrate the methodology using the VWF as a case study.
Accurately predict the recharge percentage of the area by making use of various
calculations.
Create, calibrate and run an analytical model that predicts the influences of
abstraction on spring-flow and that correlates to the current situation.
To obtain an understanding of the relationship between recharge, abstraction
and spring-flow in the Zeerust Aquifer.
Determine whether the abstraction rates of the VWF will indeed have an impact
on the spring-flow quantities of the area and if so, to what extent.
1.1.2 Approach
Research was conducted by means of national and international literature. This
comprised of numerous academic publications, consultant reports and data that were
obtained from various sources. Rainfall, spring-flow, climatic and borehole data was
requested and obtained from various institutions.

Page 2
The Hydrogeological Relationship Between Recharge, Abstraction and Spring-flow in the Zeerust Dolomitic Aquifer
An evaluation of all existing information and data was then conducted and interpreted. A
field work phase was then undertaken to conduct a hydrogeological investigation and to
investigate relevant areas and objects of interest. Methods such as cumulative rainfall
departure (CRD), saturated volume fluctuation (SVF) were used to calculate recharge
percentages.
1.1.3 Layout of dissertation
Chapter 1: Introduction
Here the aims and approach of the study are described. The aims are laid out and the
approach is briefly discussed.
Chapter 2: Literature Review
The information sources used to reach the aims of the study are provided. The
background study is described and presents research into different aspects of recharge,
abstraction, spring-flow and how they tie together. Various publications, articles and case
studies are investigated. Following this section all the available work done in this specific
field with regards to the Zeerust area is summarised.
Chapter 3: Background
The regional background is described and the investigation undertaken in 2002 is
expanded upon. The Uitvalgrond Well Field (UWF) and VWF backgrounds are explained
and all relevant information relating to the study area is provided. This includes the
geographic, topographic, geologic, hydrogeologic and climatic settings.
Chapter 4: Approach
The quantification of recharge is described and how it can be estimated using the SVF
and CRD methods and how it was used in this study to reach the estimated recharge
percentage by means of software calculations.
The existing borehole data are explained and data discrepancies are highlighted. Data
includes NGA, WARMS, HYDSTRA and monitoring data.
A hydrocensus was undertaken in 2012 and the findings, methodology and techniques
used to complete the census are described as well as the findings of all the cumulative
hydrocensus data.

Page 3
The Hydrogeological Relationship Between Recharge, Abstraction and Spring-flow in the Zeerust Dolomitic Aquifer
Based on these results is a data interpretation where all the relevant data are interpreted
and described. This is broken-down into; affected compartments, spring-flow data,
monitoring data, data availability and sinkhole subsections.
The design and construction of the Conceptual Site Model (CSM) is expanded upon and
described. This section contains information about the study area, aquifer characteristics
and recharge calculations.
A model is then developed and all relevant information is expanded upon here.
Chapter 5: Conclusions
Based on the results, conclusions can be drawn concerning the study as well as to what
extent the relationship between recharge, abstraction and spring-flow is.
Chapter 6: Recommendations
Future research can be recommended to address potential short comings and possible
mediation measures are given relating to lack of monitoring.
Chapter 7: References
All documents referred to in the dissertation are listed.
Chapter 8: Appendices
The appendices include rainfall data, a summary of groundwater resource management
in South Africa, a summary of previous hydrological work conducted in the study area
and lastly recharge calculations.

Page 4
The Hydrogeological Relationship Between Recharge, Abstraction and Spring-flow in the Zeerust Dolomitic Aquifer
2 LITERATURE REVIEW
2.1 Historical Work
The relevant reports and evaluation thereof are attached as Appendix A. The
investigation into the historical work is relevant to this study as it serves to determine to
which extent previous studies were undertaken on the Zeerust aquifers. It also provides
a historical overview of the period that the relationships between abstraction and spring-
flow have been affecting the Zeerust area.
2.1.1 Summary of historical work
For more than a century the groundwater potential of the dolomites west of Zeerust has
been known.
The fluctuations in spring-flow emanating from the dolomite were the most readily
observable effects of change in the aquifer storage. Since before 1906 there have been
reports of spring-flow declining in the area. The GH3357 (II) report (DWAF, 1999)
mentions the drying up of the Rietpoort, Buffelshoek and Paardenvallei Springs (see
Figure 2-1). Low water levels southeast of Zeerust in the early 1950’s are attributed to
below average rainfall in the area between 1949 and 1952. This undoubtedly also
affected spring-flow.
In order to optimally exploit the potential of the dolomite aquifers on a sustainable basis
(without compromising spring-flow), attempts have been made since the 1960’s to
quantify the volume of water available. This is done by quantifying the volume of water
being added annually to the aquifer as a percentage of rainfall. Aquifer recharge was
initially anticipated as 6 per cent of rainfall based on work on other dolomitic areas in
South Africa. This figure was subsequently refined to 12 per cent (depending on rainfall
volume and intensity) (Aquisim, 2005).
Abstraction figures are important to spring-flow measurements to quantify the effect of
water losses on the aquifer (measured by water levels). In 1965 the first case of alleged
over-abstraction was investigated. A farmer alleged that the ‘extreme weakening of the
flow from the spring at Vergenoegd Eye’ (Figure 2-1) was the direct result of excessive
pumping of nearby boreholes to augment supply to Zeerust. The report concluded that a
cone of depression could be observed around the points of abstraction, but that this did
not influence the spring-flow at that time (Botha, 1993).

Page 5
The Hydrogeological Relationship Between Recharge, Abstraction and Spring-flow in the Zeerust Dolomitic Aquifer
The weakening of the spring was due to a combination of below average natural
recharge and increased abstraction. All springs downstream of the Rietpoort Spring saw
a decline in flow ranging from 42 per cent to 100 per cent between 1959 and 1965. The
Zeerust boreholes were subsequently decommissioned in 1967.
Water levels and spring-flow recovered to above normal conditions after the good rains
experienced between 1974 and 1976. Also in 1974 the six production boreholes at the
Rietpoort Well Field (RWF) were commissioned which caused the Rietpoort Spring to
cease flowing ten years later during a period of low rainfall. See Figure 2-2 for the
Rietpoort locality map. A ‘serious drought’ is described between 1977 and 1988 during
which the water levels and spring-flows were monitored. The monitoring data were used
to calibrate the first groundwater model to simulate the Rietpoort Compartment and
model abstraction scenarios in 1988. The model highlighted the importance of monitoring
data, and additional monitoring infrastructure was developed throughout for this purpose.
In 2002 two pivotal studies commenced concerning the water potential from the Zeerust
Dolomites: a consortium of companies were appointed to perform a regional study on the
dolomite compartments, during which over 50 compartments were delineated using
aeromagnetic geophysical surveys and numerous groundwater levels regionally.
After four production boreholes failed completely in September of 2005, urgent measures
were implemented to re-evaluate the borehole field potential and look for alternative
sources of augmentation. It’s unknown which specific boreholes failed. Based on the
regional compartment delineation of the 2002 consortium study, the Paardenvallei-
Vergenoegd DCU was identified as a compartment unit able to augment supply by 40-45
L/s sustainably (Figure 2-3) (Africon, 2002).
During the same year a numerical model for the groundwater flow from the Uitvalgrond
Compartment was completed, leading to the development of four production boreholes
from this compartment (called the UWF) to supply 31 L/s to the Welbedacht area as
seen in Figure 2-4. The well field was commissioned in April 2003 and was the first
phase of what is now known as the Welbedacht Bulk Water Supply Scheme.
In 2005 the numerical model for the UWF was updated (Aquisim, 2005) with new data,
and expanded to include the Paardenvallei-Vergenoegd DCU and the Klaarstroom South
DCU as potential sources. A geohydrological study (Khulani, 2005) coincided with this
model update and eight new production borehole sites were identified based on regional
gravity surveys.

Page 6
The Hydrogeological Relationship Between Recharge, Abstraction and Spring-flow in the Zeerust Dolomitic Aquifer
An EIA was recommended for the development of the abstraction borehole field. After
completion and obtaining environmental authorisation the WVF was developed and
commissioned and a water use licence was issued by DWAF in February of 2007.
In 2010 the irrigation farmers receiving spring water from the Vergenoegd Springs via a
canal system started to complain about a decline in the volume of irrigation water
received, triggering fears of the possible impact of the newly developed VWF on the
environment.

Page 7
The Hydrogeological Relationship Between Recharge, Abstraction and Spring-flow in the Zeerust Dolomitic Aquifer
Figure 2-1: Springs, Topography and Drainage of the Zeerust Area

Page 8
The Hydrogeological Relationship Between Recharge, Abstraction and Spring-flow in the Zeerust Dolomitic Aquifer
Figure 2-2: Rietpoort Wellfield
Rietpoort Spring
Rietpoort Spring
Boreholes

Page 9
The Hydrogeological Relationship Between Recharge, Abstraction and Spring-flow in the Zeerust Dolomitic Aquifer
Figure 2-3: Locality map of the Paardevallei Groundwater Management Unit as study area

Page 10
The Hydrogeological Relationship Between Recharge, Abstraction and Spring-flow in the Zeerust Dolomitic Aquifer
Figure 2-4: Welbedacht supply pipeline showing Uitvalgrond and Vergenoegd well fields

Page 11
The Hydrogeological Relationship Between Recharge, Abstraction and Spring-flow in the Zeerust Dolomitic Aquifer
2.2 Background Study
In karst landscapes, the generally harmonious pattern of surficial drainage is broken up
and closed depressions take over the landscape to varying degrees. Superficially, it
lacks organisation and the drainage system is often found underground (Marshal and
Norton, 2009). In fractured carbonate rocks, successful and unsuccessful boreholes can
exist in close proximity, depending on the frequency of fractures or solution chambers
intersected by the borehole (Buttrick and Van Schalkwyk, 1998). In situations where
rapid direct recharge can occur, fracture enlargement by dissolution has great influence,
causing local permeability to be almost infinite compared to other parts of the same
formation (Freeze and Cherry, 1979). High baseflow values consisting of both
groundwater and interflow are often present. Karst aquifers can represent highly
anisotropic storativity and permeability conditions, e.g. with double or triple porosity
(Bredenkamp and Vogel, 2007).
The major outflow points (known as eyes) from dolomitic aquifers in South Africa have
represented reliable sources of water for the local communities for many years
(Bredenkamp et al, 1995).
In Zeerust surface water is scarce throughout the area as most of the rivers are non-
perennial. The absence of surface water over such an extensive area of dolomite is
ascribed to the joints which occur within it (Clay, 1981). The duration of flow in the
springs is likely to be highly variable and some may only last for a short period of time
after major precipitation recharge events. Others may be semi-permanent. The patterns
of spring-flow are expected to be closely linked to the patterns of recharge in the bo-
molopo area. Spring-flow will be subject to evaporation and evapotranspiration losses
and in semi-arid areas may only contribute to sustaining static pools in the river channel
rather than stream flow (Button, 1970).
Taylor and Greene (2008) set out several methodologies that could be followed to
determine the effects and relationship between recharge and spring-flow. They are as
follows:
Spring Discharge Hydrograph Analysis
A wide variety of graphical, time-series, and spectral analysis techniques have been
applied to this method of investigation.

Page 12
The Hydrogeological Relationship Between Recharge, Abstraction and Spring-flow in the Zeerust Dolomitic Aquifer
Interpretation and analysis of a spring hydrograph by using recession analysis it is
possible to identify whether the overall basin flow characteristics are dominated by quick
flow (conduit-dominated flow), slow flow (diffuse-dominated flow), or mixed flow, and to
evaluate the timing and magnitude of changes in spring discharge that correspond to
changes between these flow regimes. Although these methods are based on Darcian
theories, the hydrograph analysis has been applied to large number of karst aquifers
(Taylor and Greene, 2008).
Precipitation Response Analysis
Because of the inherently high transmissivity of karst aquifers, the spring-flow’s quality
and quantity are largely connected to recharge by means of precipitation. Depending on
the magnitude of conduit-to-fracture ratio, spring hydrographs may show a flexible
response to recharge events. If there is a high ratio conduit-to-fracture/matrix coupling,
the spring will respond in a relatively short time (hours to weeks) to a recharge event,
whereas if this ratio is low, the spring response may take many days or weeks. Knowing
how the spring response is related to the recharge events is so important in karst
hydrology that much research has been directed toward methods of simulating or
predicting this response (Taylor and Greene, 2008).
Three approaches, linear systems analysis, lumped parameter (statistical modelling),
and numerical deterministic modelling, commonly are used to simulate or predict the
output function (spring discharge) of a karst system.
Linear systems analysis has been used in the hydrological sciences for many years to
characterize rainfall-runoff relations (Dooge, 1973; Neuman and de Marsily, 1976) and
has been used to describe rainfall (recharge)-spring discharge relations in karst systems
(Dreiss, 1982; 1983; 1989). The use of a linear method to characterize a nonlinear
system (karst groundwater flow) has been justified on a practical basis (Taylor &Greene,
2008).
In some karst basins, a linear response (kernel function) cannot adequately simulate the
spring outflow. The purpose of lumped-parameter models is to simulate the temporal
variations in discharge from springs. When the discharge rate varies continuously and
depends on hydrologic input processes of precipitation, sinking streams,
evapotranspiration, and infiltration, a model can be developed that produces the output
based on some or all of the inputs (Zhang and Bai, 1996).

Page 13
The Hydrogeological Relationship Between Recharge, Abstraction and Spring-flow in the Zeerust Dolomitic Aquifer
Water Tracing With Fluorescent Dyes
Dye-tracer testing is a versatile method that can be employed in a number of ways by
using various combinations of field and laboratory techniques that can be tailored to fit
the specific objectives, context, and scale of the investigation (Bredenkamp, 2010). The
basic goal of any dye-tracer test is to create a detectable fluorescent signal in water that
can be positively identified as originating from the injected tracer dye and that can be
interpreted in a manner needed to achieve the planned objectives of the test (Taylor and
Greene, 2008).
The hydrogeologic complexities presented by karst terrains often magnify the difficulties
involved in identifying and measuring or estimating water fluxes. Conventional
hydrogeologic methods such as aquifer tests and potentiometric mapping, though useful,
are not completely effective in identifying the processes involved in the transfer of water
fluxes in karst, or in characterising the hydrogeologic framework in which they occur, and
may provide erroneous results if data are not collected and interpreted in the context of a
karst conceptual model (Taylor and Greene, 2008).
Two more methods were used when a study was compiled when the total annual spring-
flow of the San Pedro River at Charleston in south-eastern Arizona decreased by about
66 per cent from 1913 to 2002. The San Pedro River is one of the few remaining free-
flowing perennial streams in the arid South-western United States, and the riparian forest
along the river supports several endangered species and is an important habitat for
migratory birds. The decreasing trend in spring-flow has led to concerns that riparian
habitat may be damaged and that overall long-term water supply for a growing population
may be threatened. Resource managers and the public had an interest in learning more
about the trend and the possible causes of the trend (Thomas and Pool, 2006).
Thomas and Pool (2006) investigated the decreasing trends in spring-flow of the San
Pedro River. Their study evaluated trends in seasonal spring-flows and trends in the
relation between precipitation and spring-flow.
Two methods were used to partition the variation in spring-flow and to determine trends
in the partitioned variation: (1) regression analysis between precipitation and spring-flow
and statistical tests of time trends in regression residuals, and (2) development of
regression equations between precipitation and spring-flow for three time periods (early,
middle, and late parts of the record) and testing to determine if the three regression
equations (rainfall-runoff relations) are significantly different.

Page 14
The Hydrogeological Relationship Between Recharge, Abstraction and Spring-flow in the Zeerust Dolomitic Aquifer
Method 1 was applied to monthly values of total flow (average flow) and low flow (3-day
low flow), and method 2 was applied to total flows. An important feature of the statistical
analysis in the study is that it provides objective criteria for making decisions and
interpretations about the data.
There were few significant trends in seasonal and annual precipitation or spring-flow for
the regional study area. Precipitation and spring-flow records were analysed for 11 time
periods ranging from 1930 to 2002; no significant trends were found in 92 per cent of the
trend tests for precipitation, and no significant trends were found in 79 per cent of the
trend tests for spring-flow. For the trends in precipitation that were significant, 90 per cent
were positive and most of those positive trends were in records of winter, spring, or
annual precipitation that started during the mid-century drought in 1945-60. For the
trends in spring-flow that were significant, about half were positive and half were
negative.
Trends in precipitation in the San Pedro River Basin were similar to regional precipitation
trends for spring and autumn values and were different for summer and annual values.
The analyses were successful in explaining much of the variation in spring-flow.
Groundwater pumping in the upper San Pedro watershed in Mexico and the United
States had a mixed influence on spring-flow trends at Charleston (Thomas and Pool,
2006). Statistical analyses indicate that seasonal pumping from boreholes near the river
for irrigation in the spring and summer was a major factor in the decrease in low flow.
A long term case study was conducted by the hydrologic evaluation section in the USA to
determine the effect of varying rainfall on aquifer discharge in Florida, USA. Hammett
(1990) determined a statistically significant decline in annual mean discharge for the
Peace River at Bartow, Zolfo Springs and the Arcadia gauging stations from the 1930s to
1984. Lewelling et al (1998) updated this work by including the subsequent 10-year
period and found the same declining trend from the 1930s to 1994. Previous studies
attribute this flow decline primarily to various factors, mainly loss of baseflow contribution
due to groundwater abstraction (Hammett,1990;Lewelling et al,1998).
While there is little doubt that anthropogenic factors have contributed to flow reductions,
the role of long-term, multi-decadal variation in rainfall toward spring-flow changes has
received little attention until very recently (HES, 2003).

Page 15
The Hydrogeological Relationship Between Recharge, Abstraction and Spring-flow in the Zeerust Dolomitic Aquifer
In the study it was determined that to maintain the Peace River as a perennial flow
system, 30 to 35 inches of annual rainfall is required to provide sufficient discharge from
springs. Statistical estimates of Peace River flow through regression of empirical data
and surface-water model results indicated that a 5-inch per year decline in rainfall could
result in spring-flow volume changes ranging from 22 to 35 per cent - expressed as a
percentage of mean flow. About 90 per cent of observed spring-flow decline was
attributed to a post-1970 rainfall departure of 5.7 inches per year. At a nearby station,
also in the study area, about 75 per cent of the observed spring-flow decline can be
related to long-term changes in rainfall (HES, 2003).
Another case study undertaken in Scotland evaluated the relationship between rainfall
and spring-flow on the North Pentland Springs and revealed statistical linkages with
precipitation accumulations over 1-7 months. Precipitation totals were found to be able to
explain up to 54 per cent of the variability in monthly spring-flow values, leaving 46 per
cent of the variability to be accounted for by other factors such as evaporation.
In the study it was determined that gradual decreases in spring-flows over the 80 years
from 1904, for which local precipitation data were available, appear to be the result of
decreases in annual precipitation totals. This applied to all three groups of measured
spring-flows.
Yet another international case study relating to the relationship between spring-flow and
rainfall was compiled by Stogner (2000) which describes trends in precipitation and
trends in spring-flow in the Fountain Creek watershed and presents a qualitative
assessment of changes in channel morphology of selected reaches of Fountain Creek
downstream from Colorado Springs, Colorado, USA.
The relationship between precipitation and spring-flow was evaluated for years 1960
through 1997, the period when all four precipitation monitoring stations were active. Daily
precipitation was summed and average daily precipitation calculated.
Average daily precipitation was cumulated and compared to the cumulative daily spring-
flow. A seasonal evaluation of the relation between precipitation and spring-flow was
conducted for the typically dry base-flow months of November through February and the
wetter summer months of March through October to determine if the influence of summer
thunderstorms were biasing the interpretation of the relation. Precipitation and spring-
flow that coincided with dry and wetter periods were summed, averaged, and cumulated
and compared.

Page 16
The Hydrogeological Relationship Between Recharge, Abstraction and Spring-flow in the Zeerust Dolomitic Aquifer
The analysis indicated that changes in the relation between precipitation and spring-flow
were nearly identical for the dry months of November through February as well as the
wetter months of April through October. A very strong correlation between precipitation
and spring-flow was established.
Similarly, a study was undertaken by Girish and Joshi (2004) in a small drainage
catchment in the Himalayan mountains to study the correlation between spring discharge
and rainfall patterns. Peak spring discharge coincided with peak rainfall in two springs,
another spring’s effects were delayed by a month due to geological factors. The spring
that was affected by geological factors had a gradual decline in spring-flow when the
rainfall declined whereas the springs not affected by geological factors had a rapid effect
when rainfall subsided.
Rainfall and spring discharges were related closely to each other in all six springs that
were included in the study. The peak discharge coincided with peak rainfall only in two
springs, in others, the peak discharge occurred one month after peak rainfall. The
springs were perennial in nature and yielded substantial water during the non-rainy
season (Girish & Joshi, 2004). This is similar in response to springs in the Zeerust area
according to the historical data whereby increases in spring-flows can be noted after
heavy rainfall events.
The spring-flow quantities fluctuated largely between the rainy and non-rainy seasons.
Spring-flow diminished to a great extent during the dry months. Thus, many of the water
supply schemes in the region suffered due to this highly seasonal pattern of spring
discharge.
In the springs where geological factors reduced transmissivity, the water yield was less
fluctuating and the decline from peak discharge was only one-third, indicating that they
were least dependant on the current season’s rainfall (Girish & Joshi, 2004).
The region was experiencing water supply issues in the dry seasons due to the reduced
spring discharge. Therefore, an understanding of the relationship between spring
discharge and recharge area characteristics can be of enough applied value with regard
to long-term water conservation strategies where people depend upon springs for fresh
water.
While the international literature provides a large deal of background and all are equally
applicable methods to quantify the relationship between rainfall, recharge and spring-
flow, as well as the fact that all the methods can be used to a degree of certainty,

Page 17
The Hydrogeological Relationship Between Recharge, Abstraction and Spring-flow in the Zeerust Dolomitic Aquifer
there is a method that was developed in South Africa that will be used in this study due to
its suitability whereby recharge can be calculated with a reasonable level of confidence
as well as the fact that it was developed locally.
Suitable Methods To Use For This Study
Bredenkamp et al (1995) set out to evaluate the correlation between precipitation and
spring-flows in the Rietpoort aquifer of the Zeerust area, South Africa.
The purpose of the study was to determine if this compartment would be adequate for
groundwater supply to communities in the area in the wake of numerous springs ceasing
to exude.
The Rietpoort compartment is part of the Malmani dolomites and is bounded by dolerite
dykes.
The methodology followed by Bredenkamp et al (1995) was to firstly gather all rainfall
and water-level data as well as all available abstraction data. The recently developed
Cumulative Rainfall Departure (CRD) method was used in which a recharge value could
be calculated using the available data.
The Wondergat sinkhole in the vicinity proved to be a valuable information source. Water
levels could be observed visually and measured within the hole. This served as a useful
tool to assess the accuracy of the CRD method that made use of sparse borehole
monitoring data within the Rietpoort aquifer.
Water levels from the sinkhole as well as boreholes were compared to rainfall data and a
correlation was observed - succeeding rainfall events, water levels rose in proportion to
the quantity of rainfall received and on average 3 weeks after the rainfall event took
place. When the water levels rose to a certain height, referred to as “the magical
number“ (Bredenkamp et al, 1995), springs started to discharge once again.
The CRD method also allows for abstraction data to be added which has a marked effect
on water levels. When this data was added it was noted that due to the lower than
average rainfall received during that time period in combination with the abstraction of
water for supply, water levels dropped to a level which caused the springs to cease
flowing. From the calculations it was determined that for the springs to start flowing once
again, either the recharge should increase in the compartment (mainly in the form of
rainfall), or the abstraction rates should be lowered, especially in the southern parts of
the compartment.

Page 18
The Hydrogeological Relationship Between Recharge, Abstraction and Spring-flow in the Zeerust Dolomitic Aquifer
The calculations that were made using the CRD method closely mimicked the actual
fluctuations that were observed in the Wondergat. This reaffirmed the CRD method as a
valid means to calculate aquifer recharge even when the monitoring data is fairly sparse.
Description Of The Cumulative Rainfall Departure (CRD) and Saturated
Volume Fluctuation (SVF) Method
The CRD method conforms to the concept that equilibrium conditions develop in an
aquifer over time until the average rate of losses equals the average recharge of the
system (Bredenkamp et al, 1995).
The rationale behind the departure method is that in any area, despite large annual
variations in precipitation, an equilibrium is established between the average annual
precipitation and the hydrological responses such as runoff, recharge and losses from
the system. Similarly the vegetation type and density have adapted to the prevailing
climate and rainfall characteristics (Bredenkamp et al, 1995).
The CRD method, based on the water-balance principle, is often used for mimicking of
water level fluctuations. Because of its simplicity and minimal requirement of spatial data,
the CRD method has been applied widely for estimating either effective recharge or
aquifer storativity, and consequently gained a focus in South Africa (Van Tonder and Xu,
2001).
The CRD and SVF (see Section 4.4.4) methods can both be used to predict aquifer
characteristics such as recharge, even when there is a lack of spatial data. When rainfall
and water level data are available, the data can be compared to estimate recharge. A
limited amount of data are needed to mimic water level fluctuations, this process then
provides a method to determine the relationship between rainfall, spring-flow and
abstraction. Bredekamp et al (1995) applied the CRD method to dolomitic aquifers and
attained satisfactory results.
Bredenkamp et al (1995) clearly showed that natural groundwater level fluctuation is
related to that of the departure of rainfall from the mean rainfall of the preceding time. If
the departure is positive, the water level will rise and vice-versa. However, it was
demonstrated that as long as there was surplus of recharge over discharge of an aquifer,
even though the departure is negative, the natural water level may have continued to rise
(Van Tonder and Xu, 2001).

Page 19
The Hydrogeological Relationship Between Recharge, Abstraction and Spring-flow in the Zeerust Dolomitic Aquifer
Van Tonder and Xu (2001) improved upon the formula defined by Bredenkamp et al
(1995) to make use of a shorter series of rainfall data that could not be accurately
reflected in the original equation.
Van Tonder and Xu’s (2001) equation is as follows:
Firstly with regards to the water balance equation. Assuming an aquifer area of (A)
receiving recharge from rainfall (QR) with production boreholes (QP) tapping the aquifer
and with natural outflow (QOUT), a simple water balance equation for a given time interval
i can be written as follows:
where Δhi is water level change and S aquifer storativity. If QRi is averaged over such a
time interval where Δhi is zero, the system may be treated as in equilibrium. This is,
however, seldom the case in reality.
If QPi is a constant rate, aquifer storage (ΔhiAS) adjusts to accommodate for net balance
between QRi and Qouti. This adjustment of the storage would be reflected in piezometeric
surface or water level changes in boreholes. The cause-effect relationship between
rainfall oscillation and water-level fluctuation is effectively represented by the correlation
between the CRD and water level fluctuation.
Bredenkamp et al. (1995) defined CRD as follows:
Where R is rainfall amount with subscript “I” indicating the i-th month “av” the average and
k=1+(QP + Qout)/(ARav). K=1 indicates that pumping does not occur and k>1 if pumping
and/or natural outflow takes place. It is assumed that a CRD has a linear relationship
with a monthly water level change. Bredenkamp et al (1995) derived:
where r is a percentage of the CRD which results in recharge from rainfall.

Page 20
The Hydrogeological Relationship Between Recharge, Abstraction and Spring-flow in the Zeerust Dolomitic Aquifer
Equation (3) may be used to estimate the ratio of recharge to aquifer storativity through
simple regression between CRDi and Δhi (Bredenkamp et al., 1995).
The improved formula created by Van Tonder & Xu (2001) is as follows:
where Rt, a threshold value representing aquifer boundary conditions, is determined
during the simulation process. It may range from 0 to Rav with 0 indicating an aquifer
being closed and Rav implying that the aquifer system is open, perhaps being regulated
by spring-flow. Note that Equation (4) reduces Equation (2) if rainfall events R i do not
show a trend (Rt = Rav). In this case, cumulative rainfall average would conform to Rav. It
is assumed that CRD is the driving force behind a monthly water level change if the other
stresses are relatively constant. The groundwater level will rise if the cumulative
departure is positive and it will decline if the cumulative departure is negative.
Since CRD ∝ (Δh + (Qp + Qout)/(AS)), then rCRD = S(Δh + (Qp + Qout)/(AS)). After
rearrangement, one obtains the following:
Term (Qpi + Qouti)/(AS) in Equation (5) is necessary only if a pumping borehole has
influence over the study area where water levels were collected. Equation (5) may be
used to estimate the ratio of recharge to aquifer storativity through minimising the
difference between calculated and measured Δhi series (Van Tonder & Xu, 2001).

Page 21
The Hydrogeological Relationship Between Recharge, Abstraction and Spring-flow in the Zeerust Dolomitic Aquifer
3 BACKGROUND
For ease of reference, the background to the abstraction borehole field development and
problems related with the bulk abstraction will be given in the subsections below.
3.1 Regional investigation
A detailed regional study of the Zeerust Dolomite Compartments was undertaken
by a consortium of companies prior to and during 2002. This study included the
detailed delineation of over 50 compartments, including the Dinokana,
Doornfontein and Rietpoort abstraction borehole fields. A comprehensive 3D
numerical model was compiled, the objective was to identify groundwater
resources to augment the larger Zeerust area’s supply with 231 L/s. One of the
outcomes was the identification of the Vergenoegd Compartment where between
40-45 L/s could be developed sustainably (keeping the water table within a five
metre drawdown on the long term) (Khulani, 2006). See Figure 2-3 for locality
map.
3.2 Uitvalgrond Well Field (UWF)
Botshelo Water (a bulk water service provider serving district and local
municipalities) appointed Africon to develop an abstraction borehole field on the
farm Uitvalgrond 60 JO (also known as Wolvekoppies) (Phumelela, 2008).
Aquisim Consulting (2002) was appointed by Africon to evaluate the aquifer
potential through aquifer testing and numerical modelling of several production
boreholes on the farm Uitvalgrond 60 JO. The investigation concluded that a total
of 30 L/s can be developed from four boreholes (Aquisim, 2002). The boreholes
were suitably equipped and production commissioned in April 2003. The project
is known as the Welbedacht Bulk Water Supply (Phumelela, 2008).
The UWF failed the following year (2004), necessitating a re-evaluation of the
aquifer potential. Additional water was also sought by the NMMDM further to the
south. This project was called Welbedacht Bulk Water Supply Augmentation, or
Phase II (Phumulela, 2008). This investigation made use of the geohydrological
services of Khulani GeoEnviro Consultants (Khulani, 2008).

Page 22
The Hydrogeological Relationship Between Recharge, Abstraction and Spring-flow in the Zeerust Dolomitic Aquifer
This phase of the investigation involved a detailed review of previous work done
on Uitvalgrond 60 JO and a gravity survey over an area of 45 km2 with the aim of
refining the dolomite compartments and drilling production and monitoring
boreholes (Khulani, 2008). Khulani recommended inter alia:
o That the abstraction from the Uitvalgrond boreholes must be reduced to 6
L/s (based on the spring-flow of Wolvekoppies Spring of 8 L/s) and
monitored.
o The drilling of five monitoring boreholes, sited within the gravity survey
area for additional data.
o Update of the existing 3D numerical model with the new data.
o An EIA as per regulations, and
o The drilling of eight new production boreholes to satisfy the demand of 40
L/s (Khulani, 2008).
3.3 Vergenoegd Well Field (VWF)
The above recommendations by Khulani (2008) were implemented as follows:
o The production from the UWF was reduced to 6 L/s and monitoring was
implemented.
o Five new monitoring boreholes were drilled.
o Aquisim Consulting (2002) was again contracted to update and re-
calibrate the 3D numerical model with new data.
o With the new refined compartment information, and based on the
numerical model, Aquisim (2002) confirmed the feasibility of abstracting
the required volume (40 L/s) spread out over three compartments as
follows:
Wolvekoppies/Uitvalgrond 6 L/s
Tweefontein South 10 L/s
Paardenvallei/Vergenoegd 30 L/s

Page 23
The Hydrogeological Relationship Between Recharge, Abstraction and Spring-flow in the Zeerust Dolomitic Aquifer
o DWA approved the investigation report and numerical model, and issued
an abstraction license for the new augmentation scheme.
o An EIA was also conducted and approved by the DACE in the form of a
RoD.
Subsequently seven new production boreholes were developed (drilled and
tested) following “protracted negotiations with landowners and communities”
(Khulani, 2008).
According to the land owners, neighbours who have water rights for irrigation
purposes from the canal fed by the Vergenoegd Springs complained in 2010
about a decline in the volume of water from the springs affecting their irrigation
supply. There is therefore suspicion that the abstraction from the VWF negatively
impacts on the underlying aquifer resulting in a decline in the spring-flow (AGES,
2010).
According to the licensing conditions and EIA requirements, NMMDM (as the
Water Services Authority), is required to monitor the water levels and abstraction
volumes and submit these monitoring results on a quarterly basis to both DWA
and the land owners. This is supposed to be performed by Botshelo Water (the
Water Services Provider). The land owners claim that they have never received
such reports creating doubt as to whether monitoring is being implemented
(AGES, 2010).
AGES was appointed by the land owners to independently investigate the
apparent negative impact on the aquifer. A status quo assessment was done in
2010 during which no conclusive evidence of negative impacts on the aquifer
could be found in the light of absence of historical and monitoring data (AGES,
2010).
Meanwhile in 2010 Masilo and Associates were appointed to conduct an audit
EIA to assess the compliance of the abstraction to the environmental obligations
(Masilo and Associates, 2011).

Page 24
The Hydrogeological Relationship Between Recharge, Abstraction and Spring-flow in the Zeerust Dolomitic Aquifer
3.4 Study area
3.4.1 Geographic setting
The study area centres on the newly developed VWF on the farms Kafferskraal 66 JO
and Uitvalgrond 60 JO west of Zeerust in the North West Province. The hydrgeological
influence of the abstraction is expected to be limited to the groundwater compartment in
which the abstraction borehole field is located, and therefore this compartment will be
used as a boundary to the study area. The investigation was however not limited to this
area, and included background information and data acquisition from a more regional
area (see Figure 2-3).
3.4.2 Topographic setting
Topographic data were obtained from the SRTM’s database (90m grid resolution) and
colour-scaled to aid visualisation on a regional scale. The dolomite outcrops form a
regionally flat topography, although on a more local scale undulations and incised river
valleys are present. The regional topography is characterised by the prominent hills and
valleys towards Zeerust (see Figure 3-1).
3.4.3 Geologic setting
The dolomite referred to forms part of the Malmani Sub-Group in the Chuniespoort
Group of the Transvaal Supergroup. The name Malmani was derived from the Malmani
Spring having its origin on the dolomites and giving rise to the Malmani River. The
Malmani Sub-group is underlain by the Black Reef Formation, a clastic sedimentary
series of quartzite, conglomerate and shale. This formation forms the base of the
Transvaal Supergroup and is characterized by a positive relief, smooth texture and light
tone on aerial photographs (Button ,1970). The Black Reef Formation is stratigraphically
defined as the sedimentary succession between the basal unconformable contact with
older Achaean rocks and the base of the lowermost dolomite bed (Coetzee, 1996).
Within the dolomite series overlying the Black Reef Formation, different formations exist
with varying compositions. At the base, the Oaktree Formation consists of a dark chert-
poor dolomite with some shale. This formation is characterised by large stromatolitic
domes, shale marker beds, the Convulate Chert Marker and a tuffite marker.

Page 25
The Hydrogeological Relationship Between Recharge, Abstraction and Spring-flow in the Zeerust Dolomitic Aquifer
The formation has a uniform dark colour, a low relief and no distinctive geomorphic
expression. The contact between the Oaktree and overlying Monte Christo Formation is
gradual and taken at the change from a dark brown to a light grey dolomite and a
corresponding increase in chert content (Obbes, 1995).
The overlying Monte Christo Formation is a chert-rich dolomite, containing interbedded
banded and oolitic chert. The formation has a streaky appearance, moderate relief, a
course texture and well-defined bedding traces on aerial and orthophotographs. In some
areas this formation has been intruded by a series of Precambrian dolerite dykes striking
east-west and north-south. Preferential dissolution and erosion along structurally
controlled lineaments has occurred to produce a karst topography, associated with
sinkhole formation (SACS, 1980).
Overlying the Monte Christo Formation is the Lyttelton Formation; another chert-poor
dolomite unit with a chocolate brown colour (Figure 3-2).
The lower part of the succession contains more chert than the central portion.
Megadomal stromatolites are fairly common in the Lyttleton Formation. Chertified
columnar stromatolites and cross-bedded dolarenite beds also occur. The unit is
characterised by a dark tone, a relatively subdues topography and poorly defined
bedding traces on aerial photographs. The contact with the overlying Eccles formation is
gradational and is taken at the change of colour from dark brown to grey and an
increased chert content (Clay, 1981).
The Eccles Formation which overlies the Lyttleton formation contains light grey
interbedded dolomite and chert bands which weather to produce the typical “bread and
butter” appearance. The Eccles formation is characterized by excellent bedding traces
on aerial photographs. A chert-shale breccia occurs near the top of the Eccles formation
The chert poor dolomite directly above the chert-shale breccia has a dark brown colour.
The Eccles formation is capped by a silicified chert breccia which constitutes a reliable
marker unit (Obbes, 1995).

Page 26
The Hydrogeological Relationship Between Recharge, Abstraction and Spring-flow in the Zeerust Dolomitic Aquifer
Figure 3-1 Topography around the study area

Page 27
The Hydrogeological Relationship Between Recharge, Abstraction and Spring-flow in the Zeerust Dolomitic Aquifer
The stretch of dolomite west of Zeerust strikes in a northerly direction, with a shallow dip
towards Zeerust (the east). The basal Oak Tree Formation therefore outcrops on the
western side of the dolomite series, and the Eccles and Frisco Formations to the east
(Figure 3-3).
Figure 3-2 Stratigraphic sequence of Malmani dolomites west of Zeerust (colours correspond
to the 1:250000 geological map
Black Reef (quartzite, shale, basal conglomerate)
Oak Tree (chert-poor dolomite, shale)
Monte Christo 1 (oolitic chert, dolomite)
Monte Christo 2 (interbanded chert and dolomite)
Monte Christo 3 (chert-rich dolomite)
Lyttelton (chert-poor dolomite)
Eccles (interbanded dolomite and chert)
Frisco (stromatolithic dolomite, chert-poor dolomite, shale)

Page 28
The Hydrogeological Relationship Between Recharge, Abstraction and Spring-flow in the Zeerust Dolomitic Aquifer
Figure 3-3: Geological map of the study area

Page 29
The Hydrogeological Relationship Between Recharge, Abstraction and Spring-flow in the Zeerust Dolomitic Aquifer
3.4.4 Hydrogeologic setting
Aquifer description
According to the hydrogeological map series of South Africa (DWA, 2001), the dolomite
is described as a Karst Type aquifer. This is due to the occurrence of groundwater in
dissolved cavities in the dolomite. Dolomite consists of calcium-magnesium carbonate
and is readily dissolved in acid (Bredenkamp, 2009). Acidic groundwater in the
geological past has dissolved cavities underground that are connected through fissures
and fractures to form a vast interconnected system of underground reservoirs. Cavities
that are not hydraulically connected, or are separated by impermeable dykes that
penetrated the dolomite form individual compartments with independent hydraulic
properties (Figure 3-4). The area is situated within the Paardevallei and Klaarstroom
GMA’s.
Quaternary catchments
The majority of the dolomite is located in quaternary catchment A31C as shown in Figure
3-4. It forms part of the Malmani River drainage, a part of the Marico catchment which
drains northward to join the Limpopo River system. This catchment’s western boundary
also forms the westernmost boundary of primary catchment “A”. West of this divide is the
Molopo Catchment (primary catchment “D”). The Molopo Eye is also located on the same
dolomite as the Malmani Eye (eight kilometres southwest). East of catchment A31C is
A31D which also overlies the eastern portion of the dolomites. The UWF boreholes are
located in this catchment.

Page 30
The Hydrogeological Relationship Between Recharge, Abstraction and Spring-flow in the Zeerust Dolomitic Aquifer
Figure 3-4: Hydrogeologic setting of the study area

Page 31
The Hydrogeological Relationship Between Recharge, Abstraction and Spring-flow in the Zeerust Dolomitic Aquifer
Aquifer parameters
The key hydraulic parameters that require quantification to enable the viability of
abstraction schemes to be determined in transmissivity (T) and storage (S). Much work
has been carried out to try and determine a) methodologies and b) to assign values to
these parameters (Bredenkemp et al, 1991). One of the key problems in this regard is
the heterogeneity of the dolomite so that applying average figures across compartments
is largely meaningless (DWA, 2006).
The highly transmissive nature of the dolomite results in the original water table being
very flat, with a very low gradient from one end of a compartment to the other. Solution
cavities and fissures are likely to be enlarged with time by continuous circulation of water
from the surface into possible cavities caused by abstraction cycles, thus possibly
increasing transmissivity and storage (DWA, 2006).
As with transmissivity (T=Kd where d is the saturated thickness) and storage, hydraulic
conductivity (K-value) is highly variable due to the heterogeneous nature of the
dolomites. Bredenkamp (1991) suggests an average storage value ranging from 1 to 5
for dolomitic aquifers in this specific areas.
From historical pump test data, Aquisim (2002) concluded that the aquifer transmissivity
value is large (thousands of m2/day) and that the storativity value is in the order of
0.0095 to 0.0821. It is difficult to accurately predict aquifer parameters in dolomites
due to their variance in weathering and secondary permeability. These are typical
values, which are often obtained for the karstified portions of dolomite formations in
Southern Africa.
Aquifer yields
Dolomite is known as a rock type with significant groundwater potential due to the
occurrence of groundwater in open cavities. Depending on the siting of production
boreholes, dolomite aquifers can yield in excess of 20 L/s. Dolomite aquifers are
classified as Major Aquifers according to the South African Aquifer Classification System
(DWA, 2011). The development of the Rietpoort, Uitvalgrond and Vergenoegd
abstraction borehole fields are testimony to the significant water potential of the Zeerust
Dolomites.

Page 32
The Hydrogeological Relationship Between Recharge, Abstraction and Spring-flow in the Zeerust Dolomitic Aquifer
3.4.5 Climatic setting
The area is located in the summer rainfall area of South Africa. Rainfall is characterised
by short intense thundershowers during summer months (October-March). The average
annual rainfall of the area is 547 mm, this was calculated from all available historical data
reviewed for numerous rainfall stations in the vicinity.
Rainfall data forms an important part of the relationship between recharge, abstraction
and spring-flow and is necessary to calculate the recharge factor affecting this
relationship. Rainfall data were obtained from Agromet in Potchefstroom and from the
Water Resource Information Management System (WRIMS). The Mmabatho Airport
(16936) and a station at Marico (17557) were sourced from Agromet, while several
stations were sourced from WRIMS: 050849, 0508649, 0508721, 0508825, 0509035,
and 0509042. These stations were plotted to indicate their relative positions around the
area of investigation as shown in Figure 3-5.

Page 33
The Hydrogeological Relationship Between Recharge, Abstraction and Spring-flow in the Zeerust Dolomitic Aquifer
Figure 3-5: Weather stations used around the study area

Page 34
The Hydrogeological Relationship Between Recharge, Abstraction and Spring-flow in the Zeerust Dolomitic Aquifer
Agromet data were incomplete and therefore did not reflect true annual rainfall figures.
The Marico station had uninterrupted data for 30 years between 1959 and 1989. Data
needed to be patched for seven months in 1990, for four months each in 1992 and 1995
and one month each in 1998 and 2003. The year 2004 only had data up to April, thus the
rest of the year was also patched as shown in Figure 3-6.
Data used for patching of the missing Agromet data stemmed from the WRIMS data
where monthly precipitation data was present and vice versa.
Both the Agromet as well as the WRIMS’ missing monthly data was patched using
Oracle’s Crystal Ball programme which is a Microsoft Excel based risk-assessment and
simple simulation programme.
Probability distribution was used to gain a suitable value for the few months with missing
data. Rainfall data are processed by the program whereby it automatically matches the
data against the continuous and/or discrete probability distributions. The program then
performs a mathematical fit to determine the set of parameters for each distribution that
best describes the characteristics of your data which in turn provides a patched value
(Figure 3-6).
Figure 3-6: Patched precipitation data at Marico

Page 35
The Hydrogeological Relationship Between Recharge, Abstraction and Spring-flow in the Zeerust Dolomitic Aquifer
At Mmabatho Airport the first four months of 1984 and the last four months of 2001 also
needed to be patched. Three months in 1989, 1994 and 1995 needed patching, two in
1988 and 1999 and only one in 1991, which is an anomalous year in terms of the data.
The patched data is illustrated in Figure 3-7.
At Mmabatho 588 mm of rain was measured (the data was patched for July in the dry
season) while Marico only realised 130 mm with no data missing. This pattern is
repeated in the following four years although the discrepancy between the two stations
reduces annually. Between 1989 and 1995 Mmabatho consistently measured more
rainfall than at Marico (see Figure 3-8).
From the combined bar chart it can be seen that the rainfall is very erratic and differs
substantially from year to year.
The reliability of the WRIMS data is also unknown. No data manipulation was done and
graphs were drawn from the data as-is. The data for the individual stations were plotted
individually, and combined in Figure 3-9. The majority of the WRIMS data stations have
data since 1903 and continues until 1999 while two stations have data up to 2008. The
variability in rainfall can be seen from the graphs.
Figure 3-7: Patched precipitation data at Mmabatho

Page 36
The Hydrogeological Relationship Between Recharge, Abstraction and Spring-flow in the Zeerust Dolomitic Aquifer
Figure 3-8 Combined rainfall data for Mmabatho and Marico

Page 37
The Hydrogeological Relationship Between Recharge, Abstraction and Spring-flow in the Zeerust Dolomitic Aquifer
Figure 3-9: Cumulative rainfall data around the study area from six stations

Page 38
The Hydrogeological Relationship Between Recharge, Abstraction and Spring-flow in the Zeerust Dolomitic Aquifer
4 APPROACH
4.1 Introduction
The approach followed in this investigation is similar to that documented in the DWA
(2006b) and includes the following steps:
Step 1: Desk study
The objective of a desk study is the collection and evaluation of available and
relevant data.
Step 2: Hydrocensus
A hydrocensus is essentially site familiarisation and the collection of data from the
study area. It comprises a census of boreholes and springs. The hydrocensus
involves the collection of data including: co-ordinates, details concerning
ownership, groundwater/spring use, yield, borehole depth, groundwater level and
existing equipment (e.g. pump installed).
Step 3: Conceptual groundwater model
The conceptual groundwater model is prepared using the data collected during the
previous steps. The conceptual model includes compartmentalising of the aquifer,
presence of springs/eyes, recharge potential and distribution of water levels. The
model constitutes the conceptual level understanding of the aquifer and its
behaviour, and provides the basis for the development of an analytical or numerical
model.
Step 4: Groundwater modelling
Models were prepared to assess various scenarios and make predictions
concerning the behaviour of the aquifer. Initially only a numerical model was
developed, however additional analytical models had to be developed as well.
Due to budget constraints additional field work such as drilling and aquifer testing
could not be conducted.

Page 39
The Hydrogeological Relationship Between Recharge, Abstraction and Spring-flow in the Zeerust Dolomitic Aquifer
S25.4 , E26.1
S25.8 , E25.7
4.2 Desk Study
Borehole data for existing databases were sourced for the area. Three databases
from DWA were used including the National Groundwater Archive (NGA), the Water
Resource Management System (WARMS) and the HYDSTRA database containing
monitoring data. The NGA database contains borehole records that includes
monitoring boreholes and data, but are outdated in some instances. The WARMS
database is a current database of water users who registered boreholes for the
specific purpose of registering abstraction, or applying for authorisation in terms of the
uses defined in Section 21 of the NWA (1998). The data indicate borehole locations,
use, volumes abstracted and whether authorisation was granted yet or not. The
HYDSTRA database contains monitoring data for both surface and groundwater
points (stream-flow, spring-flow, groundwater levels etc. measured over time) and is
highly valuable to this investigation.
4.2.1 NGA data
NGA data were retrieved for an area with the following dimensions:
A total of 1112 unique records were retrieved of which 1100 were boreholes, 6 were
springs, 5 were dug boreholes and one a sinkhole.
A total of 134 geosites were located using a handheld GPS, while the rest (978) were
all estimated from the 1:50 000 topographical map with varying levels of accuracy.
Various data fields are included in the data that are not applicable to this
investigation. Some boreholes do have water level data, but the dates of
measurement differ.

Page 40
The Hydrogeological Relationship Between Recharge, Abstraction and Spring-flow in the Zeerust Dolomitic Aquifer
No monitoring data are included in this dataset retrieved, but monitoring boreholes
(especially the monitoring boreholes in and around the VWF) are included as data
points – albeit without water level data.
The data are generally incomplete and difficult to use, but will be used as reference
where needed to compare current water level data to historical data. All boreholes are
indicated on Figure 4-1.
4.2.2 WARMS data
Data from the Water Resource Management System (WARMS) from DWA was
obtained and also plotted on Figure 4-1. This database contains records of water
uses registered, or applied for authorisation at DWA (which might or might not yet
have been authorised). Only the groundwater abstraction data from boreholes and
springs were requested.
This database does not contain information on water levels and monitoring and will
not be used in this regard. What is interesting to note from this database is that none
of the bulk abstraction boreholes of either of the borehole abstraction fields
(Rietpoort, Uitvalgrond and Vergenoegd) exists on this database.
4.2.3 HYDSTRA data
The HYDSTRA data proved the most valuable to this investigation. Monitoring data
for both springs and boreholes were obtained with varying degrees of completeness.
4.2.4 Monitoring data
A set of DWA monitoring data was obtained for several boreholes in the area. The
applicable boreholes (located in the study area) were filtered and used for
interpretation purposes.
4.2.5 Data discrepancies
When the locations of the applicable boreholes are plotted on a map, a discrepancy
between borehole numbers exists. Before 2012 certain monitoring boreholes had
numbers that do not correspond to the coordinates assigned to them after 2012.

Page 41
The Hydrogeological Relationship Between Recharge, Abstraction and Spring-flow in the Zeerust Dolomitic Aquifer
This could be due to the fact that prior to the use of GPS systems, a central co-
ordinate on a farm was used as a reference point.
New numbering formats were assigned to the boreholes, which add to the confusion.
The co-ordinates of the boreholes were used to compare the different boreholes from
the various datasets, and create a table to clarify the numbering and locations of the
monitoring boreholes (Table 1). From the table it can be seen that before 2012, the
numbering of the monitoring boreholes differed from the numbering assigned to them
post-2012, when the Hydstra numbers were allocated. For the sake of consistency,
the new 2012 numbers will be used as indicated on the NGA.
Table 1: Monitoring boreholes on record
Lat Long
NGA
(2012)
Hydstra
(2012)
DWA Monitoring (post
2012)
DWA Monitoring
(pre-2012)
Khulani
(2008)
-25.61603 25.95831 21-00061 D4N2514 D4N2514 (21 - 00061) 21 - 00065 21-00065
-25.59944 25.95817 21-00062 D4N2515 D4N2515 (21 - 00062) 21 - 00064 21-00064
-25.60242 25.96867 21-00063 D4N2516 D4N2516 (21 - 00063) 21 - 00062 21-00062
-25.59964 25.97367 21-00064 D4N2517 D4N2517 (21 - 00064) 21 - 00061 21-00061
-25.60467 25.97164 21-00065 D4N2518 D4N2518 (21 - 00065) 21 - 00063 21-00063

Page 42
The Hydrogeological Relationship Between Recharge, Abstraction and Spring-flow in the Zeerust Dolomitic Aquifer
Figure 4-1: Boreholes obtained from existing database

Page 43
The Hydrogeological Relationship Between Recharge, Abstraction and Spring-flow in the Zeerust Dolomitic Aquifer
4.2.6 Interpretation of Data
4.2.6.1 Spring-flow data
Spring-flow data were obtained from the Hydstra system from DWA for all the springs in
the area. The data are incomplete. To assess the impact of the VWF on the aquifer and
surrounding environment it is necessary to look at the springs occurring downstream of
the abstraction borehole field.
4.2.6.1.1 Vergenoegd Eye (A3H011)
The Vergenoegd Eye(s) are located due east of the borehole field in the same
compartment. The data however, was only recorded for the period between 1960 and
1992 (Figure 4-2) and therefore no monitoring took place around the time of the
development of the borehole field.
Since June 1983 the readings were all zero except for February and March 1991. The
last reading prior to the zero readings was 0.065 cumec which corresponds to the flow
during the period between 1973 and 1975. Since the inception of the monitoring in 1960
up to 1967, the readings were even lower - mostly below 0.05, but never was a zero
value registered. Therefore the zero readings post-1983 are suspect. It is doubtful if the
spring ceased flowing completely. During the visit to the eyes and monitoring station in
2010, the eyes were flowing albeit at a reported reduced discharge rate. In 2012 it was
again observed to be flowing.
The flow data from the monitoring station at Vergenoegd does not cover the period when
the borehole field was commissioned and no conclusions could be drawn in terms of the
alleged impact on the spring-flow. DWA was consulted for corrected data but none was
available at the time of investigation.

Page 44
The Hydrogeological Relationship Between Recharge, Abstraction and Spring-flow in the Zeerust Dolomitic Aquifer
Figure 4-2: Flow data graph for Vergenoegd Spring
4.2.6.1.2 Paardenvallei Eyes (A3H021 and A3H022)
The data for the two Paardenvallei springs were combined on Figure 4-3. A correlation
between the two springs can be observed – the Upper eye having a stronger flow than
the Lower eye.

Page 45
The Hydrogeological Relationship Between Recharge, Abstraction and Spring-flow in the Zeerust Dolomitic Aquifer
Figure 4-3: Combined flow data graph for the Paardenvallei springs
During the period between 1976 and 1978 both springs overflowed the monitoring weir,
as can be seen by the flat topped graphs. Thereafter the flow gradually declined to
almost nil in 1986 (the Upper eye ceased flowing). A period of low flow was experienced
for almost a decade before good rains recharged the compartment again in 1996 and
another flow peak was observed for a short time period. The low flow continued and only
increased significantly after 2001 and 2002. A period of sustained flow with seasonal
fluctuations was observed for about a decade before a significant spike in flow was
observed after rains at the beginning of 2011. This high flow in the Upper eye especially
was observed throughout 2011 and into 2012, but can be seen to be tapering off after
the 2012 dry season. This recharge event happened after the production of the VWF has
been in full production.
During the 2002 numerical modelling exercise, the reduction in spring-flow was simulated
for the various affected springs. A spring-flow reduction of between 10 and 30 L/s was
simulated for the Paardenvallei Spring and between 5.0 and 15 L/s for the Vergenoegd
Spring. The prediction was that significant rainfall recharge events would recharge the
aquifer to normal conditions again (Aquisim, 2002).

Page 46
The Hydrogeological Relationship Between Recharge, Abstraction and Spring-flow in the Zeerust Dolomitic Aquifer
4.2.7 Monitoring boreholes
The monitoring boreholes listed in Table 2 are located inside the boundaries of the
Paardevlei GMU (compartment) which should reflect the impact of the newly developed
VWF.
Table 2: List of DWA monitoring boreholes in the Paardenvallei GMU
Station
number Site Name Latitude Longitude
Lat/Long
Datum
Position
Accuracy Elevation Active Commence Cease Site Type
A3N0014 Doornfontein -25.63111 25.91444 Cape Datum 1410 F 1976/04/23 2003/03/15 Groundwater
A3N0015 Doornfontein -25.61417 25.92556 Cape Datum 1410 T 1977/01/21 Groundwater
A3N0016 Paardenvallei -25.62083 25.97500 Cape Datum 1400 T 1977/01/21 Groundwater
A3N0017 Paardenvallei -25.62233 25.97536 WGS84 1403 T 1977/01/21 Groundwater
D4N1468 Olyfenbult -25.59500 25.88083 Cape Datum 1424 T 1997/07/15 Groundwater
D4N2514 Vergenoegd -25.61603 25.95831 WGS84 1/250000 1415 T Groundwater
D4N2515 Uitvalgrond -25.59944 25.95817 WGS84 1/250000 1410 T Groundwater
D4N2516 Uitvalgrond -25.60242 25.96867 WGS84 1/250000 1405 T Groundwater
D4N2518 Uitvalgrond -25.60467 25.97164 World Geodetic Sys84 (Hartbeeshoek)1/250000 1405 T Groundwater
4.2.7.1 A3N0014
Monitoring borehole A3N0014 is located west of the borehole field on the farm
Doornfontein. This is an inactive monitoring station since monitoring ceased in March of
2003 – the reason is unknown. The available data for the period between 1976 and 2003
was plotted on a graph and missing data indicated as such. From the graph (Figure 4-4)
a dynamic water level of around 18 mbgl can be observed. The water table fluctuated
both upwards and downwards from this level, but time and again returned to this level. A
significant period of low water table was recorded between 1985 and 1988, reaching a
low of eight metres below the dynamic water level.
Meters of

Page 47
The Hydrogeological Relationship Between Recharge, Abstraction and Spring-flow in the Zeerust Dolomitic Aquifer
Figure 4-4: Groundwater level monitoring data for A3N0014
4.2.7.2 A3N0015
Monitoring borehole A3N0015 is located north of the Vergenoegd Dyke in the
Klaarstroom South DCU. This borehole shows significantly pronounced fluctuations.
Since 1977 the water table dropped from above 5 mbgl to below 20 mbgl, and never
recovered again to that level (Figure 4-5). Periods of recovery after recharge events are
noted, and these vary between a recovery of two to three metres up to eight metres
(1997).

Page 48
The Hydrogeological Relationship Between Recharge, Abstraction and Spring-flow in the Zeerust Dolomitic Aquifer
Figure 4-5: Groundwater level monitoring data for A3N0015
4.2.7.3 A3N0016 and A3N0017
Monitoring boreholes A3N0016 and A3N0017 are located north of the road leading to the
VWF from Zeerust. The boreholes are some 170 m apart and show vastly different data
sets (Figure 4-6 and Figure 4-7). A3N0016 has data since 1977 and 1999, and data
patches exist up to 2005 when monitoring ceased. It was resumed again in 2011. The
recharge event registered in A3N0015 during the end of 1997 is also evident in A3N0016
but not in A3N0017 which has a more stable water table. The monitoring data measured
since 2011 in A3N0016 indicated that the water table recovered significantly from a
previous level of 10 mbgl (2005) to 8 mbgl after the 2010/11 rainy season, but soon after
the water table dropped significantly again (below 11 mbgl).

Page 49
The Hydrogeological Relationship Between Recharge, Abstraction and Spring-flow in the Zeerust Dolomitic Aquifer
Figure 4-6: Groundwater level monitoring data for A3N0016
The water table in A3N0017 is steady around 20 mbgl. The last measurement was in
2005 prior to the VWF development. Since then bees were reported in the monitoring
borehole making it impossible to measure the water level. The bees should be removed
and the monitoring reinstated at this borehole.

Page 50
The Hydrogeological Relationship Between Recharge, Abstraction and Spring-flow in the Zeerust Dolomitic Aquifer
Figure 4-7: Groundwater level monitoring data for A3N0017
4.2.7.4 D4N1468
This borehole is located far northwest of the VWF, also in the Paardevlei GMU. The
data for D4N1468 are sparse and interpretation is difficult (Figure 4-8). A data gap exists
between 2005 and 2011. The level was at 18 mbgl when monitoring recommenced in
2011, and rose sharply by more than five metres at the end of 2011 after the summer
season. It dropped again by some two metres during the following winter season (2012).

Page 51
The Hydrogeological Relationship Between Recharge, Abstraction and Spring-flow in the Zeerust Dolomitic Aquifer
Figure 4-8: Groundwater monitoring data for D4N1468
4.2.7.5 D4N2514 (21-00061)
Boreholes D4N2514 to 2518 from the Hydstra database correspond to the monitoring
boreholes drilled for the VWF named 21-00061 to 00065 respectively. The boreholes
have Hydstra monitoring data available since June 2011 only (Figure 4-9). Borehole
D4N2514 is located south of the Vergenoegd Dyke, in the eastern portion of the
Paardevlei GMU. The water table varied between 32 and 33 mbgl for the year except for
a reading of 39 mbgl in April 2012. If this is a legitimate reading, it represents a
drawdown of six metres, which recovered to the dynamic level several months later. It is
more likely that it is a typing error and should read 29.27mbgl since the rest of the
boreholes in the vicinity all recorded a spike in the water level during the same period.
This would represent a spike of almost three metres instead of a drop of six metres.

Page 52
The Hydrogeological Relationship Between Recharge, Abstraction and Spring-flow in the Zeerust Dolomitic Aquifer
Figure 4-9: Groundwater level monitoring data for D4N2514
4.2.7.6 D4N2515 (21-00062)
Similarly the data are only available since May 2011. A steady decline from 22 mbgl to
25.6 mbgl is observed. This is a drop in water level of close to four metres within the
span of a year. The spike in water level recorded in April 2012 is not as well defined in
this borehole (Figure 4-10).

Page 53
The Hydrogeological Relationship Between Recharge, Abstraction and Spring-flow in the Zeerust Dolomitic Aquifer
Figure 4-10: Monitoring data for D4N2515
4.2.7.7 D4N2516 (21-00063)
This borehole also shows a steady decline in the water level (almost two metres) apart
from the small spike in April 2012 (Figure 4-11).

Page 54
The Hydrogeological Relationship Between Recharge, Abstraction and Spring-flow in the Zeerust Dolomitic Aquifer
Figure 4-11: Groundwater monitoring data for D4N2516
4.2.7.8 D4N2517 (21-00064)
This borehole showed a drop in water level from 17.75 mbgl to 22.66 mbgl in nine
months. This is a drop of almost five metres which is significant. It recovered in April
2012 together with the other VWF monitoring boreholes (Figure 4-12).

Page 55
The Hydrogeological Relationship Between Recharge, Abstraction and Spring-flow in the Zeerust Dolomitic Aquifer
Figure 4-12: Groundwater monitoring data for D4N2517
4.2.7.9 D4N2518 (21-00065)
This borehole follows the same trend as the majority of the other boreholes (Figure
4-13).

Page 56
The Hydrogeological Relationship Between Recharge, Abstraction and Spring-flow in the Zeerust Dolomitic Aquifer
Figure 4-13: Groundwater level monitoring data for D4N2518
4.2.8 VWF and UWF combined monitoring data
When combining the VWF monitoring borehole data with historical data as obtained from
other sources, Table 3 can be compiled. The table indicates the various data sources, as
well as data points in time for each monitoring borehole. A comment column puts the
time of observation in perspective relative to the abstraction borehole field operations. It
can be seen that the first data available for the boreholes were measured right after the
UWF failure – with recovery still evident in 21-00061 and 00062. A graph of the UWF
recovery was constructed (Figure 4-14).

Page 57
The Hydrogeological Relationship Between Recharge, Abstraction and Spring-flow in the Zeerust Dolomitic Aquifer
Table 3: Monitoring data from in and around the Uitvalgrond Well Field, values in mbgl
Date 21-00061 21-00062 21-00063 21-00064 21-00065 21-00072 Comment
2005/03/21 73.22 31.01 33.45 19.98 After Uitvalgrond dewatering
2005/03/23 71.47 27.42 33.45 19.98 24.41 After Uitvalgrond dewatering
2005/03/24 70.57 26.41 33.45 19.98 24.41 After Uitvalgrond dewatering
2005/03/29 66.49 24.77 33.45 19.98 24.41 After Uitvalgrond dewatering
2005/04/01 64.07 24.62 33.45 19.98 24.41 After Uitvalgrond dewatering
2005/04/13 54.84 24.6 33.45 19.98 24.41 After Uitvalgrond dewatering
2007/11/08 19 Before Vergenoegd abstraction
2010/10/21 32.76 23.84 33.4 19.45 During Vergenoegd abstraction
2010/11/08 32.41 24.02 33.41 19.62 During Vergenoegd abstraction
2010/11/23 32.41 24.16 33.42 19.75 During Vergenoegd abstraction
2010/12/14 32.44 24.3 33.45 19.82 During Vergenoegd abstraction
2011/01/28 32.44 24.18 33.4 19.67 During Vergenoegd abstraction
2011/06/08 32.17 22.03 30.61 17.75 21 During Vergenoegd abstraction
2012/03/01 32.22 23.84 32.34 22.66 21.45 During Vergenoegd abstraction
2012/09/06 33.31 25.44 33.61 24.07 During Vergenoegd abstraction
2012/11/14 25.43 32.68 20.9 23.5 18.4 During Vergenoegd abstraction
Data source
Data source
Data source
Data source
Botshelo monitoring data
Masilo and Associates, 2011
Khulani, 2008
Rassie Jacobs Waterdienste
Figure 4-14: Recovery of the aquifer after the Uitvalgrond Well Field failure as measured in
monitoring boreholes

Page 58
The Hydrogeological Relationship Between Recharge, Abstraction and Spring-flow in the Zeerust Dolomitic Aquifer
When the entire period of data availability is plotted in Figure 4-15, with borehole
locations been shown in Figure 4-16. Following the UWF recovery and the inception of
the VWF, no impact of the VWF abstraction can be observed. The water levels in all of
the monitoring boreholes except 21-00061 were on the same basic level at the last
measurement as it was prior to the development of the VWF. Even 21-00061 recovered
to a level around 32-33 mbgl from a dewatered state of sub-70 mbgl.
Most notably is the water level in 21-00072, which is located near the entrance to the
abstraction borehole field and within 200 m from the first production borehole (21-
00071). The level was recorded at 19 mbgl during the pumping tests performed prior to
the borehole field development, and measured at 18.4 mbgl on the 14th of November
2012. Although it only has two data points, it is sufficient to conclude that no long term
impact from the VWF could be observed over the period. It is however possible that the
water table fluctuated on a short term basis in between the two dates of measurement,
as was observed in the other monitoring boreholes.

Page 59
The Hydrogeological Relationship Between Recharge, Abstraction and Spring-flow in the Zeerust Dolomitic Aquifer
Figure 4-15: Monitoring data of boreholes in and around the Vergenoegd Well Field

Page 60
The Hydrogeological Relationship Between Recharge, Abstraction and Spring-flow in the Zeerust Dolomitic Aquifer
Figure 4-16: Monitoring borehole numbers around the Vergenoegd Well Field

Page 61
The Hydrogeological Relationship Between Recharge, Abstraction and Spring-flow in the Zeerust Dolomitic Aquifer
4.3 Hydrocensus
4.3.1 Methodology
On the 20th of September 2012, a field visit hydrocensus was conducted in the area
under investigation to obtain data of groundwater levels, abstraction (boreholes,
pumping volumes/schedules, equipment etc.), surface water features like springs and
wetlands, and other features that can be linked to groundwater abstraction like
sinkholes and dolines. Water quality did not form part of this investigation. The
Welbedacht pipeline was also visited (see Figure 2-4).
The methodology entailed gathering local knowledge from the land owners and
neighbouring farmers, and visits to the various points of interest (POI) like boreholes
and springs. Local knowledge included personal observations with regards to spring-
flows, rainfall, abstraction, sinkhole formation. During the gathering of local
knowledge the locals indicated the presence of a new plant species that sprouted in
areas where sinkholes were forming or were predicted to form, but no reliable
information or scientific substantiation could be made. All concerns were noted and
those relevant to the this study are documented. Other data measured in the field
were captured in a spread sheet for interpretation and reporting.
4.3.2 Findings
4.3.2.1 Vergenoegd Well Field
The production boreholes of the VWF were visited during this hydrocensus as well.
Other than in 2010, all pump houses were locked and no access was gained to
monitor the state of the equipment housed inside. The pump houses consist of
corrugated iron shacks housed inside a razor wire fence.
Monitoring boreholes drilled as part of the abstraction borehole field development
were identified during the literature study. These and other monitoring boreholes were
plotted on the field map and also visited during the hydrocensus. All of the
Vergenoegd monitoring boreholes were locked at the time of the visit and no water
level measurements could be taken. Of the DWA monitoring boreholes, a water level
could only be taken in one of the boreholes.

Page 62
The Hydrogeological Relationship Between Recharge, Abstraction and Spring-flow in the Zeerust Dolomitic Aquifer
4.3.2.2 Rietpoort Well Field
The RWF was also visited. There are six abstraction boreholes as well as a large
monitoring borehole with a monitoring station built around it. All of the abstraction
pumps were running at the time of visit. The water from the abstraction boreholes is
pumped into a large reservoir on site from where it is distributed through two
pipelines; one serving Zeerust and the other Witkop Fluorspar Mine.
The individual abstraction boreholes were inspected and the following was observed
(Table 4).
Table 4: Inspection of Rietpoort pumps
Pump Abstracting Total Reading
(m³) Comment
1 Yes 9881345 Gauge broken, leaking water from outlet
2 Yes - Gauge covered by ant nest, non-operational. Leaking water from outlet
3 Yes - Gauge covered by ant nest, non-operational.
4 Yes - Pump cover missing, vegetation growing out of casing for some time
5 Yes 5697994 Gauge not working
6 Yes 0866704 Only working flow gauge of all pumps

Page 63
The Hydrogeological Relationship Between Recharge, Abstraction and Spring-flow in the Zeerust Dolomitic Aquifer
Photo 4-1: Breached retention wall at Rietpoort Spring
4.3.2.3 Rietpoort Spring
The Rietpoort Spring and monitoring station were visited. There was no water flowing
over the measuring weir, but it was reported by the land owner that water does flow
over the weir during the summer months. There was a wall constructed to dam up the
water to flow over the weir. This wall was however observed to be breached,
bypassing the weir (Photo 4-1).
4.3.2.4 Vergenoegd Spring
The Vergenoegd Springs were visited. The land owner mentioned that four farmers
irrigate using the water from these springs fed via a canal system. It is alleged that the
yield of the spring diminished since the inception of the abstraction borehole field.
Previously the irrigation farmers were able to irrigate 1000 ha, recently the volume
only enabled the irrigation of 200 ha.

Page 64
The Hydrogeological Relationship Between Recharge, Abstraction and Spring-flow in the Zeerust Dolomitic Aquifer
4.3.2.5 Kraalfontein Spring
The Kraalfontein Spring was observed to be flowing. This spring was pointed out to
AGES during the 2010 hydrocensus as the Doornfontein Spring, whereas the
Doornfontein Spring is located further to the west on the neighbouring farm
Doornfontein. The Kraalfontein Spring is located on the farm Kafferskraal 60 JO and
was referred to as the Kafferskraal Spring. Recently the name changed to
Kraalfontein Spring.
4.3.2.6 Other boreholes
Several other private and monitoring boreholes were surveyed in the vicinity. Where
possible the abstraction volumes and water levels were recorded. All data are
included in the summary table (Table 5) and plotted on Figure 4-17.

Page 65
The Hydrogeological Relationship Between Recharge, Abstraction and Spring-flow in the Zeerust Dolomitic Aquifer
Table 5: Hydrocensus results
Latitude Longitude
1 PBH-08 46 Borehole Windmill Abstraction 17.62m S25.65253 E25.95960
2 PBH-07 47 Borehole None None 20.12 S25.67229 E25.95342
3 Rietpoort Pumps 48 Borehole Electric Abstraction 6.47m (monitoring) S25.67596 E25.95239
6 Boreholes that are pumping. One monitoring hole. Pipes from reservoir split into two, the left goes to
Zeerust and the right goes to a mine.
4 PBH-06 50 Borehole Windmill Abstraction Not Accessible S25.67425 E25.96266 Feeds cattle trough.
5 Trough 51 Trough N/A Water Provision N/A S25.67733 E25.96108 Cattle trough with ball valve. Taps from mine pipeline.
6 Pipe Fix 52 Pipeline N/A Water Provision N/A S25.67827 E25.96286 Place where pipeline has been fixed. Hole left open.
7 Pipe Leak 53 Pipeline N/A Water Provision N/A S25.67909 E25.96499 Place where pipeline used to leak. Fixed in 2011.
8 Sinkhole-3 54 Sinkhole N/A None N/A S25.67878 E25.96603 Sinkhole. Dead cow therein.
9 MON-01 55 Borehole N/A Monitoring Not Accessible S25.68459 E25.95761 Also rainwater guage that's non-operational.
10 PBH-05 56 Borehole Windmill Abstraction Not Accessible S25.69285 E25.97034 Farmer calles windmill "Swartpomp"
11 PBH-04 57 Borehole Windmill Abstraction 3.38m S25.69673 E25.95919
12 DBH-03 58 Borehole Windmill None None/Bees Nest S25.69724 E25.95841 Dried up/abandoned windmill. Dried up 16 years ago.
13 PBH-03 59 Borehole Windmill Abstraction 5.09 S25.68686 E25.95155 Windmill without pump. Has not been pumping since mid 2011.
14 PBH-02 60 Borehole Windmill Abstraction 9.40m S25.69306 E25.94540 Feeds cattle trough.
15 PBH-01 61 Borehole Windmill Abstraction 18.05 S25.69786 E25.92637 Feeds cattle trough.
16 Rift 62 Rift N/A N/A N/A S25.69916 E25.93002 Farmer states that this N/S running rift splits water into shallow WL in in East and Deep WL in West.
17 DBH-1 63 Borehole None None 12.93m S25.70049 E25.92630 Dried up/abandoned windmill.
18 DBH-2 64 Borehole None None None/Bees Nest S25.70023 E25.92608 Dried up/abandoned borehole.
19 Diamond Trap 65 Furrow N/A Diamond Trap N/A S25.68717 E25.95416 Old Furrow that was aparrently used to trap Diamonds. Presumably used diverted water.
20 RPS 66 Spring N/A Water Provision N/A S25.67380 E25.95050
Water runs through grids toward Zeerust. V-Notch is installed. Water is not flowing over V-noth at present
but Farmer states that it does in summer.
21 Dam Wall 67 Dam Wall N/A Dam Wall N/A S25.67403 E25.95011 Dam wall has been damaged and eroded away. Water now bypasses infrastructure placed to measure water
22 PBH-11 68 Borehole Diesel Abstraction Not Accessible S25.63244 E25.94589 Operates 24/7. Feeds Cattle.
23 PBH13 71 Borehole Diesel Abstraction Not Accessible S25.61540 E25.94125 Operates twice a week for 24hrs.
24 Sinkhole-4 72 Sinkholes N/A N/A N/A S25.60427 E25.96519
25 MON-2 73 Borehole None Monitoring 32.59m S25.60469 E25.97163
26 DBH-06 74 Borehole None None None/Full of debris S25.60174 E25.97342 Dried up/abandoned borehole.
27 PBH-16 75 Borehole Windmill None Not Accessible S25.60167 E25.97332 Non-operational windmill
28 Sinkhole-6 76 Sinkholes N/A N/A N/A S25.60637 E25.97775
29 Sinkholes 77 Sinkholes N/A N/A N/A S25.60606 E25.97857 Sinkholes have been filled up.
30 Sinkhole-5 78 Sinkholes N/A N/A N/A S25.60406 E25.98040
Map
No.Field Comments
GPS PositionSite Name
GPS
Waypoint #Site Type Purpose Water LevelEngine

Page 66
The Hydrogeological Relationship Between Recharge, Abstraction and Spring-flow in the Zeerust Dolomitic Aquifer
Latitude Longitude
31 VGS-1 79 Spring N/A Water Provision N/A S25.60343 E25.99097
Uitvlugfontein Spring. Farmer states that flow is much slower at present than in the past. 4 Farmers irrigate
with this water. Farmer states that the farmers could once irrigate 1000ha but can now only irrigate 200ha
32 PBH-15 80 Borehole Unknown Abstraction Not Accessible S25.60600 E26.02142 Feeds two houses, cattle and sheep
33 Pivot Pipe 81 Pipeline N/A Irrigation N/A S25.60472 E26.02142
Pipeline for old 18ha irrigation field 'spulpunt'. Water obtained from irrigation dams that accumulate water
from the Uitvlugfontein Spring
34 Furrow 82 Furrow N/A Irrigation N/A S25.60553 E26.01643 Water furrow running parallel to road
35 DBH-04 83 Borehole None Abstraction Not Accessible S25.59941 E26.02857 Borehole not in use. Abandoned.
36 PBH-10 84 Spring N/A Water Provision N/A S25.64503 E25.95041 Spring has waterworks infrastructure. Cannot determine what equipment is present as kiosks are locked.
37 DBH-05 85 Borehole None None 18.87m S25.60234 E25.97306 Non-functional borehole.
38 PBH-09 86 Borehole Windmill Abstraction Not Accessible S25.65253 E25.95960
39 PBH-12 87 Borehole Electric Abstraction Not Accessible S25.6365 E25.9576
40 PBH-14 88 Borehole Electric Abstraction Not Accessible S25.6081 E26.0187
41 Sinkhole-2 89 Sinkhole N/A N/A N/A S25.660513 E25.994854 Sinkhole next to reservoir. Farmer states that it fell during 2008 when there was a lot of rain. Right next to a
42 Sinkhole-1 90 Sinkhole N/A N/A N/A S25.670552 E25.991771 Deep sinkhole. Estimated at 15m+. Dead chickens thrown therein. Eskom truck almost fell through while
43 MON-03 91 Borehole None Monitoring Not Accessible S25.624182 E25.958377
44 MON-04 92 Borehole None Monitoring Not Accessible S25.616152 E25.958199
45 MON-05 93 Borehole None Monitoring Not Accessible S25.599836 E25.958180
46 MON-06 94 Borehole None Monitoring Not Accessible S25.602433 E25.968609
47 MON-07 95 Borehole None Monitoring Not Accessible S25.599613 E25.973639
48 WBD-01 96 Borehole Electric Supply Not Accessible S25.625079 E25.959835
49 WBD-02 97 Borehole Electric Supply Not Accessible S25.616053 E25.959293
50 WBD-03 98 Borehole Electric Supply Not Accessible S25.610632 E25.958722
51 WBD-04 99 Borehole Electric Supply Not Accessible S25.605237 E25.957714
52 WBD-05 100 Borehole Electric Supply Not Accessible S25.599750 E25.959150
53 WBD-06 101 Borehole Electric Supply Not Accessible S25.601631 E25.959657
54 RPP-01 102 Borehole Electric Supply Not Accessible S25.676205 E25.952299 Meter: 9881345, standing still althouh pump is pumping
55 RPP-02 103 Borehole Electric Supply Not Accessible S25.676480 E25.952153 Broken, hasn't been opened in months.
56 RPP-03 104 Borehole Electric Supply Not Accessible S25.676867 E25.952310 Broken, hasn't been opened in months.
57 RPP-04 105 Borehole Electric Supply Not Accessible S25.676718 E25.952946 Overgrown and unreadable.
58 RPP-05 106 Borehole Electric Supply Not Accessible S25.676287 E25.952754 Meter:5697994 and standing still although pump is pumping.
59 RPP-06 107 Borehole Electric Supply Not Accessible S25.675996 E25.952593 Meter: 0866704. Working.
Map
No.Field Comments
GPS PositionSite Name
GPS
Waypoint #Site Type Purpose Water LevelEngine

Page 67
The Hydrogeological Relationship Between Recharge, Abstraction and Spring-flow in the Zeerust Dolomitic Aquifer
Figure 4-17: Hydrocensus results focussing on borehole survey

Page 68
The Hydrogeological Relationship Between Recharge, Abstraction and Spring-flow in the Zeerust Dolomitic Aquifer
4.3.2.7 Sinkholes
Several sinkholes were pointed out by various land owners in and around the study
area (Figure 4-18). The most notable are the sinkholes that fell recently along the
extended Welbedacht pipeline from the VWF. These sinkholes were first reported in
2011 and made newspaper headlines.
The owners of the farm alleged that the sinkholes formed as a direct result of the new
bulk abstraction from the VWF (see Photo 4-2). However, these sinkholes are located
on the eastern side of a dyke, and along the route of the main supply pipeline that has
been laid underground. The land owners also indicated that the sinkholes were filled
(presumably by Botshelo Water) shortly after forming, without informing them thereof.

Page 69
The Hydrogeological Relationship Between Recharge, Abstraction and Spring-flow in the Zeerust Dolomitic Aquifer
Figure 4-18: Google Earth graphic indicating sinkholes relative to pipeline
Photo 4-2: Land owner pointing out a sinkhole that formed on the extended pipeline

Page 70
The Hydrogeological Relationship Between Recharge, Abstraction and Spring-flow in the Zeerust Dolomitic Aquifer
In the Completion Report conducted on the handover of the VWF (Phumelela, 2008)
nothing is mentioned on the construction methods or guidelines for the laying of the
pipeline, but photo’s indicate blasting of the dolomite was involved. This fractured the
hard rock dolomite, and most probably created new pathways for water to infiltrate
into the subsurface. In the event of a constant supply of water, like a leaking water
pipeline, this source of water can create subsurface erosion of weathered material
into the dolomite cavities to eventually reach the surface as sinkholes. This might
explain why the sinkholes are all aligned along the buried pipeline route.
Other sinkholes were identified during the hydrocensus:
On the farm Rietpoort, some 1600 m southeast of the RWF. This sinkhole
measured some two metres by two metres.
Two other sinkholes were identified on the farm Stinkhoutboom, 1100m and
2200m south of the Stinkhoutboom Spring respectively.
Sinkhole 1 on Stinkhoutboom was found to be of significant size. An Eskom
truck reportedly almost fell into the sinkhole (the sinkhole is located near a
power line). Currently the sinkhole is being used as a dump site for dead
chickens. This creates a point source of bacterial and other contaminants that
pollute the dolomite aquifer.
Sinkhole 2 fell next to a borehole in 2008 after heavy rains. The borehole was
drilled north of a dyke where fractured ground is expected. This sinkhole was
presumably formed by a combination of the constant water table fluctuation
due the pumping of the borehole (and boundary conditions created by the
dyke causing the water table to fluctuate more around the borehole), and
ingress of rainwater. The borehole itself is a preferred pathway for ingress of
surface water as water infiltrates on the outside of the casing into the
borehole.
4.3.2.8 Miscellaneous
The land owners reported that occasionally a strange rumbling sound can be heard in
the area. This sound reminds one of an earthquake, although no seismic activity can
be felt. This sound was apparently also heard by neighbouring farmers. The Council
for Geosciences does not have any record of seismic activity for that period.

Page 71
The Hydrogeological Relationship Between Recharge, Abstraction and Spring-flow in the Zeerust Dolomitic Aquifer
4.4 Conceptual Site Model (CSM)
4.4.1 Preamble
A conceptual model is crucial to the effectivity and accuracy of a model. The
conceptual model includes designing and constructing equivalent but simplified
conditions for the real world problem (Beal and Read, 2013). It’s based on a number
of assumptions that need to be verified in a later stage of the study. The processes
and interactions taking place within the study area that will influence the movement of
groundwater need to be quantified as well as simplifying all assumptions for the
development of a model and the selection of a suitable numerical code.
4.4.2 Study area and groundwater levels
The study area for the conceptual model encompasses the Paardevlei and
Klaarstroom dolomitic compartments. These compartments include the VWF and
UWF as shown in Figure 4-19.
Even though the RWF is discussed in previous sections it does not form part of the
CSM. Also the focus is on the Paardevlei Compartment but as discussed in the
previous sections; abstraction in this compartment is expected to impact the water
levels in the Klaarstroom compartment. The boundaries of the of the study area are
therefore taken as the dolomitic compartments.
A conceptual cross-section through the study area is shown in Figure 4-20. The
associated conceptual groundwater levels are shown in Figure 4-21.

Page 72
The Hydrogeological Relationship Between Recharge, Abstraction and Spring-flow in the Zeerust Dolomitic Aquifer
Figure 4-19: Study Area

Page 73
The Hydrogeological Relationship Between Recharge, Abstraction and Spring-flow in the Zeerust Dolomitic Aquifer
Figure 4-20: Elevation profile over a regional part of the Zeerust Dolomites
Site Position

Page 74
The Hydrogeological Relationship Between Recharge, Abstraction and Spring-flow in the Zeerust Dolomitic Aquifer
Figure 4-21: Conceptual model of the hydraulic relationship between the compartments on a regional scale. Based on the elevation profile in
Figure 4-20
SSE

Page 75
The Hydrogeological Relationship Between Recharge, Abstraction and Spring-flow in the Zeerust Dolomitic Aquifer
4.4.3 Aquifer Characteristics
Water in a fractured/dolomitic rock aquifer flows along fractures, faults, joints, solution cavities
and bedding planes within the rock matrix (Cowell and Ford, 1980).
No aquifer tests were conducted during this study, therefore the aquifer parameters are
discussed in Section 3.4.4.
4.4.4 Groundwater Recharge Calculation
A recharge spread sheet created by Van Tonder and Xu (2001) uses the formulas for CRD
and SVF (see literature review section) to estimate recharge values. Two boreholes were
selected for the recharge estimation calculations. These boreholes are all in relatively close
proximity to the VWF and are also in close proximity to a weather station that has high
confidence rainfall data. One possible limitation was encountered in the fact that the rainfall
station falls outside the boundary of the study area. The rainfall station is still within close
proximity to the borehole cluster and is thus still useable. When the historical rainfall data for
the weather stations in the vicinity was reviewed it was noted that the rainfall data is very
similar, indicating that the rainfall in the area is fairly homogenous.
Water level data is available from January 1977 up until October 1997. However datasets
from October 1980 to September 1982 were chosen as this is the period that the spring data
is most complete.
Rainfall, water level and outflow data are entered into the software opposite the relevant
month. The software then produces a graph for the CRD and SVF methods. The observed
water levels are then fitted to the calculated water levels by means of adjusting recharge,
specific yield and inflows. The recharge slide-bar is set to a default of zero. The bar is then
manually moved until a satisfactory “best-fit” is achieved between the rainfall and recharge
values (see Figure 4-22 and Figure 4-23). The Route Mean Square Error (RMSE) value
provides an indication of “best-fit”. The results of the calculations are documented in Table 6.

Page 76
The Hydrogeological Relationship Between Recharge, Abstraction and Spring-flow in the Zeerust Dolomitic Aquifer
Figure 4-22: SVF (A3N0017)

Page 77
The Hydrogeological Relationship Between Recharge, Abstraction and Spring-flow in the Zeerust Dolomitic Aquifer
Figure 4-23: CRD (A3N0017)
Table 6: Results of Recharge Estimates
Borehole
SVF CRD Time lag
Recharge
(%)
Specific
yield
Inflow
(m3/d)
RMSE Recharge
(%)
Specific
yield
Inflow
(m3/d)
RMSE
A3N0017 9.3 0.018 17200 0.168 9.4 0.019 17200 0.166 Water levels were shifted by 3 months
A3N0016 9.8 0.02 17200 0.160 10 0.019 17200 0.168 Water levels were shifted by 3 months
The graphs for A3N0016 are attached as Appendix C.
4.5 Modelling
4.5.1 Analytical approach
The analytical approach followed is based on the SVF method and is essentially a water
balance. The equation used in this calculation is defined below:

Page 78
The Hydrogeological Relationship Between Recharge, Abstraction and Spring-flow in the Zeerust Dolomitic Aquifer
Where I = that is, the mean lateral inflow during the time increment ∆t;
O = that is the average lateral outflow from the system;
RE = groundwater recharge to the aquifer system, which is the unknown parameter
to be estimated
Q = net discharge or abstraction from the groundwater system
∆V = change in saturated volume of the aquifer; and
∆t = that is, the time increment over which the water balance is executed.
4.5.1.1 Calibration
An initial recharge of 9.6 per cent was assigned to the model. This value is the average of the
values documented in Table 6. Spring-flow data, water levels and rainfall data were used for
the period Oct 1980 to May 1983 for the calibration. A specific yield of 0.015 was used for the
model, this figure is based on previous work done by Aquisim (2002). The results of the
calibration are shown in Figure 4-24. The location of the springs and dykes are shown in
Figure 4-19. Lag times have been included in the calibration.

Page 79
The Hydrogeological Relationship Between Recharge, Abstraction and Spring-flow in the Zeerust Dolomitic Aquifer
Figure 4-24: Calibration
Please note: A3H011is the Vergenoegd Spring, A3H021 is the Upper Paardenvallei Spring and A3H022 is the lower Paardenvlei Spring.
4.5.1.2 Impacts
Once the model was calibrated the impacts of the VWF on the Upper Paardenvallei, Lower
Paardenvallei and Vergenoed Springs. The following sections illustrate:
1. Spring-flow and rainfall with no abstraction present
2. Abstraction included in the system
3. Abstraction included in drought conditions (reduced precipitation recharge
component)
The spring-flow was plotted together with the associated recharge conditions, without any
abstraction present. Figure 4-25 illustrates that there is also approximately a 6 month time lag
between recharge events until being observed in spring-flow which reaffirms the relationship
between recharge and spring-flow in the study area.
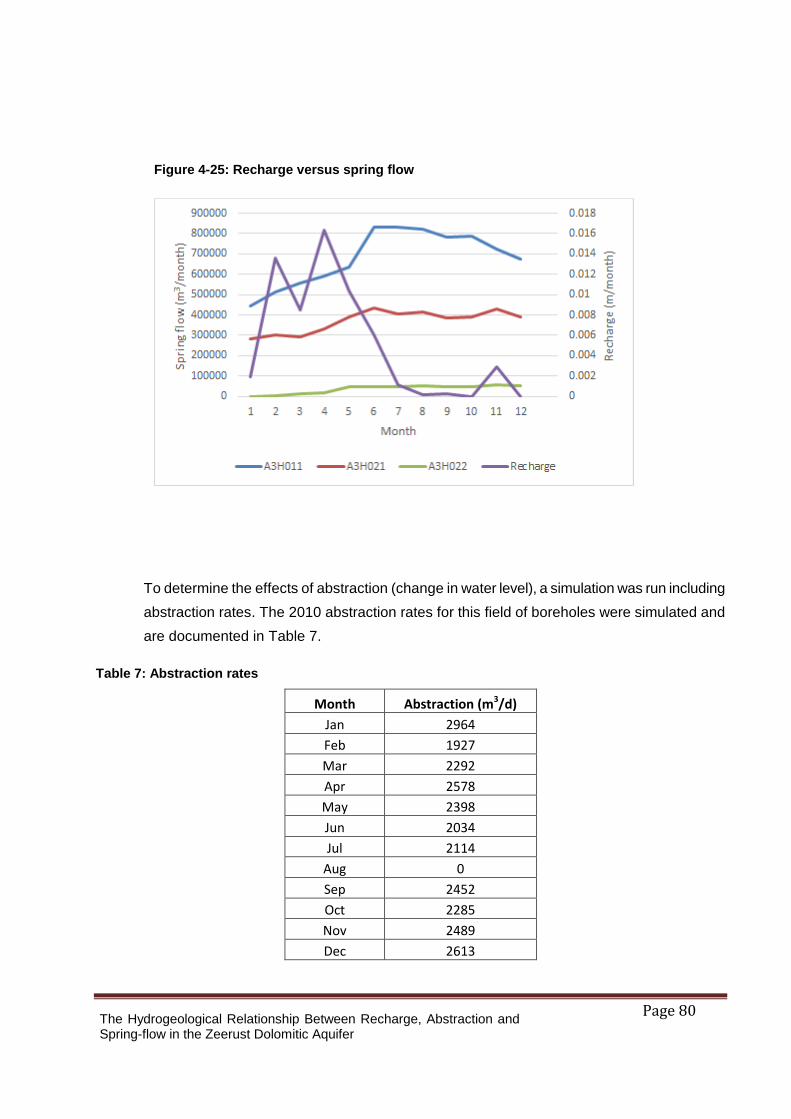
Page 80
The Hydrogeological Relationship Between Recharge, Abstraction and Spring-flow in the Zeerust Dolomitic Aquifer
To determine the effects of abstraction (change in water level), a simulation was run including
abstraction rates. The 2010 abstraction rates for this field of boreholes were simulated and
are documented in Table 7.
Table 7: Abstraction rates
Month Abstraction (m3/d)
Jan 2964
Feb 1927
Mar 2292
Apr 2578
May 2398
Jun 2034
Jul 2114
Aug 0
Sep 2452
Oct 2285
Nov 2489
Dec 2613
Figure 4-25: Recharge versus spring flow

Page 81
The Hydrogeological Relationship Between Recharge, Abstraction and Spring-flow in the Zeerust Dolomitic Aquifer
A challenge arose with regards to relating spring-flow to the change in water level, so that the
effects of abstraction can be simulated. This was overcome by plotting the simulated spring-
flow (scenario 1) against the change in simulated water level as shown in Figure 4-26. A high
correlation was achieved and a relationship could be determined. The results of results of the
scenario are shown in Figure 4-27. The figure illustrates a clear effect of abstraction on the
groundwater levels and spring-flow.
Figure 4-26: Relationship between water level and spring-flow

Page 82
The Hydrogeological Relationship Between Recharge, Abstraction and Spring-flow in the Zeerust Dolomitic Aquifer
Figure 4-27: Impacts of abstraction
The third and final scenario is identical to scenario 2, except drought conditions are
simulated. The rainfall is dropped to a third of normal conditions to simulate the drought
conditions. The results of this scenario are shown in Figure 4-28. This scenario is based on
the assumption that it is only the recharge from rainfall that changes (reduced recharge).
Please note an average water level for the area was used in this simulation.

Page 83
The Hydrogeological Relationship Between Recharge, Abstraction and Spring-flow in the Zeerust Dolomitic Aquifer
Figure 4-28: Results of Scenario 3
When all three scenarios of the model are compared, a few things become evident and some
conclusions can be made. Firstly, the confidence in the simulation is fairly high as the
scenarios are in-line with the conceptual understanding of the area and they also closely
mimic known conditions. This in-turn reaffirms that the recharge value of 9.5 per cent
calculated in the CRD section is correct for this study area. If the recharge value was off,
issues would have arisen during the model’s calibration process, which they did not.
In conditions where no abstraction is present, the water levels react in relation to the quantity
of precipitation received within the model’s boundary. This recharge only manifests and
becomes visible in spring-flow approximately three months later. When abstraction is added
to the system, the relationship between recharge, spring-flow closely mimics the results
obtained in the natural conditions.
The relationship is evident again when drought conditions are simulated – when there is a
reduction, this is a directly correlated reduction in spring-flows.
4.5.2 Data availability
Previous reports have indicated that data availability is a concern. The same theme repeated
itself during the modelling phase.

Page 84
The Hydrogeological Relationship Between Recharge, Abstraction and Spring-flow in the Zeerust Dolomitic Aquifer
Data are needed to assess the performance of borehole fields and the impact they have on
the aquifer and surrounding geohydrological environment on both short and long term bases
(see Appendix D on groundwater management in South Africa). Although the data was
sufficient to populate and calibrate a model when the patched rainfall and spring-flow data
was used to simulate the relationship between the three major components of this aquifer,
there is a definite need for enhanced monitoring in this area especially when the demand on
this aquifer is considered.
5 CONCLUSIONS
Monitoring data are sparse. The lack of continuous monitoring data makes data
interpretation challenging and can lead to compromised conclusions about short term
fluctuations. There is a need for more reliable data in this area as well as an
enhanced monitoring protocol.
Based on DWA’s published ‘dolomite guideline’ (see Appendix B) on assessing,
planning and managing water resources in dolomitic areas of South Africa (DWA,
2006), as well as the findings of this investigation it can be concluded that:
The methodology used to investigate the relationship between abstraction, recharge
and spring-flow with regards to aquifer parameters such as recharge was effective
and similar results obtained were in-line with previous studies’ results.
The VWF was hydrogeologically well assessed and planned, but the management of
the borehole field is compromised by the lack of proper and on-going monitoring of
both the abstraction volumes and water levels.
When the available monitoring data is evaluated and run in the analytical model, it
can be deduced that there is a seasonal fluctuation in water levels. This fluctuation is
as a result of the precipitation variations between wet and dry months.
Based on the available monitoring data, including spring-flow and groundwater level
data, it can be concluded that the VWF’s abstraction might show a long term impact
on the aquifer.

Page 85
The Hydrogeological Relationship Between Recharge, Abstraction and Spring-flow in the Zeerust Dolomitic Aquifer
There exists a large correlation between recharge, abstraction and spring-flow in a
Dolomitic aquifer with a time-lag between recharge events and being observed in
spring-flow increases (2 - 3 months in the case of this study area) and that the
reduction in spring-flow in the Zeerust area can be due to reduced recharge and/or
over abstraction.
Stemming from the analytical model, abstraction has a marked influence on the
groundwater levels and associated spring-flow, especially when drought conditions
are simulated. From the recharge calculations and subsequent modelling, it can be
deduced that there is a definite relationship between the recharge, abstraction and
spring-flow components. It is also apparent that these factors influence one another
greatly and that variance in one of the inputs will have a significant effect on the rest
and will change the system’s response significantly while still maintaining direct
correlation due to the strong relationship.

Page 86
The Hydrogeological Relationship Between Recharge, Abstraction and Spring-flow in the Zeerust Dolomitic Aquifer
6 RECOMMENDATIONS
NMMDM as the Water Services Authority and DWA as the custodians of water
resources in South Africa are mandated to ensure that proper monitoring is done.
This includes monitoring of the abstraction volumes, groundwater levels and
spring-flows from the affected compartment. To ensure the continuous
monitoring of the abstraction borehole fields, the monitoring can be outsourced
on a tender basis to external contractors. The monitoring reports must be audited
annually.
Other than this study, there are no data to prove that the abstraction does not
adversely affect the spring-flow from the Vergenoegd Eyes, and the farmers
might be entitled to compensation due to loss of income. This issue must be
investigated further on a legal basis.
Monitoring of the spring-flow from the Vergenoegd Eyes must be reinstated as a
matter of priority.
The management of the VWF must be audited on a catchment and national level
as per the ‘dolomite guideline’. The lack of proper and continuous monitoring
data being the most important factor hindering proper management must be
addressed.
Once monitoring data collection has been reinstated and a sufficient amount of
time series data has once again been recorded, a similar research study to this
should be completed. This would improve upon the quantification methods and
would be initiated by conducting another comprehensive hydrocensus in which
important data and observations should be made. Any changes to the area
should be noted and recorded. It would be beneficial to conceptualise the system
if changed and based thereupon, run another numerical model to determine if the
correlation between recharge, abstraction and spring-flow has changed and if so,
to what extent.

Page 87
The Hydrogeological Relationship Between Recharge, Abstraction and Spring-flow in the Zeerust Dolomitic Aquifer
7 REFERENCES
AGES, 2010. Initial Groundwater Status Assessment of the dolomitic aquifer underlying the
Vergenoegd Well Field south west of Zeerust. (Report prepared for Cornelius Durand Attorney’s
Office by JJ Smit p. 10–55).
AGES, 2013. Integrated Groundwater Assessment. Assessment of the Vergenoegd wellfield bulk
groundwater abstraction on the environment. (Report prepared for Cornelius Durand Attorney’s Office
by JJ Smit p. 3-97).
Africon, 2002. Final Report on the Evaluation of the Groundwater Resources at Uitvalgrond 60 Jo,
Zeerust. Pretoria. p. 3–84.
Aquisim, 2002. Determination of Aquifer Abstraction Potential of the Uitvalgrond Dolomitic Area near
Zeerust. Report submitted to Africon. Report No. AQS/Africon/2002/001. Aquisim, 2002. Welbedacht
Bulk Water Supply: Numerical Modelling of Groundwater Potential – 2005 Model Update. Report
submitted to Khulani GeoEnviro Consultants (Pty) Ltd. Report No. AQS/KHULANI/2005/001. Pretoria.
p. 16-43.
Beale, G. & Read, J. 2013. Guidelines for evaluating water in pit slope stability. Australia: CSIRO. p.
153-215.
Botha, L.J. 1993. Estimation of the Zeerust/Rietpoort groundwater potential. GH 3815 Report.
Pretoria: Directorate of Geohydrology. p. 18-25.
Bredenkamp, D.B., Botha, L.J., van Tonder, G.J. & Janse van Rensburg, H. 1995. Manual on
quantitative estimation of groundwater recharge and aquifer storativity. Pretoria. p 73-351.
Bredenkamp, D.B & Vogel, J.C. 2007. Use of natural isotopes and groundwater quality for improved
estimation of recharge and flow in dolomitic aquifers. Water Research Commission Report No. KV
177/07, Water Research Commission, Pretoria. p. 35-53.
Bredenkamp, D.B. 2009. Groundwater Recharge and Mean Residence Time in Dolomitic Aquifers
using the Thermo-nuclear injected 14C as a Natural Tracer. Pretoria. p. 1-12.
Bredenkamp, D.B. 2010. Flow in Dolomitic Aquifers Using the Thermo-Nuclear 14C Isotope Injected
into the Atmosphere as a Tracer. Pretoria. p. 36–47.

Page 88
The Hydrogeological Relationship Between Recharge, Abstraction and Spring-flow in the Zeerust Dolomitic Aquifer
Brink, D. 1992. Zeerust Grawitasie en Elektromagnetiese Ondersoek. DWAF Report GH3770.
Pretoria. p. 1-6.
Buttrick, D. & Van Schalkwyk, A. 1998. Hazard and Risk Assessment for Sinkhole Formation on
Dolomite Land in South Africa. Germany: Springer-Verlag. p. 9-18.
Button, A. 1970. The Stratigraphic History of the Malmani Dolomite in the Eastern and Northeastern
Transvaal. Johannesburg: Economic Geology Research Unit, University of the Witwatersrand. p. 1-
26.
Clay, A.N., 1981. The Geology of the Malmani Subgroup in the Carletonville Area, Transvaal.
Johannesburg: University of the Witwatersrand. p. 55-61.
Coetzee, H.P.A., 1996. The Stratigraphy and Sedimentology of the Black Reef Quartzite Formation,
Transvaal Sequence, in the area of Carletonville and the West-Rand Goldfields. Potchefstroom:
University for Christian Higher Education. p. 9-71.
Cowell, D.W. & Ford, D.C. 1980. Hydrochemistry of a Dolomite Karst: The Bruce Peninsula of
Ontario. Canada: Burlington. (17)520-526.
Dooge, J.C.I. 1973. Linear theory of hydrologic systems: U.S. Department of Agriculture Technical
Bulletin. Washington: US Government Printing Office. p 290-329.
Dreiss, S. 1982. Linear kernels for karst aquifers: Water Resources Research. 18(4)865–876.
Dreiss, S.J. 1983. Linear unit-response functions as indicators of recharge areas for karst springs:
Journal of Hydrology. American Geophysical Union. p. 31–44.
Dreiss, S.J. 1989. Regional scale transport in a karst aquifer, Linear systems and time moment
analysis: Water Resources Research. p. 126–134.
DWA, 2011. North West Groundwater Master Plan. Pretoria: Department of Water Affairs and
Forestry. p. 10–24.
DWAF, 1999. Inspection of Molopo River and report of inspection of Zeerust Springs. Report No.
GH3357 (II). Pretoria: Department of Water Affairs and Forestry. p. 6–15.
DWAF, 2006. Vaal River System: Large bulk water supply reconciliation strategy, Groundwater
assessment: Dolomite aquifers. Pretoria :Department of Water Affairs and Forestry. p. 19–22.

Page 89
The Hydrogeological Relationship Between Recharge, Abstraction and Spring-flow in the Zeerust Dolomitic Aquifer
DWAF, 2006a. A Guideline for the Assessment, Planning and Management of Groundwater
Resources within Dolomitic Areas in South Africa: Volume 1 – Conceptual Introduction. Pretoria:
Department of Water Affairs and Forestry. p. 9-18.
DWAF, 2006b. A Guideline for the Assessment, Planning and Management of Groundwater
Resources within Dolomitic Areas in South Africa: Volume 2 – Process and Related Activities.
Pretoria: Department of Water Affairs and Forestry. p. 25–33.
DWAF, 2006c. A Guideline for the Assessment, Planning and Management of Groundwater
Resources within Dolomitic Areas in South Africa: Volume 3 – Procedures. Pretoria: Department of
Water Affairs and Forestry. p. 5–15.
DWAF, 2008. A Guideline for the Assessment, Planning and Management of Groundwater
Resources in South Africa. Pretoria: Department of Water Affairs and Forestry. p. 5–7.
Freeze, R.A. & Cherry, J.A. 1979. Groundwater. New Jersey: Prentice-Hall International. p. 604-607.
Girish, C.S. & Joshi, V. 2004. Rainfall and Spring Discharge Patterns in Two Small Drainage
Catchments in the Western Himalayan Mountains, India. Netherlands: Springer. p. 19-30.
Goldbury-Murray. 2010. Groundwater terms and Definitions. p. 6-15.
Hammett, K.M. 1990. Land Use, Water Use, Streamflow Characteristics, and Water Quality
Characteristics of the Charlotte Harbor Inflow Area. Oklahoma: U.S. Geological Survey. p. 64-65.
HES (Hydrologic Evaluation Section). 2003. Long-term variation in Rainfall and its effect on Peace
River Flow in West-Central Florida. p. 1-33.
Hughes, D.A. 2004. Incorporating groundwater recharge and discharge functions into an existing
monthly rainfall-runoff model. South Africa: Taylor & Francis. Hydrological Sciences Journal. p. 297-
311.
Khulani, 2006. Proposal for Abstraction of groundwater for Bulk Water Supply Augmentation in
Welbedacht Reservoir in the Zeerust Local Municipality, North West Province of South Africa: Final
Scoping Report. Reference No. EIA_507/2005NW_Zeerust/KGC_FSR_002. East London, South
Africa. p. 21-33.
Khulani, 2008. Welbedacht Bulk Water Supply: Groundwater Resource Augmentation – Phase 2.
Report submitted to Phumelela Africa Professional Engineers (Pty) Ltd. Report No. 2008-0233. April
2008. East London, South Africa. p. 17-26.

Page 90
The Hydrogeological Relationship Between Recharge, Abstraction and Spring-flow in the Zeerust Dolomitic Aquifer
Lewelling B.R., Tihansky, A.B. & Kindinger, J.L. 1998. Assessment of the Hydraulic Connection
between Ground Water and the Peace River. Oklahoma: U.S. Geological Survey Water Resources
Investigations Report 97-4211. p. 96-97.
Marshall, T.R. & Norton, G.A. 2009. The nature of the alluvial diamond deposits of the Ventersdorp
district, Northwest Province, South Africa. Pretoria: South African Journal of Geology, 112(2): 109-
124.
Masilo and Associates. 2011. Final EIA Audit Report. Report submitted to Thekgano Trading.
Fancistown, Botswana. p. 15-55.
National Weather Service. 2009. Point Precipitation Measurement Areal Precipitation Estimates and
Relationships to Hydrologic Modeling. Arkansas. p. 1-2.
Obbes, A.M. 1995. The Structure, Stratigraphy and Sedimentology of the Black Reef-Malmani-
Rooihoogte Succession of the Transvaal Supergroup Southwest of Pretoria. Pretoria: Council for
Geoscience. p. 1-89.
Paul, E. 1996 Calibration and reliability in groundwater modelling. Golden: IAHS Publication (237).
31–40.
Phumelela, 2008. Welbedacht Bulk Water Augmentation. Contract No: MIG/NW/0604/S/07/08.
Report submitted to Ngaka Modiri Molema District Municipality by Phumelela Africa Professional
Engineers. p. 16-42.
South African Council for Stratigraphy (SACS). 1980. Stratigraphy of South Africa, Part 1.
Lithostratigraphy of the Republic of South Africa , South West Africa / Namibia, and the Republics of
Bophuthatswana, Transkei and Venda. p. 686-690.
Stogner, R.W. 2000. Trends in Precipitation and Stream-flow and Changes in Stream Morphology in
the Fountain Creek Watershed, Colorado. p. 2-34.
Taylor, C.J. & Greene, E.A. 2008. Hydrogeologic Characterization and Methods Used in the
Investigation of Karst Hydrology. Oklahoma: US Geological Survey. p. 77-106.
Thomas, B.E. & Pool, D.R., 2006. Trends in streamflow of the San Pedro River, southeastern
Arizona, and trends in precipitation and streamflow in northwestern New Mexico and southeastern
Arizona: Oklahoma: U.S. Geological Survey. p. 79.
Van Tonder, G.J. & Xu, Y. 2001. The estimation of recharge using a revised CRD method. Pretoria:
Department of Water Affairs and Forestry. p. 341-343.

Page 91
The Hydrogeological Relationship Between Recharge, Abstraction and Spring-flow in the Zeerust Dolomitic Aquifer
Zhang, Y.K. & Bai of spring discharge charge from a limestone aquifer in northeastern Iowa.
Oklahoma: US Geological Survey. p. 71-86.

Page 92
The Hydrogeological Relationship Between Recharge, Abstraction and Spring-flow in the Zeerust Dolomitic Aquifer
8 APPENDIX A: DETAILED DISCUSSION OF PREVIOUS WORK
8.1 Historical Work
The significant groundwater potential of the North West dolomites in the Zeerust Area
was realised as early as 1906 when the first report on the water potential of the
numerous springs in the area was submitted to the government. the potential for large
scale groundwater supply was also recognised (Enslin and Kriel, 1967). Since then
many studies were commissioned on various levels to investigate the potential of
supplying bulk municipal water from the dolomite, as well as the impacts thereof.
These reports were sourced from the Geohydrological Report Archive of DWA to
investigate the geohydrological character of the area prior to the development of the
VWF (see Table 8). Not all reports were relevant to the study. Only relevant data and
findings will be listed and discussed.

Page 93
The Hydrogeological Relationship Between Recharge, Abstraction and Spring-flow in the Zeerust Dolomitic Aquifer
Table 8: List of historical reports obtained from DWA’s archives
Report No Date Title Author(s)
GH3357 (II) 1906/10/10 Report of inspection of Zeerust Springs Mr. Karlson
GH0149 1937/07/21 Boring for water, Zeerust District: Native Affairs Dpt NP de Wet
GH0005 1946 Boorplekke vir padkampe in Zeerusdistrik JJ Taljaard
GH0904 1954/01/05
Opname van Waterbron te Rietpoort 95 Munisipaliteit van
Zeerust FW Schumann
GH0956 1955/04/30
Munisipaliteit Zeerust: Opname van Waterbron te Rietpoort
95, Marico FW Schumann
GH0983 1956/09/08
Verslag oor Pomptoets van Boorgat Nr. 6 Klein Marico's Poort
Nr. 71, Munisipaliteit Zeerust JR Vegter
GH1268 1960/09/13
Grondwqatervoorrade in die Dolimiet, Omgewing van Zeerust,
Transvaal JF Enslin
GH0151 1961/05/14
Report on pumping test of an excavation for the municipality
of Zeerust on the Farm Vergenoegd, 3. JF Gordon-Welsh
GH1283 1964/05/16 Die Bo-Molopo Ondergrondse Waterbeheergebied DB Bredenkamp
GH1278 1965
Report on the weakening of the Vergenoegd Spring - Distr.
Marico PT Wilson
GH3293 1975/02/28
Aanbevelings vir 'n beleid van grondwatertoekenning in die Bo-
Molopo Ondergrondse Waterbeheergebied
WL van Wyk, MP
Mulder
GH2.2(2) Sep-81
Investigation and conceptual design of a fluorspar tailings
disposal complex Summary Report
GI McPhail, ME
Smith, J Robbertze
GH3395 1981/07/31
Studie oor die voorkoms en vloei van fonteine in die Bo-
Molopo OWBG JL Muller
GH3602 1988/10/06
Ondersoek na beweerde invloed van die Bo-Molopo
Staatswaterskema op die Olievendraai Fontein van die
Rietvallei/Weltevrede Besproeiingsraad DB Bredenkamp
GH3603 Oct-88
Ontginning van die Rietpoort Grondwaterbron wat Zeerust van
water voorsien
DB Bredenkamp, A
Zwarts
GH3770 Apr-92 Zeerust Gravitasie en Elektromagnetiese ondersoek D Brink
GH3815 Aug-93 Estimation of the Zeerust/Rietpoort Groundwater Potential LJ Botha
GH3948 Mar-00
Drilling results of Boreholes Drilled in the Bo-Molopo
Dolomites JM Nel
8.1.1 GH3357 (II) (Karlson, 1906)
This is an inspection report from 1906 of the “Zeerust Springs” and includes
discharge volumes in gallons per day for the majority of the springs surveyed.
The report mentions the Rietvlei Springs, presumably upstream of Kafferkraal which
do no longer exist. Mention is also made of the discharge of the Buffelshoek Spring
that “dwindled down to nothing” during the six months prior to the report, forcing the
people from Jacobsdal downstream to leave the area.

Page 94
The Hydrogeological Relationship Between Recharge, Abstraction and Spring-flow in the Zeerust Dolomitic Aquifer
The Vergenoegd Springs are mentioned as being the largest springs in the valley with
a combined discharge of 1 020 000 gallons/day (4 637 m3/d). The Kareespruit Spring
on Tweefontein Klaarstroom eye discharges 80 000 gallons/day (364 m3/d), but this
spring is reported to have been much larger prior to 1906 and has been opened up to
increase flow.
The Malmani Spring (eye) is reported to yield more than 4.2 million gallons of water
per day (19 094 m3/d), while six months prior it was measured at 5 million gallons (22
730 m3/d).
Tweefontein Spring is mentioned as a small spring discharging 110000 gallons (500
m3/d) while the Linokana (Dinokana) Spring discharges 2140000 gallons
(9 729 m3/d).
Furthermore the Rietpoort Spring is mentioned but was not measured, and the
Paardenvallei Spring is reported to have dried up.
8.1.2 GH0904 (Schumann, 1954)
This report was submitted in 1954 to the Geological Survey on the water resources at
Rietpoort 95 (96 JO) as a possible augmentation source to the town of Zeerust. This
investigation surveyed the geology and topography of the area. The report contains
elevations (in feet above sea level, measured with a barometer) of the main springs
as well as discharge yields in cubic feet per second (cusec).
8.1.3 GH0983 (Vegter, 1956)
Although not in the immediate area under investigation, this report mentions low water
levels in 1951 to the south-east of Zeerust (not on dolomite). According to the report
the average rainfall for the Zeerust area between 1921 and 1950 is 600 mm/a, while
the rainfall between 1949 and 1951 dropped to 503 mm/a, and in the 1951/2 season
only 377 mm was registered. Table 9 summarises rainfall measured at the Zeerust
jail.

Page 95
The Hydrogeological Relationship Between Recharge, Abstraction and Spring-flow in the Zeerust Dolomitic Aquifer
Table 9: Rainfall measured at Zeerust Jail
Season Rainfall (mm/a)
1949-50 503
1950-51 503
1951-52 377
1952-53 610
1953-54 614
1954-55 601
1955-56 624
The lower water table is attributed to the lower than average rainfall.
8.1.4 GH1268 (Enslin, 1960)
Continuing on previous work, this report contains a similar table (Table 10) with
elevations and more refined discharge rates for the various dolomitic springs. It also
ventures to predict a preliminary safe yield from the dolomites by assuming a
groundwater recharge percentage of 6% (based on work on the Far West Rand gold
fields dolomite) of the rainfall of ~21.6 inches (549 mm/a).
Table 10: Summary of data from Report GH1268
Report GH1268
Spring Height (fasl) Yield (cusec) Height (mamsl) Yield (L/s) Comment
Linokana upper eye 4422 3.36 1348 95.1 (Dinokana Upper)
Linokana lower eye 0.9 25.5 (Dinokana Lower)
Tweefontein upper eye 0.53 15.0
Tweefontein lower eye 0.42 11.9
Klaarstroom 0.13 3.7
Vergenoegd 4527 1.47 1380 41.6
Paardevlei 4526 0.6 1380 17.0
Doornfontein 4587 0.4 1398 11.3
Kafferkraal 4575 0.71 1394 20.1 Now called Kraalfontein
Stinkhoutboom 4572 0.55 1394 15.6 Elevation between 4582 and 4562
Rietpoort 4626 2 1410 56.6
Buffelshoek 4606 1.47 1404 41.6
Malmani eye 4810 5.50 1466 155.7 Yield between 5 and 6 cusec
Molopo eye 4810 3.00 1466 85.0 Yield between 2 and 4 cusec
Grootfontein 4741 4.10 1445 116.1
ConvertedOriginal Data
8.1.5 GH0151 (Gordon-Welsh, 1961)

Page 96
The Hydrogeological Relationship Between Recharge, Abstraction and Spring-flow in the Zeerust Dolomitic Aquifer
A pumping test on an excavation on Vergenoegd 3 was performed in May 1961.
Water was encountered in the surface alluvium (sand and boulders) and the
excavation did not penetrate the hard bedrock, which is described as shale and
quartzite.
8.1.6 GH1283 (Bredenkamp, 1964)
The report mentions the proclamation of the “Bo-Molopo Ondergrondse
Waterbeheergebied” or ‘subterranian water control area’. Although the map indicating
the area could not be sourced, it could be deduced from the report that this area falls
south of the area under investigation. Several springs to the south of the area are
mentioned.
The report found a correlation between the water levels, the abstraction of dolomitic
water and the average rainfall between September 1958 and June 1964. It also found
a steady decrease in water levels in three separate compartments between 1958 and
1961, based on below average rainfall. After good rains in 1961 the levels recovered
drastically.
No conclusive evidence could be found that the increasing groundwater abstraction
(due to a significant increase in boreholes) in the Blaauwbank area was affecting the
Grootfontein Spring. The report states that water level measurements are
incomplete, and abstraction figures are insufficient – and that both are of great
importance to determine the safe yield of compartments.
8.1.7 GH1278 (Wilson, 1965)
A geohydrological survey was carried out in February of 1965 into the ‘extreme
weakening of the flow from the spring at Vergenoegd No. 3’. The matter was brought
to the attention of Water Affairs by Mr Cornelis Hogendyk of the farm Uitvlucht 63,
who alleged that it was a direct result of excessive pumping on the farm Kafferkraal
93 (by Mr. Konie Snyman) and Doornfontein 289 (by the Zeerust Municipality).
During this survey the levels of the spring outlets were re-determined, the water levels
in observation boreholes were measured and the bounding dyke to the north of the
Vergenoegd compartment was delineated using geophysical techniques.

Page 97
The Hydrogeological Relationship Between Recharge, Abstraction and Spring-flow in the Zeerust Dolomitic Aquifer
Flow data for certain springs were obtained from Water Affairs, while others were
estimated. The report gives names to the various compartments, and discusses them
in terms of spring-flow and geological characteristics:
Tweefontein – Klaarstroom Compartment
The northern most compartment is called the Tweefontein – Klaarstroom
compartment. The northern boundary is a WSW-striking dyke inferred from aerial
photography, causing the Tweefontein springs to emerge. The southern boundary is a
diabase dyke striking E-W through the northern portion of Doornfontein 289 and the
southern portion of Wolwekoppies 104. Although the continuity of the dyke appears to
be broken, the water levels on Doornfontein 289 and Olyfenbult 30 indicate separate
groundwater bodies. The groundwater gradient in this compartment is towards the
northeast where the springs discharge.
Spring-flow for June 1960 and January 1965 were compared for the springs in this
compartment and illustrated in Table 11, and a decrease in spring-flow of between 50
and 74 % was observed:
Table 11: Spring-flow for June 1960 and January 1965
Jun-60 Jan-65
Tweefontein Upper* 0.53 0.14 74
Tweefontein Lower* 0.38 0.16 58
Klaarstroom Spring* 0.12 0.06 50
*Measured flow
Percentage
decreaseSpring Name
Flow in cusec
The Vergenoegd – Paardenvallei Compartment
This compartment lies south of the Tweefontein – Klaarstroom Compartment and is
the compartment referred to above. The southern bounding dyke strikes across the
central part of Doornfontein 289 and Kafferkraal 93, and the south-western portion of
Paardenvallei 62 into Stinkhoutboom 269.
The springs all occur in the eastern portion of the compartment, and therefore depend
on a groundwater gradient from west to east. Water level measurements confirmed
this gradient in the report, which also states that a flattening and in fact a cone of
depression is observed around the two new Zeerust supply boreholes near the
Kafferkraal – Paardenvallei boundary.

Page 98
The Hydrogeological Relationship Between Recharge, Abstraction and Spring-flow in the Zeerust Dolomitic Aquifer
Table 12: Measured points
The locations of the boreholes mentioned in Table 12 above could not be determined,
but it can be seen that the borehole near the Kafferkraal – Paardenvallei boundary to
the west of the Paardenvallei Spring, has a lower water table than the spring itself,
causing the author to interpret a cone of depression around the points of abstraction.
Furthermore the decrease in spring-flow in Vergenoegd Spring can be seen here,
while the Paardenvallei Spring ceased flowing completely.
The abstraction figures from this compartment were added as an addendum to the
report. Three boreholes on Doornfontein were developed between 1961 and 1963.
Each pumped 0.07 cusec (2.0 L/s), totalling 6.0 L/s. The Zeerust supply boreholes on
Kafferkraal are listed as delivering a combined volume of 0.19 cusec (5.4 L/s) since
December 1964. Therefore the total abstraction from these five boreholes amounts to
11.4 L/s.
The Doornfontein – Kafferkraal Compartment
This compartment is bounded to the north by the southern bounding dyke of the
Vergenoegd – Paardenvallei Compartment, and to the south by the Rietpoort Dyke
across the central parts of Rietpoort 95 and Stinkhoutboom 269. Three groups of
springs exist on the northern boundary (i.e. the Doornfontein-, Kafferkraal- and
Stinkhoutboom Springs) indicating a general hydraulic gradient from SW to NE. The
spring elevations and flows from the report are documented in Table 13.

Page 99
The Hydrogeological Relationship Between Recharge, Abstraction and Spring-flow in the Zeerust Dolomitic Aquifer
Table 13: Measuring points
WL
fasl Jun-60 Jan-65
Doornfontein Spring* 4585 0.4 0.01 98
Kafferkraal Spring* 4575 0.7 0.03 96
Stinkhoutboom Spring** 4562 0.55 0.32 42
* Measured flow
** Estimated flow
Flow in cusec Percentage
decreaseMeasuring Point
It can be noted that the topographically higher springs experienced a more severe
decrease in flow than the lowest outlet of the compartment, the Stinkhoutboom
Spring. Having said that, the report also mentions the possibility that the Golden Calf
quartz vein, which strikes NNE between the Kafferkraal and Stinkhoutboom Springs,
can act as a groundwater barrier creating sub-compartments.
The Rietpoort – Buffelshoek Compartment
This compartment occurs south of the Rietpoort Dyke and is probably bounded in the
south by the parallel dyke that runs through Ottoshoop.
Table 14: Springs
Water level
fasl Jun-60 Jan-65
Rietpoort Spring** 4626 2 1 50
Buffelshoek Spring** 4606 1.5 1.11 26
** Estimated flow
Spring NameFlow in cusec Percentage
decrease
The springs in this compartment shows a much smaller decrease in flow compared to
the springs in the compartments to the north. Nevertheless, the Rietpoort Spring has
weakened to such a level that augmentation from the Kafferkraal boreholes was
required.
The report concluded the following:
In general there was a weakening in spring-flow at the time of the report
(1965) since records were started in June 1959. This is attributed to a ‘lack of
natural recharge of the past few years’, although rainfall figures are not given.
The water level in the Vergenoegd – Paardenvallei compartment is flat,
indicating a ‘system of relatively freely connected underground openings’.

Page 100
The Hydrogeological Relationship Between Recharge, Abstraction and Spring-flow in the Zeerust Dolomitic Aquifer
Indications were that heavy pumping on Kafferkraal 93 and the eastern
portion of Doornfontein 289 caused a cone of depression, reversing the flow
away from the Vergenoegd Spring in the absence of recharge. It was doubtful
that this effect was influencing the flow of the spring at the time of Mr.
Hogendyk’s complaint, but the author had ‘little doubt’ that this situation would
affect the Vergenoegd Spring-flow if continued, seeing that the Paardenvallei
Spring ceased flowing.
The flow of the Doornfontein and Kafferkraal Springs which under natural
circumstances overflow into the Vergenoegd – Paardenvallei Compartment,
was almost nil at the time of the survey, indicating a drop in the water level in
this compartment. This is partly ascribed to the harvesting of water at
Rietpoort for Zeerust’s supply. The Rietpoort Spring overflows into the
Doornfontein – Kafferkraal Compartment under natural conditions.
The decrease in flow in the springs in the Rietpoort Compartment (Rietpoort-
and Buffelshoek Springs), was less than the springs in the compartments to
the north. This is explained by the fact that the Rietpoort Compartment is
greater in size than the others, giving rise to greater proportional recharge
from rainfall.
The weakening of the springs in the Vergenoegd – Paardenvallei
Compartment between 1960 and 1965 is therefore attributed to a below
average rainfall and increased abstraction during the time period. The report
also mentions several ‘strong boreholes’ have been drilled on Paardenvallei
62 since the beginning of 1965, of which the abstraction rates are unknown.
8.1.8 GH3293 (Van Wyk and Mulder, 1974)
This report gives recommendations for regulations in terms of groundwater
allocations in the newly established Bo-Molopo groundwater control area. The
groundwater control area was established to control the large scale groundwater
abstraction from the highly productive dolomitic aquifers.
Mention is made of the two production boreholes on Kafferskraal (mentioned in
GH1278) that augmented the supply form the Rietpoort Well Field, that were
decommissioned in 1967.

Page 101
The Hydrogeological Relationship Between Recharge, Abstraction and Spring-flow in the Zeerust Dolomitic Aquifer
In discussing the status quo, the report mentions a hydrocensus performed prior to
October 1974 on the 3 000 km2 Bo-Molopo Groundwater Control Area. The following
findings are listed in Table 15.
Table 15: Hyrdocensus data
Defined use Boreholes Annual use (Mm3) % of BH % of Use
Domestic/Livestock 1210 0.6 81 1.4
Irrigation 250 38 17 90.3
Municipal/Industrial 29 3.5 2 8.3
Total 1489 42.1 100 100.0
Hydrocensus: Bo-Molopo Groundwater Protection Area
It can be seen that 17% of the boreholes are responsible for above 90% of the water
use due to irrigation requirements. It must also be noted that irrigation requirements is
mostly restricted to the southern portion of the Control Area where arable land is
found (estimated at 16% of the total Control Area). It is interesting to note that only
6% of the arable land is under irrigation.
Concerning spring-flow, 21 flow stations were erected at springs since 1960, while a
further 21 smaller springs are known, but not monitored. The combined average
spring-flow of the monitored springs is 41.1 Mm3, while the estimated flow of the
smaller springs is 6 Mm3 giving a combined average flow of 47 Mm3. The loss of
groundwater from the dolomitic area is defined as spring-flow leaving the dolomites
(springs on the dolomite recharges downstream compartments), and loss from
evapotranspiration. These losses were calculated at 26 Mm3, of which
8 Mm3 is due to evapotranspiration.
The report states that the spring water is used inefficiently. More than half of the
spring-flow of 14 springs are used for irrigation purposes (18 Mm3/a), of which
between 40 and 70% is lost through leaking canals to the irrigated lands, distribution
losses and rapid infiltration. Due to the lack of arable land in the northern portion of
the Control Area (the area under investigation here), little to no water is allocated to
irrigation. Two springs are used for domestic purposes: Grootfontein supplies 65% of
its flow to Mafikeng, while around 50% of Rietpoort’s flow is used to supply the town
of Zeerust. At the time that the report was written, the Rietpoort Well Field boreholes
were being developed.
The fluctuations in spring-flow are also discussed in the mentioned report.

Page 102
The Hydrogeological Relationship Between Recharge, Abstraction and Spring-flow in the Zeerust Dolomitic Aquifer
It states that the highest flow observed was for the hydrologic season ending 30
September 1974 in all springs. Some springs exhibited high flow in 1972 and others
in 1967. Apart from seasonal fluctuations due to rainfall, the report found no long
term change in spring-flow rates. A weakening of the flow in the Grootfontein
Spring during 1970-71 might be attributed to an increase in abstraction at
Blaauwbank. The flow however recovered in 1974 to such a degree that the canal
walls were breached.
The report mentions the development of monitoring boreholes in die Control Area,
and that since monitoring started as early as 1959, the highest recorded water levels
was also in 1974 (apart from at Blaauwbank in 1967). It further states that since the
large increase in abstraction in the area since the early 1950’s, no irrefutable
evidence of permanent over-abstraction could be found.
The groundwater contours in the Control Area indicate a large underground reservoir
(>800 km2) in the eastern portion, flowing south and south-westwards. This creates
stable groundwater conditions in spite of the heavy abstraction in areas around
Lichtenburg, Dudfield and Manana. However, at Blaauwbank where concentrated
abstraction occurs, a prominent cone of depression can be observed indicating local
over-abstraction. Since the highest recorded groundwater levels here in 1967, a
gradual drop in water level was observed, contrary to observation elsewhere in the
Control Area.
A basic water balance of the Control Area determined a positive balance of 11 Mm3/a
over the portion of the area occupied by white occupied and residential areas (about
two thirds of the area) in 1975. A projected surplus of 9 Mm3/a was predicted for
1990.
Although most of the work was concentrated in the Grootfontein Compartment, Table
16 documents the spring-flow discharges and percentages of flow utilised were given
for the entire area.

Page 103
The Hydrogeological Relationship Between Recharge, Abstraction and Spring-flow in the Zeerust Dolomitic Aquifer
Table 16: Spring-flow discharges and flow utilised
Spring Ave flow (Mm3/a) Use as % of flow Comments
Grootfontein Eye 4.2 25 Irrigation
60 Urban/municipal
15 Other losses
Kleinfontein Eye 0.05 0 Perennial flow
Molopo Eye 8 5
Olievendraai Eye 0.9 90
Weltevreden Eye 0.1 60
Buffelshoek Eye 1.8 80
Stinkhoutboom Eye 0.6 90
Vergenoegd Eye 3.1 90
Klaarstroom Eye 0.2 90
Kafferskraal Eye 0.7 0
Rietpoort Eye 2 50 Urban/municipal
Doornfontein Eye 0.9 90
Renosterfontein Eye 0.3 90
Doornplaat Eye 6 45
Karreebos Eye 3 70
Paardevlei Eye 0.2 90
Malmani Eye 4 60
Welgedacht Eye 0.3 90
Dinkona Upper 3.6 0
Tweefontein Upper 0.8 80
Tweefontein Lower 0.2 60
Total 41.0
8.1.9 GH3395 (Muller, 1981)
This 1981 report on the flow measurements of springs in the Bo-Molopo Groundwater
Control Area contains detailed flow measurement charts of springs surveyed between
28 April and 20 May 1981. The spring-flows are summarised in Table 17.

Page 104
The Hydrogeological Relationship Between Recharge, Abstraction and Spring-flow in the Zeerust Dolomitic Aquifer
Table 17: Spring-flows
Station No. Name Discharge in L/s
D4M14 Molopo Eye 851.3
D4M16 Welgedacht Eye 14.7
D4M17 Olievendraai Eye 71.9
A4M10 Stinhoutboom Eye 14.2
A3M11 Vergenoegd Eye 292.6
A3M15 Doornfontein Eye 79.4
A3M17 Renosterfontein Eye 28.6
A3C19 Doornplaat Upper 70
A3M19 Doornplaat Lower 527.8
A3M20 Kareebosch Eye 115.9
A3M21 Paardevlei Eye (District I) 145.8
A3M22 Paardevlei Eye (District II) 4.2
A3M23 Malmani Eye 219.8
A1M03 Tweefontein Upper 45.6
A1M04 Tweefontein Lower 0
D4M04 Total 2481.8
8.1.10 GH3602 (Bredenkamp, 1988)
This report on the alleged influence of what is here referred to as the Bo-Molopo
State Water Scheme on the Olievendraai Spring documents the weakening of the
spring between 1981 and 1987. The water scheme referred to here is the harvesting
of water from the Molopo Eye via a canal to supply Mafikeng/Mmabatho. The
Rietvallei/Weltevrede Irrigation Board alleged that this scheme negatively influences
the Olievendraai Spring due to the weakening of the spring. The scheme commenced
in October 1985 and reliable measurements have been taken since inception.
Problems with flow measurements at the Olievendraai Spring are mentioned, but a
correlation between spring-flow and the water level in Wondergat of 0.96 enabled a
graph of spring-flow for the Olievendraai Spring to be constructed between 1980 and
1988, the time of the report. A clear decline in spring-flow can be observed between
roughly 1981 and 1988, leading to the alleged impact of the State Water Scheme on
the spring. This decline is however attributed to the ‘serious drought’ experienced
between 1977 and 1988. The spring has an average flow of 1.5 Mm3/a and
experienced a maximum flow of estimated 6 Mm3/a in 1976 after the good rains
between 1974 and 1976. The low flow experienced in 1988 compared to flows
measured during the drought in 1964-1966, prior to the commencement of the
scheme.

Page 105
The Hydrogeological Relationship Between Recharge, Abstraction and Spring-flow in the Zeerust Dolomitic Aquifer
It was however pointed out as early as 1964 that the pumping of a certain borehole
300 m upstream from the spring (DN1) directly influences the spring-flow. It is even
more pronounced during periods of low flow.
8.1.11 GH3603 (Bredenkamp and Swartz, 1988)
This is the first modelling report known on the Rietpoort Compartment to determine
supply potential based on groundwater recharge and abstraction. Other than report
GH1278 (1965), this report differentiates between the Rietpoort and Buffelshoek
Springs in terms of catchments (invoking separate compartments), although no clear
boundary could be delineated.
The model was calibrated using simulated and observed water levels in monitoring
boreholes (A3N11,12,13) and three scenarios were modelled. The model concluded
that the compartment was not over-utilised, in spite of the lower than average rainfall,
and that increased abstraction might even be considered. It was proposed that
abstraction be increased by 30% to put pressure on the system in order to determine
whether the aquifer reacts as predicted.
The six production boreholes at the Rietpoort scheme were pumped in schedule to
produce the required 7500 m3/day. The observation borehole located in the well field
(OBS7) was monitored electronically, and remained in a constant state of drawdown.
The other monitoring boreholes used in the simulation showed fluctuations varying
depending on its location. A3N11 being the furthest south (near Ottoshoop) showed
prominent increases in water levels of between three and four metres due to recharge
between 1978 and 1982. Between mid-1982 and March 1988 there was a continual
drop in water level of around 10 m, with a subsequent recovery of five metres. The
drop in water level is also reflected in the other two monitoring boreholes nearer to the
well field; even borehole A3N13 located only 300 m from the production boreholes
which showed a drop in water level of around seven metres with no subsequent
recovery. Borehole A3N12, located 1.3 km south of the well field followed the same
downward trend, but only for two metres. Due to the constant drop in the water level
between 1984 and 1987 in A3N11 near Ottoshoop, it was deduced that the
Ottoshoop Dyke forms an impermeable boundary with the only recharge from the
compartment to the south coming in the form of the Malmani River during wet
seasons.

Page 106
The Hydrogeological Relationship Between Recharge, Abstraction and Spring-flow in the Zeerust Dolomitic Aquifer
In Figure 8-1 it can be seen that the water level in A3N11 is the shallowest, fluctuating
between 3-4 and 8-9 mbgl while the level dropped to as low as 13 mbgl during the dry
period. Borehole A3N12 showed the least fluctuation with a level around 12-14 mbgl.
The water level in borehole A3N13 located 300 m to the north of the well field had the
deepest water level at 20-21 mbgl, and showed the same drop in water level down to
28 mbgl during the dry period.
Aquifer parameters for the Rietpoort Compartment were derived from the testing of
the six production boreholes at Rietpoort. A transmissivity of between 3 000 and 5
000 m2/d and storativity of between 0.004 and 0.016 was derived using the Jacob
equation. It is also noted that the transmissivity values might be overstated since
some of the boreholes were further developed using dynamite (to increase the
borehole transmissivity and yield).

Page 107
The Hydrogeological Relationship Between Recharge, Abstraction and Spring-flow in the Zeerust Dolomitic Aquifer
Figure 8-1: Figure 4 from report GH3603 indicates the water levels and fluctuations in
monitoring boreholes in the Rietpoort Compartment

Page 108
The Hydrogeological Relationship Between Recharge, Abstraction and Spring-flow in the Zeerust Dolomitic Aquifer
The model was however calibrated with a transmissivity of 600 - 800 m2/d (except for
OBS7 T = 350 - 400 m2/d) and storativity of 0.02 and 0.04 for the entire aquifer.
8.1.12 GH3770 (Brink, 1992)
A geophysical investigation was conducted focussing on the fault that cuts through
Zeerust with the aim of finding additional water sources. Gravity and electromagnetic
methods were used. As part of this investigation, a hydrocensus was conducted in a
predefined area around Zeerust. Only one borehole however could be found from this
data that plots inside the area under investigation. This borehole is located near the
Vergenoegd Spring (Latitude:
-25.60555, Longitude: 25.9925) and had a water level measured at 17.5 mbgl, which
translated to 1300.5 mamsl from a collar height of 1318 mamsl.
8.1.13 GH3815 (Botha, 1993)
This is another report to investigate the potential of the Rietpoort Catchment as a
source of water to Zeerust. It starts off by mentioning that Zeerust and the fluorspar
mines were allocated a total of 4.2 Mm3/a from the Rietpoort Compartment as part of
the Bo-Molopo Groundwater Control Area, although the current (1993) demand is
only 2.8 Mm3/a. In 1965 the town of Zeerust was allocated 98.75 % of the flow from
the Rietpoort Spring, while additional permits for groundwater abstraction were issued
to the town and the mines. The Rietpoort well field was developed in 1975 when the
spring-flow proved insufficient for the combined needs. It was found that abstraction
from the compartment was much higher during 1978 and 1982 than during the period
1983 to 1993.
Recharge over the compartment was previously calculated at 10% of rainfall (being
an average of 480 mm/a over the 15 years prior to 1993), amounting to 3.37 Mm3/a
(taking the Buffelshoek Spring into account). In 1989 future water demands were
predicted at 3.3 Mm3/a for the year 2000, but this did not make provision for the
upgrading of services to townships, and it was estimated that this figure would have to
be adjusted upwards.
This report’s objective is to re-evaluate the groundwater potential. Data used included
continuous water levels, abstraction rates, spring-flow and rainfall data for Rietpoort
between 1977 and 1993.

Page 109
The Hydrogeological Relationship Between Recharge, Abstraction and Spring-flow in the Zeerust Dolomitic Aquifer
The availability of data is discussed in detail in the report.
The report mentions that the Rietpoort Spring has effectively ceased flowing in March
of 1984 due to the intensive pumping of the Rietpoort Well Field. The abstraction
does not seem to have an effect on the Buffelshoek Spring due to the overriding
effect of rainfall. The correlation between spring-flow and water levels as monitored in
the compartment is much stronger, and this relationship was used to correct faulty
spring-flow readings at both springs.
Abstraction records from the Rietpoort WellFfield were kept consistently for the
period, and it is reported by the municipality’s electrical engineer that water levels
drop by only one metre during pumping, despite the high yields of the production
boreholes. Monthly abstraction during the period 1982 to 1993 averaged around 0.2
Mm3. The main limiting factor to the supply of water to Zeerust is the capacity of the
pipeline (75 L/s) and the small reservoir at Zeerust.
Figure 8-2: Comparison in the water levels in monitoring boreholes A3N11, 12 and 13
(GH3815).

Page 110
The Hydrogeological Relationship Between Recharge, Abstraction and Spring-flow in the Zeerust Dolomitic Aquifer
Water level fluctuations in the same three monitoring boreholes mentioned in
GH3603 are discussed, and graphs covering the same time frame (see Figure 8-1)
but extended up to 1993 are drawn (see Figure 8-2). From these graphs it can be
seen that after the prolonged drop in water levels in A3N11 and A3N13, two distinct
recharge events were recorded in 1988 and 1989. Another recharge event was
registered in A3N11, after which a consistent drop in all levels was recorded. Even
A3N12 which did not drop below 15 mbgl since 1977 showed a drop in water level
down to below 17 mbgl.
Various methods were used to assess the situation. A water balance was done using
the SVF method, while the recharge and storativity was determined using the CRD
method and Direct Parameter Estimation Method (DPEM). Recharge was also
determined using spring-flow and the chloride method.
In summary, an average recharge of 10% was determined for the compartment (but
has realised up to 14% on occasion), while the storativity ranges between 2.5 and
5%. The recharge volume of 3.37 Mm3/a calculated is still more than the 1993
abstraction rate of 2.8 Mm3/a. However, if the flow of the Buffelshoek Spring of
approximately 1.0 Mm3/a is subtracted, it leaves a balance of 2.37 Mm3/a which is
less than the 1993 abstraction. It is therefore concluded that the entire recharge
volume can be utilised, provided that the capacity of the Buffelshoek Spring is
harvested.
8.1.14 GH3948 (Nel, 2000)
After realising that a shortage in monitoring data proved to be a limiting factor in
calibrating groundwater models, a decision was made to drill new boreholes in the
three dolomitic areas in the Bo-Molopo Groundwater Protection Area: Zeerust,
Grootfontein and Lichtenburg. The Zeerust area received a total of 26 boreholes. This
report documents the drilling results and geohydrological findings. A small map
indicates the position of each borehole relative to the extent of the dolomite, while a
log containing the coordinates (decimal degree format) details the geology and
several geophysical logs.
This report is practically of no use since the two sets of coordinates for each borehole
differs from each other and from the positions indicated on the maps. Therefore all
three methods of locating the individual boreholes differ from each other and
therefore it is not possible to locate the data geographically.

Page 111
The Hydrogeological Relationship Between Recharge, Abstraction and Spring-flow in the Zeerust Dolomitic Aquifer
8.1.15 Report No. AQS/AFRICON/2002/001 (Africon, 2002)
In 2002 Aquisim was contracted by Africon to conduct aquifer test analyses and
groundwater flow modelling to determine the long term abstraction potential from the
dolomite underlying the farm Uitvalgrond 60 JO to supply the Welbedacht Area. This
report concluded that three of the five boreholes tested are capable of yielding more
than 30 L/s on a short to medium term based on aquifer tests. The compartment was
modelled based on the assumption that it is in hydraulic equilibrium, i.e. recharge to
the aquifer is balanced out by spring-flow and other losses (evapotranspiration).
Recharge was calculated at 12% of rainfall (in line with previous studies), or 4 048
m3/d over the compartment. It was concluded that spring-flow would be sensitive to
well field drawdown, and that for a drawdown of one metre, the Wolvekoppies Spring-
flow would reduce from 8 L/s to 2 L/s, and the Klaarstroom Spring-flow from 22 L/s to
15 L/s. An optimal borehole field yield of 31 L/s was recommended, although the
springs were anticipated to cease flowing (the Wolvekoppies after six months and the
Klaarstroom only after 20 years). Monitoring of the abstraction rates and water levels
were also recommended from the inception of the borehole field.
8.1.16 Report No. 2005/0076-02 (Bogare, 2005)
Also available as Report No 22(953) on DWA’s archive system
The Uitvalgrond Well Field was developed and commissioned in April 2003 as per the
above recommendations. In March 2004 the wellfield started to fail and abstraction
was reduced. By early September 2004 the abstraction was discontinued as all
boreholes failed. This prompted urgent measures from the NMMDM who appointed
Bogare Consultants Consortium (BCC) to re-evaluate the well field and augment
supply from neighbouring compartments. A required yield of 40 L/s was specified.
Khulani GeoEnviro Consultants (part of the consortium) sought involvement from
other specialists VSA and Aquisim (Khulani, 2005).
According to this report, another consortium of companies comprising VSA, Africon
and Environmental Management Accountants commenced with a detailed regional
study of the North West Dolomites. It involved the delineation of 50 compartments
with the aid of aeromagnetic surveys and groundwater levels, a comprehensive 3D
numerical flow model over a 30 year period, and the identification of areas where an
additional 230 L/s could be developed sustainably.

Page 112
The Hydrogeological Relationship Between Recharge, Abstraction and Spring-flow in the Zeerust Dolomitic Aquifer
A map was reproduced in this report indicating the positions of dykes and newly
described compartments, referred to as ‘dolomite compartment units’ or DCU’s. The
Vergenoegd Dolomite Compartment Unit (DCU) was identified as an area where 40-
45 L/s could be developed sustainably with predicted long term drawdowns of less
than five metres. The Vergenoegd Springs (average 80 L/s) and Paardenvallei
Springs (average 66 L/s) discharges water from this compartment and it was
identified as the main target to source water to augment supply to Welbedacht.
In investigating the failure of the Uitvalgrond Well Field, the report admits that
monitoring data are limited. Only once the boreholes started to fail was water levels
recorded and a drawdown in the order of 14 m was reported. After complete failure in
September 2004 the NMMDM monitored water level recovery from November 2004 to
early 2005. The monitoring data indicates a further decline in water levels from 8
November 2004 to 23 December 2004 (attributed to natural losses during a period of
insignificant or no recharge from rainfall), after which it recovered by a mere one
metre or less in the space of a month.
The volume meter readings on the abstraction boreholes were measured on 19 May
2004 after 13 months of abstraction. The report mentions that it is possible that some
of the meters got stuck since the measured volume gives an average daily abstraction
of 17.2 L/s whereby the estimated abstraction (based on the larger meter reading and
recommended rate) is 25.6 L/s. The measured data therefore seems to be incomplete
and unreliable.
This report concluded that the main reasons for failure of the Uitvalgrond Well Field
were the limited area of investigation in 2002, and the existence of a previously
unknown flow barrier between the Wolvekoppies and Klaarstroom Springs, which
were thought to be in hydraulic connectivity. The flow height of the Klaarstroom Eye
was found to be about 10 m higher than the Wolvekoppies Spring confirming the flow
barrier. The sustainable yield from the Uitvalgrond Well Field was recalculated as
being 6.0 L/s, which can be increased to 9.0 L/s once water levels have recovered to
within five metres.
An in-depth investigation into the relationship between rainfall and recharge was also
described. The findings were that should the monthly CRD be negative, the system
was still in debt and groundwater levels below equilibrium.

Page 113
The Hydrogeological Relationship Between Recharge, Abstraction and Spring-flow in the Zeerust Dolomitic Aquifer
Any effective recharge during the negative CRD period would practically be restoring
the aquifer to equilibrium conditions. During positive CRD conditions sufficient
monthly rainfall would recharge the aquifer to above equilibrium conditions. A
threshold of 65 mm within a month was identified as being a cut-off value for effective
recharge to occur. Above this threshold, recharge increased exponentially. It was
further proposed that the 70 percentile effective annual recharge value of 55 mm (or
1.75 L/s/km2) be used in evaluating sustainable abstraction from the dolomites. This
means that a more conservative approach to the water balance was used.
A comparison between the groundwater levels and spring-flow data from DWA,
indicated a strong relationship, where it was observed that when the groundwater
levels rose, spring-flow would increase. Variations in both could also be strongly
linked to variations in recharge. For example, a 12 year period of no/very little
recharge was calculated between 1983 and 1995 which corresponded with a decline
in spring-flow and water tables. The Vergenoegd Spring effectively ceased flowing
during this period, while the Paardenvallei, Kraalfontein, Tweefontein Upper and
Stinkhoutboom Springs experienced periods of low flow, followed by periods of no-
flow.
This study also resulted in the revision of the DCU’s based on new data. The
Klaarstroom DCU (previously 13 km2) was divided into a new smaller Klaarstroom
compartment (5 km2) and the Wolvekoppies compartment (7.1 km2) in which the
Uitvalgrond Well Field is situated because of the identified flow boundary. The
Tweefontein DCU of 38.4 km2 was also sub-divided into the Tweefontein (22.3 km2)
and the Tweefontein South (16.1 km2) compartments.
The report proposed the augmentation of water to the Welbedacht Scheme from
boreholes spread over the Wolvekoppies, Tweefontein South and Paardenvallei-
Vergenoegd DCU’s to limit the impact on drawdowns and spring-flow.
A target yield of 45 L/s was chosen to include a spare capacity of >10 L/s for optimal
well field management. Eight new production borehole sites were finally identified
based on the gravity survey over two compartment units: the Vergenoegd DCU and
the Tweefontein South DCU. The boreholes were sited in high transmissive zones
called major saturated leached zones. A storage volume of 2 898 000 m3 was
calculated for the upper five metres of the targeted aquifer zones, which was believed
to be sufficient to supply the demand of 3 456 m3/d for an abstraction period of 3.2
years.

Page 114
The Hydrogeological Relationship Between Recharge, Abstraction and Spring-flow in the Zeerust Dolomitic Aquifer
The total Welbedacht water demand (40 L/s) represents 38% of the recharge over the
DCU’s (105.6 L/s) while the inflow into the Paardenvallei-Vergenoegd DCU from the
surrounding compartments was modelled at 116.7 L/s during the regional dolomite
study.
It further recommended the registration of the water use from the four Uitvalgrond
Well Field boreholes with DWA (max 10 L/s) and the monitoring of water levels with a
bi-annual monitoring report to be compiled. Continuous monitoring equipment was
recommended for boreholes 21-00036 and PV-20 and a rain gauge to monitor
rainfall. Furthermore the monitoring of the spring-flow at Vergenoegd weir (A3H011
which closed in 1992) was recommended to be reinstated.
The drilling of five proposed monitoring/exploration boreholes was recommended to
obtain critical water level data and the updating of the 3D numerical model with the
new data. Finally an EIA was recommended as per relevant legislation to assess the
impact of the proposed new abstraction to augment the Welbedacht Scheme. Only
once authorisation was obtained and land owner agreements were in place the
drilling of production boreholes could commence (Khulani, 2005).
8.1.17 Report No. AQS/KHULANI/2005/001 (Khulani, 2005)
Aquisim updated the 2002 model in this 2005 report after the Uitvalgrond Well Field
failure with new data which became available. The investigation had as objectives the
following:
Determine the feasibility to supply 6 L/s from the Uitvalgrond Well Field
Determine the feasibility to supply 10 L/s from the Tweefontein South
compartment
Determine the feasibility to supply 30 L/s from the Paardenvallei compartment
(in addition to existing use of 29 L/s)
Determine the impact of abstraction on the water levels and spring-flow rates
and other natural system losses.
The following were concluded:

Page 115
The Hydrogeological Relationship Between Recharge, Abstraction and Spring-flow in the Zeerust Dolomitic Aquifer
The abstraction of 6 L/s from the Uitvalgrond Compartment was deemed
feasible as the long term average spring-flow of the Wolvekoppies Spring was
calculated at 8 L/s. At this abstraction rate an 80% chance was calculated that
the Wolvekoppies Spring would cease flowing and a 40% chance of a
drawdown exceeding six metres. Recharge events would however recover
water levels.
The minimum simulated recharge rate to the Tweefontein South Compartment
is ~25 L/s, making the abstraction of 10 L/s feasible, although a drawdown of
more than six metres has a 60% probability in the worst case scenario, and
20% probability in the most likely scenario. Similarly recharge events are
expected to recover water levels and no long term detrimental impacts are
foreseen. The water level in this compartment is also expected to be
influenced by abstraction from the Paardenvallei Compartment.
The minimum simulated long term potential from the Paardenvallei
Compartment is in the order of 146 L/s. Together with the current abstraction
of ~30 L/s, the compartment is deemed fit to yield a further 30 L/s. Similarly a
drawdown in excess of six metres has a 60% probability in the worst case
scenario, and a ‘low risk’ of achieving this drawdown exists in the most likely
scenario. It was concluded that the proposed abstraction would have no
detrimental effect on the water levels in the long term. The simulations
indicated that the water levels do recover in this compartment even after
periods of drought. The reduction in spring-flow of the Paardenvallei Spring
was anticipated to be between 10 and 30 L/s and the Vergenoegd Spring
between 5 and 15 L/s.
The report recommended the drilling of the production boreholes as Khulani (2005)
suggested, and the establishment of a monitoring programme to be established from
the inception of the well field to monitor abstraction rates and water levels. The data
must be used to evaluate the aquifer and well field performance bi-annually in order to
take corrective measures where needed. The groundwater flow model was
recommended to be updated every year with the monitoring data.
8.1.18 EIA_507/2005NW_Zeerust/KGC_FSR_002 (Khulani, 2006)

Page 116
The Hydrogeological Relationship Between Recharge, Abstraction and Spring-flow in the Zeerust Dolomitic Aquifer
This is the final scoping report of the EIA proposed by Khulani in 2005. It stipulates
the processes followed in the investigation, describes the baseline environment and
identifies the foreseen impacts in various biophysical fields like: climate, soil,
geology/geohydrology, vegetation, fauna, etc. Sinkholes are described as forming
part of the pre-development natural environment (one sinkhole was identified during
the survey) but are also flagged as being exacerbated by human actions. The direct
link between excessive groundwater abstraction and new sinkhole formation is
however not addressed. This is deemed a critical impact to consider where bulk
groundwater abstraction from dolomitic areas is concerned. Neither is the
construction activities of the pipeline on the dolomite stability addressed.
An Environmental Management Plan (EMP) was compiled for the project based on
the identified impacts, and the project go-ahead was recommended based on the
adherence to the EMP.
The boreholes were drilled, tested and equipped to augment the Welbedacht Bulk
Water Supply Scheme from the Uitvalgrond Well Field (UWF). The newly drilled
boreholes are referred to as the Vergenoegd Well Field (VWF). This investigation
was launched into the alleged impact of the bulk abstraction from the VWF on the
environment.
The NMMDM initiated an audit of the activities surrounding the bulk groundwater
abstraction from the VWF. The final audit report was submitted in September 2011 in
which the operation and maintenance of the borehole field was scrutinised against the
recommendations of both the final scoping report and EMP (Khulani, 2006 and the
2005 modelling update (Aquisim, 2005). The findings of this report will be discussed
in section 8.2.
8.1.19 Department of Water Affairs (DWA) compartment delineation studies undertaken in
2009
The Department of Water Affairs (DWA) published a series of reports and maps in
2009 on the delineation of ‘compartments’ on the major dolomitic areas in South
Africa. This included the Far West Rand (FWR) dolomites between Krugersdorp and
Carletonville and further west towards Potchefstroom, as well as the North West
dolomites between Ventersdorp and Lichtenburg and northwards towards Zeerust
and Lobatse.

Page 117
The Hydrogeological Relationship Between Recharge, Abstraction and Spring-flow in the Zeerust Dolomitic Aquifer
In the report (booklet), the delineation methodology is described as follows (Holland
and Wiegmans, 2009):
Groundwater Resource Unit
A groundwater body that has been delineated or grouped into a single
significant water resource based on one or more characteristics that are
similar across that unit.
Groundwater Management Unit
An area of a catchment that requires consistent management actions to
maintain the desired level of use or protection of groundwater.
The GMU’s are based on surface water drainage and hydrogeological
considerations, each of which represents a hydrogeologically homogeneous
zone wherein boreholes tapping the shallow groundwater system will be, to
some degree or other, in hydraulic connection.
Groundwater Management Area
GMAs generally coincide with surface drainage boundaries (e.g. quaternary
catchments)
Does not necessarily represent a dolomite compartment or unit (larger area
comprising a number of GMU’s and GRU’s)
A map was produced for the North West Dolomites indicating the Groundwater
Management Areas (GMA) and Groundwater Management Units (GMU) as well as
the locations of springs, monitoring stations and quaternary catchments draped on a
geology basemap (Holland and Wiegmans, 2009).
The major GMA’s and GMU’s are given in Table 18 together with associated spring
names and station numbers.
The area under investigation forms part of the Zeerust GMA hence it is generally
referred to as the Zeerust Dolomites. Inside this GMA are several smaller GMU’s, of
which the Paardevlei GMU will form the area of investigation. The Paardevlei GMU is
95.6 km2 in size and has three springs: the two Paarde(nval)lei springs and the
Vergenoegd Spring.

Page 118
The Hydrogeological Relationship Between Recharge, Abstraction and Spring-flow in the Zeerust Dolomitic Aquifer
The Paardevlei GMU is separated from the Doornfontein GMU to the south by the
Doonfontein Dyke while the Doornfontein GMU is separated by the Rietpoort GMU to
its south by the Rietpoort Dyke.
The Vergenoegd Dyke located in the Paardevlei GMU used to be seen as a
compartment boundary dividing the Vergenoegd DCU from the Tweefontein and
Klaarstroom in previous work (Aquisim, 2005; Khulani, 2005) whereas here it is not
seen as a dividing boundary.
The Paardevlei and Klaarstroom GMU’s form the northernmost GMU’s of the Zeerust
Dolomites. North of the Zeerust GMA, the Dinokana GMA is located.

Page 119
The Hydrogeological Relationship Between Recharge, Abstraction and Spring-flow in the Zeerust Dolomitic Aquifer
Table 18: North West Dolomitic Groundwater Management Areas and Units (Holland and Wiegmans, 2009)

Page 120
The Hydrogeological Relationship Between Recharge, Abstraction and Spring-flow in the Zeerust Dolomitic Aquifer
8.2 2011 Audit (Masilo & Associates, 2011)
In September 2011 Masilo & Associates submitted an EIA audit report on the activities
surrounding the abstraction. Audit activities focussed mainly on recommendations made
during the updated modelling excercise (Aquisim, 2005) and the EIA preceding the
development (Khulani, 2005).
Concerning the geohydrological parameters, the approach of the EIA audit report was
similar to this investigation, in that it used existing data from the monitoring of the
production boreholes and from DWA’s historical monitoring records to draw conclusions.
The four UWF boreholes and six VWF boreholes’ monthly abstraction volumes were
used to compare the abstraction against the recommendations.
Water level data measured from the VWF were also analysed to determine drawdown.
Data from DWA monitoring boreholes and spring-flow monitoring stations were analysed
to determine trends that could be ascribed to the pumping of the well field. The data
were also compared to rainfall data.
Monitoring protocol
The report states that all steps in the establishment of the well field were undertaken by
the NMMDM, but that the adequacy of the steps will be audited. The following table
summarises recommendations regarding monitoring made in the EMP (Khulani, 2005).
Table 19: 2011 Audit findings
2005 Model and EMP recommendations 2011 Audit findings
Monthly monitoring Monthly monitoring
To be established from inception Data since establishment not available
Monitor abstraction rates, water level
drawdown and spring-flow
Only abstraction rates available since
October 2009
Bi-annual re-evaluation of aquifer
performance
No information on recommended re-
evaluation available
The monitoring therefore was not fully in accordance with the 2005 modelling update and
EMP recommendations.

Page 121
The Hydrogeological Relationship Between Recharge, Abstraction and Spring-flow in the Zeerust Dolomitic Aquifer
Abstraction volumes
Estimates of the water abstraction from each of the Welbedacht boreholes were made
from abstraction readings received for the period between September 2009 and March
2011. Daily abstraction rates were derived from the data, and compared to
recommendations. Findings of all the production boreholes’ data are presented in graph
format.
Figure 8-3: Pumping rates for borehole 21-00066

Page 122
The Hydrogeological Relationship Between Recharge, Abstraction and Spring-flow in the Zeerust Dolomitic Aquifer
Figure 8-4: Pumping rates for borehole 21-00067
Figure 8-5: Pumping rates for borehole 21-00068

Page 123
The Hydrogeological Relationship Between Recharge, Abstraction and Spring-flow in the Zeerust Dolomitic Aquifer
Figure 8-6: Pumping rates for borehole 21-00069
Figure 8-7: Pumping rates for borehole 21-00070

Page 124
The Hydrogeological Relationship Between Recharge, Abstraction and Spring-flow in the Zeerust Dolomitic Aquifer
Figure 8-8: Pumping rates for borehole 21-00072
From the data it can be concluded that:
Borehole 21-00066 exceeded the recommended abstraction limit of 432 m3/d in
March, May and July 2010, and for a continuous period between September
2010 and March 2011.
Borehole 21-00068 exceeded the recommended daily abstraction limit of 492
m3/d by 60 m3/d in November 2009, by 92 m3/d in March 2010, by two m3/d in
April 2010 and a continuous period of above recommended limit abstraction
occurred between September 2010 and March 2011 by at least 50 m3/d.
Borehole 21-00069 exceeded the recommended abstraction (432 m3/d) between
September 2010 and March 2011 by up to 67 m3/d.
However, when combining the data, the average abstraction rate was 32 L/s which is
below the 2008 recommendations of 40 L/s.
Water levels

Page 125
The Hydrogeological Relationship Between Recharge, Abstraction and Spring-flow in the Zeerust Dolomitic Aquifer
Water level data were derived from a monitoring report referenced (unavailable for this
investigation) and monitoring data from DWA. Water level data of available and relevant
monitoring boreholes were stacked to represent fluctuations over time. Most of the DWA
monitoring data only goes up to 2004. The fluctuations between 2004 and 2011 are
reported to only be recorded in boreholes:
O14 (2525DB00002 or A3N0015),
PV19 (2525DB00009 or A3N0016) and
PV20 (2525DB00010 or A3N0017).
Although the data referring to (post-2004) could not be sourced, the report states that the
water levels “were markedly constant and low” in all three boreholes, and began to
recover again in 2010 (presumably at the end of 2010).
The report concludes that in terms of the 2005 hydrological management
recommendations for the borehole field:
The recommendations on site-specific monitoring were not adhered to
(especially in terms of frequency of recording water levels). Subsequent
management steps were therefore not adequately addressed.
Unknown resting periods were implemented on the production boreholes to help
the water level recover.
Abstraction rates were found to be within the total recommended levels between
October 2009 and March 2010.
Abstraction rates in some production boreholes exceeded the specified limit on
occasion
In terms of compliance to the EIA/EMP recommendations, the following were concluded:
The recommendations on monitoring, auditing, mitigation reporting of changes to
DACE and DWA, and abstraction limits were not satisfactorily adhered to. This
compromised subsequent management steps
No correlation was found between water levels and the impact of the
development from available data.

Page 126
The Hydrogeological Relationship Between Recharge, Abstraction and Spring-flow in the Zeerust Dolomitic Aquifer
Spring-flow failure was identified as an aspect, however no correlation between
the abstraction and spring-flow could be found based on the available data.

Page 127
The Hydrogeological Relationship Between Recharge, Abstraction and Spring-flow in the Zeerust Dolomitic Aquifer
9 APPENDIX B: RAINFALL GRAPHS

Page 128
The Hydrogeological Relationship Between Recharge, Abstraction and Spring-flow in the Zeerust Dolomitic Aquifer

Page 129
The Hydrogeological Relationship Between Recharge, Abstraction and Spring-flow in the Zeerust Dolomitic Aquifer

Page 130
The Hydrogeological Relationship Between Recharge, Abstraction and Spring-flow in the Zeerust Dolomitic Aquifer

Page 131
The Hydrogeological Relationship Between Recharge, Abstraction and Spring-flow in the Zeerust Dolomitic Aquifer
10 APPENDIX C: RECHARGE CALCULATIONS
Figure 10-1: SVF (A3N0015)

Page 132
The Hydrogeological Relationship Between Recharge, Abstraction and Spring-flow in the Zeerust Dolomitic Aquifer
Figure 10-2: CRD (A3N0015)

Page 133
The Hydrogeological Relationship Between Recharge, Abstraction and Spring-flow in the Zeerust Dolomitic Aquifer
11 APPENDIX D: GROUNDWATER RESOURCE MANAGEMENT IN SOUTH
AFRICA
It is deemed necessary to include a section on groundwater resource management in
South Africa, and what DWA considers to be guidelines and guiding principles. This is
included as an appendix, but forms an integral part of the report.
11.1 DWA Guidelines
The National Water Act (Act 36 of 1998) mandated DWA to protect, use, develop,
conserve, manage and control water resources in South Africa in an integrated manner
(NWRS, 2006).
Dolomite aquifers constitute some of the most important aquifers in the world (DWA,
2006). DWA therefore initiated the compilation of a guideline in assessing, planning and
managing water resources in dolomitic areas of South Africa (DWA, 2006). This
document led to an overarching guideline for the Assessment, Planning and
Management of Groundwater Resources in South Africa (DWA, 2008).
The 2006 publication is commonly referred to as the Dolomite Guideline, with the aim of
assisting sustainable development, protection and management of groundwater
resources and achieving the Department’s overall goal of Integrated Water Resource
Management (IWRM) (DWA, 2006).
The 2006 Dolomite Guideline is divided into three volumes as follows:
Volume 1: Provides a conceptual overview of the Dolomite Guideline in terms of
the purpose of the guideline, the location of the dolomite resources, the regulatory
framework, principles and approaches, and the institutional arrangements. Volume 1 can
be used by role-players who seek to gain an initial insight into the assessment, planning
and management of water resources in dolomitic areas
Volume 2: Provides details of the process and related activities that should be
followed during the assessment, planning and management functions. This volume is
aimed at the role-players who require a detailed understanding of the processes to be
followed during assessment, planning and management, to enable the overall
management, integration and control of these processes, and

Page 134
The Hydrogeological Relationship Between Recharge, Abstraction and Spring-flow in the Zeerust Dolomitic Aquifer
Volume 3: Provides detailed procedures, in the form of check-lists with guiding
notes, for carrying out the assessment, planning and management functions. This
volume is aimed at those role-players tasked with the operational aspects of these
functions (DWA, 2006b)
The differences between the assessment, planning and management steps are
described as follows (DWA, 2006b):
Assessment: This is the first step in the IWRM process and determines the
status quo of the resource. It also determines the capability of the resource in terms of
sustainable, economic and technical feasible abstraction and the impact on the
environment in terms of spring and river flow, ecological requirements and ground
stability. The steps in the assessment process are:
Undertake desk study and remote sensing
Identify areas for additional work
Hydrocensus
Siting of monitoring/exploration boreholes
Drilling and testing of boreholes
Prepare conceptual groundwater model
Risk Assessment
Spring capture and surface water-groundwater interaction
Present to stakeholders and obtain input
Prepare assessment report
Planning: This requires the matching of water availability to the water
requirements. Steps are given for planning on national, catchment level and site specific
levels.
Management: Management relates to the sustainable use and development of
the dolomitic water resources, without compromising the resource integrity (quantity and
quality).

Page 135
The Hydrogeological Relationship Between Recharge, Abstraction and Spring-flow in the Zeerust Dolomitic Aquifer
It thus involves monitoring of the integrity over a long term period and the use of
this information to determine compliance against set goals, and to assess whether
DWA’s strategic goals are being met. It generally is an iterative process involving the
setting management objectives (various levels) and monitoring and reporting against
these objectives (compliance assessment).
The management function is considered important since it provides a continuous
record of the response of the aquifer to various inputs and outputs (recharge,
baseflow, abstraction, evapotranspiration etc.) through monitoring.
Management steps are also given for national, catchment level and site specific
levels. The ground-level operation and maintenance and monitoring
implementation occurs in the last level, but feeds back to catchment and
ultimately national levels. The Dolomite Guideline contains detailed guidelines on
the collection, storage and communication of monitoring data which will not be
repeated here.
The importance of integrating the assessment, planning and management functions is
given in Volume 1 (DWA, 2006a) as follows:
Poor assessment can lead to poor planning, which in turn can lead to the
adoption of unsuitable options and the unsustainable use of the resource. (The
failure of the Uitvalgrond Well Field is a prime example)
Poor management is defined as the inefficient use of the time and budget of the
Department’s operational personnel. Nothing is however mentioned here about
monitoring of the resource as part of management, but lack of monitoring can
lead to situations where a well field is overexploited (like Uitvalgrond Well Field)
and this has serious economic and environmental implications.
The planning and assessment of the groundwater resources being exploited as part of
the Welbedacht Bulk Water Supply Scheme were completed before the onset of bulk
abstraction. The nature of the complaints regarding lack of monitoring data and
abstraction volumes from the Vergenoegd Well Field is therefore a function of the (site
specific) management of the resource. Therefore the guidelines pertaining to
management will be discussed here.

Page 136
The Hydrogeological Relationship Between Recharge, Abstraction and Spring-flow in the Zeerust Dolomitic Aquifer
11.1.1 Management of dolomitic groundwater resources
The management of dolomitic groundwater resources happens at three levels: site
specific (well field level), catchment level and on national level.
On a site specific level it is most important to measure and monitor. These are the data
that eventually feeds the rest of the decision-making process. It is equally important that
the data gets managed properly and converted to information through the proper
reporting process (monitoring reports). The reports are needed to make well field
adjustments where necessary, and analysed on a catchment level.
On catchment level strategies and management plans are drawn up based on the
monitoring data. Compliance assessment and possible remedial actions also stem from
the data reports. Decisions made at this level then feeds into the national decision
making process by means of catchment management reports.
On national level the catchment management reports are used to review strategic goals,
and compliance to the set goals.

Page 137
The Hydrogeological Relationship Between Recharge, Abstraction and Spring-flow in the Zeerust Dolomitic Aquifer
Figure 11-1: Relationship between the assessment, planning and management functions at different levels (DWA, 2006b).

Page 138
The Hydrogeological Relationship Between Recharge, Abstraction and Spring-flow in the Zeerust Dolomitic Aquifer
It is therefore clear that a lack of measuring and monitoring capacity on a site specific
level like the Vergenoegd Well Field not only has an impact on a catchment level, but
eventually on national level decision making too.
11.1.2 North West Groundwater Master Plan
In 2010 DWA published the North West Groundwater Master Plan (in draft format) to
help structure the tasks of the groundwater staff component related to the
department’s mandate of development, utilisation, protection, conservation and
management (DWA, 2010). In this document, it is admitted that data and information
management was not specifically addressed in the NWA (Act 36 of 1998), but
underpins the above functions. The term North West here refers specifically to the
North West Dolomites, and specifically to the Crocodile West – Marico Water
Management Area (WMA).
In this document the current situation is described pertaining to monitoring and data
management. About 35 water level monitoring points are actively being monitored, but
due to high staff turnover no knowledge about the specific placement of these
monitoring points exists. “A project to try and establish the value and reasons for
these monitoring points has to be launched immediately” (DWA, 2010).
The report further states that only seven points exist where chemical monitoring takes
place, and no abstraction monitoring takes place in the WMA. In terms of data
management the Master Plan further admits that very little data management takes
place, and suggests certain short and long term actions.
The report describes the various hydrogeological regions that form part of the WMA
based on the Vegter’s Groundwater Regions. The area underlain by the dolomite
forms part of the Karst Belt Hydrogeological Region. Interestingly it is mentioned that
efforts to establish a subterranean water control area (referring to the Bo-Molopo
Groundwater Control Area) failed.
When discussing the supply to Zeerust from the dolomites, the report further
acknowledges that monitoring data for abstractions and water levels are unknown,
and must be sourced if available. In general, the lack of monitoring data and
information/data management is seen as the key priority focus area for this
region to ensure sound management decisions (DWA, 2010).

Page 139
The Hydrogeological Relationship Between Recharge, Abstraction and Spring-flow in the Zeerust Dolomitic Aquifer
12 APPENDIX E: CASE STUDY INFORMATION
Data used in the assessment:
Date 508649 508721 509035 A3H011 A3H021 A3H022
1980-10-01 37.4 0 22 0.155 0.296 0.007
1980-11-01 188.8 121 120.7 0.506 0.291 0.008
1980-12-01 121.1 69 78.3 0.547 0.296 0.013
1981-01-01 187.6 226 101.6 0.583 0.324 0.019
1981-02-01 80.6 169 79 0.651 0.372 0.04
1981-03-01 48.2 70 71.4 0.829 0.432 0.051
1981-04-01 14.2 12 9.9 0.824 0.413 0.05
1981-05-01 1.8 0 3.9 0.818 0.419 0.051
1981-06-01 3 0 6.1 0.778 0.395 0.047
1981-07-01 0 0 0 0.782 0.398 0.046
1981-08-01 30.8 34 27.9 0.744 0.415 0.05
1981-09-01 0 0 0 0.693 0.383 0.044
1981-10-01 42.2 34 34.3 0.667 0.343 0.036
1981-11-01 43.4 40 58.5 0.579 0.321 0.032
1981-12-01 96.5 88 86.4 0.569 0.329 0.033
1982-01-01 123.2 115 74 0.547 0.295 0.024
1982-02-01 28.6 31 38.1 0.432 0.238 0.009
1982-03-01 85.3 94 69.3 0.452 0.265 0.01
1982-04-01 164.6 206 73.3 0.482 0.285 0.012
1982-05-01 0 0 0 0.523 0.314 0.014
1982-06-01 0 0 0 0.551 0.315 0.015
1982-07-01 9.9 0 10.2 0.615 0.328 0.016
1982-08-01 0 0 0 0.627 0.328 0.015
1982-09-01 0 5 3.6 0.604 0.311 0.014
1982-10-01 155.9 148 84 0.601 0.325 0.015
1982-11-01 36.4 20 46.4 0.574 0.3 0.012
1982-12-01 87.6 69 63.6 0.541 0.272 0.007
1983-01-01 123 17 69.7 0.511 0.258 0.006
1983-02-01 90 81 47 0.435 0.207 0.005
1983-03-01 40.2 43 50.5 0.446 0.0232 0.006
1983-04-01 18.6 22 10.8 0.421 0.197 0.006
1983-05-01 23.4 24 14.5 0.175 0.21 0.007
Rainfall (mm) Flow (Mm3/m)