The Home Ownership Preservation Initiative in Chicago (HOPI) · The Home Ownership Preservation...
22
The Home Ownership Preservation Initiative in Chicago (HOPI) Reducing Foreclosures through Strategic Partnerships Bruce Gottschall, Executive Director Neighborhood Housing Services of Chicago
-
Upload
truongkien -
Category
Documents
-
view
217 -
download
2
Transcript of The Home Ownership Preservation Initiative in Chicago (HOPI) · The Home Ownership Preservation...
The Home Ownership Preservation Initiative in Chicago (HOPI)
Reducing Foreclosures through Strategic Partnerships
Bruce Gottschall, Executive DirectorNeighborhood Housing Services of Chicago

Neighborhood Housing Services of Chicago
Who is NHS?The mission of NHS is to help neighborhoods stay strong –by helping people buy, fix or stay in their homes. We are a not for profit community organization that has been working in Chicago neighborhoods for 30 years.
We have 8 local offices that serve 9 targeted neighborhoods:
Auburn Gresham/Englewood West Englewood – 60620 & 60636
Back of the Yards/Garfield Boulevard – 60609 & 60621 Chicago Lawn/Gage Park - 60629, 60632 & 60652 North Lawndale – 60623 & 60612 Roseland – 60628 South Chicago – 60617West Humboldt – 60624 & 60651Central Office – Provides City-Wide programs
We Serve 1We Serve 1--4 unit homeowner occupants4 unit homeowner occupants
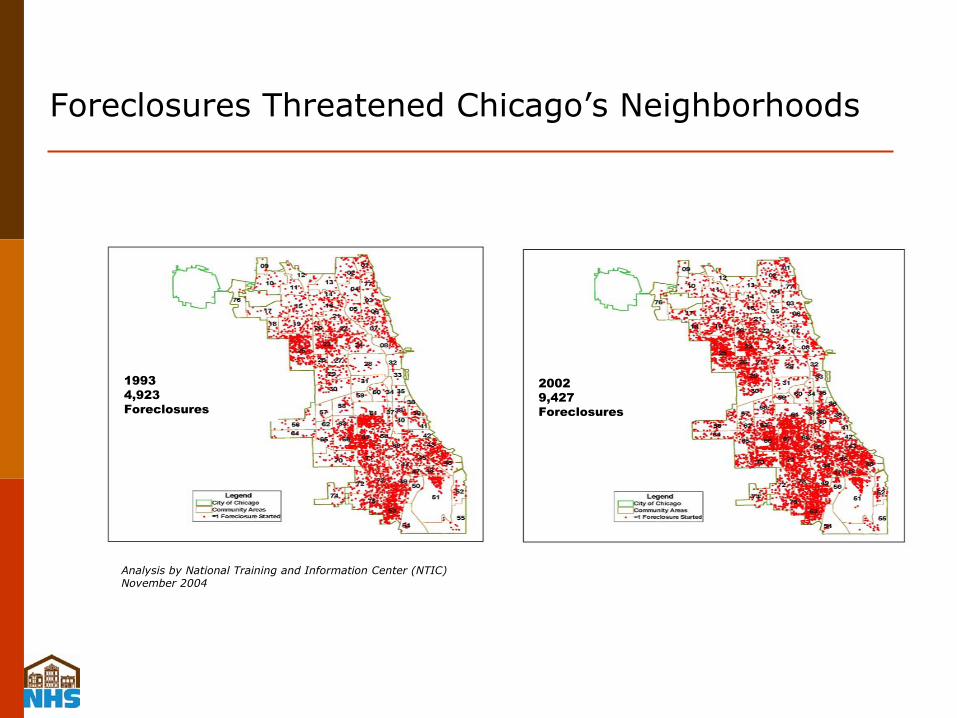
Foreclosures Threatened Chicago’s Neighborhoods
19934,923 Foreclosures
20029,427 Foreclosures
Analysis by National Training and Information Center (NTIC)November 2004

Fast Foreclosures in NHS Targeted AreasHalf of Loans Start Foreclosures within 3 years of Origination
Dramatic increase Since 1993
Share of Loans Foreclosing Within 1-36 Months of Origination, 1993 and 2001
0%
10%
20%
30%
40%
50%
60%
NHS Targeted Areas
19932001
52% of all loans starting foreclosure in 2001 were originated after 1998
72% of loans which were priced 300 basis points over 30 year Treasury and starting foreclosure in 2001, were originated after 1998
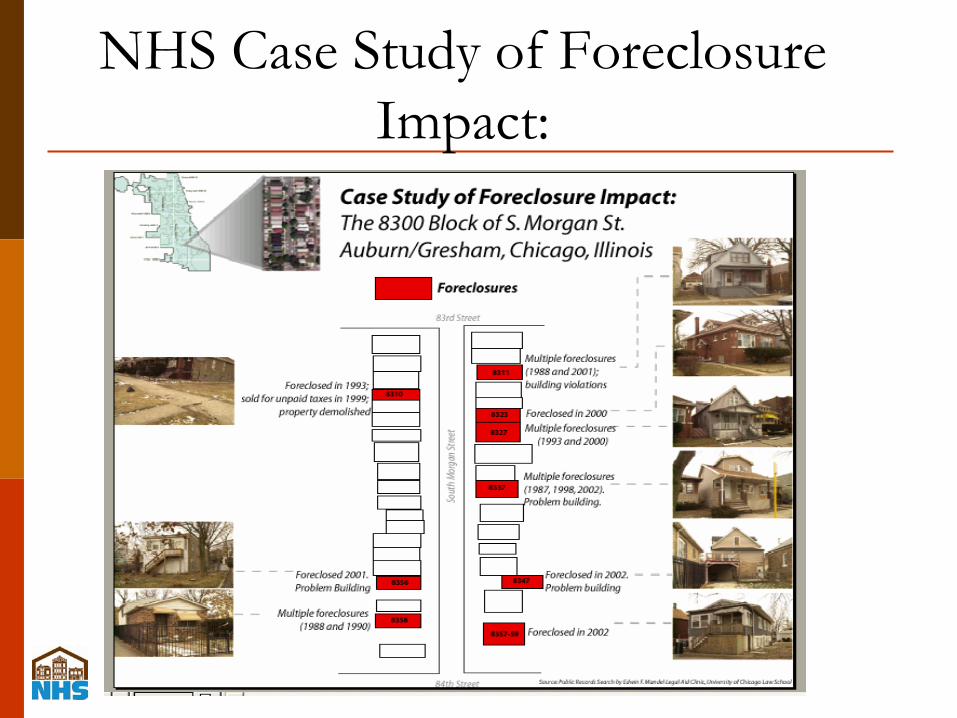
NHS Case Study of Foreclosure Impact:

Chicago’s Home Ownership Preservation Initiative (HOPI) Model
Partnership Between:NHSCity of Chicago, Department of HousingFederal Reserve Bank of ChicagoMajor Lenders/Servicers
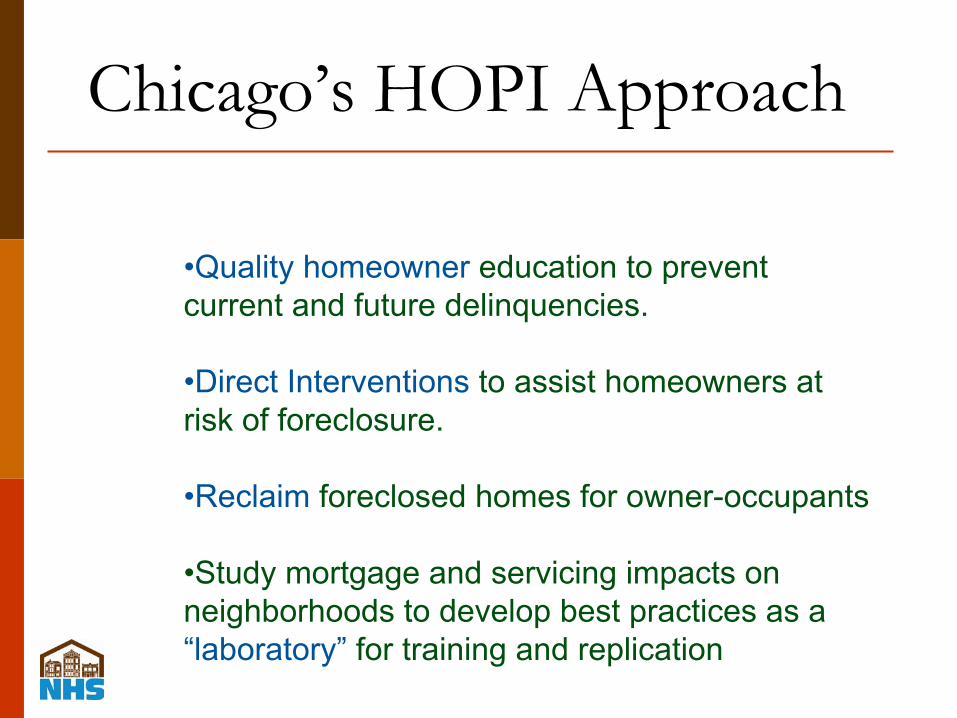
Chicago’s HOPI Approach
•Quality homeowner education to prevent current and future delinquencies.
•Direct Interventions to assist homeowners at risk of foreclosure.
•Reclaim foreclosed homes for owner-occupants
•Study mortgage and servicing impacts on neighborhoods to develop best practices as a “laboratory” for training and replication
Chicago’s Home Ownership Preservation Initiative(HOPI)
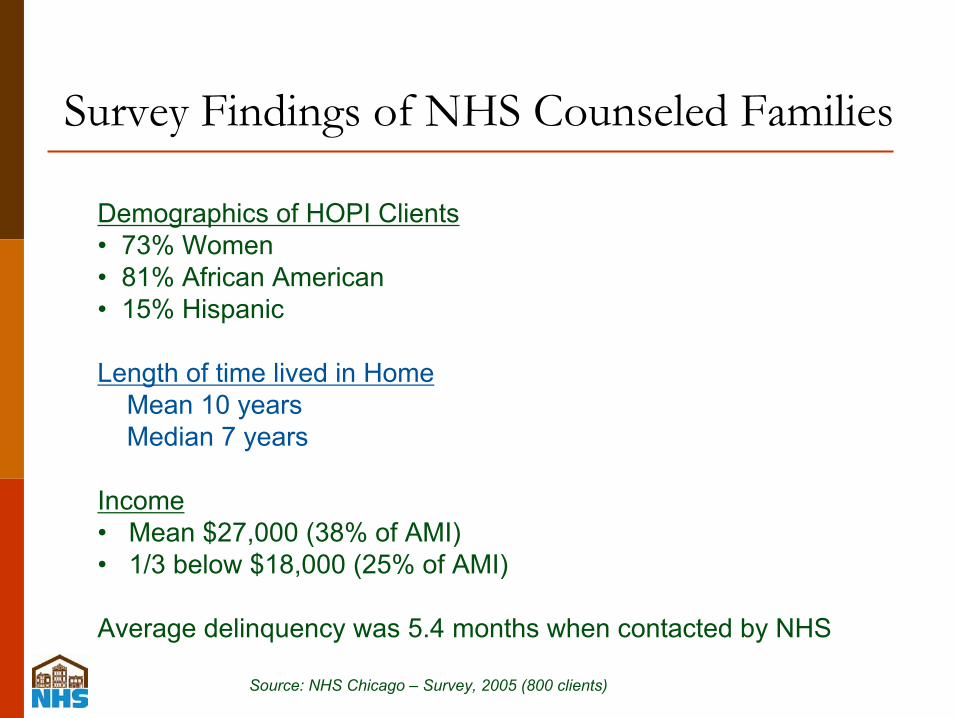
Survey Findings of NHS Counseled Families
Demographics of HOPI Clients• 73% Women• 81% African American• 15% Hispanic
Length of time lived in HomeMean 10 yearsMedian 7 years
Income• Mean $27,000 (38% of AMI)• 1/3 below $18,000 (25% of AMI)
Average delinquency was 5.4 months when contacted by NHS
Source: NHS Chicago – Survey, 2005 (800 clients)

Profile of Respondents
69% First-time Buyers55% First-time Refinancers52% First-time DefaultersMedian Purchase Time: 5 years agoMedian Mortgage Balance: $87,50062% have filed for Bankruptcy at some pointAverage Delinquency: 4.6 Months (up to 3 years)
Source: NHS Chicago-Defaulted Borrowers Survey, 2005 (289 respondents)

72% of Defaulted Loans are Refinances
7%Other
4%Education
5%Appliances
5%Medical Costs
5%Investments
6%Taxes
24%Bill Consolidation
44%Home Improvement/Repair
Use of Loan Proceeds
Source: NHS of Chicago-Defaulted Borrowers Survey, 2005 (183/289 respondents)
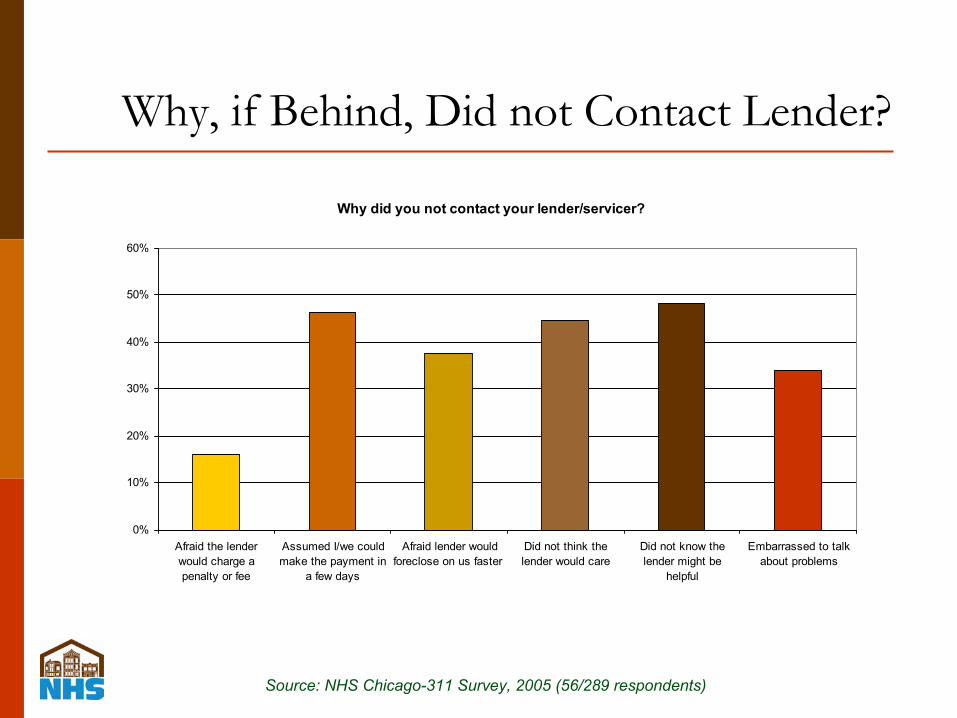
Why, if Behind, Did not Contact Lender?
Source: NHS Chicago-311 Survey, 2005 (56/289 respondents)
Why did you not contact your lender/servicer?
0%
10%
20%
30%
40%
50%
60%
Afraid the lenderwould charge apenalty or fee
Assumed I/we couldmake the payment in
a few days
Afraid lender wouldforeclose on us faster
Did not think thelender would care
Did not know thelender might be
helpful
Embarrassed to talkabout problems

NHS of Chicago Resources:
Intensive Foreclosure Counseling
Foreclosure Intervention ProgramBelow-market rate loans to reinstate a mortgage
Homeownership Preservation Initiative RefinanceAnd Refinance/Rehab Loans
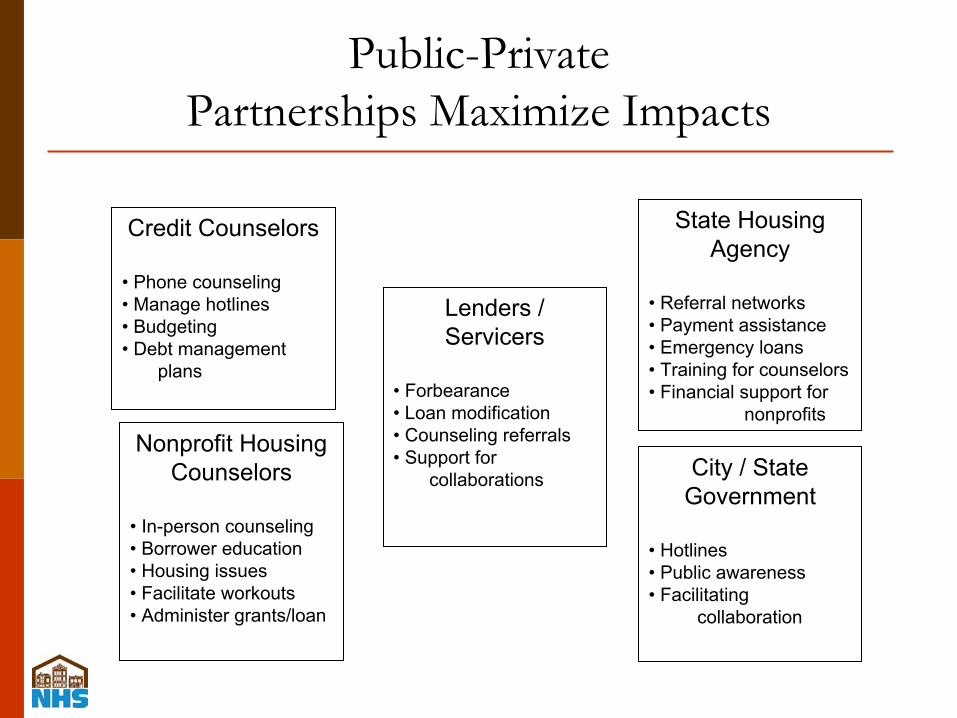
Public-Private Partnerships Maximize Impacts
Nonprofit Housing Counselors
• In-person counseling• Borrower education• Housing issues• Facilitate workouts• Administer grants/loan
Credit Counselors
• Phone counseling• Manage hotlines• Budgeting• Debt management
plans
Lenders / Servicers
• Forbearance• Loan modification• Counseling referrals• Support for
collaborations
State Housing Agency
• Referral networks• Payment assistance• Emergency loans• Training for counselors• Financial support for
nonprofits
City / State Government
• Hotlines• Public awareness• Facilitating
collaboration
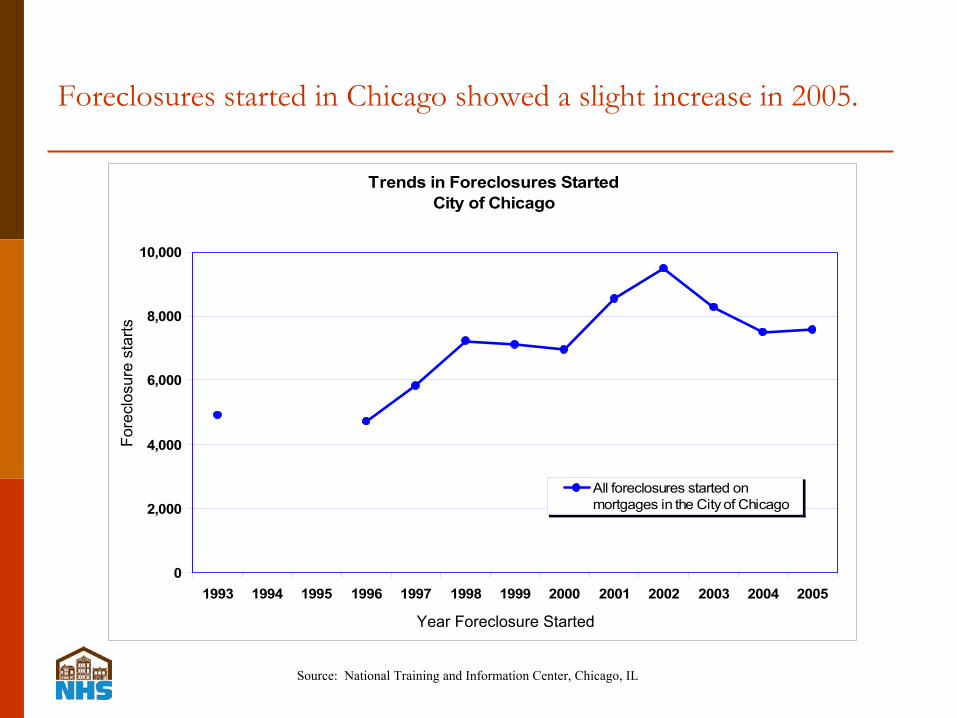
Trends in Foreclosures StartedCity of Chicago
0
2,000
4,000
6,000
8,000
10,000
1993 1994 1995 1996 1997 1998 1999 2000 2001 2002 2003 2004 2005
All foreclosures started onmortgages in the City of Chicago
Fore
clos
ure
star
ts
Year Foreclosure Started
Source: National Training and Information Center, Chicago, IL
Foreclosures started in Chicago showed a slight increase in 2005.

The decrease in foreclosures started on sub-prime and high-cost loans (6% and 27%, respectively) in 2005 was completely off-set by a 43% increase on prime rate loans.
Trends in Foreclosures Started by Interest Rate Level(Conventional & N/A loans only)
City of Chicago
0
500
1,000
1,500
2,000
2,500
3,000
3,500
4,000
1993 1994 1995 1996 1997 1998 1999 2000 2001 2002 2003 2004 2005
Prime
Sub-prime
High Cost
Not Specified
Fore
clos
ure
Sta
rts
Source: National Training and Information Center, Chicago, IL
Year Foreclosure Started

Foreclosures started on newly originated prime rate loans that were identified as ARMs and/or balloon payment loans increased by 152% in 2005.
Trends in Foreclosures Started on Young Loanswith ARMs or Balloon Characteristics
(Conventional or N/A Loans Only)City of Chicago
0
200
400
600
800
1,000
1,200
1,400
1,600
1993 1994 1995 1996 1997 1998 1999 2000 2001 2002 2003 2004 2005
Prime
Subprime
High Cost
No Information
Source: National Training and Information Center, Chicago, IL
Year Foreclosure Started
Fore
clos
ure
Sta
rts
Loss Mitigation Tools•Repayment Plan
•Loan Modification
•Forbearance
•Redemption of reinstatement
•Short-payoff
•Refinance
Issues and Barriers•Consolidation of servicing
Efficiency – cost counting “only”Strong computer systemsRemotenessOne size fits all
But Servicer can be ally because they see the problems caused by bad lending
•Investor distant from transactionsRisk spread therefore hard to find someone who cares
-Residual risk often held by issuer-aggregatorSecuritization protects investor from risk and lossMany levels to investor creates conservative interpretations- Servicer and master servicer roles
There are real losses on foreclosures but who loses and where is the economic leverage on this?Reputation risk
Issues and Barriers
Value that NFP, counselor and community brings to the process
Gain greater contact with borrowers
Third party Trusted advisor role really can create solutions
Push proactive loss mitigation efforts
Access to other resources- Public Funds- Other private sourcess
Issues and Barriers
What’s changing and what’s needed
ARM reset – payment shock issue- Big enough to create new look at the problem?
Teams in sub-prime servicers working to develop new responsive proactive servicing and loss mitigation efforts
- We need better contact inside servicer to decide
Re-looking at some of security inflexibility to create better loss mitigation efforts
Lending and foreclosure fraud are increasing – what value can we add
Emerging TrendsMortgage Rescue Fraud
Distressed property consultants and
Distressed property purchasers
“Flip and Default”“No Doc”“Fee for Service”“Buy Lease Back”