The Home Buyers of Tomorrow—What Millennials really Want
99
THE HOME BUYERS OF TOMORROW—WHAT MILLENNIALS REALLY WANT Presented by Carmen Hirciag, MBA Senior Research Analyst
description
The Home Buyers of Tomorrow—What Millennials really Want. Presented by Carmen Hirciag , MBA Senior Research Analyst. Survey Methodology. 1,000 online surveys conducted in Aug 2014 Respondents: CA residents, age 18-34. Who is THE typical millennial?. Demographics. Famous Millennials. - PowerPoint PPT Presentation
Transcript of The Home Buyers of Tomorrow—What Millennials really Want

THE HOME BUYERS OF TOMORROW—WHAT MILLENNIALS REALLY WANT
Presented byCarmen Hirciag, MBASenior Research Analyst

Survey Methodology
• 1,000 online surveys conducted in Aug 2014
• Respondents: CA residents, age 18-34

WHO IS THE TYPICAL MILLENNIAL?Demographics

Famous Millennials

gen Y! echo boomers! generation next!
1980-1996
3 out of 4
1 out of 5 80%
20 texts/ day
18-34 11 million
56%
computers

Typical Millennial
24 Years Old
28% College Educat
ed
62%
Minority
50% Single
$35K Median Income

Median Age: 24
What is your age?
18 19 20 21 22 23 24 25 26 27 28 29 30 31 32 33 340%
2%
4%
6%
8%
10%
12% 11%
9%
7% 7%6%
6%
7%
5%6%
4% 4%5%
6%
4% 4% 4% 4%
Age (Years)

¾ Millennials Not Married
What is your marital status?
Married 26%
Single 50%
In a com-mitted re-lationship
23%
Other 2%

Marital Status Varies by Age Group
18-26 27-34 All0%
10%
20%
30%
40%
50%
60%
70%
80%
90%
100%
23% 21% 23%
62%
29%
50%
13%
47%
26%
MarriedSingleIn a committed rela-tionshipOther
*Source: 2013 American Community Survey, U.S. Census Bureau What is your marital status?

Education
*Source: 2013 American Community Survey, U.S. Census Bureau What is the highest level of education you have completed?
Graduate school
Four-year college
Some College
High school
Some High school
0% 5% 10%15%20%25%30%35%40%45%50%
6%
22%
38%
23%
4%
11%
36%
27%
11%
3%
3%
14%
44%
30%
4%
18-2627-34All

62% are Minorities
What is your ethnic background?
0%
5%
10%
15%
20%
25%
30%
35%
40%
38%35%
18%
7%
4%

1/2 Millennials are Employed
Student 24%
Unemployed 20%
Employed 52%
Other 3%
What is your employment status?

Majority Employed
What is your employment status?
18-26 27-34 All0%
10%
20%
30%
40%
50%
60%
70%
80%
90%
100%
2% 5% 3%
43%
68%
52%
20%
21%
20%
35%
6%
24%
StudentUnemployedEmployedOther

Only 1/3 Millennials Have Full Time Jobs
What is your employment status?
Other
Full time
Part time
Unemployed, looking for a job
Unemployed, not looking for work
Full time student
Part time student
0% 5% 10% 15% 20% 25% 30% 35%
3%
33%
19%
14%
6%
20%
4%

Employment Status Varies by Age Group
What is your employment status?
Other
Full time
Part time
Unemployed, looking for a job
Unemployed, not looking for work
Full time student
Part time student
0% 10% 20% 30% 40% 50% 60%
3%
33%
19%
14%
6%
20%
4%
5%
54%
14%
13%
8%
2%
4%
2%
22%
21%
15%
5%
5%
30%
18-2627-34All

Top Millennial Professions•management5.9%
•education5.2%
•healthcare5.1%
What is your profession?

Median Years in Current Job: 2
How many years have you been in your current job?
<1 1 2 3 4 5 6 7 8 9 10 11 12 13 14 15+0%
5%
10%
15%
20%
25%
18%
22%
15%
11%
7% 8%
4%3% 3%
1%3%
1%2%
1% 1%2%
Time in Current Job (Years)

Majority Earn Less than $40k/Year
What is your annual household income?
0%
2%
4%
6%
8%
10%
12%
14%
16%
18%
18%
14%15%
11%
10%
5%4%
7%
3%
6%5%
3%
Income (In Thousands)

Older Millennials Have Higher Earnings
18-26 27-34 All$0
$10,000
$20,000
$30,000
$40,000
$50,000
$30,000
$50,000
$35,000
Median Annual Household Income
Age Group
What is your annual household income?

Nearly 2/5 Millennials Live w/Parents
What is your current living situation?
I rent I live with my parents
I own I live in a dorm
Other:0%
5%
10%
15%
20%
25%
30%
35%
40%
45%41%
36%
20%
1%1%

Nearly ½ of 18-26 Year Olds Live w/Parents
What is your current living situation?
I own I rent I live with my parents
I live in a dorm
Other:0%
5%
10%
15%
20%
25%
30%
35%
40%
45%
50%
11%
37%
49%
2% 2%
38%
49%
12%
1%
20%
41%
36%
1% 1%
18-2627-34All

Majority Have Lived in Current Home <2 Years
How many months have you been living in your current residence?
<1 year 1-2 years 2-5 years 5+ years0%
5%
10%
15%
20%
25%
30%
35%
40%
40%
19%
22%20%

Slightly More than Half Live in Single Family Homes
In which type of home do you currently live?
Single fam-ily
55%
Multifamily42%
Other3%

> 1/2 Live in Single Family Homes
In which type of home do you currently live?
0%
10%
20%
30%
40%
50%
60%55%
31%
5% 5%1% 3%

0 1 2 3 4 5 60%
10%
20%
30%
40%
50%
60%
Adults Children
Number of People
Nearly Half Don’t Have Children
How many people live in the home?

Nearly Half Don’t Have Children
How many people live in the home?
0 1 2 3 4 5 60%
10%
20%
30%
40%
50%
60%
Adults Children
Number of people
18-2627-34

Most Households are Families
Please indicate the relationship between you and the other people living with you.
Family 86%
Roomates 10%
Other 6%

RENTERS

Median Monthly Rent: $1,075
How much is your monthly rent?
0%
1%
2%
3%
4%
5%
6%
7%
8%
9%
10% 9%
7%6%
5%
10%
7%
8%
5%
9%
6%
5%
6%6%
3%
6%
4%
Rent ($)

Affordable Rent is Top Reason for Choosing Current Residence
What was the most important reason for electing to live in your current residence?
Other
Near shopping
Close to public transportation
Amenities
School district
Quiet/privacy
Larger space
Near family
Near work
Near school
I like the neighborhood
Affordable rent
0% 5% 10% 15% 20% 25% 30% 35% 40% 45% 50%
2%
1%
1%
2%
2%
3%
4%
5%
6%
7%
17%
48%

1/10 Renters Previously Owned a Home
Have you ever owned a primary residence?
Yes 12%
No 88%

Majority Sold Home After 2009
What year did you sell your primary residence?
0%
2%
4%
6%
8%
10%
12%
14%
16%
18%
20%
4%6%
2%4%
4%
2%
6%
2%
4%
11%
4%
13%
7%
9%
6%
20%
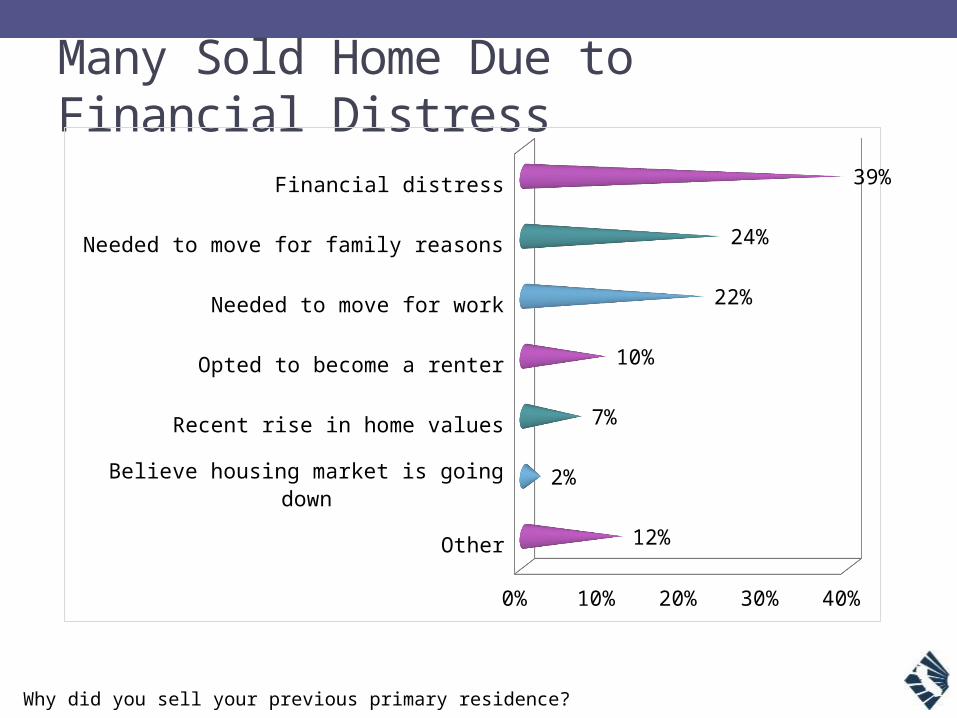
Many Sold Home Due to Financial Distress
Why did you sell your previous primary residence?
Other
Believe housing market is going down
Recent rise in home values
Opted to become a renter
Needed to move for work
Needed to move for family reasons
Financial distress
0% 10% 20% 30% 40%
12%
2%
7%
10%
22%
24%
39%

Majority Rent Because they Can’t Afford to Buy
Why do you rent instead of buying?
Other
Believe housing market will decline in the near future
No interest in buying
Don't want the responsibility of owning
Don't have a job
Enjoy the flexibility/freedom of renting
Too costly to maintain property as owner
Can't qualify for a mortgage
Don't have a down payment
It's easier to rent
Not ready to buy
Can't afford to buy
0% 10%20%30%40%50%60%70%80%
2%
4%
7%
9%
10%
15%
16%
17%
20%
24%
37%
67%

Most Expect to Buy a Home Within 5 Years
When do you expect to buy a home?
With
in a
yea
r
In 1
-3 y
ears
In 3
-5 y
ears
Whe
n I g
et m
arrie
d
Whe
n I h
ave
a ch
ild
Never
Other
Don't
know
0%
5%
10%
15%
20%
25%
30%
35%
18-2627-34All

Affordable Home Price is #1 Motivator to Buy Now
What would most motivate you to buy a home now?
Other
Tax incentives
Favorable interest rates
Improvement in credit score
Nothing, I don't want to buy a home
Starting a family
Improvement in finances
Having money for down payment
Affordable home price
0% 5% 10%15%20%25%30%35%40%
2%
1%
4%
4%
9%
13%
15%
16%
36%

Most Plan to Buy Locally
Where do you plan to buy your next primary residence?
Don't know/unsure
Another country
Another state
In another county in California
In the same neighborhood where I currently reside
Within the same county where I currently reside
0% 5% 10%
15%
20%
25%
30%
35%
40%
45%
50%
19%
1%
7%
9%
18%
46%

Millennials Prefer Single Family Homes
What type of residence do you plan to purchase?
Detached sin-gle-family home
Townhouse/ condominium
Don't know/ unsure
Other0%
10%
20%
30%
40%
50%
60%
70%
67%
12%
20%
1%

Big Lots in the Suburbs are Highly Desirable
Which of the following features would you like to have in your ideal home?
Other
Don't know/ unsure
High rise building
Urban location
Live/ work space
View
Suburban location
Lots of land/ big lot
0% 5% 10% 15% 20% 25% 30% 35% 40% 45%
3%
8%
12%
27%
34%
36%
41%
42%

Ideal Neighborhood Features
Which of the following features would you like to have in your ideal neighborhood?
Other
Resort area
Ethnic
Rural
Don't know/ unsure
Urban pioneer
Cul-de-sac
Urban core
Historic
Gated community
Pedestrian-oriented
0% 5% 10% 15% 20% 25% 30% 35% 40% 45%
1%
8%
10%
11%
14%
17%
20%
21%
22%
28%
41%

Majority Would Begin Home Search Online
How would you begin your search for a home to purchase?
Other
Consult friends/family
Contact real estate agent
Online search
0% 10% 20% 30% 40% 50% 60%
7%
15%
22%
56%

8/10 Feel Home Ownership is Important
How important is home ownership to you on a scale of one to 10, with one being not at all important and 10 being extremely important?
1 - Not
at a
ll Im
porta
nt 2 3 4 5 6 7 8 9
10 - Ver
y Im
porta
nt0%
5%
10%
15%
20%
25%
30%
2% 2%5%
3%8%
12%15%
26%
12%
16%

Advantages of Home Ownership
In your opinion, what are the advantages of home ownership?
Tax deductions
Equity/investment
Stability/security
More space
Better quality of life
Satisfaction of ownership
Privacy
Freedom to do what you want with the property
0% 10% 20% 30% 40% 50% 60% 70%
24%
39%
43%
45%
46%
49%
56%
64%

Advantages of Home Ownership
In your opinion, what are the advantages of home ownership?
Equity/investment
Privacy
0% 10% 20% 30% 40% 50% 60% 70%
45%
51%
34%
60%
18-26 27-34

Millennials’ Biggest Concerns
What are your biggest concerns about home ownership?
Price/Affordability (45%)
Problems with Credit, Mortgages, or Taxes (19%)
Maintenance/Upkeep (14%)
Satisfaction with Home/Location (7%)
Responsibility (4%)

Housing Crisis Affected Home Ownership Perspective
Has the recent (2007-2008) housing crisis made you less likely to consider owning a home a good investment?
Yes; 41%
No; 59%

½ Have Student Debt
What is the balance of your outstanding student debt?
$1-10K $10K-20K $20K-50K $50K-100K >$100K0%
5%
10%
15%
20%
25% 21%
12% 12%
3%2%
Student Debt (In Thousands)

Student Debt Not Preventing Most from Buying
Is your student debt preventing you from qualifying for a mortgage?
Yes 12%
No 61%
Don't know 27%

More than Half have Other Debt that Prevents Buying a Home
What other type of debt do you have that would make it difficult to buy a home?
Other
Private loan from friend/ relative
Consolidated personal loan
Auto loan
Credit cards
None
0% 5% 10% 15% 20% 25% 30% 35% 40% 45% 50%
4%
7%
8%
17%
41%
43%

Older Millennials Have more Debt
What other type of debt do you have that would make it difficult to buy a home?
Consolidated personal loan
Auto loan
Credit cards
0% 10% 20% 30% 40% 50% 60%
9%
23%
50%
8%
13%
36%
18-2627-34

Most Uncertain/Doubtful they Could Obtain a Mortgage Now
Could you obtain a mortgage if you applied now?
Yes 22%
No 33%
Don't know 45%

HOME OWNERS

Most Homes Purchased after 2009
What year was the home purchased?
2000
2001
2002
2003
2004
2005
2006
2007
2008
2009
2010
2011
2012
2013
2014
0%
2%
4%
6%
8%
10%
12%
14%
16%
18%
20%
3%1%
2%
0%2% 2% 2% 1%
6%
11%
8%10%
19%
15%
5%
Year

<3/10 Inherited their Homes
Who originally purchased the home?
Another family member
My spouse/significant other
My parent(s)
I purchased the home
0% 10% 20% 30% 40% 50% 60% 70% 80%
3%
7%
18%
72%

Majority Purchased their Homes
Who originally purchased the home?
My spouse/significant other
My parent(s)
I purchased the home
0% 10% 20% 30% 40% 50% 60% 70% 80% 90%
9%
9%
79%
4%
36%
57%
18-2627-34

Most Millennials are First-Time Buyers
Was this your first home purchase?
Yes; 88%
No; 12%
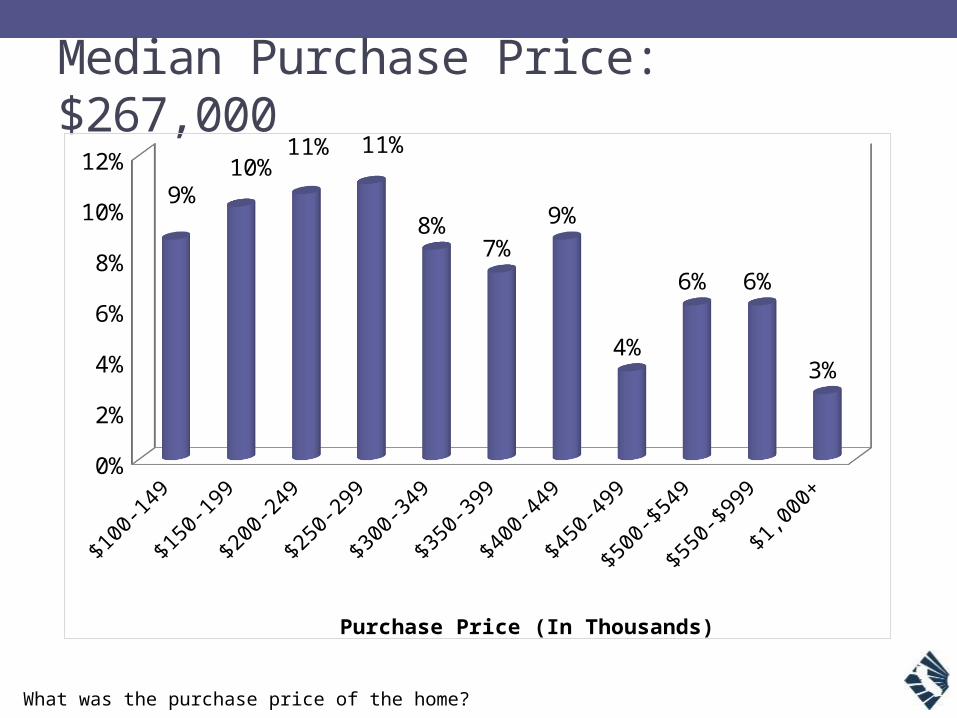
Median Purchase Price: $267,000
What was the purchase price of the home?
0%
2%
4%
6%
8%
10%
12%
9%10%
11% 11%
8%7%
9%
4%
6% 6%
3%
Purchase Price (In Thousands)

Older Cohort Purchased Pricier Homes
What was the purchase price of the home?
18-26 27-34 All$0
$50,000
$100,000
$150,000
$200,000
$250,000
$300,000
$210,500
$295,500
$267,000
Median Price

Purchase Price Highest in NorCal
What was the purchase price of the home?
Northern CA Southern CA Other CA All$0
$50,000
$100,000
$150,000
$200,000
$250,000
$300,000
$350,000
$400,000
$400,000
$267,000
$200,000
$267,000
Median Price

Affordability is Main Reason for Buying a Home
What were your main reasons for buying a home?
Other
To rent it out
To flip it for a profit
Desired smaller home
Investment/Tax advantages
Favorable financing
Changed jobs/Relocated
Tired of renting
Desired better/other location
Desired larger home
Change in family status
Affordable price
0% 5% 10% 15% 20% 25% 30% 35% 40%
1%
1%
2%
5%
11%
17%
22%
23%
24%
29%
30%
37%

Many Didn’t Buy Sooner Due to Lack of Urgency
Why didn’t you buy a home sooner?
Other
Difficulty qualifying for mortgage
Needed to sell existing home first
Not many good housing options
Waited until finances improved
Needed to save for down payment
Waited to see when prices would stabilize
No buying urgency
0% 5% 10% 15% 20% 25% 30% 35%
5%
7%
8%
26%
26%
27%
32%
33%

Location! Location! Location!
What was the most important reason for selecting the home you purchased?
Other
School district
Size
Walkability
Home features
Neighborhood
Location
0% 10% 20% 30% 40% 50% 60%
2%
4%
5%
6%
8%
18%
57%

Majority Found Home Through Agent
How did you find the home you purchased?
Other
Newspaper
Open House
For sale sign
Internet
Real estate agent
0% 10% 20% 30% 40% 50% 60%
4%
4%
6%
7%
26%
54%

Most Found Home on Zillow or Realtor.com
If found home on internet, on which website did you find your home?
Other
Broker
Zip Realty
Redfin
Trulia
Agent
Craigslist
Realtor.com
Zillow
0% 5% 10% 15% 20% 25% 30% 35% 40% 45%
6%
2%
3%
5%
6%
6%
10%
23%
39%

Future Home Price Expectations are Positive
In one year In five years0%
10%
20%
30%
40%
50%
60%
70%
80%
90%
100%
11% 14%
9%12%
21% 10%
59% 63%
UpFlatDon't knowDown
Do you think home prices in the neighborhood where you purchased will go up, down or stay flat in …

Positive Attitude Toward Home Buying Process
How would you describe your attitude towards the home buying process?
Positive Negative Neutral N/A Other0%
10%
20%
30%
40%
50%
60%50%
34%
8%4%
4%

Home Buying Experience vs. Expectations
How did the actual home buying experience compare to your expectations prior to beginning the process?
Better than expected/Good
Worse than expected/Bad
Same as expected0%
5%
10%
15%
20%
25%
30%
35%
40%
45%40%
25%20%

More than 4/5 are Satisfied with Home
Are you satisfied with the home you purchased or do you feel like you selected the best option given the limited supply of homes?
Satisfied; 85%
Selected best option given limited sup-
ply; 15%

Most Planning to Keep Property <5 Years
How long do you plan to keep the property?
<1 1-2 2-3 3-4 4-5 5-6 6-7 7+0%
5%
10%
15%
20%
25%
7%
15% 15%
10%
18%
9%
4%
22%
Years

Older Millennials Plan to Keep Home 1 Year Longer
How long do you plan to keep the property?
18-26 27-34 All0.00.51.01.52.02.53.03.54.04.55.0
3.8
4.74.3
Average
Millennial Age Group
# of Years

Most Want Better Agent Communication
If there were one thing you could change about your home buying experience, what would it be?
Other
Better agent negotiation
Faster agent response
Nothing, I would not change anything
Better market understanding
Better communication with agent
0% 10% 20% 30% 40% 50% 60% 70% 80%
9%
16%
31%
53%
64%
69%

Advice to First-Time Buyers
What advice would you give to other first time buyers?
Other
Find out how frequently your agent will be in contact
Don't use the sellers' agent
Get pre-qualified for a mortgage by more than 1 lender
Check agents' references
Make your agent prove he/she will negotiate hard for you
Find out how fast your agent will respond to you
Do your homework online
0% 10% 20% 30% 40% 50% 60%
3%
13%
16%
22%
24%
28%
33%
54%

Most Wouldn’t Sell Home Now
Would you consider selling your home now?
Yes; 27%
No; 57%
Don't know; 16%

Financing

Majority Obtained Financing
How did you pay for the home you purchased?
Obtained financing;
83%
All cash; 17%

Cash Funds Mainly from Personal Savings
If all cash, where did the funds come from? N = 41
Supplied by employer contribution
Supplied from governent
Other
Sales from personal assets
Borrowed or gifted
Inheritance
Proeeds from a previous residence
Personal savings
0% 10% 20% 30% 40% 50% 60%
2%
2%
5%
12%
17%
22%
27%
51%

Average Down Payment: 26%
0 1 to 5 6 to 10 11 to 15 16 to 20 21 to 25 26 to 30 31 to 35 36 to 50 50+0%
2%
4%
6%
8%
10%
12%
14%
16%
5%
8%
13%
8%
15%14%
9%8%
11%
12%
Down Payment (%)
How much was your down payment for the home purchased (as a percentage of the sale price)?

Average Difficulty Rating: 4.4
Please rate how easy or difficult it was to obtain financing on a scale of one to 10, with one being very easy and 10 being very difficult.
0%
2%
4%
6%
8%
10%
12%
14%
16%
18%
20%
9%10%
19%
13%
17%
15%
8% 8%
1% 1%
Buyer/ Agent Relationship

Many Related to Agent
How did you find your real estate agent?
Prior dealings with the company in other areas
Other
Prior dealings with real estate agent
"For Sale" signs in the neighborhood
Met at an event
Agent's farming material
Did not use an agent
Internet
Referral from friends, relatives, neighbors, or other contacts
Agent is a relative or friend
0% 5% 10% 15% 20% 25% 30% 35%
2%
3%
3%
6%
6%
8%
10%
12%
19%
31%
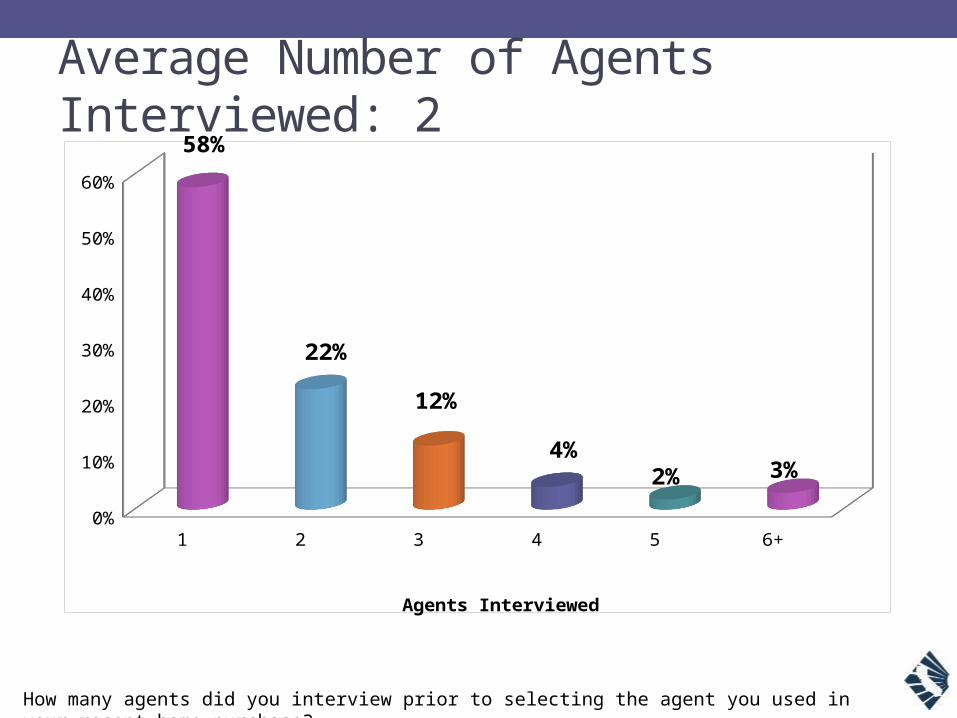
Average Number of Agents Interviewed: 2
How many agents did you interview prior to selecting the agent you used in your recent home purchase?
1 2 3 4 5 6+0%
10%
20%
30%
40%
50%
60%
58%
22%
12%
4%2% 3%
Agents Interviewed

Responsive Agents are Most Desired
What was the single most important reason for selecting that agent?
Distressed property knowledge
Seemed most aggressive
Negotiating ability
Other
Previously used agent
Most knowledgeable
Seemed most reponsive
0% 5% 10% 15% 20% 25% 30% 35%
3%
4%
8%
9%
17%
27%
31%

4/10 Googled Their Agent
Did you “Google” (conduct an internet search for) your agent to find out information about him/her?
Yes; 40%
No; 52%
Don't know; 8%

Average Number of Homes Viewed: 8.2
How many different homes did you preview and visit with your agent prior to making a purchase?
1 2 3 4 5 6-10 11-20 21+0%
5%
10%
15%
20%
25%
10% 11%
19%
7%
12%
21%
13%
7%
Homes Viewed

Average Number of Offers on Other Homes: 2.3
How many offers did you make on other homes?
0 1 2 3 4 5 6 to 10 11+0%
5%
10%
15%
20%
25%
30%
20%
28%25%
12%
3%
6%4%
3%
Number of Offers

Preferred vs. Actual Communication
Fax
Social m
edia
Text
mes
sage
In p
erso
n
Teleph
one
0%
5%
10%
15%
20%
25%
30%
35%
40%
Preferred Actual
What was your preferred method of communicating with your agent and how did your agent primarily communicate with you?
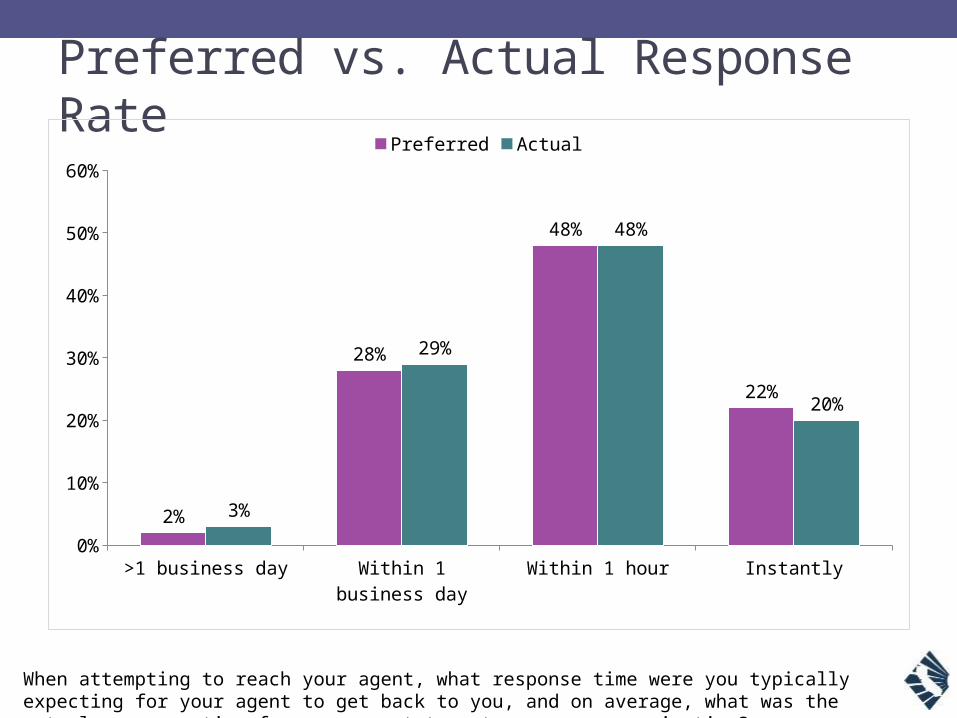
Preferred vs. Actual Response Rate
>1 business day Within 1 business day
Within 1 hour Instantly0%
10%
20%
30%
40%
50%
60%
2%
28%
48%
22%
3%
29%
48%
20%
Preferred Actual
When attempting to reach your agent, what response time were you typically expecting for your agent to get back to you, and on average, what was the actual response time for your agent to return your communication?

Overall Home Buying Process Average Satisfaction Rating: 7.3
Please rate your degree of satisfaction with the overall process of buying a home on a scale of one to 10, where one is least satisfied and 10 is most satisfied.
1 - Least Satisfied
2 3 4 5 6 7 8 9 10 - Most
Satisfied
0%
5%
10%
15%
20%
25%
30%
35%
1% 1%4%
2%6%
11%
21%
33%
11% 11%

Average Agent Satisfaction Rating: 7.5
Please rate your degree of satisfaction with your real estate agent on a scale of one to 10, where one is least satisfied and 10 is most satisfied.
1 - Least Satisfied
2 3 4 5 6 7 8 9 10 - Most
Satisfied
0%
5%
10%
15%
20%
25%
30%
2%1%
4%2%
6%9%
17%
28%
14%17%

Why Were Millennials Satisfied with their Agent?
Why do you have that level of satisfaction with your agent?
Other
Agent was always quick to respond
Agent listened to my needs
Agent helped find the best home
Agent negotiated good deal
Agent worked hard
0% 5% 10% 15% 20% 25% 30% 35% 40%
2%
4%
7%
16%
18%
38%

What Could Agents Improve?
Why do you have that level of satisfaction with your agent?
Agent did not communicate according to my pref-erence
Agent was not aggressive in negotiation
Agent needed to do a better job of monitoring the transaction
Agent did not communicate efficiently
0% 1% 2% 3% 4% 5% 6%
3%
3%
4%
5%

Value of Hiring an Agent
What value did you receive from hiring an agent to represent you in the transaction?
0%
5%
10%
15%
20%
25%
25%
19%
10% 10%
8% 8%6%
4% 4%

4/5 Would Work with Same Agent Again
Would you work with the same agent again?
Yes; 78%
No; 12%
Don't know; 11%

Where do Millennials Need Agent Assistance?
In which part(s) of the transaction did you need the most assistance from your agent?
Other
Determining comps
Determining affordability
Negotiating terms of sale
Negotiating purchase price
Finding the right home
0% 5% 10% 15% 20% 25% 30% 35% 40% 45% 50%
2%
6%
6%
16%
27%
43%

Advice for Real Estate Agents
What advice would you give to real estate agents to improve the home buying process or their level of service?
Other
Communicate better
Understand the real estate market better
Negotiate better
Respond faster
Communicate according to client preference
0% 10% 20% 30% 40% 50%
5%
16%
17%
26%
35%
40%

Baby Boomers in the Housing Market—What’s
Ahead in their Golden Years?Thursday, October 30, 2014
2:00 PM - 3:00 PM
To register: WWW.
CAR.ORG/MARKETDATA/VIDEOS
Join us for our next webinar…


THANK [email protected]