The Historical Roots of Corruption - GVPT l … Historical Roots of Corruption State Building, ......
22
The Historical Roots of Corruption State Building, Economic Inequality, and Mass Education Eric M. Uslaner and Bo Rothstein The problem of curbing corruption has concerned philosophers, social scientists, and policy makers since Aristotle. 1 While some countries seem to have been able to carry out substantial reductions of corruption, perceived levels of corruption remain high throughout much of the world. In the 2010 Corruption Perceptions Index from Trans- parency International (TI) measuring elites’ evaluations of the honesty (or dishonesty) of political and economic institutions in their countries, 131 of the 178 nations fell below the midpoint on the 10-point scale of the index, with higher scores representing low corruption. Only twenty-three nations had scores of seven or higher, indicating that their governments are basically honest. In the Global Corruption Barometer 2013, which drew on public opinion surveys conducted by TI, Denmark was the only country [of the 107 surveyed] in which a majority of respondents did not indicate corruption to be a major problem. We do not try to resolve the debate over what corruption means. Some recent analyses have defined corruption as behavior that is opposite to “ethical universalism” 2 or “impartiality” in the exercise of public power. 3 The conceptualization of corruption as officials turning “public goods” into private goods for their own benefit may be a debatable one, but the approach is useful for its comprehensiveness. 4 Our central argument is that systemic corruption is deeply rooted in a state’s under- lying social and historical political structure. This argument is in line with a growing body of literature on historical institutionalism, which argues that historical conditions ranging from institutions to natural resources can have long-term effects on economic prosperity and democratization. 5 Our work is close to that of Glaeser et al., 6 who show that countries with the largest primary school enrollments in 1900 had the greatest gross domestic product per capita a century later. We find a similar dynamic between historical levels of education (in 1870) and contemporary (2010) levels of corruption across seventy-eight countries. The persis- tence of high levels of corruption in many countries suggests that its roots stem from 227
Transcript of The Historical Roots of Corruption - GVPT l … Historical Roots of Corruption State Building, ......

The Historical Roots of Corruption
State Building, Economic Inequality, and Mass Education
Eric M. Uslaner and Bo Rothstein
The problem of curbing corruption has concerned philosophers, social scientists, andpolicy makers since Aristotle.1 While some countries seem to have been able to carryout substantial reductions of corruption, perceived levels of corruption remain highthroughout much of the world. In the 2010 Corruption Perceptions Index from Trans-parency International (TI) measuring elites’ evaluations of the honesty (or dishonesty)of political and economic institutions in their countries, 131 of the 178 nations fellbelow the midpoint on the 10-point scale of the index, with higher scores representinglow corruption. Only twenty-three nations had scores of seven or higher, indicating thattheir governments are basically honest. In the Global Corruption Barometer 2013, whichdrew on public opinion surveys conducted by TI, Denmark was the only country [of the107 surveyed] in which a majority of respondents did not indicate corruption to be amajor problem.
We do not try to resolve the debate over what corruption means. Some recentanalyses have defined corruption as behavior that is opposite to “ethical universalism”2
or “impartiality” in the exercise of public power.3 The conceptualization of corruptionas officials turning “public goods” into private goods for their own benefit may be adebatable one, but the approach is useful for its comprehensiveness.4
Our central argument is that systemic corruption is deeply rooted in a state’s under-lying social and historical political structure. This argument is in line with a growingbody of literature on historical institutionalism, which argues that historical conditionsranging from institutions to natural resources can have long-term effects on economicprosperity and democratization.5 Our work is close to that of Glaeser et al.,6 who showthat countries with the largest primary school enrollments in 1900 had the greatest grossdomestic product per capita a century later.
We find a similar dynamic between historical levels of education (in 1870) andcontemporary (2010) levels of corruption across seventy-eight countries. The persis-tence of high levels of corruption in many countries suggests that its roots stem from
227

Comparative Politics January 2016
long-term factors rather than from more recent institutional changes. We focus on his-torical levels of education because:
(1) Education has been one of the few factors that have been linked to lower levelsof corruption;7
(2) Education leads to other factors that promote honesty, such as generalized trustand a sense of identity with the entire country rather than with specific sectsor groups;8
(3) Higher levels of education lead to greater levels of wealth and equality for coun-tries, both of which are linked to lower levels of corruption.9
The mean education level across countries has increased markedly (by six-fold,from 1870 to 2010). Yet the past bears a heavy hand: countries with the highest levelsof education at the start of the series were also those at the top 140 years later (r 5 .76).And those countries that depart most from this linear relationship between educationin 1870 and 2010 were the countries with the highest levels of education in 1870.
We offer several predictions:
(1) Greater historical levels of education lead to less perceived corruption in thepresent;
(2) Historical levels of education matter more for contemporary corruption than dochanges in education levels. The past matters more than increases in educationdo, although “catch up” matters. However, few countries have great increases inschooling levels;
(3) Historical levels of education are more important than earlier wealth (GDP percapita) in shaping corruption. Wealth matters, but education is more important;
(4) Early education levels are higher in developed countries than in former colonies,but even more critical is the background of the colonials.10 Countries with largeEuropean populations had much higher levels of education than other (former)colonies. Settlers of European origin had expectations from the state similar tothe people in their native countries, so their colonial “masters” promoted higherlevels of education for them than for primarily indigenous populations;11
(5) Countries with a more egalitarian distribution of land had higher levels ofeducation in the late 19th century—and, in turn, countries with higher educationin the past are more equal today—reflecting the importance of universal socialwelfare programs, such as universal education, for equality;12
(6) Democracy has no impact on levels of corruption or on the levels of education.Democracies had neither higher levels of education in 1870 nor less perceivedcorruption in 2010. Our case studies suggest that political ambitions to increasestate capacity did matter.
(7) Finally, we estimate an instrumental variable regression in which we show thatthree factors—mean school years in 1870, change in school years over time,and contemporary press freedom—determine contemporary levels of corrup-tion (while current per capita income, a contemporary measure of democratic
228

Eric M. Uslaner and Bo Rothstein
governance, and the net level of inequality are not significant predictors ofcorruption. In the first stage of the estimation, only former colonial statusand the share of people with European origins are significant predictors ofearly education.
Our central argument is that universal education is a critical factor in reducing corrup-tion. Countries can “catch up,” and changes in mean years of schooling also affect cor-ruption, though not as much as historical levels. This line of causality is supportedby other recent empirical work showing that universal public policies can reduce cor-ruption.13 In addition, human capital matters more than a country’s level of democracy140 years ago.14 There seems, also, to be a strong effect from the political elite’s ambi-tions to increase state capacity through educational reforms.
In our empirical analysis we combine quantitative and qualitative data. Some ofthe quantitative analyses are based upon small samples because many key variablesfor the period around 1870 (such as land inequality, GNP per capita, and share ofProtestants) are only available for a small number of countries. Space dictates that wecan only highlight a few features of our cases that are particularly important for ourtheoretical approach.
Theory: Why Universal Education Should Matter for Corruption?
A number of different arguments have been put forward for why the introduction ofuniversal education should have a positive impact for controlling corruption. Dardenand Uslaner argue that universal education creates strong social bonds among differentgroups in a society. In turn, this makes cleavages based upon clientelism and corruptionless likely.15 The introduction of universal education creates a sense of citizenship andloyalty towards the state.16 The American founders believed that universal educationlay at the heart of the “republican virtue of an open and common system” for self-government.17 More educated people are more likely to complain about corruption, evenin authoritarian states.18
Second, the introduction of free universal education should lead to a “virtuouscycle” between widespread education and increased socio-economic equality. Highlevels of inequality enable the elite to undermine the legal and political institutionsand use them for their own benefit. If inequality is high, the economic elite are likelyto pursue socially harmful policies, since the legal, political, and regulatory systems willnot hold them accountable.19
Third, access to education provided more people with the skills to find gainfulemployment so they did not have to rely on corrupt or clientelistic structures of power.20
Over time, the educational inequalities between the rich and the poor in countries thatestablished universal education were sharply reduced, though not eliminated.21
Fourth, more widespread education was critical for increasing gender equality.Nineteenth century school enrollments were highest where girls had access to education,
229

Comparative Politics January 2016
notably the United States, and lowest where girls were excluded.22 Gender equality isstrongly related to lower levels of corruption.23
Fifth, some have argued that a free press with a broad circulation is importantfor curbing corruption.24 The effectiveness of a vigilant press for curbing corruptiondepends on widespread literacy. If most people cannot read, there will be fewer news-papers sold, and the popular knowledge about corruption and the demand for account-ability and “clean government” will be lower.
We draw from these arguments a framework in which reforms such as freeuniversal education are important signals from the state to its citizens, sending themessage that the state serves more than the particularistic interests of the eco-nomic and political elite. The introduction of free universal education implies thatthe state is also an operation built on universal principles promoting a “commongood.” Mungiu-Pippidi conceptualized such policies as a change from corrupt par-ticularism to ethical universalism, and what North et al. call the transition of the statefrom a “limited access order” to an “open access order.”25 However, the frameworksof Mungiu-Pippi and North et al. lack an operational device that explains what typeof institutional change will put a society on the path toward universalism/open-access order. We argue that the introduction of universal education can serve as sucha device.
Religion, Colonialism, and Equality
In Western Europe, North America, Australia, and New Zealand, the movement forwidespread education had an important ally in expanding education: protestant churcheswanted people to be educated so that they could read the Bible. In contrast, the CatholicChurch generally feared that literacy might challenge its authority.26 Education empow-ered people not just to read the Bible, but to excel in other areas of learning. Protestantcountries, largely because of their higher levels of education, had lower levels of landinequality than did Catholic countries in the nineteenth century.27
In most colonial settings, local political communities did not have the resources tocreate mass education. Meanwhile, colonial powers did little to advance the lives of thepeople they ruled. Local leaders in colonies and weak states would finance schools for ahandful of young people (and rarely for girls), until the lands became home to peoplefrom the colonial powers. Below, we show that it was the Protestant share of thepopulation in independent countries and the European share of the population in colo-nies that shaped school enrollments.
It was not just strong states that promoted public education. Countries with moreequal distributions of land had citizenries who could make greater demands on the state,notably for education. It was economic equality, not political equality, which ledto greater literacy.28 As we show below, democracy did not lead to greater levels ofeducation. Wealthier countries were more likely to have higher levels of education,but the level of affluence mattered less than equality.
230
Eric M. Uslaner and Bo Rothstein
The Data and the Results
We first examine the roots of contemporary corruption by analyzing its linkageswith educational attainment, inequality, and democratization in the nineteenth century.Our measure of corruption is the widely used Corruption Perceptions Index (CPI) ofTransparency International for 2010, which is based on expert surveys.29 We cannotmeasure corruption directly, so we rely upon a measure of perceived corruption. Themost corrupt countries have the lowest scores on the 10-point scale. We use new datasets on historical levels of education developed by Morrison and Murtin and on his-torical income levels by Bourginon and Morrison, as well as existing data on democ-ratization, percent family farms, and percent Protestant.30 1870 is the earliest datefor which data about mean levels of schooling are available for a reasonably large setof countries (n578). Some measures—gross national product per capita, the level ofdemocracy, and family farm percentage—are only available for a small number ofcountries so we estimate ordinary least squares regressions for equations in whichwe include these measures. We estimate models for corruption and for mean schoolyears separately and then use an instrumental variable regression for corruption. Theexogenous variables predicting levels of education are colonial status and Europeanshare of the population.
More highly corrupt countries are also less likely to invest in higher education.31
However, investigating this is outside our agenda—and data. It makes no sense to“predict” 1870 education levels from contemporary corruption perceptions, and thereare no measures of corruption for the nineteenth century.
We did examine alternative predictors of education using measures of factorendowments (climates, farm animals, and agricultural outputs)32 and early technology.33
None were significant. Secondly, we present qualitative evidence about the importanceof state-building. Since there are no numerical measures of state power or bureaucraticquality available for the nineteenth century, we depend upon qualitative evidence forthis part of the analysis.
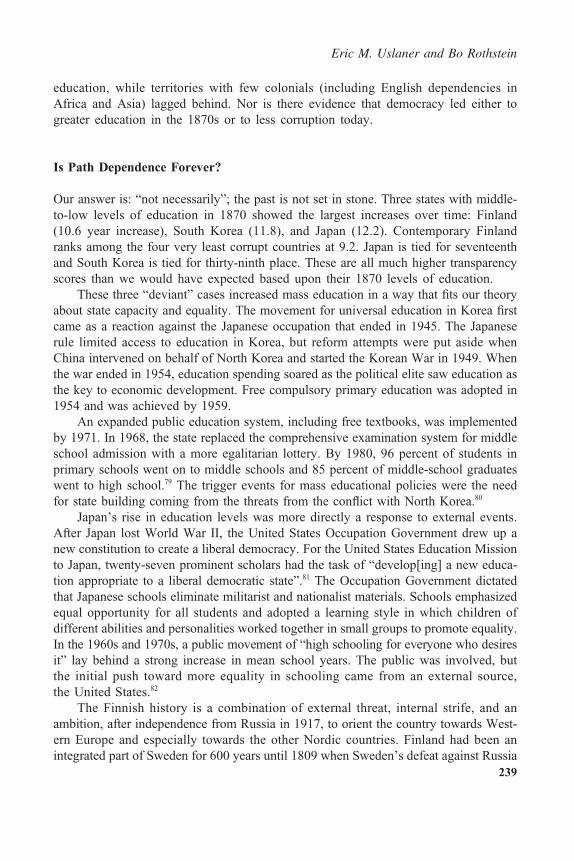
Our central result is a strong correlation between the mean number of years ofschooling in a country in 1870 and its level of corruption in 2010 (see Figure 1).Moving from the fewest years of education (.01 for four African nations) to thehighest (6.07 in Switzerland) leads to an increase in the CPI of 7.0, which is thedifference between Angola, the fourth most corrupt country, and Canada, the fifthleast corrupt nation.
The level of education in 1870 shapes corruption far more than does GNP per capitain the same year (r2 5 .542). The mean number of school years and wealth are stronglyrelated (r2 5 .604, N 5 46), but one is not a proxy for the other. In the regression, themost educated country in 1870 is 4.5 units less corrupt than the least corrupt country,while the wealthiest state is 2.5 units less corrupt than the poorest (see Table 1).
Is it all about long-term effects? Mostly, though not completely. Countrieswith high levels of education in 2010 also had more educated publics 140 years ago(r2 5 .578). Sixteen of the countries with the greatest increase in mean school years
231

Table 1 Regression of 2010 Corruption by 1870 Mean School Years and GNPPer Capita
Variable Coefficient Standard Error t Ratio
Mean School Years 1870 .738** .174 4.22
Gross National Product PerCapita 1870
.001* .0004 2.07
Constant 2.710** .422 6.42
R2 5 .677 R.M.S.E. 5 1.433 N 5 46. ** p < .01 * p < .05.
Comparative Politics January 2016
were among the twenty most educated countries in 1870; seventeen of the twentycountries with the smallest growth in education were among the least educated thirdin 1870.
Our regression predicting 2010 levels of corruption from both 1870 educationlevels and changes in schooling over 140 years shows that both are significant.34 Theimpact of historical levels of education is 2.5 times that of change in education(6.36 units of the CPI corruption index compared to 2.71; t ratios of 12.23 and 3.88,respectively; N 5 78, R2 5 .750). There is evidence of a catch-up effect: countries withthe fewest years of schooling in 1870 (less than two) had stronger growth in educationlevels; however, even here, the countries that were at the “top of the bottom” experi-enced the greatest growth rates in schooling (r2 5 .376). History matters: the simple
Figure 1 Corruption 2010 by Mean School Years 1870
NIG
ANG
NGRZIMCAM
ETH
MYN
MLI
GHA
CIVUGAINS
MOR
MOZ
SUD
SENBEN
PAK
IND
BNG
IRQ
MAL
SLPHLMAD
EGYTHA
KEN
TUR
PRU
IRNSYR
TUN
ALG
MLW
POR
BRZ
DOMJAMGUA
NIC
MEX
ELS
PARHON
PANCUBITA
CRI
RUS
CHL
JPN
CHN
SAF
VNZ
SKR
GRE
FIN
ARG
SPN
URU
BUL
HUN
IRE
AUS
ASTUK
NZ
FRA
SWE
BEL
DEN
HOL
WGR
USA
NORCAN
SWZ
24
68
10C
orru
ptio
n 20
10
0 2 4 6Mean School Years 1870
r2 = .699 N = 78
Corruption 2010 by Mean School Years 1870
232

Eric M. Uslaner and Bo Rothstein
correlation between contemporary corruption and levels of education in 1870 is higher(r 5 .836) than between corruption and contemporary mean school years (r 5 .760).
We re-estimate this model including the Polity IV measure of democracy in 1870.The sample size is reduced to forty countries (R2 5 .734). The coefficient for democracyis insignificant; going from the least to the most democratic nation increases trans-parency by mere .27 points on the ten-point scale, compared to 5.95 and 2.96 for meanlevel of education and education change, respectively. This is not an issue of col-linearity. The correlation between mean school years and democracy in 1870 is just.435, and the simple r between democracy in 1870 and corruption in 2010 is only.421. The small effect may reflect the fact that there were few democratic regimes inthe latter part of the nineteenth century. Green provides qualitative support: “One ofthe great ironies of educational history is that the more ’democratic’ nineteenth-centurypowers like France, England, and the USA … were forced to look to the autocraticGerman states for examples of educational reforms to adopt at home.”35
Western Europe: Mass Education and the Need for State-Building
The question of why and when universal and free mass education was established inEurope during the nineteenth century comes with a number of surprises. One is thatthe most economically developed country, England, was a latecomer in the process.In 1806, Prussia became the first country to introduce universal mass education, almosta hundred years before England did.
Green shows that sociological theories that stress the importance of urbanization,working-life conditions, and changing family structures cannot explain why France andPrussia (and Denmark and Sweden) developed universal mass schooling well beforeEngland.36 Instead, Green, as well as Boli and Weber, point to the political elite’s per-ceived need for state-building and national unity as the main driving force.37 Prussia,Sweden, and France developed universal mass education as a means to create “newcitizens” with a strong national identity, which, in its turn, was seen as needed foreffective state building. The French system of mass education was established not onlyto make “peasants into Frenchmen,” but, more importantly, to teach them “national andpatriotic sentiments.”38 As Green argues, the new systems for mass education
signaled a decisive break with the voluntary and particularistic mode of medieval andearly modern education, where learning was narrowly associated with specialized formsof clerical, craft and legal training, and existed merely as an extension of the corporateinterests of the church, the town, the guild and the family. Public education embodieda new universalism which acknowledged that education was applicable to all groups insociety and should serve a variety of social needs. The national systems were designedspecifically to transcend the narrow particularism of earlier forms of learning. Theywere to serve the nation as a whole.39
The new systems of mass education that arose in Denmark, France, Prussia, and Swedenwere built on new principles that citizenship should be based on universality and
233

Comparative Politics January 2016
egalitarianism; one of the most striking aspects of the universalism in the law thatestablished free mass education in Sweden in 1842 was that boys and girls wouldbe treated equally in the new system, and that they were to be taught together.40
Can particular historical cases of the development of mass education be traced tocontemporary levels of corruption? For example, Germany today has a relatively lowlevel of corruption, while Italy experiences the opposite. Can this huge difference in thelevels of corruption between Germany and Italy be traced back to variations in access tomass education during the second half of the nineteenth century? The answer seems tobe a resounding yes.
Ramirez and Boli argue that nation building was the primary reason Prussia intro-duced mass education.41 Schooling was a means “to construct a unified national polity,where individuals would identify themselves with the nation.”42 Sponsoring massschooling was a strategy for the state to avoid losing power in the interstate systembecause it encouraged “national revitalization.” Prussia, despite its strong centralbureaucracy, was a “state without a nation”: its polity was dominated by local interestsuntil in 1763 Frederick II wrote the famous “General Regulations for Village Schools”directive. Through state-directed education “… all children were taught to identify withthe state and its goals and purposes rather than with local polities (estates, peasant com-munities, regions, etc.).”43
In 1806 Napoleon triumphed over Prussia. The humiliation the Treaty of Tilsitprovoked German patriotism, which would be fostered by mass education. Accordingto the lectures of Fichte “…universal, state-directed, compulsory education would teachall Germans to be good Germans and would prepare them to play whatever role—military, economic, political—fell to them in helping the state reassert Prussianpower.”44 A Bureau of Education was established, and ten years later a department ofeducation was created. Between the years 1817 and 1825 a state administration ofeducation was established, and taxes were imposed in order to finance the schoolsystem.45 In Prussia, Denmark, France, and Sweden the introduction of universal educa-tion reforms was a response to a sense of national crisis seen to stem from a fragmentedsocial order.46
A different case is Italy, which introduced a law about universal education in 1859.Italy was not a unified nation state; it had strong regional differences. The implemen-tation of the school reform was much more efficient in the northern regions whereaslittle was done in the southern regions before 1900. According to Smith:
234
Virtually, the whole southern agricultural population was illiterate. Yet it was impossi-ble to apply the […] law of 1859 which had specified two years’ compulsory education,because parents would not have co-operated even if the teachers and schools could havebeen found.47
Putnam found great regional differences in institutional effectiveness between northernand southern Italy.48 These regional differences in corruption and the quality of govern-ment institutions persist.49 As late as 1911, half of the Italian population was illiterate.50
There was a lasting impact of what took place in national systems of education during

Eric M. Uslaner and Bo Rothstein
the late nineteenth century and contemporary levels of “good governance” not onlyamong states, but also among regions within states.
The Protestant churches in Western Europe supported public education more thanthe Catholic churches. Before the twentieth century regions with more Protestants hadhigher literacy rates.51 Scandinavia, lowland Scotland, and Iceland were all very poorand yet had broad-based literacy already by the early nineteenth century. The Protestantchurches funded religiously financed literacy campaigns and supported public education.
The Catholic Church invested in education, but only where it faced competition(such as in Ireland, North America, and in the British colonies) or when facing asecularist state such as France. Where competition was lacking—in Southern Italy,Spain, and Portugal—education was not a priority. The Catholic Church also fearedliteracy as this was seen as a means to a Protestant reformation.52
In England and the Nordic countries, the church became an official part of the state.This made it easier for these states to use the schools that were run by the local parishesor heavily influenced by the clergy as instruments for state building, not least byinfluencing the content in disciplines such as history and literature.53 While the clergyran the schools, the financing came from the state (or was mandated for the localmunicipalities by law). Universal mass education in Denmark, France, Prussia, andSweden during the nineteenth century should not be seen as a mere extension of earlierforms of church-dominated education.54 Instead, as Green argues: “What characterizedthe national education system was its ’universality’ and specific orientation towards thesecular needs of the state and civil society.”55 As a signal of “universalism” and “openaccess,” free mass education was introduced several decades before universal welfarestate programs such as public pensions or health insurance. The underlying mechanismbehind Weber’s Protestant ethic, Becker and Woessmann argue, is not the religiousmessage of hard work, but the greater literacy where Protestantism was dominant.56
Fewer Educational Opportunities: Outside the Independent Nations
Outside the developed Western countries, our data set includes 51 present or formercolonies (not including the United States, Canada, Australia, or New Zealand) and nineindependent nations that were not as developed in the late 19th century as the Westernpowers. Two of the independent countries (Bulgaria and Hungary) had education levelsjusr below those in Western Europe. China, Japan, Russia, and South Korea) had school-ing comparable to many former Spanish colonies, and a third group (Iran, Thailand, andTurkey) in the bottom third of all nations. For contemporary or former colonies in 1870,57
the mean level of education was .42, less than a half a year of schooling, compared to2.88 for the developed and independent nations. The publics in only five Western coun-tries (Portugal, Italy, Japan, Greece, and Finland, in descending order) had averageschooling less than half a year in 1870, while only two (former) colonies (Argentinaand Uruguay) had publics with that much education.. The nine independent nationsaveraged 1.2 years of education in 1870, still well below levels enjoyed in Western
235

Comparative Politics January 2016
Europe and the four English-speaking countries outside Europe (3.68) but greater thanthe former colonies of Britain (.99), and Spain and Portugal (.66).
The major powers ruling colonies in our sample were Great Britain (nineteen coun-tries) and France (nine countries). The British and French did little to provide educationfor their colonies, which had .17 and .11 years of schooling in 1870, respectively.
Throughout the British and French colonies, the void unfilled by state-providededucation was left to missionaries, settlers, or local authorities.58 Each had limitedresources and was often less committed to educating native populations.59
Indian schools were designed to “Anglicize” the population. All instruction was inEnglish.60 In North Africa, French colonialists were met with resistance, as people oftenrefused to send their children to the handful of schools that emphasized French languageand culture and did not permit any instruction in Islam.61 Spanish colonialism—and to alesser degree Portuguese rule in Brazil— placed a greater emphasis on providing edu-cation (and other services) to the native population than did that of the British and theFrench. Premo argued that Spanish colonial rule in Peru emphasized education:“[Schools] served as social workshops in which early modern Iberian culture, religion,and political ideologies were reproduced among a colonial populace, and particularlya young colonial populace.”62 The Spanish parliament (Cortes) decreed that universalfree public education be made available to every community in Cuba with at leastone hundred residents; twenty-one years later a plan was adopted shifting all educationfrom private to public control.63
Uruguayans were the most educated Latin American population in 1870, with anaverage of 1.61 years of schooling. Yet, “…the small aboriginal population had beenalmost liquidated long before [1850] and a strong immigration from Europe was takingplace.”64 Where the indigenous population remained dominant, the Spanish colonialregime exploited indigenous labor and provided much lower levels of education.
In many independent countries outside the West (such as Turkey, China, Japan, andKorea) the state did not assume the responsibility of providing education. Only a smallshare of the population received education provided by the military, religious authori-ties, or local nobles.65 Hungary and Bulgaria, with the highest level of education amongthe independent nations, had state-supported secular education by the middle of thenineteenth century.66
The share of Europeans in a country’s population matters for education because:(1) Europeans took the lead in the provision of widespread schooling; and (2) publiceducation outside Europe largely took place where colonial powers permitted—andencouraged—migration from Europe. Engerman and Sokoloff argue that colonial powersin the Americas extracted resources when they were available—either coercing nativesto mine gold and silver or forcing slaves to work the large farms producing sugar andcotton.67 Immigration was sharply restricted in these colonies. Where there were sparsenative populations, the colonial powers encouraged immigration from Europe, as inthe United States, Canada, Australia, New Zealand, Argentina, Uruguay, and, to a lesserextent, Chile. Diseases contracted from contact with European settlers and climatesbetter suited to small-scale farming both led to lower shares of indigenous populations.68
236

Eric M. Uslaner and Bo Rothstein
Easterly and Levine show that the European share of the population at colonizationexplains more than half of the variance of contemporary per capita income across112 countries; the effect, they posit, reflects historical levels of education.69 Outsidethe New World, there were few European immigrants (and little public education).
The Roots of Education Levels
To account for the development of education across nations, we consider the effects ofequality, democratization, colonial history, Protestant population, and European back-ground. We use Vanhanen’s estimates of the percent of family farms in a country in1868, the share of all farms that are owned and operated by small farmers (with no morethan four employees),70 as our indicator of equality. Boix argues: “The percentageof family farms captures the degree of concentration and therefore inequality in theownership of land.”71 Easterly holds that “…the family farm measure from earlier datessince 1858 is a good predictor of inequality today.”72
We report the regressions for all countries, independent nations, and (former)colonies in Tables A1, A2, and A3 in the appendix. These estimations are based uponvery small samples (thirty-five overall; twenty-one independent countries and fourteencolonies), largely because family farm percentage is only available for these thirty-fivecases. We, therefore, urge caution in interpreting them. Nevertheless, the story they tellconfirms our expectations.
There are two critical differences between current or former colonies and indepen-dent states. First, the Protestant share of the population led to higher levels of educationonly for independent states. Second, the European population share is the most impor-tant factor shaping education levels in 1870 in colonies but is insignificant in indepen-dent states. The bivariate correlations for larger sample sizes confirm these estimates.The Protestant share is strongly related to 1870 education levels for independent states(r5 .733, N5 27), but not for colonies (r5 .182, N5 51). Education and the Europeanshare are strongly linked in present and former colonies (N 5 49, r 5 .857).
Higher levels of democracy do not matter in either colonies or independent states.Land inequality is significant in both, but more in independent states, largely becausethere was less variance in both land inequality and mean school years for colonies.
Countries with a larger share of European stock also were more equal (r2 5 .235).Our story of state capacity in Northern Europe above fits the story of equality as well.While Prussia had relatively low levels of land and income inequality (see above),Britain had a highly unequal distribution of land: only 5 percent of farms were ownedby individual families in 1868, a level comparable to most Latin American countriesand far lower than their former colonies in North America, where 60 percent of farmsin the United States and 63 percent in Canada were family owned (ranking only belowNorway). Inequality was lower when the Protestant share of populations was greater(r2 5 .410). The factors shaping the provision of education—and ultimately lowcorruption—were part of a larger syndrome.
237

Comparative Politics January 2016
Finally, we estimate an instrumental variable model for contemporary corrup-tion with mean levels of education in 1870 endogenous (see Table 2). The instru-ments for mean education levels are the Protestant share of the population, theEuropean share, and colonial status. All are significant at p < .01.73 The modelincludes the instrument for mean school years, mean school year change, grossnational product per capita adjusted for purchasing power parity (for 2000 fromthe Penn World Tables), the Polity IV democracy index, Solt’s net Gini index, andFreedom House’s Press Freedom index for 2002 from Daniel Treisman’s Decentraliza-tion data set.74
In the regression for sixty-seven countries, wealth, inequality, and democracy arenot significant. What matters most are historical levels of education and, to a lesserextent, change in education levels.
The estimated effect of the mean school year instrument on corruption perceptionsin 2010 is 13.7, which is greater than the full range of the CPI. For the mean schoolyear measure without instrumentation, the estimated effect is 4.6, which amounts to thedifference between Denmark (the least corrupt country) and Hungary. For mean schoolyear change, the effect is half as great (2.3). For press freedom it is 2.88, it is thedifference between Denmark and France. But press freedom may not be a simpleinstitutional solution to corruption. Färdigh shows that press freedom reduces cor-ruption only in “…well-established electoral democracies.”75 So the belief that onecan engineer lower corruption may be misplaced. Freedom of the press is stronglyrelated to historical levels of education (r 5 -.648 and -.807 with the instrument). Pressfreedom can help combat corruption, but the power of the press depends upon aliterate public.
Our results extend Glaeser et al.,76 but differ from those of Acemoglu and Robinson,who argue that English colonial rule led to better contemporary outcomes than didSpanish colonization.77 Spanish rule was more based on “looting, and gold and silverlust” while English colonies were less extractive.78 We find that this dichotomy is toosimplistic. Nor does the Protestant-Catholic religious distinction matter in the colonies.Spanish and English colonies with large European populations had high levels of
Table 2 Instrumental Variable Regression of Corruption Perceptions 2010
Variable Coefficient Standard Error t RatioMean School Years 1870 .760*** .144 5.26Mean School Year Change 1870–2010 .211*** .063 3.35Press Freedom −.040*** .012 −3.34GNP per capita PPP (x 10000) .066 .042 1.58Democracy Polity IV −.091 .075 −1.22Net Gini 2004 Solt −.026 .020 −1.31Constant 5.225*** 1.212 4.31
R2 5 .813 R.M.S.E. 5 1.02 N 5 67.*** p < .0001.
238
Eric M. Uslaner and Bo Rothstein
education, while territories with few colonials (including English dependencies inAfrica and Asia) lagged behind. Nor is there evidence that democracy led either togreater education in the 1870s or to less corruption today.
Is Path Dependence Forever?
Our answer is: “not necessarily”; the past is not set in stone. Three states with middle-to-low levels of education in 1870 showed the largest increases over time: Finland(10.6 year increase), South Korea (11.8), and Japan (12.2). Contemporary Finlandranks among the four very least corrupt countries at 9.2. Japan is tied for seventeenthand South Korea is tied for thirty-ninth place. These are all much higher transparencyscores than we would have expected based upon their 1870 levels of education.
These three “deviant” cases increased mass education in a way that fits our theoryabout state capacity and equality. The movement for universal education in Korea firstcame as a reaction against the Japanese occupation that ended in 1945. The Japaneserule limited access to education in Korea, but reform attempts were put aside whenChina intervened on behalf of North Korea and started the Korean War in 1949. Whenthe war ended in 1954, education spending soared as the political elite saw education asthe key to economic development. Free compulsory primary education was adopted in1954 and was achieved by 1959.
An expanded public education system, including free textbooks, was implementedby 1971. In 1968, the state replaced the comprehensive examination system for middleschool admission with a more egalitarian lottery. By 1980, 96 percent of students inprimary schools went on to middle schools and 85 percent of middle-school graduateswent to high school.79 The trigger events for mass educational policies were the needfor state building coming from the threats from the conflict with North Korea.80
Japan’s rise in education levels was more directly a response to external events.After Japan lost World War II, the United States Occupation Government drew up anew constitution to create a liberal democracy. For the United States Education Missionto Japan, twenty-seven prominent scholars had the task of “develop[ing] a new educa-tion appropriate to a liberal democratic state”.81 The Occupation Government dictatedthat Japanese schools eliminate militarist and nationalist materials. Schools emphasizedequal opportunity for all students and adopted a learning style in which children ofdifferent abilities and personalities worked together in small groups to promote equality.In the 1960s and 1970s, a public movement of “high schooling for everyone who desiresit” lay behind a strong increase in mean school years. The public was involved, butthe initial push toward more equality in schooling came from an external source,the United States.82
The Finnish history is a combination of external threat, internal strife, and anambition, after independence from Russia in 1917, to orient the country towards West-ern Europe and especially towards the other Nordic countries. Finland had been anintegrated part of Sweden for 600 years until 1809 when Sweden’s defeat against Russia
239

Comparative Politics January 2016
meant that Finland came under Russian rule. However, Finland never became an inte-grated part of the Russian empire but managed to keep some autonomy and the right tofollow its own (that is, the Swedish) laws as a Grand Duchy.83 Swedish was then the“official” language, mostly spoken by the ruling elite. From the 1860s onwards, a strongFinnish nationalist movement appeared, very much centered on the language issue. In1892 the Finnish language, spoken by peasants and workers, achieved equal legal statuswith Swedish. Since Swedish and Finnish are completely different languages, the lan-guage issue delayed the introduction of broad-based schooling.84
After declaring independence from Russia in 1917, class-based political conflictsescalated into a gruesome civil war in 1918.85 The lack of full nationhood until 1917,the difficult language question, and the civil war all served to delay the introductionof mass education in Finland compared to the other Western European and especiallyNordic countries. The rapid increase of education during the 1920s and 1930s can beexplained by a combination of the threat felt from the Soviet Union and a strong will-ingness to orient the country to Western Europe and the Scandinavian countries.
Thus, our three “deviant” cases follow the pattern of our theoretical model stressingthe expansion of mass education as a result of increased ambitions for state buildingfollowing a perceived threat to the nation.86 This is consistent with Uslaner’s accountof curbing corruption in Hong Kong, Singapore, and Botswana—Hong Kong andSingapore faced perils from China and Botswana from South Africa—and with theaccount of how Napoleon’s conquest of Prussia led Ferdinand II to promote education.87
Conclusion
The historical records show that the need for state building and increased state capacityare key factors in the widespread provision of public education. State capacity dependsupon citizens who are more educated and more loyal to the state. Before free universaleducation was established, for most citizens the state was an organization that was dan-gerous and should be distrusted and avoided. It took people’s money and sons to fightwars, it catered mainly to the interests of small elite, and it usually did not provide muchprotection or other forms of public goods to ordinary people.
Establishing free universal education was often the first public policy provided inan impartial and equal manner.88 Free broad based education served as a signal, sendinga message that the state was not only, or primarily, a “private good” for elite domina-tion, but also catered to the principles of “universalism” and “open access.”
We show that state capacity is necessary but not sufficient to lead to the provisionof public goods for a large share of the citizenry. Many strong states fare poorly inproviding public goods. Strong states will provide collective goods when there isstrong demand from citizens, and this will not happen when ordinary people havefew resources. High levels of inequality mean that states are little more than a meansof extracting taxes to support the ruling elite. A strong state must attract the loyalty ofcitizens who perceive that they have reasons to be loyal.
240
Eric M. Uslaner and Bo Rothstein
Religion is also important, but in a very specific way. When religious institutionsworked with the state in the nineteenth century, as most European Protestant churchesdid, education flourished. When they themselves were the primary organization forproviding education, they could not muster the necessary resources—or in some casesthe interest—in providing universal education.
Policies for increased state capacity, and not democratization, initiated regimes tolaunch reforms for mass education. Prussia was the first country to launch free universaleducation, almost a century before the United Kingdom. While Prussia is often char-acterized as autocratic, semi-feudal, and militaristic, newer results point to both highlevels of family farms in the late nineteenth century and comparatively low Gini indicesof economic inequality.89
Finally, our analysis shows that state capacity is not in itself a sufficient explanationfor the development of widespread education. States that expended substantial resourcesto educate their citizens had the economic capacity to do so. Yet more equal distribu-tions of income mattered more than wealth. The high levels of inequality in the coun-tries that were colonies in the late nineteenth century persisted over long periods of time,into the present. Even as these countries have democratized, they have not caught upto the more liberal countries in terms of levels of education, and they remain mired inhigh levels of corruption.
NOTES
This is our second co-authored paper, and in this paper we have reversed the order of authorship. Ourcontributions are equal. We would like to thank Sofia Jansson for excellent assistance on the section onreligion and education in this article and David Sartorius for very helpful comments on early education inLatin America. We also thank Christian Bjørnskov, Michelle D’Arcy, Ase Berit Grodeland, Robert Klitgaard,Alex Lascaux, Fabrice Murtin, Katarina Ott, and Aleksandar Stulhofer for helpful comments.
1. John Joseph Wallis, “The Concept of Systemic Corruption in American History,” in Edward L. Glaeserand Claudia Goldin, eds., Corruption and Reform: Lessons from America’s Economic History (Chicago:University of Chicago Press, 2006), 7.
2. Alina Mungiu-Pippidi, “Corruption: Diagnosis and Treatment,” Journal of Democracy, 17 (July 2006),86–99.
3. Bo Rothstein, The Quality of Government: Corruption, Social Trust and Inequality in a ComparativePerspective (Chicago: The University of Chicago Press, 2011).
4. Bo Rothstein and Jan Teorell, “Defining and Measuring Quality of Government,” in Sören Holmbergand Bo Rothstein, eds., Good Government: The Relevance of Political Science (Cheltenham: Edward Elgar,2012), 6–26.
5. Daron Acemoglu and James A. Robinson, Why Nations Fail: The Origins of Power, Prosperity andPoverty (London: Profile, 2012). Diego Comin, William Easterly, and Erick Gong. “Was the Wealth ofNations Determined in 1000 BC?” American Economic Journal-Macroeconomics, 2 (July 2010), 65–97.Stanley L. Engerman and Kenneth L. Sokoloff, “Factor Endowments, Inequality, and Paths ofDevelopment Among New World Economies,” NBER Working Paper 9259 (2002), available at http://www.nber.org/papers/w9259. Paola Guiliano and Nathan Nunn, “The Transmission of Democracy: From the Villageto the Nation-State,” American Economic Review, 103 (May 2013), 86–92. Christian Welzel, Freedom Rising:Human Empowerment and the Quest for Emancipation (Cambridge: Cambridge University Press, 2013).
6. Edward Glaeser, Rafael La Porta, Florencio Lopez-De-Silanes, and Andrei Shleifer, “Do InstitutionsCause Growth?” Journal of Economic Growth, 9 (September 2004), 271–303.
241

Comparative Politics January 2016
7. Claudia Goldin and Lawrence F. Katz, “Human Capital and Social Capital: The Rise of SecondarySchooling in America, 1910–1940,” Journal of Interdisciplinary History, 29 (Spring, 1999), 683–723.Rothstein, 2011, 111–15. Eric M. Uslaner, Corruption, Inequality, and the Rule of Law (New York:Cambridge University Press, 2008), 236–41.
8. Keith Darden, Resisting Occupation: Mass Literacy and the Creation of Durable National Loyalties(New York: Cambridge University Press, 2013). Eric M. Uslaner, The Moral Foundations of Trust (New York:Cambridge University Press, 2002), 208.
9. Uslaner, 2008. Edward L. Glaeser, Jose Scheinkman, and Andrei Shleifer, “The Injustice of Inequality,”Journal of Monetary Economics, 50 (January, 2003) 199–222.
10. Independent in contrast to (former) colonies include Western Europe, North America, Australia,New Zealand, Japan, and South Korea.
11. cf. William Easterly and Ross Levine, “The European Origins of Economic Development,” 2012,available at http://www.econ.brown.edu/fac/Ross_Levine/other%20files/European_Origins.pdf.
12. Bo Rothstein and Eric M. Uslaner, “All for All: Equality, Corruption, and Social Trust,” World Politics,58 (October 2005), 41–72.
13. Carl Dahlström, Johannes Lindvall, and Bo Rothstein, “Corruption, Bureaucratic Failure and SocialPolicy Priorities,” Political Studies, 61 (October 2013), 523–42. Staffan Kumlin and Bo Rothstein, “Ques-tioning the New Liberal Dilemma: Immigrants, Social Networks, and Institutional Fairness,” ComparativePolitics, 41 (October 2010), 63–87. Rothstein and Uslaner, 2005, 41–72.
14. cf. Glaeser et al., 2004, 271–303.15. Darden, 2013; Uslaner, 2002.16. Eugen Weber, Peasants into Frenchmen: The Modernization of Rural France 1870–1914 (Stanford:
Stanford University Press, 1976). John Boli, New Citizens for a New Society: The Institutional Origins ofMass Schooling in Sweden (Oxford: Pergamon, 1989). Andy Green, Education and State Formation: TheRise of Education Systems in England, France and the USA (New York: St. Martin’s Press, 1990).
17. Claudia Goldin and Lawrence F. Katz, The Race between Education and Technology (Cambridge:Belknap Press, 2008), 135–36.
18. Juan Botero, Alejandro Ponce, and Andrei Shleifer, “Education and the Quality of Government,” NBERWorking Paper (2012), available at www/nber.org/papers/w18119.
19. Indranil Dutta and Ajit Mishra, “Does Inequality Foster Corruption?” Journal of Public EconomicTheory, 15 (August 2013), 602–19. Glaeser et al., 2004. Jong-sung You, “Inequality and Corruption: TheRole of Land Reform in Korea, Taiwan, and the Philippines,” Paper presented at the Annual Conference ofthe Association for Asian Studies, Atlanta, April, 2008, available at http://irps.ucsd.edu/assets/001/503066.pdf.
20. Goldin and Katz, 2008, 29, 133.21. Christian Morrison and Fabrice Murtin, “Journal of Human Capital (June, 2009), 1–42, available at
www.fabricemurtin.com.22. Goldin and Katz, 2008, 21, 133. Aaron Benavot and Phyllis Riddle, “The Expansion of Primary
Education, 1870–1940: Trends and Issues,” Sociology of Education, 61 (July 1988), 191–210.23. Lena Wängnerud, “Why Women Are Less Corrupt than Men,” in Sören Holmberg and Bo Rothstein,
eds., Good Government: The Relevance of Political Science (Cheltenham: Edward Elgar, 2012), 212–32.Marcia Grimes and Lena Wängnerud, “Curbing Corruption Through Social Welfare Reform? The Effectsof Mexico’s Conditional Cash Transfer Program on Good Government,” American Review of Public Admin-istration, 40 (November 2010), 671–90.
24. Alícia Adserà, Carles Boix, and Mark Payne, “Are You Being Served? Political Accountability andQuality of Government,” The Journal of Law, Economics, Organization, 19 (October 2003), 445–90.Aymo Brunetti and Beatrice Weder, “A Free Press is Bad for Corruption,” Journal of Public Economics, 87(August 2003), 1801–29.
25. Mungiu-Pippidi, 2006; Douglass North, John Joseph Wallis, and Barry R. Weingast, eds., Violence andSocial Orders: A Conceptual Framework for Interpreting Recorded History (New York: Cambridge UniversityPress, 2009).
26. Robert D. Woodberry, “The Missionary Roots of Liberal Democracy,” American Political ScienceReview, 106 (May 2012), 244–74.
27. Ewout Frankema, “The Colonial Roots of Land Inequality: Geography, Factor Endowments, orInstitutions?” Economic History Review, 63 (May 2010), 418–351.
28. Acemoglu and Robinson, 2012.29. Other measures would not change the results. Different expert-based measures of “good gover-
nance” correlate at a 0.9 level (Sören Holmberg, Bo Rothstein, and Naghmeh Nasiritousi, “Quality of
242

Eric M. Uslaner and Bo Rothstein
Government: What You Get,” Annual Review of Political Science, 13 (June 2009), 135–62). The expert-based measures correlate with measures from surveys of citizens at an almost equally high level (InsaBechert and Markus Quandt, “ISSP Data Report: Attitudes towards the Role of Government,” WorkingPaper 2009:2 (Bonn: GESIS. Liebniz-Institute für Sozialwissenschaften, 2009). Stefan Svallfors, “Gov-ernment Quality, Egalitarianism, and Attitudes to Taxes and Social Spending: a European Comparison,”European Political Science Review (online preview), 5 (November 2013), 363–80.
30. The Morrison-Murtin data set is available at http://www.fabricemurtin.com/ and the Bourginon-Morrison economic data are available at http://www.delta.ens.fr/XIX/#1870. Since many of the countries inthe Transparency International data were not in existence in 1870, we matched the regional/colonial codes inthese data sets to contemporary nations. This increased the sample size of the Morrison-Murtin data set from74 to 78 (see the Appendix for a list of countries and their levels of education in 1870). Glaeser et al., 2004,use Lindert’s measure of education for 1900; it covers fewer countries. The correlation between the two datasets is very high (.86 and .96 for the 1870 and 1900 Morrison-Murtin data, N 5 30). Other data sets we usedare Vanhanen, 1997, for percent family farms and democratization (available at http://www.fsd.uta.fi/english/data/catalogue/FSD1216/) and You and Khagram, 2005, for 1980 percent Protestant, provided by Jong-sunYou. We also estimated models with both Vanhanen’s measure of democratization and with the Polity IVhistorical measure of democracy (Marshall and Jaggers, 2010, available at http://www.systemicpeace.org/polity/polity4.htm). The results were similar using Vanhanen’s measure. Tatu Vanhanen, Prospects ofDemocracy: A Study of 172 Countries (London: Routledge, 1997). Jong-Sung You and S. Khagram, “AComparative Study of Inequality and Corruption,” American Sociological Review, 70 (February 2005),136–57. Monty G. Marshall, Polity IV Project: Political Regime Characteristics and Transitions, 1800–2013(Vienna VA: Center for Systemic Peace, 2010).
31. Uslaner, 2008, 74–79.32. cf. Frankema, 2010, 418–351. Kenneth L. Sokoloff and Stanley L. Engerman, “Institutions, Factor
Endowments, and Paths of Development in the New World,” Journal of Economic Perspectives, 14 (Summer2000), 217–32.
33. Comin et al., 2010.34. Details available upon request.35. Green, 31f.36. Ibid, 1990.37. Ibid, 1990; Boli, 1989; Weber, 1976.38. Green, 79.39. Green, 79.40. Boli, 34, 232.41. Francisco O. Ramirez and John Boli, “The Political Construction of Mass Schooling: European Origins
and Worldwide Institutionalization,” Sociology of Education, 60 (January 1987), 2–17.42. Ramirez and Boli, 4.43. Ramirez and Boli, 4.44. Ramirez and Boli, 5.45. ibid; cf. Green 1990.46. Boli, 218; Weber, 1976.47. Denis Mack Smith, Modern Italy: A Political History (New Haven: Yale University Press, 1997).48. Robert Putnam, Making Democracy Work: Civic Traditions in Modern Italy (Princeton: Princeton
University Press, 1993).49. Nicholas Charron, Victor Lapuente, and Bo Rothstein, Quality of Government and Corruption from
a European Perspective (Cheltenham: Edward Elgar, 2013).50. Smith, 1997.51. Woodberry, 2011.52. Gill, 1998.53. Weber, 1976, ch. 18. Herbert Tingsten, Gud och fosterlandet: studier i hundra års skolpropaganda
(Stockholm: Norstedt, 1969).54. Boli, 209–12; Weber, 362–64; and Green, 1990.55. Green, 29.56. Sascha O. Becker and Ludger Woessmann, “Was Weber Wrong? A Human Capital Theory of Protestant
Economic History,” Quarterly Journal of Economics, 124 (May 2009), 531–96.57. Fifty-one of fifty-seven countries were colonies or former colonies. The exceptions are Bulgaria, China,
Iran, Hungary, (South) Korea, Thailand, Russia, and Turkey.
243

Comparative Politics January 2016
58. Caroline Bledsoe, “The Cultural Transformation of Western Education in Sierra Leone,” Africa: Journalof the International African Institute, 62 (April 1992), 182–202. Alf Andrew Heggoy, “Education in FrenchAlgeria: An Essay on Cultural Conflict,” Comparative Education Review, 17 (June 1973), 180–97. BronislawMalinowski, “The Pan-African Problem of Culture Contact,” American Journal of Sociology, 48 (May 1943),649–65. M. A. Mpka, “Overview of Educational Development: Pre-colonial to Present Day,” n.d., availableat http://onlinenigeria.com/education/?blurb5534.
59. Angus Maddison, “The Economic and Social Impact of Colonial Rule in India,” in Angus Maddison,eds., Class Structure and Economic Growth: India Pakistan since the Moghuls, 1971, available at http://www.ggdc.net/maddison/articles/moghul_3.pdf. Mpka, n.d.
60. Rama Sundari Mantena, “Imperial Ideology and the Uses of Rome in Discourses on Britain’s IndianEmpire,” in Mark Bradley, ed., Classics and Imperialism in the British Empire (Oxford: Oxford UniversityPress, 2010), available at http://ramamantena.files.wordpress.com/2011/03/rama-mantena-contribution-to-classics-and-imperialism-volume1.pdf. Maddison, 1971.
61. Thomas Willing Balch, “French Colonization in North Africa,” American Political Science Review,3 (November, 1909), 539–5511. Heggoy, 1973.
62. Bianca Premo, Children of the Father King: Youth, Authority, and Legal Minority in Colonial Lima(Chapel Hill: University of North Carolina Press, 2005).
63. Edward D. Fitchen, “Primary Education in Colonial Cuba: Spanish Tool for Retaining ‘La Isla Siempre’Leal?” Caribbean Studies, 14 (April 1974), 105–20.
64. Rodgrigo Arocena and Judith Sutz, “Uruguay: Higher Education, National System of Innovation andEconomic Development in a Small Peripheral Country,” Lund University Research Policy Institute, 2008,available at www.fpi.lu.se/_media/en/research/UniDev_DP_Uruguay.pdf.
65. Don Adams, “Problems of Reconstruction in Korean Education,” Comparative Education Review,3 (February 1960), 27–32. R. P. Dor, “Education: Japan,” in Robert E. Ward and Dankwart A. Rustow,eds., Political Modernization in Japan and Turkey (Princeton: Princeton University Press, 1964). FrederickW. Frey, “Education: Turkey,” in Ward and Rustow, eds. Sevinc Sevda Kilicap, Exploring Politics of Philan-thropy, unpublished thesis, Master of International Studies in Philanthropy (University of Bologna, 2009).
66. Ministry of Education and Culture (Hungary), Education in Hungary: Past, Present, and Future, AnOverview, 2008, available at http://www.nefmi.gov.hu/letolt/english/education_in_hungary_080805.pdf.Bulgarian Properties, “History of Bulgarian Education,” 2008, available at http://bulgarianproperties.info/history-of-bulgarian-education/.
67. Stanley L. Engerman and Kenneth L. Sokoloff, “Factor Endowments, Inequality, and Paths ofDevelopment Among New World Economies,” NBERWorking Paper, 9259 (2002), available at http://www.nber.org/papers/w9259.
68. Easterly and Levine, 2012.69. Ibid.70. Vanhanen’s, 1997, 48.71. Carles Boix, “Civil Wars and Guerrilla Warfare in the Contemporary World: Toward a Joint Theory of
Motivations and Opportunities,” in Stathis Kalyvas, Ian Shapiro, and Tarek Masoud, eds, Order, Conflict andViolence (New York: Cambridge University Press, 2008).
72. William Easterly, “Inequality Does Cause Underdevelopment: Insights from a New Instrument,” unpub-lished paper (New York University, 2006), available at www.international.ucla.edu/cms/files/PERG.easterly.pdf. cf. Dietrich Rueschemeyer, Evelyne Huber Stephens, and John D. Stephens, Capitalist Developmentand Democracy (Chicago: University of Chicago Press, 1992) and Oded Galor, Omer Moav, and DietrichVollrath, “Inequality in Landownership, the Emergence of Human-Capital Promoting Institutions, and theGreat Divergence,” Review of Economic Studies, 76 (June 2006), 143–79.
73. The weak and underidentification tests can be rejected at conventional levels.74. This dataset is available at http://www.sscnet.ucla.edu/polisci/faculty/treisman/Pages/unpublishedpapers.
html. The highest scores are for the countries that have the most regulation is on the media, as well asthe greatest number of political and economic pressures on the media, (http://www.freedomhouse.org/report-types/freedom-press#.U81AbvldXh4).
75. Mathias A. Färdigh, What’s the use of a free media? The role of media in curbing corruption andpromoting quality of government. (Gothenburg: Department of Journalism Media and Communication Uni-versity of Gothenburg, 2013), 19.
76. Glaeser et al., 2004.77. Acemoglu and Robinson, 2012, 18–19, 27.78. Acemoglu and Robinson, 2012, 19.
244

Eric M. Uslaner and Bo Rothstein
79. Chon Sum Ihm, “South Korea,” in Paul Morris and Anthony Sweeting, eds., Education andDevelopment in East Asia (New York: Garland, 1995). Gwang-Jo Kim, “Education Policies and Reform inSouth Korea,” in Africa Region, The World Bank, Secondary Education in Africa: Strategies for Renewal,2002, available at http://siteresources.worldbank.org/INTAFRREGTOPEDUCATION/Resources/444659-1220976732806/Secondary_Education_Strategies_renewal.pdf. Sunwoong Kim and Ju-Ho Lee, “TheSecondary School Equalization Policy in South Korea,” unpublished paper (University of Wisconsin-Milwaukee, 2003).
80. Jong-sung You, “1nequality and Corruption: The Role of Land Reform in Korea, Taiwan, and thePhilippines,” unpublished paper, University of California–San Diego, n.d, available at http://irps.ucsd.edu/assets/001/503066.pdf Jong-sung You, A Comparative Study of Income Inequality, Corruption, and SocialTrust: How Inequality and Corruption Reinforce Each Other and Erode Social Trust, Ph.D. Dissertation(draft) (Department of Government, Harvard University, 2005).
81. William K. Cummings, Education and Equality in Japan (Princeton: Princeton University Press, 1980).82. Kaori Okano and Motonori Tsuchiya, Education in Contemporary Japan: Inequality and Diversity
(Cambridge: Cambridge University Press, 1999).83. David G. Kirby, A Concise History of Finland (New York: Cambridge University Press, 2006). Henrik
Meinander and Tom Geddes, A History of Finland (London: Hurst, 2011). Ministry of Education and Culture(Hungary), Education in Hungary: Past, Present, and Future. An Overview, 2008, available at http://www.nefmi.gov.hu/letolt/english/education_in_hungary_080805.pdf.
84. Ibid, 89.85. Heikki Ylikangas, Vägen till Tammerfors. striden mellan röda och vita i finska inbördeskriget 1918
(Stockholm: Atlantis, 1995). Meinander, 2011.86. cf. Phillipe Aghion, Torsten Persson, and Dorothee Rouzet, “Education and Military Rivalry,”
unpublished paper (Harvard University, 2012), available at: http://scholar.harvard.edu/files/aghion/files/education_and_military_rivalry.pdf.
87. Uslaner, 2008, ch. 7.88. Ben Ansell and Johannes Lindvall, “The Political Origins of Primary Education Systems,” American
Political Science Review, 107 (August 2013), 505–22.89. Oliver Grant, Migration and Inequality in Germany 1870–1913 (Oxford: Clarendon Press, 2005).
245

Table A1 Mean School Years 1870 by Country
CountryMean School Years1870
Algeria 0.4Angola 0.01Argentina 1.5Australia 3.06Austria 3.2Bangladesh 0.08Belgium 4.27Benin 0.07Brazil 0.46Bulgaria 1.65Cameroon 0.02Canada 5.71Chile 0.94China 1.01Costa Rica 0.9Cote d’Ivoire 0.04Cuba 0.83Denmark 4.69Dominican Republic 0.49Egypt 0.15El Salvador 0.6Ethiopia 0.02Finland 1.45Germany 5.44France 4.12Ghana 0.04Greece 1.41Guatemala 0.51Honduras 0.64Hungary 2.58India 0.08Indonesia 0.05Iran 0.29Iraq 0.1Ireland 2.65Italy 0.84Jamaica 0.51Japan 0.97Kenya 0.21Madagascar 0.14
Continued on next page.
Appendix
Comparative Politics January 2016
246

CountryMean School Years1870
Malawi 0.4Malaysia 0.11Mali 0.04Mexico 0.56Morocco 0.05Mozambique 0.06Myanmar 0.03Netherlands 5.09New Zealand 3.91Nicaragua 0.54Niger 0.01Nigeria 0.01Norway 5.68Pakistan 0.08Panama 0.78Paraguay 0.63Peru 0.28Philippines 0.14Portugal 0.46Russia 0.9Senegal 0.06Sierra Leone 0.11South Africa 1.1South Korea 1.11Spain 1.51Sudan 0.06Sweden 4.23Switzerland 6.07Syria 0.29Thailand 0.17Tunisia 0.3Turkey 0.26UK 3.59USA 5.57Uganda 0.04Uruguay 1.61Venezuela 1.1
Zimbabwe 0.01
Table A1 Continued
Eric M. Uslaner and Bo Rothstein
247

Table A2 Regression for Mean School Years 1870
CoefficientStandardError t Ratio
Protestant % 1980 .025** .009 2.90European Share 1900 .016** .006 2.56Family farm % 1868 .039** .013 2.90Democracy Polity IV .065 .102 .63Colony (present or former) −.061 .435 −.14Constant −.540 .836 −.65R2 5 .798 R.M.S.E. 5 .960 N 5 35.** p < .01.
Table A3 Regression for Mean School Years 1870 by State Status
Independent States Colonies/Former Coloniesb S.E. b S.E.
Protestant % 1980 .023* .011 −.088 .071European Share 1900 .013 .009 .023*** .007Family farm % 1868 .044** .019 .034* .016Democracy Polity IV .118 .147 −.074 .092Constant −.934 1.186 .648 .585
Independent States: R2 5 .737 R.M.S.E. 5 1.239 N 5 21.Colonies: R2 5 .656 R.M.S.E. 5 .279 N 5 14.*** p < .0001 ** p < .01 * p < .05.
Comparative Politics January 2016
248