The hidden costs of tax compliance
21
THE HIDDEN COSTS OF TAX COMPLIANCE Jason J. Fichtner and Jacob M. Feldman MERCATUS RESEARCH Bridging the gap between academic ideas and real-world problems
description
The true cost to firms of complying with the tax code includes the obvious expense of compliance, but also the forgone growth had those funds been reinvested and the funds lost to lobbying the State on tax matters. tags: #tax, #taxation, tax compliance, #economics, #lobbying, #corporatetaxation, #RickKeo,
Transcript of The hidden costs of tax compliance
THE HIDDEN COSTS OF TAX COMPLIANCE
Jason J. Fichtner and Jacob M. Feldman
MERCATUS RESEARCH
Bridging the gap between academic ideas and real-world problems
Copyright Jason J. Fichtner, Jacob M. Feldman, and the Mercatus Center at George Mason University
Mercatus CenterGeorge Mason University3351 Fairfax Drive, 4th FloorArlington, VA 22201-4433(703) 993-4930mercatus.org
Release date: May 20, 2013
ABOUT THE MERCATUS CENTER AT GEORGE MASON UNIVERSITY
The Mercatus Center at George Mason University is the world’s premier university source for market-oriented ideas—bridging the gap between academic ideas and real-world problems.
A university-based research center, Mercatus advances knowledge about how markets work to improve people’s lives by training graduate students, conduct-ing research, and applying economics to offer solutions to society’s most pressing problems.
Our mission is to generate knowledge and understanding of the institutions that affect the freedom to prosper and to find sustainable solutions that overcome the barriers preventing individuals from living free, prosperous, and peaceful lives.
Founded in 1980, the Mercatus Center is located on George Mason University’s Arlington campus.
www.mercatus.org
ABOUT THE AUTHORS
Jason J. Fichtner is a senior research fellow at the Mercatus Center at George Mason University. He has previously served in several positions at the Social Security Administration, as senior economist with the Joint Economic Committee of the US Congress, and as senior consultant with the Office of Federal Tax Services of Arthur Andersen in Washington, DC. He has also worked on transfer pricing issues for large multinational corporations to ensure compliance with US and inter-national tax regulations. Fichtner earned his PhD in public administration and pol-icy from Virginia Tech. He serves on the adjunct faculty at the Georgetown Public Policy Institute, the Johns Hopkins School of Advanced International Studies, and the Virginia Tech Center for Public Administration and Policy, where he teaches courses in economics, public finance, public policy process, public management, and public budgeting processes.
Jacob M. Feldman is a research analyst at the Mercatus Center at George Mason University. He received his master’s in economics from George Mason University and his undergraduate degree in economics and Jewish studies from the University of Virginia. In 2012, he completed the Mercatus MA Fellowship and the Thomas Jefferson Fellowship. He previously worked for a congressional office as a budget fellow, and with Americans for Tax Reform and the Heritage Foundation on tax policy issues.
Merc atus center at GeorGe M a son univer sit y
4
aBsTRaCT
Lawmakers have long used the tax code for purposes far beyond simply collecting revenue to fund the federal government. Through the insertion of specialized tax provisions, the tax code is used to achieve policy and political aims as well. But these special provisions come at a price: economic growth is foregone, higher accounting costs are incurred, more lobbyists are hired to protect tax advantages, and revenue is lost as a result of collection inefficiencies. We estimate that hidden costs of tax compliance range from $215 billion to $987 billion annually, and that part of the $452 billion revenue gap in 2012 unreported taxes was the result of tax code com-plexity. We provide policy recommendations based on lessons from the Russia flat tax reforms and the Tax Reform Act of 1986.
JEL codes: D61, E62, H21, H26
5
I. INTRODUCTION
The tax code, far beyond simply collecting revenue to fund the operations of the federal government, attempts to perform policy and political functions as well. This paper does not examine the normative value of these provi-
sions, but instead examines the hidden costs of today’s tax code: time and money spent submitting tax forms, foregone economic growth, lobbying expenditures, and gaps in revenue collection. These problems grow larger as the Internal Revenue Code becomes more complicated and temporary.1 Based on the studies reviewed in this paper, we estimate that hidden costs range from $215 billion to $987 billion and that the tax code results in a $452 billion revenue gap in unreported taxes. The economic costs are substantial relative to the $2.45 trillion in revenues raised by the federal government in 2012.2
TABLE 1. HIDDEN COSTS AND REVENUE IMPLICATIONS
Hidden Costs Revenue Implications
Accounting Costs $67–$378 BillionTax Gap $452 Billion
Economic Costs $148–$609 Billion
Note: A number for lobbying costs is not provided under “Hidden Costs” because a specific annual cost could not be approximated.
The structure of individual and corporate income taxes in the United States—accounting for over 55 percent of total tax revenue—reflects policymakers’ agglom-erated attempts to increase fairness, conduct social policy, encourage economic growth, and promote favored industries.3 According to the National Taxpayer Advocate, between 2001 and 2010 there were 4,428 changes to the Internal Revenue Code, including an estimated 579 changes in 2010 alone.4 To put this in perspective, it means the tax code averages more than one change per day. The complexity of tax code is largely responsible for the $67 billion to $378 billion of accounting costs incurred in the process of filing taxes. A simpler tax system with fewer deductions would assist in alleviating these costs.
Revenue collected by the government through taxes prevents economic transac-tions from occurring. The economic size of these purchases and business deals that do not occur is larger than the revenues collected by the government. Net estimates
MERC ATUS CENTER AT GEORGE M A SON UNIVER SIT Y
6
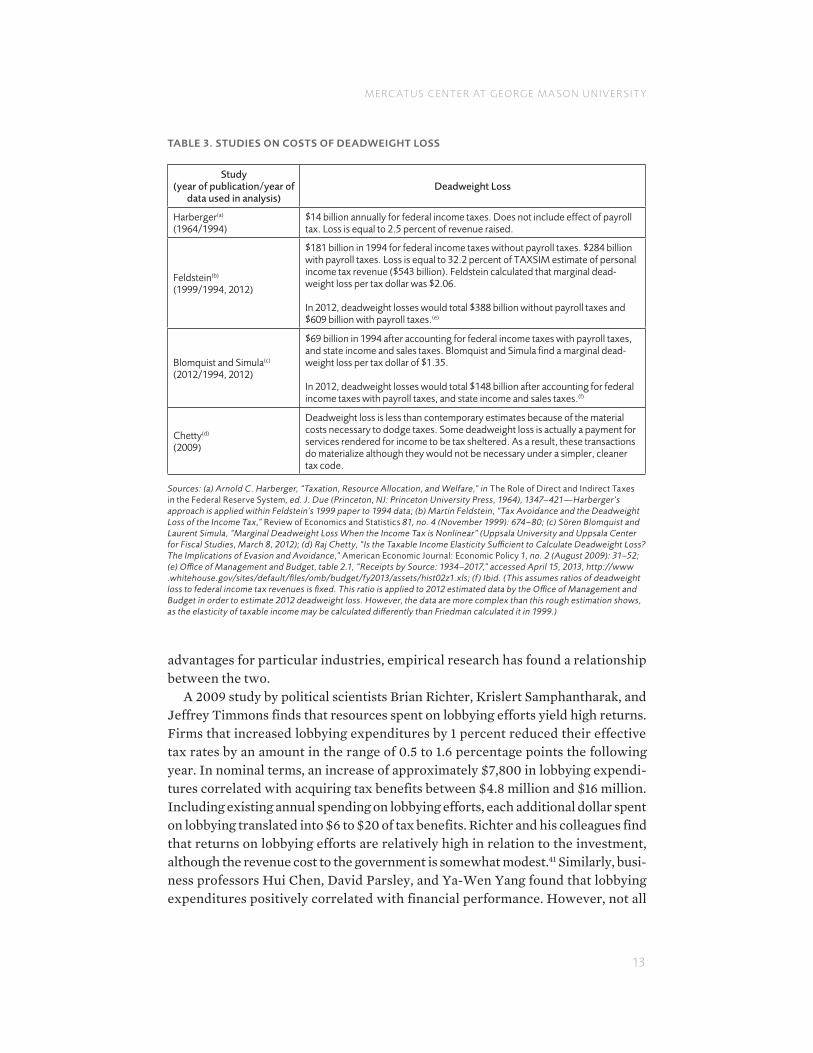
of foregone economic growth range from $148 billion to $609 billion (see table 3, page 13).
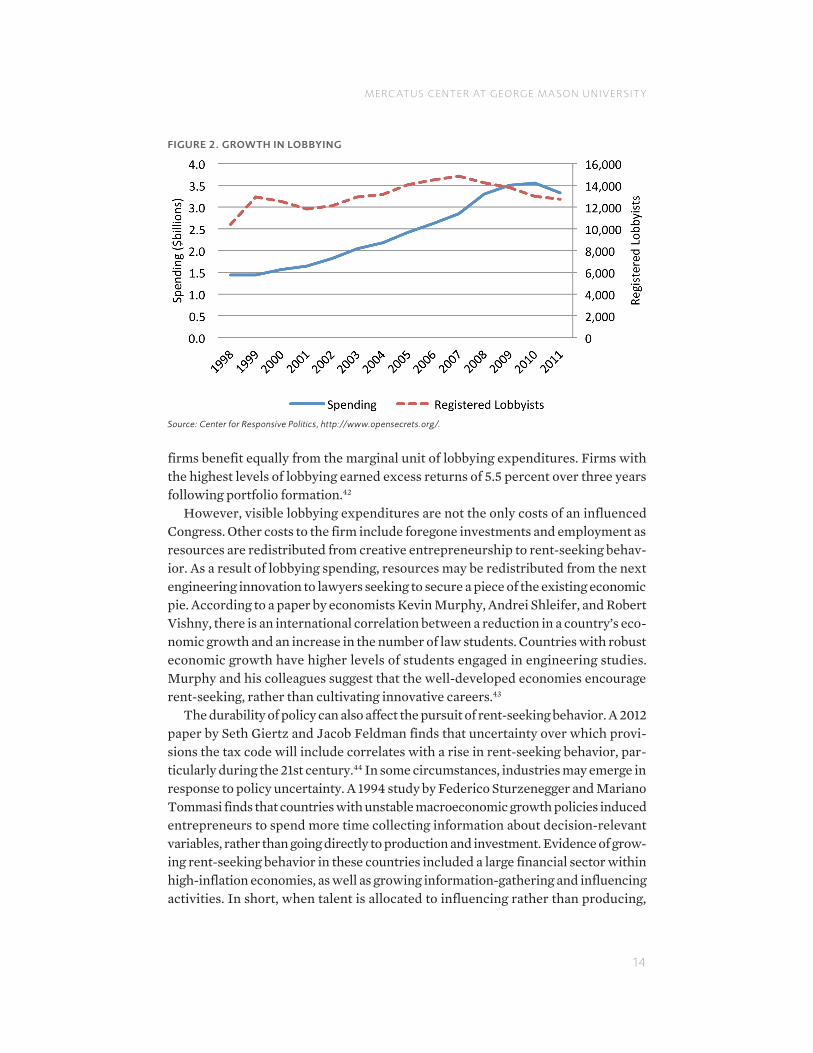
Along with accounting costs and economic costs, lobbying costs are a third cost of today’s tax code. Although we do not have an estimate of annual lobbying costs, between 2002 and 2011 lobbyists spent $27.6 billion petitioning federal, state, and local governments for policy preferences (see figure 2, page 14). More significantly for long-term economic growth, a tax code open to lobbyists incentivizes the pur-suit of rent-seeking careers, rather than innovation, to protect and expand tax advantages.5
Finally, although it is not an economic cost, the structure of the tax code affects the government’s ability to raise revenues efficiently and equitably. The United States has a tax-reporting compliance rate of 85.5 percent—leaving a revenue gap of $452 billion in unreported taxes. The government’s failure to collect revenues that are owed by law creates a social cost of inequitable tax burdens among similar taxpayers.6 Policymakers intending to collect more revenues for the federal govern-ment will need to understand the risks/benefits taxpayers assume by not report-ing taxable income. One case study from Russia suggests that shifting the tax code toward a flat tax holds promise for reducing the revenue gap.7
The extent to which many of these costs could be quantitatively reduced by reforms is beyond the scope of this paper. The purpose of the paper is to use the rele-vant scholarly literature to document the cost of the US tax system. In section VI, we provide qualitative recommendations based on successful tax reform in Russia and on the 1986 Tax Reform Act. Tax reform today must negate the incentives for both legal and illegal tax sheltering. Curtailing the hidden costs of taxation will require a simpler tax code with lower rates.
II. HOW THE TAX CODE INDUCES ACCOUNTING EXPENSES AND CREATES ECONOMIC DISTORTIONS
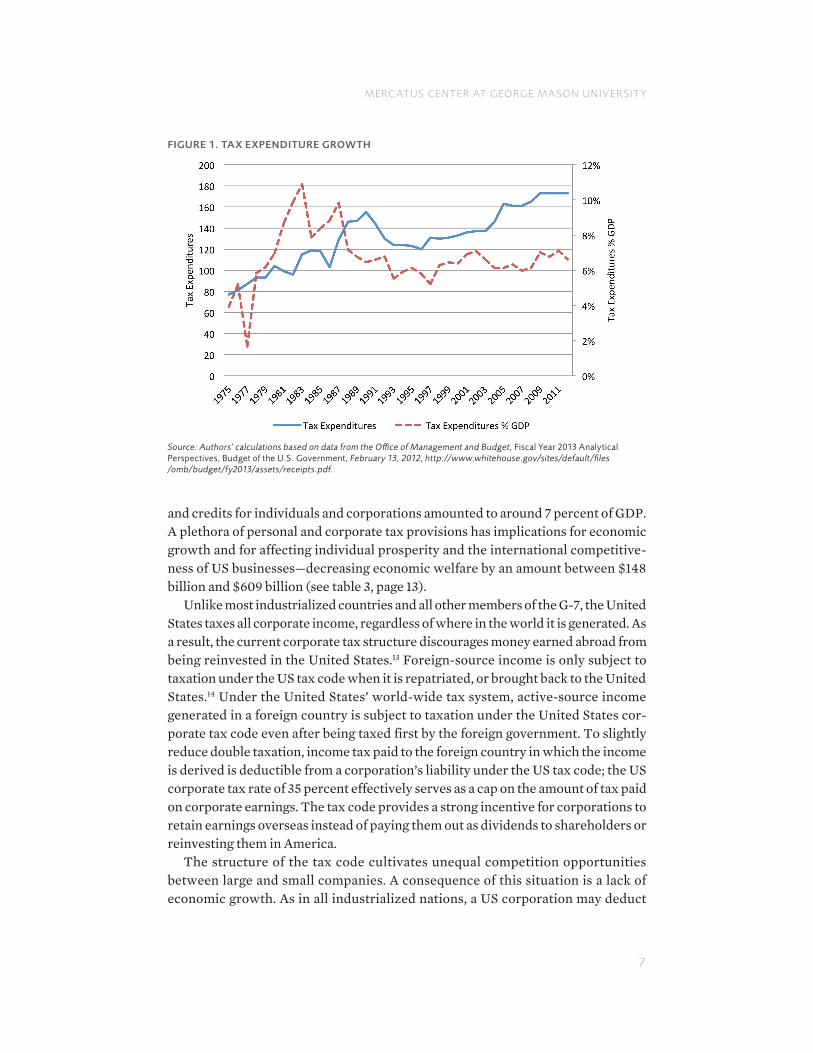
The federal government assesses personal income taxes on citizens or resi-dent aliens on the basis of their worldwide adjusted gross income.8 Individuals may reduce their taxes through relatively simple personal exemption deductions9 and the applicable standard deduction,10 or may join the 32 percent of taxpayers who choose the complicated and costly process of itemizing specific deductions.11 Filing for tax deductions increases the accounting costs of doing taxes, as well the eco-nomic costs caused by distortions in the price system. Determining tax liability for the year may then be further complicated by the necessity of complying with the Alternative Minimum Tax (AMT).12 Section III quantifies the financial and time cost of complying with the many deductions, putting it around $378 billion. Each itemized deduction targets a specific set of taxpayer characteristics or a specific policy objective. The existence of these deductions as well as their value varies from tax year to tax year. As detailed in figure 1, in 2011, the 173 different tax deductions
MERC ATUS CENTER AT GEORGE M A SON UNIVER SIT Y
7
and credits for individuals and corporations amounted to around 7 percent of GDP. A plethora of personal and corporate tax provisions has implications for economic growth and for affecting individual prosperity and the international competitive-ness of US businesses—decreasing economic welfare by an amount between $148 billion and $609 billion (see table 3, page 13).
Unlike most industrialized countries and all other members of the G-7, the United States taxes all corporate income, regardless of where in the world it is generated. As a result, the current corporate tax structure discourages money earned abroad from being reinvested in the United States.13 Foreign-source income is only subject to taxation under the US tax code when it is repatriated, or brought back to the United States.14 Under the United States’ world-wide tax system, active-source income generated in a foreign country is subject to taxation under the United States cor-porate tax code even after being taxed first by the foreign government. To slightly reduce double taxation, income tax paid to the foreign country in which the income is derived is deductible from a corporation’s liability under the US tax code; the US corporate tax rate of 35 percent effectively serves as a cap on the amount of tax paid on corporate earnings. The tax code provides a strong incentive for corporations to retain earnings overseas instead of paying them out as dividends to shareholders or reinvesting them in America.
The structure of the tax code cultivates unequal competition opportunities between large and small companies. A consequence of this situation is a lack of economic growth. As in all industrialized nations, a US corporation may deduct
FIGURE 1. TAX EXPENDITURE GROWTH
Source: Authors’ calculations based on data from the Office of Management and Budget, Fiscal Year 2013 Analytical Perspectives, Budget of the U.S. Government, February 13, 2012, http://www.whitehouse.gov/sites/default/files /omb/budget/fy2013/assets/receipts.pdf.
MERC ATUS CENTER AT GEORGE M A SON UNIVER SIT Y
8
from its income tax liability all the expenditures needed to undertake the firm’s activity, including interest payments on its debt. However, while interest payments on corporate debt are deductible, returns to equity (the earnings of shareholders) are taxed at the corporate tax rate. This feature of the US corporate tax code biases firms’ financing decisions toward using debt financing rather than equity.15 As a consequence, companies are more prone to being highly leveraged. Small firms and less-established firms, which have more limited access to debt financing, are placed at a competitive disadvantage.
In addition to differences in competitive advantage based on access to corporate debt, small companies are not as equipped to take advantage of complex deprecia-tion schedules. In other circumstances, multinational companies engage in transfer pricing activities through affiliates for tax purposes rather than for efficiency rea-sons. The documentation of sales from controlled affiliates in foreign countries to a larger US parent company may be adjusted to reduce tax liabilities. Even among large companies, certain industries are able to take advantage of tax provisions while others languish under the high US corporate tax rate.16 Larger companies may deduct a capital investment over a number of years, subject to a complex deprecia-tion schedule, while smaller companies may deduct their capital purchases at the time of investment. As a result, the after-tax cost of larger-companies’ investments increases, since a dollar of spending today is more expensive than a dollar of spend-ing in the future. On top of this complex system of deductions, depreciation, and liabilities, there are additional deductions and benefits for favored industries or those perceived to perform a socially beneficial function. For example, Robert Dietz, the assistant vice president for tax and policy issues for the National Association of Home Builders, argues that favorable tax treatment for homeownership lowers crime rates and provides varied personal benefits.17 Such a complex system of taxa-tion imposes a compliance cost on individuals and corporations in addition to the missed economic growth opportunities.
III. COMPLYING WITH COMPLEXITY
Within a tax system like that of the United States, which is primarily enforced through voluntary compliance, it remains the taxpayer’s obligation to compute and submit taxes to the IRS. This voluntary tax compliance is achieved through hours of taxpayer efforts and through hired tax consultants. The accounting costs of comply-ing with the tax code range from $67 billion to $378 billion (see table 2). About 60 percent of individual taxpayers and 71 percent of unincorporated business taxpay-ers pay someone else (i.e., an accountant, lawyer, or tax professional) to prepare their taxes.18 An additional 32 percent of individual taxpayers use tax preparation software.19 As a direct result of the large and growing complexity in the income tax code, the vast majority of Americans now incur some type of expense to determine their income tax liability and comply with filing requirements.
MERC ATUS CENTER AT GEORGE M A SON UNIVER SIT Y
9
Beyond this, some taxpayers venture to contact the IRS directly regarding their income tax liability. In 2012 the official IRS website, www.irs.gov, received over 1.7 billion page views. The IRS received 115 million calls in each of fiscal years 2011 and 2012—it was unable to answer more than 30 percent of these phone calls.20 It was only able to answer 68 percent of phone calls in 2012, compared with 87 percent in 2004.21 Furthermore, the IRS failed to respond to almost half (48 per-cent) of all taxpayer letters within the agency’s own established time frame, up drastically from the 12 percent rate in 2004.22 In September 2011, the Treasury inspector general’s semiannual report to Congress found that most taxpayers who contact the IRS do not receive quality responses to their correspondence. It cited a review of three IRS functions—the Accounts Management function, Automated Underreporter Program, and Field Assistance Office—where 19 percent, 56 percent and 8 percent, respectively, of correspondents received both timely and accurate responses to their questions.23
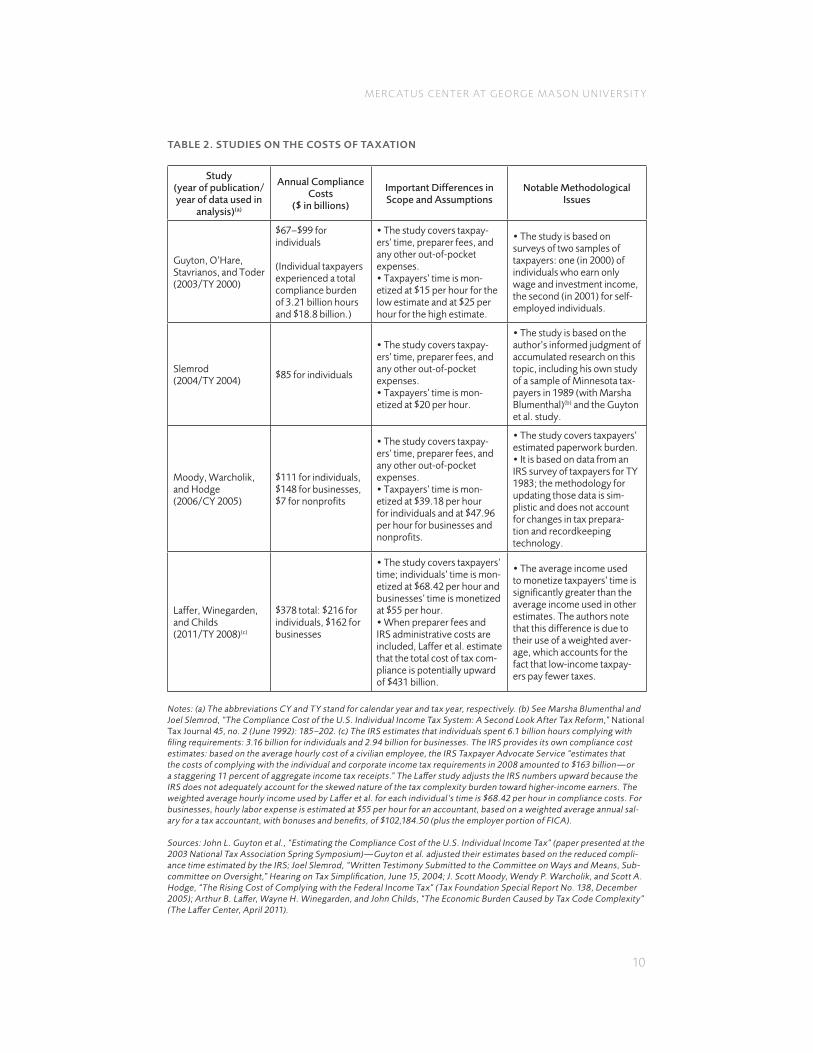
Based on taxpayers’ time costs and their estimated direct outlays for products and services used to determine tax liabilities, several economists have formulated empirical estimates of the cost of tax compliance. These estimates, though not com-prehensive, certainly suggest that the direct costs of tax compliance are substantial, particularly relative to the amount of revenue raised through tax administration.24
The staggering costs of tax compliance efforts by individuals and businesses can be illustrated by comparison. The most recent studies’ estimate of $378 billion in compliance costs exceeds the profits of the United States’ 25 largest corpora-tions.25 Similarly, 6.1 billion hours per year spent complying with tax forms repre-sents an annual workforce of over 3,400,000 people—a population that could be the third largest city in the United States, surpassing Chicago (2,707,120), Houston (2,145,146), and Philadelphia (1,536,471).26 This workforce is larger than the popula-tions of 21 of the states, and the four largest US companies combined employ only slightly more workers (Wal-Mart Stores: 2,200,000, IBM: 433,362, McDonald’s: 420,000, and Target: 365,000).27 These administrative taxation costs only reveal the more easily measured surface cost of taxes. The true cost of tax compliance far exceeds taxpayers’ documented time and financial expenses incurred during tax season. The remainder of this paper turns to three other costs of taxation: lobbying to gain and maintain tax advantages; economy-wide costs as work, leisure, savings, consumption, production, and investments are altered by tax incentives; and lost revenues as a result of taxpayer noncompliance. The end of this paper provides several recommendations to lessen the hidden costs of taxation.
IV. THE COSTS OF TAX AVOIDANCE
Tax avoidance occurs when individuals or businesses reallocate consumption and savings patterns in order to minimize tax burdens. These behavioral responses to tax avoidance result in what economists call decreased allocative efficiency—a loss
MERC ATUS CENTER AT GEORGE M A SON UNIVER SIT Y
10
TABLE 2. STUDIES ON THE COSTS OF TAXATION
Study (year of publication/year of data used in
analysis)(a)
Annual Compliance Costs
($ in billions)
Important Differences in Scope and Assumptions
Notable Methodological Issues
Guyton, O’Hare, Stavrianos, and Toder (2003/TY 2000)
$67–$99 for individuals
(Individual taxpayers experienced a total compliance burden of 3.21 billion hours and $18.8 billion.)
• The study covers taxpay-ers’ time, preparer fees, and any other out-of-pocket expenses.• Taxpayers’ time is mon-etized at $15 per hour for the low estimate and at $25 per hour for the high estimate.
• The study is based on surveys of two samples of taxpayers: one (in 2000) of individuals who earn only wage and investment income, the second (in 2001) for self-employed individuals.
Slemrod(2004/TY 2004)
$85 for individuals
• The study covers taxpay-ers’ time, preparer fees, and any other out-of-pocket expenses.• Taxpayers’ time is mon-etized at $20 per hour.
• The study is based on the author’s informed judgment of accumulated research on this topic, including his own study of a sample of Minnesota tax-payers in 1989 (with Marsha Blumenthal)(b) and the Guyton et al. study.
Moody, Warcholik, and Hodge(2006/CY 2005)
$111 for individuals, $148 for businesses, $7 for nonprofits
• The study covers taxpay-ers’ time, preparer fees, and any other out-of-pocket expenses.• Taxpayers’ time is mon-etized at $39.18 per hour for individuals and at $47.96 per hour for businesses and nonprofits.
• The study covers taxpayers’ estimated paperwork burden.• It is based on data from an IRS survey of taxpayers for TY 1983; the methodology for updating those data is sim-plistic and does not account for changes in tax prepara-tion and recordkeeping technology.
Laffer, Winegarden, and Childs(2011/TY 2008)(c)
$378 total: $216 for individuals, $162 for businesses
• The study covers taxpayers’ time; individuals’ time is mon-etized at $68.42 per hour and businesses’ time is monetized at $55 per hour.• When preparer fees and IRS administrative costs are included, Laffer et al. estimate that the total cost of tax com-pliance is potentially upward of $431 billion.
• The average income used to monetize taxpayers’ time is significantly greater than the average income used in other estimates. The authors note that this difference is due to their use of a weighted aver-age, which accounts for the fact that low-income taxpay-ers pay fewer taxes.
Notes: (a) The abbreviations CY and TY stand for calendar year and tax year, respectively. (b) See Marsha Blumenthal and Joel Slemrod, “The Compliance Cost of the U.S. Individual Income Tax System: A Second Look After Tax Reform,” National Tax Journal 45, no. 2 (June 1992): 185–202. (c) The IRS estimates that individuals spent 6.1 billion hours complying with filing requirements: 3.16 billion for individuals and 2.94 billion for businesses. The IRS provides its own compliance cost estimates: based on the average hourly cost of a civilian employee, the IRS Taxpayer Advocate Service “estimates that the costs of complying with the individual and corporate income tax requirements in 2008 amounted to $163 billion—or a staggering 11 percent of aggregate income tax receipts.” The Laffer study adjusts the IRS numbers upward because the IRS does not adequately account for the skewed nature of the tax complexity burden toward higher-income earners. The weighted average hourly income used by Laffer et al. for each individual’s time is $68.42 per hour in compliance costs. For businesses, hourly labor expense is estimated at $55 per hour for an accountant, based on a weighted average annual sal-ary for a tax accountant, with bonuses and benefits, of $102,184.50 (plus the employer portion of FICA).
Sources: John L. Guyton et al., “Estimating the Compliance Cost of the U.S. Individual Income Tax” (paper presented at the 2003 National Tax Association Spring Symposium)—Guyton et al. adjusted their estimates based on the reduced compli-ance time estimated by the IRS; Joel Slemrod, “Written Testimony Submitted to the Committee on Ways and Means, Sub-committee on Oversight,” Hearing on Tax Simplification, June 15, 2004; J. Scott Moody, Wendy P. Warcholik, and Scott A. Hodge, “The Rising Cost of Complying with the Federal Income Tax” (Tax Foundation Special Report No. 138, December 2005); Arthur B. Laffer, Wayne H. Winegarden, and John Childs, “The Economic Burden Caused by Tax Code Complexity” (The Laffer Center, April 2011).
MERC ATUS CENTER AT GEORGE M A SON UNIVER SIT Y
11
of economic transactions that would increase standards of living: the vacation not taken, the food not purchased, the smaller wedding gift acquired, and so on. In other words, consumers make smaller spending and saving decisions than they would otherwise.28 Estimates of lost economic growth as a result of taxes range from $148 billion to $609 billion (see table 3, page 13). Taxes increase the cost of doing busi-ness—buying materials, paying workers, investing, and so on. Businesses sell fewer products and services in response to resources shifting to the next best social func-tion. The extent to which the tax code distorts business decisions may be thought of in terms of whether consumption is penalized relative to saving. Additionally, different forms of saving may be penalized or rewarded relative to one another. If individuals or businesses are unsure how the tax code will affect returns on invest-ment, they may put off investing until more certainty exists.29 Investments that do not occur because they are prohibitively expensive—an implicit cost of taxation—slow economic growth.
Economists have a term for foregone investments and consumption: deadweight loss, an idea that gained prominence due to the work of Arnold Harberger in the 1960s.30 More recently, Martin Feldstein builds on Harberger’s work with his own methodology and finds that deadweight losses were higher than Harberger antici-pated because tax rates are not applied evenly among spending and savings choices.31 Examining 1994 data on income taxes, Feldstein estimates that deadweight loss to revenue is 12 times larger than Harberger’s original estimate. Feldstein estimated that 1994 deadweight losses from federal income taxes were $181 billion, or 2.55 percent of US GDP, which would equal approximately $385 billion in 2012. In 2008, Feldstein re-examined deadweight loss using an estimated compensated elasticity of 0.4, given the existing US tax code.32
With 124 special deductions and credits in the 1994 federal tax code (173 in 2011), there were a menu of effective rates for businesses and individuals to shift resources toward in order to avoid higher tax liabilities. These deductions assist firms in equalizing some business decisions about whether to save or consume. However, these deductions further add to the tax code’s complexity, which not only ties up other resources but also renders better outcomes for firms (oftentimes corporations) with professional tax compliance officers, while smaller firms miss opportunities.33 Despite the highest level of deductions and credits in US history, the incentive to save versus consume is still treated unevenly for many industries. It is clear that carving out special deductions and exemptions ties up far too many resources in the compliance process, favors larger businesses, and still does not achieve the goal of taxing savings and consumption at an equal rate.
Uppsala University economists Sören Blomquist and Laurent Simula revisited Feldstein’s analysis of deadweight loss in 2012 using a model that better resembles today’s tax code (i.e., a nonlinear model). Blomquist and Simula claim theirs is a more accurate model because the US tax system is progressive, meaning that tax rates increase with income. Utilizing the same data sets as Feldstein, Blomquist
MERC ATUS CENTER AT GEORGE M A SON UNIVER SIT Y
12
and Simula find that Feldstein’s linear model overestimated marginal deadweight loss per tax dollar by 61 percent. Under the 2006 tax code, which at the time had the same marginal income tax rates as the 2012 code, deadweight losses per tax dollar were 4.1 percent.34 In 2006 these deadweight losses totaled $98.7 billion, and if the same levels were applied to 2012 revenue, they would total $100.4 billion.35
University of Nebraska–Lincoln economist Seth Giertz estimated a range of potential deadweight losses if all the individual income tax rates increased after the expiration of the Bush tax cuts.36 His numbers reveal that deadweight loss would fall between 0.72 percent and 3.62 percent of GDP ($15.6 and $77.8 billion, respectively), depending on elasticity of taxable income response ranging between 0.2 and 1.0.37
Another response to Feldstein, suggesting that deadweight losses were lower than his estimates, came from University of California, Berkeley, economist Raj Chetty in 2009. He questions whether the efficiency cost of taxation for tax avoid-ance and tax evasion exhibited the same deadweight losses as marginal tax rates. Chetty emphasizes that tax evasion often exhibits different deadweight loss char-acteristics than tax avoidance, but both may exhibit deadweight losses 40 percent smaller than deadweight losses from marginal tax rates.38 Tax avoidance is using a legal method to reduce tax burdens, such as utilizing tax expenditures or not repa-triating foreign earnings to the United States. Tax evasion is an illegal behavior—reducing tax burden by not reporting taxable earnings. Feldstein assumes that the decision to shelter income has a marginal cost rate similar to taxes. However, econo-mists Joel Slemrod and Shlomo Yitzhaki explain that the tax system sets the relative price of avoidance or evasion through the costs and benefits of “honesty.”39 Chetty argues that many forms of tax sheltering require resource costs lower than comply-ing with the top marginal tax rates. Therefore, much of perceived deadweight loss is actually a transfer cost to shelter income.40
Although the costs of deadweight losses are difficult to estimate, policymakers can take steps to lessen the damage that does occur. A more complex tax code may slightly lower deadweight losses as long as marginal rates remain constant, because a more complex code also increases resources spent on tax preparation and on lob-bying efforts. An ideal tax code would be one where deadweight losses remain low and resources spent on tax compliance are minimized. The policy recommendations in section VI examine contemporary solutions and historical responses. The next section examines the costs of lobbying.
V. DIRECT COST OF GAINING AND PROTECTING CURRENT TAX ADVANTAGES
Lobbying costs come from the actual expenditures by firms to petition federal, state, and local governments for particular tax advantages. As shown in figure 2, during the 10 years between 2002 and 2011, lobbyists spent $27.61 billion. Although not all lobbying spending is related to obtaining and protecting tax
MERC ATUS CENTER AT GEORGE M A SON UNIVER SIT Y
13
advantages for particular industries, empirical research has found a relationship between the two.
A 2009 study by political scientists Brian Richter, Krislert Samphantharak, and Jeffrey Timmons finds that resources spent on lobbying efforts yield high returns. Firms that increased lobbying expenditures by 1 percent reduced their effective tax rates by an amount in the range of 0.5 to 1.6 percentage points the following year. In nominal terms, an increase of approximately $7,800 in lobbying expendi-tures correlated with acquiring tax benefits between $4.8 million and $16 million. Including existing annual spending on lobbying efforts, each additional dollar spent on lobbying translated into $6 to $20 of tax benefits. Richter and his colleagues find that returns on lobbying efforts are relatively high in relation to the investment, although the revenue cost to the government is somewhat modest.41 Similarly, busi-ness professors Hui Chen, David Parsley, and Ya-Wen Yang found that lobbying expenditures positively correlated with financial performance. However, not all
TABLE 3. STUDIES ON COSTS OF DEADWEIGHT LOSS
Study(year of publication/year of
data used in analysis)Deadweight Loss
Harberger(a)
(1964/1994)$14 billion annually for federal income taxes. Does not include effect of payroll tax. Loss is equal to 2.5 percent of revenue raised.
Feldstein(b)
(1999/1994, 2012)
$181 billion in 1994 for federal income taxes without payroll taxes. $284 billion with payroll taxes. Loss is equal to 32.2 percent of TAXSIM estimate of personal income tax revenue ($543 billion). Feldstein calculated that marginal dead-weight loss per tax dollar was $2.06.
In 2012, deadweight losses would total $388 billion without payroll taxes and $609 billion with payroll taxes.(e)
Blomquist and Simula(c)
(2012/1994, 2012)
$69 billion in 1994 after accounting for federal income taxes with payroll taxes, and state income and sales taxes. Blomquist and Simula find a marginal dead-weight loss per tax dollar of $1.35.
In 2012, deadweight losses would total $148 billion after accounting for federal income taxes with payroll taxes, and state income and sales taxes.(f)
Chetty(d)
(2009)
Deadweight loss is less than contemporary estimates because of the material costs necessary to dodge taxes. Some deadweight loss is actually a payment for services rendered for income to be tax sheltered. As a result, these transactions do materialize although they would not be necessary under a simpler, cleaner tax code.
Sources: (a) Arnold C. Harberger, “Taxation, Resource Allocation, and Welfare,” in The Role of Direct and Indirect Taxes in the Federal Reserve System, ed. J. Due (Princeton, NJ: Princeton University Press, 1964), 1347–421—Harberger’s approach is applied within Feldstein’s 1999 paper to 1994 data; (b) Martin Feldstein, “Tax Avoidance and the Deadweight Loss of the Income Tax,” Review of Economics and Statistics 81, no. 4 (November 1999): 674–80; (c) Sören Blomquist and Laurent Simula, “Marginal Deadweight Loss When the Income Tax is Nonlinear” (Uppsala University and Uppsala Center for Fiscal Studies, March 8, 2012); (d) Raj Chetty, “Is the Taxable Income Elasticity Sufficient to Calculate Deadweight Loss? The Implications of Evasion and Avoidance,” American Economic Journal: Economic Policy 1, no. 2 (August 2009): 31–52; (e) Office of Management and Budget, table 2.1, “Receipts by Source: 1934–2017,” accessed April 15, 2013, http://www .whitehouse.gov/sites/default/files/omb/budget/fy2013/assets/hist02z1.xls; (f) Ibid. (This assumes ratios of deadweight loss to federal income tax revenues is fixed. This ratio is applied to 2012 estimated data by the Office of Management and Budget in order to estimate 2012 deadweight loss. However, the data are more complex than this rough estimation shows, as the elasticity of taxable income may be calculated differently than Friedman calculated it in 1999.)
MERC ATUS CENTER AT GEORGE M A SON UNIVER SIT Y
14
firms benefit equally from the marginal unit of lobbying expenditures. Firms with the highest levels of lobbying earned excess returns of 5.5 percent over three years following portfolio formation.42
However, visible lobbying expenditures are not the only costs of an influenced Congress. Other costs to the firm include foregone investments and employment as resources are redistributed from creative entrepreneurship to rent-seeking behav-ior. As a result of lobbying spending, resources may be redistributed from the next engineering innovation to lawyers seeking to secure a piece of the existing economic pie. According to a paper by economists Kevin Murphy, Andrei Shleifer, and Robert Vishny, there is an international correlation between a reduction in a country’s eco-nomic growth and an increase in the number of law students. Countries with robust economic growth have higher levels of students engaged in engineering studies. Murphy and his colleagues suggest that the well-developed economies encourage rent-seeking, rather than cultivating innovative careers.43
The durability of policy can also affect the pursuit of rent-seeking behavior. A 2012 paper by Seth Giertz and Jacob Feldman finds that uncertainty over which provi-sions the tax code will include correlates with a rise in rent-seeking behavior, par-ticularly during the 21st century.44 In some circumstances, industries may emerge in response to policy uncertainty. A 1994 study by Federico Sturzenegger and Mariano Tommasi finds that countries with unstable macroeconomic growth policies induced entrepreneurs to spend more time collecting information about decision-relevant variables, rather than going directly to production and investment. Evidence of grow-ing rent-seeking behavior in these countries included a large financial sector within high-inflation economies, as well as growing information-gathering and influencing activities. In short, when talent is allocated to influencing rather than producing,
FIGURE 2. GROWTH IN LOBBYING
Source: Center for Responsive Politics, http://www.opensecrets.org/.
MERC ATUS CENTER AT GEORGE M A SON UNIVER SIT Y
15
economic growth stalls. The damage of resource misallocation can be diminished by limiting policy uncertainty. Sturzenegger and Tommasi claim that “when win-ners and losers are clearly defined, the incentive to shift resources out of productive activities is much weaker.”45
VI. VISION OF A BETTER STATE
In order to achieve a stronger economy and higher revenues, reforms need to simplify the economic and accounting burden of complying with federal taxation. The burdens of these costs often fall inequitably on smaller companies and on indi-vidual taxpayers. An overly complex and cumbersome tax code favors companies and individuals with well-paid accountants and lawyers. Both US history and inter-national reforms point legislators toward how best to achieve a more productive and equitable revenue system.
During the Reagan administration, the US federal government enacted the Tax Reform Act of 1986 (TRA86) with significant bipartisan support. This was signifi-cant because it was the first time in US history that a significant number of tax expenditures were removed in exchange for reducing tax rates on individuals. Although much of the act’s successes had unraveled by the time of the 1993 Omnibus Act under President Clinton, there were some efficiency gains that reduced dead-weight loss.46 A 2007 paper by Federal Reserve Bank economist Anil Kumar finds that TRA86 reduced deadweight losses as a percentage of taxes by 6 percent. Combined with the positive labor effects of tax reform, Kumar estimates that an average male head of household was roughly 10 percent better off after tax reform: “Before TRA 1986 an average male head would have been willing to pay about 28% of his Adjusted Gross Income to do away with the pre-TRA 1986 tax system. This figure drops to 25% after the tax reform—a drop of about 10%.”47
Recent empirical literature suggests that income tax reforms may diminish tax evasion, but reducing deadweight losses from tax avoidance may be more diffi-cult. In a 2009 paper examining the 2001 Russian tax reforms, economists Yuriy Gorodnichenko, Jorge Martinez-Vazquez, and Klara Peter find that welfare gains from adopting a flat tax reform were relatively low while tax compliance was sig-nificantly improved with an additional 10 percent of reported income relative to consumption. They estimate that the deadweight loss effects of tax evasion are 30 percent smaller than the deadweight losses of traditional income responses to tax changes. Gorodnichenko and his colleagues conclude that two-thirds of the increase in taxable income may be attributed to reduced evasion, rather than to productivity increases.48
Improving tax compliance in the United States would have important impli-cation for US revenues. According to the IRS’s most recent 2011 Taxpayer Compliance Research, there was a US compliance rate of 83.1 percent—a reve-nue gap of $450 billion, or 3.36 percent of 2006 GDP.49 After IRS enforcement,
Merc atus center at GeorGe M a son univer sit y
16
there is a net compliance rate (NCR) of 85.5 percent. The percentage means that 14.5 percent of 2006 estimated tax liabilities will never be collected after IRS’s enforcement efforts—$385 billion, or 2.88 percent of GDP. In 2012 dollars, that percentage would be $452 billion in revenues.50 In part, revenues not collected by the government may be used for economic growth that offsets economic losses caused by the tax code. However, some revenues shifted overseas are not reported to the IRS. Studies estimate that the revenue cost from individual and corporate overseas tax evasion ranges from $50 billion to $130 billion.51 Reforms intended to increase tax compliance will require an understanding of the risks and costs of underreporting income.
University of Michigan economist Joel Slemrod notes that tax evasion generates normative public policy problems that this paper has not addressed. First, evasion creates horizontal inequities because workers with equal earnings have differ-ent tax burdens. Second, evasion provides perverse social incentives for produc-tion activities where taxation is relatively light. An efficient tax code, and one that reduces social costs of inequity, is one that treats all production activities equally.52 A cleaner, less complicated tax code means a more equitable, higher-performance economy with more federal revenues.
Tax compliance costs in the United States are staggeringly high, and have impli-cations for lost economic growth, money spent unnecessarily on professional tax services, and even the collection of federal revenues. In 2011, individuals and busi-nesses expended approximately $378 billion in time and money in order to comply with the United States’ overly complex tax code. These resources would have been better spent on activities that increase firm capacity and production—or on work, saving, and investment at the individual level. The US tax system may also impose approximately $148 billion of prevented economic growth. Reforms that reduce marginal rates may have a small positive impact on national productivity. Finally, complying with higher marginal tax rates affects the federal government’s ability to bring in revenues. The United States may have missed approximately $452 billion of federal revenues in 2012 alone as a result of illegal tax evasion.
As the United States debates reforming the tax code, policymakers should also pay attention to the approximately $452 billion of uncollected revenues and poten-tially upwards of $526 billion of annual compliance, complexity, and economic costs associated with the current tax system. Reforms that reduce complexity will likely lead to greater efficiency, less paperwork, and higher revenues.
MERC ATUS CENTER AT GEORGE M A SON UNIVER SIT Y
17
NOTES
1. The Joint Committee on Taxation lists 60 different federal tax provisions (excluding temporary disaster relief provisions) scheduled to expire in 2011. In 2012, an additional 41 provisions are sched-uled to expire. Many of these provisions were extended by the American Taxpayer Relief Act of 2012. See Joint Committee on Taxation (JCT), “List of Expiring Federal Tax Provisions 2011–2022” (JCX-1-12, January 6, 2012), https://www.jct.gov/publications.html?func=download&id=4383&chk=4383&no_html=1. Some of these provisions were extended for an additional five years under the American Taxpayer Relief Act of 2012.
2. Congressional Budget Office (CBO), “The Budget and Economic Outlook: Fiscal Years 2013 to 2023,” February 2013, table 1-1 (p. 9), http://cbo.gov/sites/default/files/cbofiles/attachments/43907 -BudgetOutlook.pdf.
3. The bulk of the remaining tax revenue generated comes from social insurance and retirement taxes, which accounted for 36 percent of the total revenue collected in 2011. See Office of Management and Budget, table 2.1, “Receipts by Source: 1934–2017,” accessed 15 April 2013, http://www.whitehouse.gov /sites/default/files/omb/budget/fy2013/assets/hist02z1.xls.
4. Internal Revenue Service (IRS), “National Taxpayer Advocate 2010 Annual Report to Congress,” vol. 1, p. 4, http://www.taxpayeradvocate.irs.gov/files/MSP1_Tax%20Reform.pdf.
5. See Seth H. Giertz and Jacob M. Feldman, “The Economic Costs of Tax Policy Uncertainty: Implications for Fundamental Tax Reform” (Mercatus Research, Mercatus Center at George Mason University, Arlington, VA, November 27, 2012), http://mercatus.org/sites/default/files/TaxUncertainty _Gietz_v1-0_1.pdf; and Kevin M. Murphy, Andrei Shleifer, and Robert W. Vishny, “The Allocation of Talent: Implications for Growth,” Quarterly Journal of Economics 106, no. 2 (May 1991): 503–30.
6. US Government Accountability Office, “Tax Gap,” GAO-13-151, December 2012, p. 24, http://www .gao.gov/assets/660/650521.pdf.
7. Yuriy Gorodnichenko, Jorge Martinez-Vazquez, and Klara Sabirianova Peter, “Myth and Reality of Flat Tax Reform: Micro Estimates of Tax Evasion Response and Welfare Effects in Russia,” Journal of Political Economy 117, no. 3 (2009): 504–54.
8. According to the Joint Committee on Taxation, adjusted gross income is computed by subtract-ing “trade or business expenses, capital losses, and contributions to a tax-qualified retirement plan by a self-employed individual, contributions to individual retirement arrangements (‘IRAs’), certain mov-ing expenses, certain education-related expenses, and alimony payments” from gross income. JCT, “Overview of the Federal Tax System as in Effect for 2012,” JCX-18-12, February 24, 2012, p. 2, https://www.jct.gov/publications.html?func=download&id=4400&chk=4400&no_html=1. See also Susan C. Nelson and Julie-Anne Cronin, “Adjusted Gross Income,” in NTA Encyclopedia of Taxation and Tax Policy, ed. Joseph J. Cordes, Robert D. Ebel, and Jane G. Gravelle (Urban Institute Press, 2005), http://www.taxpolicycenter.org/taxtopics/encyclopedia/Adjusted-Gross-Income.cfm.
9. See JCT, “Overview of the Federal Tax System,” 3:
Personal exemptions generally are allowed for the taxpayer, his or her spouse, and any dependents. For 2012, the amount deductible for each personal exemption is $3,800. This amount is indexed annually for inflation. In tax years beginning after 2012, the personal exemption phase-out (“PEP”) will reduce a taxpayer’s personal exemption by two per-cent for each $2,500 by which the taxpayer’s AGI exceeds a certain threshold. JCT staff estimates of the PEP thresholds in 2013 are $172,250 (single) and $258,350 (married filing jointly).
MERC ATUS CENTER AT GEORGE M A SON UNIVER SIT Y
18
10. Ibid.:
The basic standard deduction varies depending upon a taxpayer’s filing status. For 2012, the amount of the standard deduction is $5,950 for single individuals and married individuals filing separate returns, $8,500 for heads of households, and $11,900 for married individuals filing a joint return and surviving spouses. An additional standard deduction is allowed with respect to any individual who is elderly or blind. The amounts of the basic standard deduc-tion and the additional standard deductions are indexed annually for inflation.
11. Ibid.:
The deductions that may be itemized include State and local income taxes (or, in lieu of income, sales taxes), real property and certain personal property taxes, home mortgage interest, charitable contributions, certain investment interest, medical expenses (in excess of 7.5 percent of AGI), casualty and theft losses (in excess of 10 percent of AGI and in excess of $100 per loss), and certain miscellaneous expenses (in excess of two percent of AGI). In tax years beginning after 2012, the total amount of itemized deductions allowed is reduced for taxpayers with incomes over a certain threshold amount, which is indexed annually for inflation. JCT staff estimates of these limitation thresholds in 2013 are $172,250 for both single taxpayers and those who are married filing jointly.
The percentage comes from the authors’ calculations. IRS, table 1.1, “All Returns: Selected Income and Tax Items, by Size and Accumulated Size of Adjusted Gross Income, Tax Year 2010,” accessed April 16, 2013, http://www.irs.gov/file_source/PUP/taxstats/indtaxstats/10in11si.xls; and IRS, table 3, “Returns with Itemized Deductions: Itemized Deductions by Type and by Size of Adjusted Gross Income, Tax Year 2010,” accessed April 16, 2013, http://www.irs.gov/file_source/pub/irs-soi/10in03id.xls.
12. The Alternative Minimum Tax exemption amount for tax year 2013 is $51,900 ($80,800 for married couples filing jointly). A minimum tax rate of 26 percent applies to income earned above the exemption. See IRS, “Annual Inflation Adjustments for 2013,” news release IR-2013-4, January 11, 2013, http://www .irs.gov/uac/Newsroom/Annual-Inflation-Adjustments-for-2013.
13. C. Fritz Foley et al., “Why Do Firms Hold So Much Cash? A Tax-Based Explanation” (Harvard Business School website, February 2007), http://www.people.hbs.edu/ffoley/Cash.pdf.
14. Active foreign-source income is subject to taxation only upon repatriation, while passive foreign-source income and royalties are subject to taxation during the tax year they are generated.
15. Kate Linebaugh, “How Firms Tap Overseas Cash,” Wall Street Journal, March 28, 2013, http://online.wsj.com/article/SB10001424127887323361804578388522312624686.html.
16. John D. McKinnon, “Big Business Spars over Rewriting Tax Code,” Wall Street Journal, March 28, 2013, http://online.wsj.com/article/SB10001424127887323361804578388112619484392.html.
17. See Testimony of Dr. Robert Dietz on Behalf of the National Association of Home Builders Before the United States Senate Committee on Finance Hearing on Tax Reform Options: Incentives for Homeownership, 112th Cong., 1st sess., October 6, 2011, http://www.finance.senate.gov/imo/media/doc /Dietz%20testimony%20SFC%2010-6-11.pdf.
18. IRS, “National Taxpayer Advocate 2010,” vol. 1, p. 5.
19. Treasury Inspector General for Tax Administration, “Analysis of Internal Revenue Service Employees’ Use of Tax Preparation Assistance” (report 2012-40-001, Department of the Treasury, Washington, DC, January 9, 2012), p. 1, http://www.treasury.gov/tigta/auditreports/2012reports/201240001fr.pdf. However, tax software may not address all taxpayer responsibilities, as former Treasury sec-retary Timothy Geithner can attest. Mary Pilon, “TurboTax and Timothy Geithner’s Tax Problems,” The Wallet (a Wall Street Journal blog), January 22, 2009, http://blogs.wsj.com/wallet/2009/01/22/turbo -tax-and-timothy-geithners-tax-problems/.
MERC ATUS CENTER AT GEORGE M A SON UNIVER SIT Y
19
20. IRS, “National Taxpayer Advocate 2012 Annual Report to Congress,” vol. 1, p. 9, http://www .taxpayeradvocate.irs.gov/userfiles/file/Full-Report/Volume-1.pdf.
21. Josh Hicks, “IRS Ombudsman: Overly Complex Tax Code Needs Overhaul,” Washington Post, January 9, 2013, http://articles.washingtonpost.com/2013-01-09/politics/36233123_1_tax-code-lower -individual-rates-individual-income-taxes.
22. Ibid.
23. Treasury Inspector General for Tax Administration, “Semiannual Report to Congress: April 1, 2011–September 30, 2011,” (Department of the Treasury, Washington, DC) pp. 30–31, accessed April 16, 2013, http://www.treasury.gov/tigta/semiannual/semiannual_sept2011.pdf.
24. In this paper we use various estimates from the scholarly literature to assign dollar values to the “costs” of our nation’s tax code so readers can try to understand and put meaning to their impact. These are estimates. This also does not necessarily mean that a dollar of compliance costs would have the same economic impact as, or be equivalent in magnitude to, costs associated with a dollar of defense spending, a dollar of health care spending, a dollar of government stimulus spending, and so on.
25. These companies include Exxon Mobil, Chevron, Apple, Microsoft, Ford Motor, JPMorgan Chase, American International Group, Wells Fargo, IBM, Wal-Mart Stores, General Electric, Intel, ConocoPhillips, Procter & Gamble, Citigroup, Berkshire Hathaway, Pfizer, Google, Johnson & Johnson, General Motors, Philip Morris International, Coca-Cola, Oracle, Hewlett-Packard, and MetLife. See CNN Money, “Top Companies: Most Profitable,” 2012, http://money.cnn.com/magazines/fortune /fortune500/2012/performers/companies/profits/.
26. US Census Bureau, State & County QuickFacts, accessed April 23, 2013, http://quickfacts.census .gov/qfd/index.html. Data are from 2011.
27. CNN Money, “Top Companies: Biggest Employers,” May 21, 2012, http://money.cnn.com /magazines/fortune/global500/2012/performers/companies/biggest/.
28. Alan Auerbach and James Hines describe the effects and problem of deadweight loss in their 2002 contribution to the Handbook of Public Economics: “A major practical difficulty in measuring the excess burden of a single tax, or of a system of taxes, is that excess burden is a function of demand interactions that are potentially very difficult to measure. . . . In order to estimate the excess burden of a labor-income tax, it is in principle necessary to estimate the effect of the tax on . . . decision margins.” See Alan J. Auerbach and James R. Hines Jr., “Taxation and Economic Efficiency,” in Handbook of Public Economics vol. 3, ed. Alan J. Auerbach and Martin S. Feinstein (Amsterdam: Elsevier, 2002).
29. Giertz and Feldman, “Economic Costs of Tax Policy Uncertainty” (see n. 5).
30. Arnold C. Harberger, “Taxation, Resource Allocation, and Welfare,” in The Role of Direct and Indirect Taxes in the Federal Reserve System, ed. J. Due (Princeton, NJ: Princeton University Press, 1964), 1347–421; and Arnold C. Harberger, “The Measurement of Waste,” American Economic Review 54 (1964): 58–76. Using labor supply as a proxy for deadweight loss, in “Taxation, Resource Allocation, and Welfare” Harberger finds an increasingly negative effect on the number of individuals looking for work as marginal tax rates increased. He finds that personal income taxes reduced labor supply by a minimum of 2.5 percent among earners with the lowest marginal tax rate (20 percent) to a high of 11.38 percent for workers in the highest marginal tax rate (91 percent).
31. Martin Feldstein, “Tax Avoidance and the Deadweight Loss of the Income Tax,” Review of Economics and Statistics 81, no. 4 (November 1999): 674–80.
32. Martin Feldstein, “Effects of Taxes on Economic Behavior,” National Tax Journal 61, no. 1 (March 2008): 131–39.
MERC ATUS CENTER AT GEORGE M A SON UNIVER SIT Y
20
33. Alexander Eichler, “10 Most Profitable U.S. Corporations Paid Average Tax Rate of Just 9 Percent Last Year: Report,” Huffington Post, August 6, 2012, http://www.huffingtonpost.com/2012/08/06/most -profitable-corporations-tax-rate_n_1746817.html.
34. Sören Blomquist and Laurent Simula, “Marginal Deadweight Loss When the Income Tax Is Nonlinear” (Uppsala University and Uppsala Center for Fiscal Studies, March 8, 2012).
35. These numbers are the authors’ calculations. See CBO, “Historical Budget Data—February 2013 Baseline Projections,” February 2013, table 1, http://www.cbo.gov/sites/default/files/cbofiles /attachments/43904-Historical%20Budget%20Data-2.xls; and CBO, “Budget and Economic Outlook: Fiscal Years 2013 to 2023” (see n. 2), summary table 1 (p. 3).
36. Seth Giertz, “The Elasticity of Taxable Income: Influences on Economic Efficiency and Tax Revenues, and Implications for Tax Policy,” in Tax Policy Lessons from the 2000s, ed. Alan D. Viard (Washington, DC: AEI Press, 2009).
37. Percentages are the authors’ calculations.
38. Raj Chetty, “Is the Taxable Income Elasticity Sufficient to Calculate Deadweight Loss? The Implications of Evasion and Avoidance,” American Economic Journal: Economic Policy 1, no. 2 (August 2009): 31–52.
39. Joel Slemrod and Shlomo Yitzhaki, “Tax Avoidance, Evasion, and Administration,” in Handbook of Public Economics vol. 3, ed. Alan J. Auerbach and Martin S. Feinstein (Amsterdam: Elsevier, 2002), 1423–70.
40. Chetty, “Is the Taxable Income Elasticity Sufficient to Calculate Deadweight Loss?”
41. Brian Kelleher Richter, Krislert Samphantharak, and Jeffrey F. Timmons, “Lobbying and Taxes,” American Journal of Political Science 53, no. 4 (October 2009): 893–909.
42. Hui Chen, David Parsley, and Ya-Wen Yang, “Corporate Lobbying and Financial Performance,” November 23, 2012, available at http://ssrn.com/abstract=1014264.
43. Murphy, Shleifer, and Vishny, “Allocation of Talent” (see n. 5).
44. Giertz and Feldman, “Economic Costs of Tax Policy Uncertainty” (see n. 5).
45. Federico Sturzenegger and Mariano Tommasi, “The Distribution of Political Power, the Costs of Rent-Seeking, and Economic Growth,” Economic Inquiry 32, no. 2 (April 1994): 236–48.
46. Jason Fichtner and Jacob Feldman, “When Are Tax Expenditures Really Spending? A Look at Tax Expenditures and Lessons from the Tax Reform Act of 1986” (Working Paper No. 11-45, Mercatus Center at George Mason University, Arlington, VA, November 2011), http://mercatus.org/sites/default/files /publication/Tax_expenditures_FichtnerFeldman_WP1145_0.pdf.
47. Anil Kumar, “Labor Supply, Deadweight Loss and Tax Reform Act of 1986: A Nonparametric Evaluation Using Panel Data,” Journal of Public Economics 92 (2008): 236–53.
48. Gorodnichenko, Martinez-Vazquez, and Peter, “Myth and Reality of Flat Tax Reform” (see n. 7).
49. IRS, “Tax Gap for Tax Year 2006,” January 6, 2012, http://www.irs.gov/pub/irs-soi/06rastg12 overvw.pdf.
50. These numbers are the authors’ calculations. See CBO, “Budget and Economic Outlook: Fiscal Years 2013 to 2023” (see n. 2), table B-1 (p. 64).
MERC ATUS CENTER AT GEORGE M A SON UNIVER SIT Y
21
51. See Jane G. Gravelle, “Tax Havens: International Tax Avoidance and Evasion,” Congressional Research Service Report, January 23, 2013, http://www.fas.org/sgp/crs/misc/R40623.pdf. Gravelle’s range of estimates (corporate: $10 billion to $60 billion; individual: $40 billion to $70 billion) come from the following studies: Martin Sullivan, “Shifting Profits Offshore Costs U.S. Treasury $10 Billion or More,” Tax Notes, September 27, 2004, 1477–81; Kimberly A. Clausing, “The Revenue Effects of Multinational Firm Income Shifting,” Tax Notes, March 28, 2011, 1580–86; Joseph Guttentag and Reven Avi-Yonah, “Closing the International Tax Gap,” in Bridging the Tax Gap: Addressing the Crisis in Federal Tax Administration, ed. Max B. Sawicky (Washington, DC: Economic Policy Institute, 2005).
52. Joel Slemrod, “Cheating Ourselves: The Economics of Tax Evasion,” Journal of Economic Perspectives 21, no. 1 (Winter 2007): 25–48.