The Downstream Effects of Bail and Pretrial Detention on ...

The Hidden Costs of Pretrial Detention
Christopher T. Lowenkamp, Ph.D.
Marie VanNostrand, Ph.D.
Alexander Holsinger, Ph.D.
November, 2013
W W W. A R N O L D F O U N DAT I O N . O R G The Hidden Costs of Pretrial Detention | 2
Executive Summary ......................................................................................................................................................................................3
Introduction .....................................................................................................................................................................................................5
Study Description ............................................................................................................................................................................................................5
Research Objectives and Questions ......................................................................................................................................................................5
Dataset ..................................................................................................................................................................................................................................6
Methodology ......................................................................................................................................................................................................................6
Sample Description .......................................................................................................................................................................................7
Demographics ....................................................................................................................................................................................................................7
Offense Information .......................................................................................................................................................................................................7
Risk Level .............................................................................................................................................................................................................................7
Days in Pretrial Detention ...........................................................................................................................................................................................8
Outcomes .............................................................................................................................................................................................................................8
Research Objective One: Investigate the relationship between the length of pretrial detention and pretrial outcome ................................................10
Research Questions ........................................................................................................................................................................................................10
Primary Findings ..............................................................................................................................................................................................................10
Methods and Analysis Results ..................................................................................................................................................................................11
Research Question 1a: Is the length of pretrial detention related to the likelihood of pretrial FTA once other relevant statistical controls are considered? ..................................................................................................................................................................................11Research Question 1b: Do the observed effects (of days spent in detention when predicting FTA) differ for sub-populations of defendants? .....................................................................................................................................................................................................13Research Question 1c: Is the length of pretrial detention related to the likelihood of pretrial NCA once other relevant statistical controls are considered? .................................................................................................................................................................................15Research Question 1d: Do the observed effects (of days spent in detention when predicting NCA) differ for sub-populations of defendants? ..................................................................................................................................................................17
Research Objective Two: Investigate the relationship between pretrial detention, as well as the length of pretrial detention, and new criminal activity post-disposition (NCA-PD) ..........................................................................................................................................19
Research Questions ........................................................................................................................................................................................................19
Primary Findings ..............................................................................................................................................................................................................19
Research Question 2a: Is pretrial detention related to NCA-PD? ................................................................................................................................................20Research Question 2b: Do the observed effects of pretrial detention differ for sub-populations of defendants (likelihood of 12-month NCA-PD and 24-month NCA-PD)? .............................................................................21Research Question 2c: Is the length of pretrial detention related to NCA-PD? ....................................................................................................................22Research Question 2d: Do the observed effects of the length of pretrial detention differ for sub-populations of defendants (likelihood of 12-month NCA-PD and 24-month NCA-PD)? .............................................................................24
Appendix ..........................................................................................................................................................................................................29
Appendix A: Table A-1 .....................................................................................................................................................................................................29
Appendix B: References................................................................................................................................................................................................32
TABLE OF CONTENTS

W W W. A R N O L D F O U N DAT I O N . O R G The Hidden Costs of Pretrial Detention | 3
EXECUTIVE SUMMARY
In the criminal justice system, the time between arrest and case disposition is known as the pretrial stage. Each time a person is
arrested and accused of a crime, a decision must be made as to whether the accused person, known as the defendant, will be detained in jail awaiting trial or will be released back into the community. But pretrial detention is not simply an either-or proposition; many defendants are held for a number of days before being released at some point before their trial.
The release-and-detention decision takes into account a number of different concerns, including protecting the community, the need for defendants to appear in court, and upholding the legal and constitutional rights afforded to accused persons awaiting trial. It carries enormous consequences not only for the defendant but also for the safety of the community.
Little is known about the impact of pretrial detention on pretrial outcomes and post-disposition recidivism. Some researchers and legal professionals believe there is a relationship between the number of days spent in pretrial detention and the defendant’s community stability (e.g., employment, finances, residence, family), especially for lower-risk defendants. Specifically, the defendant’s place in the community becomes more destabilized as the number of days of pretrial detention increases. This destabilization is believed to lead to an increase in risk for both failure to appear and new criminal activity. While this purported relationship makes intuitive sense, there has been no empirical evidence in existence to support or refute this idea. Beyond the relationship between length of pretrial detention and pretrial outcomes, there is an additional underdeveloped area of research — the impact of pretrial detention on post-disposition recidivism.
Using data from the Commonwealth of Kentucky, this research investigates the impact of pretrial detention on 1) pretrial outcomes (failure to appear and arrest for new criminal activity); and 2) post-disposition recidivism.
Detaining low- and moderate-risk defendants, even just for a few days, is strongly correlated with higher rates of new criminal activity both during the pretrial period and years after case disposition; as length of pretrial detention increases up to 30 days, recidivism rates for low- and moderate-risk defendants also increases significantly.
When held 2-3 days, low-risk defendants are almost 40 percent more likely to commit new crimes before trial than equivalent defendants held no more than 24 hours.
When held 8-14 days, low-risk defendants are 51 percent more likely to commit another crime within two years after completion of their cases than equivalent defendants held no more than 24 hours.
REPORT HIGHLIGHTS :
W W W. A R N O L D F O U N DAT I O N . O R G The Hidden Costs of Pretrial Detention | 4
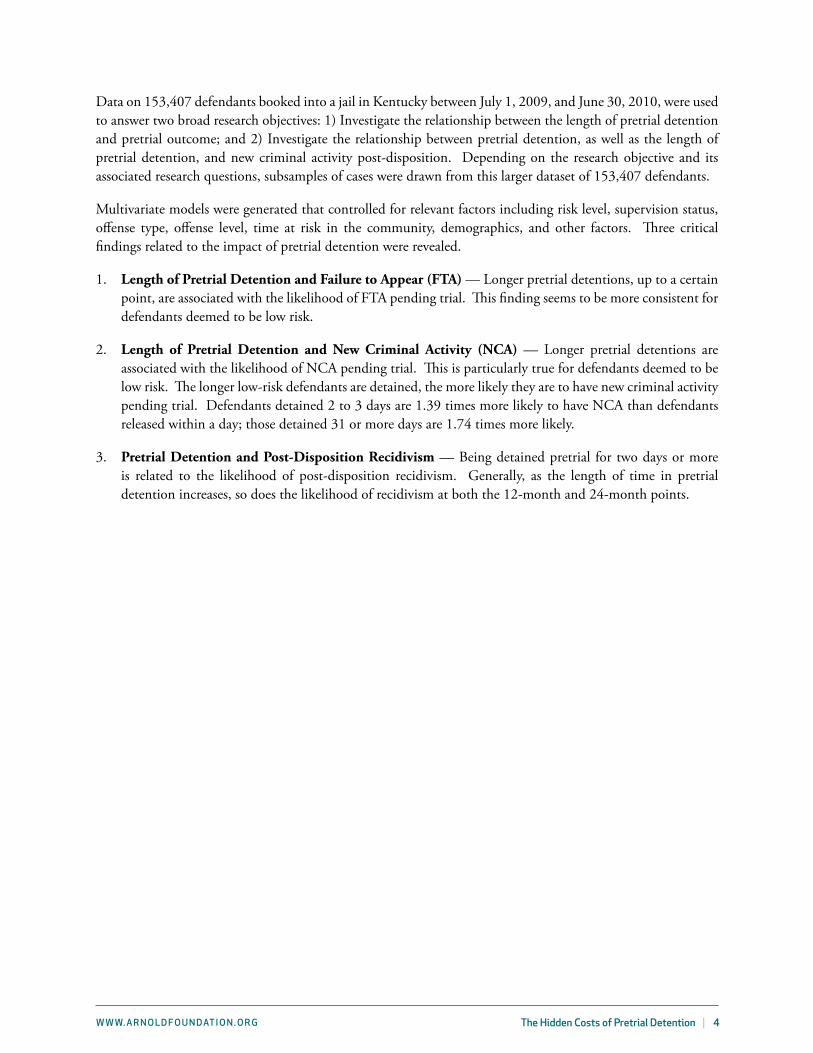
Data on 153,407 defendants booked into a jail in Kentucky between July 1, 2009, and June 30, 2010, were used to answer two broad research objectives: 1) Investigate the relationship between the length of pretrial detention and pretrial outcome; and 2) Investigate the relationship between pretrial detention, as well as the length of pretrial detention, and new criminal activity post-disposition. Depending on the research objective and its associated research questions, subsamples of cases were drawn from this larger dataset of 153,407 defendants.
Multivariate models were generated that controlled for relevant factors including risk level, supervision status, offense type, offense level, time at risk in the community, demographics, and other factors. Three critical findings related to the impact of pretrial detention were revealed.
1. Length of Pretrial Detention and Failure to Appear (FTA) — Longer pretrial detentions, up to a certain point, are associated with the likelihood of FTA pending trial. This finding seems to be more consistent for defendants deemed to be low risk.
2. Length of Pretrial Detention and New Criminal Activity (NCA) — Longer pretrial detentions are associated with the likelihood of NCA pending trial. This is particularly true for defendants deemed to be low risk. The longer low-risk defendants are detained, the more likely they are to have new criminal activity pending trial. Defendants detained 2 to 3 days are 1.39 times more likely to have NCA than defendants released within a day; those detained 31 or more days are 1.74 times more likely.
3. Pretrial Detention and Post-Disposition Recidivism — Being detained pretrial for two days or more is related to the likelihood of post-disposition recidivism. Generally, as the length of time in pretrial detention increases, so does the likelihood of recidivism at both the 12-month and 24-month points.

W W W. A R N O L D F O U N DAT I O N . O R G The Hidden Costs of Pretrial Detention | 5
INTRODUCTION
Study Description
The current study investigates the correlation of pretrial detention with 1) pretrial outcomes (failure to appear, hereafter FTA, and arrest for new criminal activity, hereafter NCA); and 2) post-disposition recidivism (new criminal activity post-disposition, hereafter NCA-PD).
Research Objectives and Questions
The study includes two (2) research objectives and 8 related research questions, as shown below.
1. Investigate the relationship between the length of pretrial detention and pretrial outcome.
a. Is the length of pretrial detention related to the likelihood of pretrial FTA once other relevant statistical controls are considered?
b. Do the observed effects (of days spent in detention when predicting FTA) differ for sub-populations of defendants?
c. Is the length of pretrial detention related to the likelihood of pretrial NCA once other relevant statistical controls are considered?
d. Do the observed effects (of days spent in detention when predicting NCA) differ for sub-populations of defendants?
2. Investigate the relationship between pretrial detention, as well as the length of pretrial detention, and new criminal activity post-disposition (NCA-PD).
a. Is pretrial detention related to NCA-PD?b. Do the observed effects of pretrial detention differ for sub-populations of defendants (likelihood of
12-month NCA-PD and 24-month NCA-PD)?c. Is the length of pretrial detention related to NCA-PD?d. Do the observed effects of the length of pretrial detention differ for sub-populations of defendants
(likelihood of 12-month NCA-PD and 24-month NCA-PD)?

W W W. A R N O L D F O U N DAT I O N . O R G The Hidden Costs of Pretrial Detention | 6
Dataset
The sample used for the current study includes all defendants arrested and booked into a Kentucky jail between July 1, 2009, and June 30, 2010. This led to a working sample size of 153,407. The dataset does not represent unique individuals, but rather includes all bookings within the study period. (Some individuals were booked multiple times within the timeframe; calculating a unique count of individuals could not be performed reliably, as unique identifiers were missing in almost 10% of the cases.) All cases in the sample reached final case disposition. These data served as the sample of defendants used to respond to the research objectives. Depending on the research objective and its associated research questions, subsamples of cases were drawn from this larger dataset of 153,407 defendants. All bookings from July 1, 2010, to June 30, 2012, were added to the dataset to develop post-disposition measures of arrest for new criminal activity.
The measures in this study included the following:
• defendant demographics; • defendant risk;• offense characteristics including offense level (e.g., felony or misdemeanor) as well as felony offense class (A,
B, C, D) for some analyses;• details of pretrial status (released or detained, and length of detention);• failure to appear and arrest for new criminal activity during pretrial release; • time at risk in the community for both pretrial and post-disposition periods; and • new criminal activity post-disposition (NCA-PD).
Methodology
Bivariate and multivariate models were used to complete the analysis. Most commonly used was logistic regression modeling, a procedure designed for what is generally referred to as a dichotomous or binary outcome variable. (Recidivism, for example, is typically considered either a “yes” or “no” outcome, regardless of measurement procedure.) Logistic regression, like many types of regression, allows for several variables to be entered into a model while statistically controlling for the effects of other variables. Generally, when a multivariate model is conducted, the variable of interest is highlighted (e.g., the effect of pretrial detention, or the length of pretrial detention) while controlling for the effects of other variables (such as age, race, gender, risk level, and the like).
Also incorporated in the analysis are Poisson regression models, which are typically used when the outcome variable is a discrete count (e.g., the number of months someone is sentenced to prison or jail, or the number of times someone is arrested). Counts tend to be distributed in such a way that the assumptions of linear regression are violated; therefore, an adjustment in modeling is required. Poisson regression, like logistic regression and other types of regression, allows for several variables to be entered into a model while statistically controlling for the effects of other variables. This allows for the examination of the effect of one or more variables of interest (e.g., pretrial detention and/or the length of pretrial detention).
The county of case origin, although not shown in any of the multivariate tables published here, was included in every multivariate model constructed and estimated. Robust standard error estimates were developed with clustering at the county level and were used in all multivariate analyses.

W W W. A R N O L D F O U N DAT I O N . O R G The Hidden Costs of Pretrial Detention | 7
SAMPLE DESCRIPTION
The dataset described above, including 153,407 records representing all defendants arrested and booked into a Kentucky jail between July 1, 2009, and June 30, 2010, was used for the analysis.
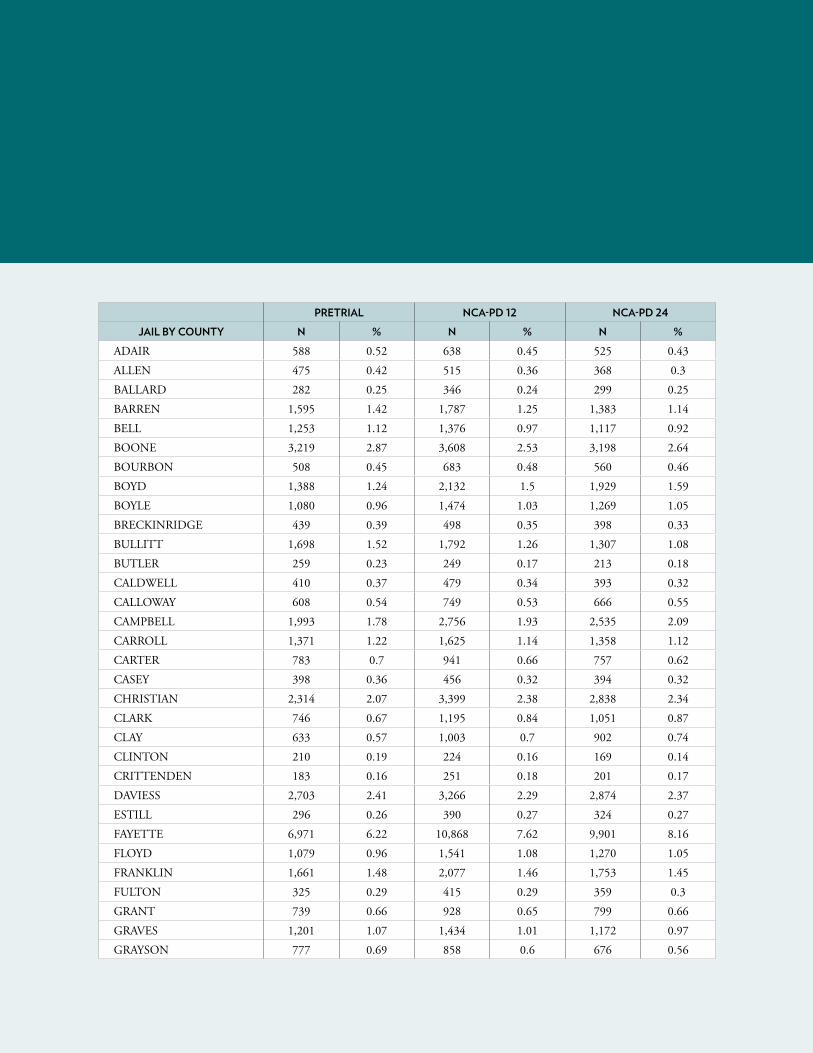
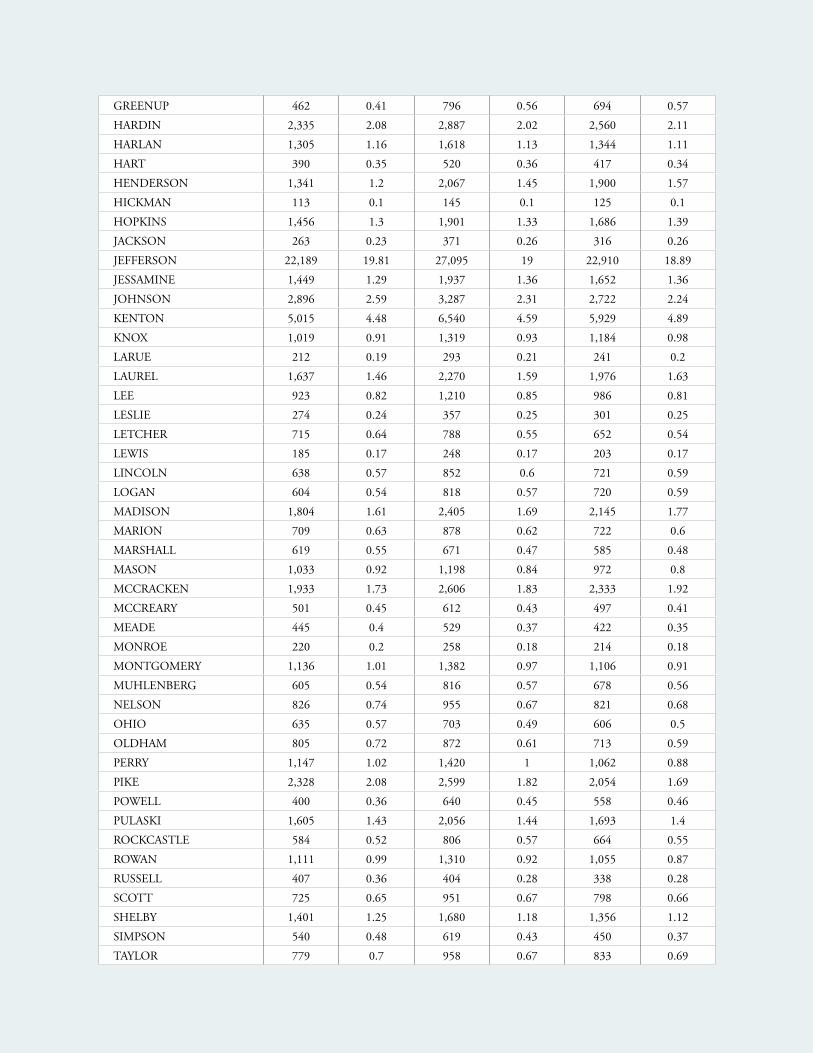
There are 120 counties and 84 local jails in Kentucky. Table A-1 (see Appendix A) provides a jail-by-jail breakdown, identified by county location, and the number of cases originating from each jail. The number of cases is presented (N), as well as the percentage of the total that each jail comprises. Results are grouped by Pretrial, NCA-PD (12 months), and NCA-PD (24 months) samples. The vast majority of jails contributed 3% or less of the total sample, with the noted exception of Jefferson County (approximately 19%) and Fayette County (approximately 7%).
Demographics
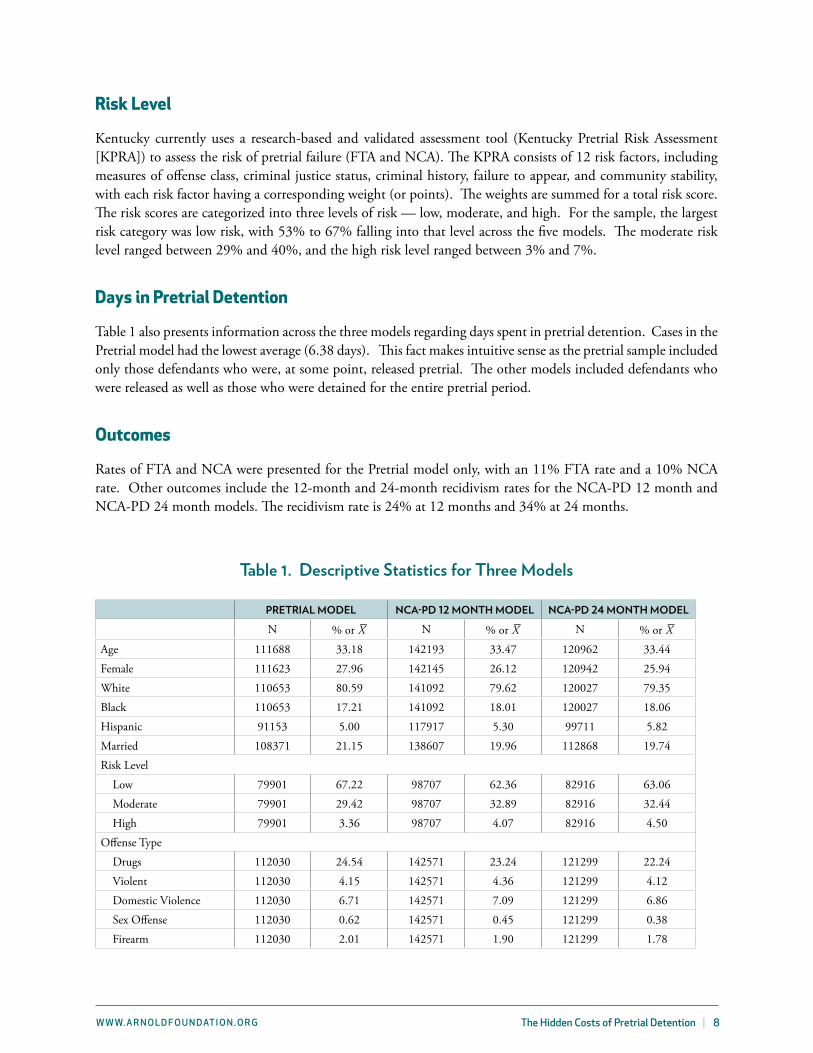
Table 1 presents descriptive information for the entire state sample, grouped in three different categories, or models (Pretrial, NCA-PD 12 months, and NCA-PD 24 months). Taken as a whole, the sample is approximately 26% female, 74% male, 79% white, 17% black, and 4% hispanic. The average age is approximately 33, and approximately 20% reported being married.
The different samples used to answer the research questions in this report tend to be similar. In most instances, the number of defendants who are classified as hispanic or another ethnicity or race is insufficient to be included in the statistical models as control variables. Therefore, most of the analyses only include white and black as control variables.
Offense Information
Table 1 also presents the original offense types1 for the entire sample and each sub-sample used for the different research questions. Generally, drug, traffic, theft, and driving under the influence appear to be the most frequent offense types across the three samples.
1 It is important to note that defendants could contribute more than one offense to the offense type categorizations.
W W W. A R N O L D F O U N DAT I O N . O R G The Hidden Costs of Pretrial Detention | 8
Risk Level
Kentucky currently uses a research-based and validated assessment tool (Kentucky Pretrial Risk Assessment [KPRA]) to assess the risk of pretrial failure (FTA and NCA). The KPRA consists of 12 risk factors, including measures of offense class, criminal justice status, criminal history, failure to appear, and community stability, with each risk factor having a corresponding weight (or points). The weights are summed for a total risk score. The risk scores are categorized into three levels of risk — low, moderate, and high. For the sample, the largest risk category was low risk, with 53% to 67% falling into that level across the five models. The moderate risk level ranged between 29% and 40%, and the high risk level ranged between 3% and 7%.
Days in Pretrial Detention
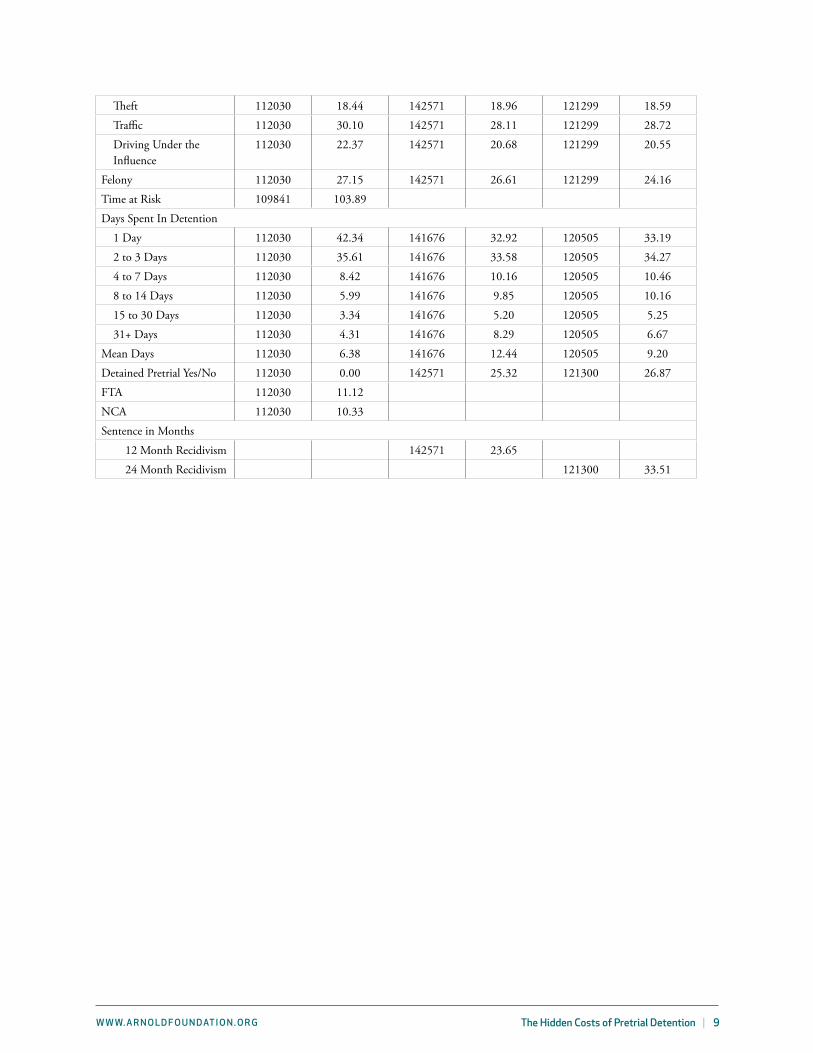
Table 1 also presents information across the three models regarding days spent in pretrial detention. Cases in the Pretrial model had the lowest average (6.38 days). This fact makes intuitive sense as the pretrial sample included only those defendants who were, at some point, released pretrial. The other models included defendants who were released as well as those who were detained for the entire pretrial period.
Outcomes
Rates of FTA and NCA were presented for the Pretrial model only, with an 11% FTA rate and a 10% NCA rate. Other outcomes include the 12-month and 24-month recidivism rates for the NCA-PD 12 month and NCA-PD 24 month models. The recidivism rate is 24% at 12 months and 34% at 24 months.
Table 1. Descriptive Statistics for Three Models
PRETRIAL MODEL NCA-PD 12 MONTH MODEL NCA-PD 24 MONTH MODELN % or N % or N % or
Age 111688 33.18 142193 33.47 120962 33.44
Female 111623 27.96 142145 26.12 120942 25.94
White 110653 80.59 141092 79.62 120027 79.35
Black 110653 17.21 141092 18.01 120027 18.06
Hispanic 91153 5.00 117917 5.30 99711 5.82
Married 108371 21.15 138607 19.96 112868 19.74
Risk Level
Low 79901 67.22 98707 62.36 82916 63.06
Moderate 79901 29.42 98707 32.89 82916 32.44
High 79901 3.36 98707 4.07 82916 4.50
Offense Type
Drugs 112030 24.54 142571 23.24 121299 22.24
Violent 112030 4.15 142571 4.36 121299 4.12
Domestic Violence 112030 6.71 142571 7.09 121299 6.86
Sex Offense 112030 0.62 142571 0.45 121299 0.38
Firearm 112030 2.01 142571 1.90 121299 1.78
W W W. A R N O L D F O U N DAT I O N . O R G The Hidden Costs of Pretrial Detention | 9
Theft 112030 18.44 142571 18.96 121299 18.59
Traffic 112030 30.10 142571 28.11 121299 28.72
Driving Under the Influence
112030 22.37 142571 20.68 121299 20.55
Felony 112030 27.15 142571 26.61 121299 24.16
Time at Risk 109841 103.89
Days Spent In Detention
1 Day 112030 42.34 141676 32.92 120505 33.19
2 to 3 Days 112030 35.61 141676 33.58 120505 34.27
4 to 7 Days 112030 8.42 141676 10.16 120505 10.46
8 to 14 Days 112030 5.99 141676 9.85 120505 10.16
15 to 30 Days 112030 3.34 141676 5.20 120505 5.25
31+ Days 112030 4.31 141676 8.29 120505 6.67
Mean Days 112030 6.38 141676 12.44 120505 9.20
Detained Pretrial Yes/No 112030 0.00 142571 25.32 121300 26.87
FTA 112030 11.12
NCA 112030 10.33
Sentence in Months
12 Month Recidivism 142571 23.65
24 Month Recidivism 121300 33.51
W W W. A R N O L D F O U N DAT I O N . O R G The Hidden Costs of Pretrial Detention | 1 0
RESEARCH OBJECTIVE ONE: Investigate the relationship between the length of pretrial detention and pretrial outcome
Research Questions
1a. Is the length of pretrial detention related to the likelihood of pretrial FTA once other relevant statistical controls are considered?
1b. Do the observed effects (of days spent in detention when predicting FTA) differ for sub-populations of defendants?
1c. Is the length of pretrial detention related to the likelihood of pretrial NCA once other relevant statistical controls are considered?
1d. Do the observed effects (of days spent in detention when predicting NCA) differ for sub-populations of defendants?
Primary Findings
Overall, when other relevant statistical controls are considered, defendants who are detained 2 to 3 days pretrial are slightly more likely to FTA than defendants who are detained 1 day (1.09 times more likely). Examining sub-populations of defendants revealed significant differences, however, in the impact of length of pretrial detention when considering defendant risk level. Specifically, low-risk defendants are more likely to FTA if they are detained 2 to 3 days (1.22 times more likely than low-risk defendants detained 1 day or less), 4 to 7 days (1.22 times more likely), and 15 to 30 days (1.41 times more likely).
The analysis of the relationship between length of pretrial detention and NCA revealed that longer pretrial detention periods were associated with an increase in NCA for each category. Similar to FTA, examining sub-populations of defendants revealed significant differences in the impact of length of pretrial detention when considering defendant risk level.

W W W. A R N O L D F O U N DAT I O N . O R G The Hidden Costs of Pretrial Detention | 1 1
All categorizations of days spent in detention are associated with significant increases in the likelihood of NCA for low-risk defendants when compared to low-risk defendants detained for 1 day or less.
The longer low-risk defendants are detained, the more likely they are to have new criminal activity pretrial (1.39 times more likely when held 2 to 3 days, increasing to 1.74 when held 31 days or more).
For moderate-risk defendants, the lowest three categories of days spent in detention (2 to 3 days, 4 to 7 days, and 8 to 14 days) are associated with significant increases in the likelihood of NCA.
None of the days-in-detention categories are significant predictors of NCA for high-risk defendants.
Methods and Analysis Results
Bivariate models as well as multivariate logistic regression models predicting FTA and NCA were used to investigate these questions. Control items included length of pretrial detention, length of time in the community (time at risk), defendant risk, demographics, and offense characteristics. The analysis was repeated for sub-populations of defendants (i.e., gender, race, offense type, offense level and risk level).
RESEARCH QUESTION 1A
Is the length of pretrial detention related to the likelihood of pretrial FTA once other relevant statistical controls are considered?
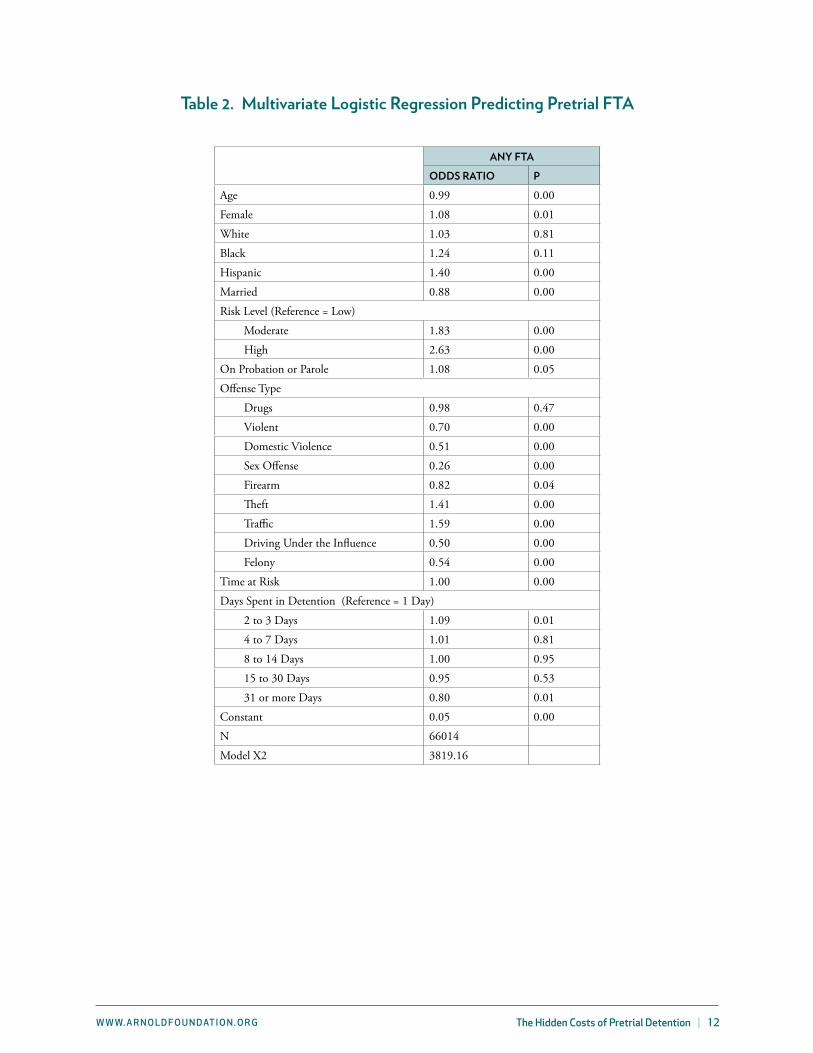
To determine whether there was a relationship between the length of pretrial detention and the likelihood of pretrial FTA, a multivariate logistic regression was estimated (see Table 2). The model included 66,014 cases and controlled for age, gender, race, ethnicity, marital status, risk level, supervision status, offense type, offense level, and time at risk. Several variables in the model revealed a statistically significant relationship with outcome; however, the variable “days spent in detention” was of particular interest in light of the research question. Days spent in detention was categorized in an ascending fashion (e.g., 1 day, 2 to 3 days, 4 to 7 days, 8 to 14 days, and so on). Including days spent in detention into the model in this fashion allows for the examination of each particular length of time as a predictor.
According to the odds ratio, the category 2 to 3 days was statistically and significantly (p < .05) related to FTA. Further, having an odds ratio above 1.00 means detentions of 2 to 3 days (when compared to 1 day) were associated with an increase in the likelihood of FTA. The categories 4 to 7 days, 8 to 14 days, and 15 to 30 days were not statistically related to FTA. The category 31 or more days was statistically related to FTA but had an odds ratio of less than 1.00, which indicates that defendants detained for that amount of time had a significant reduction in the likelihood of FTA.2
2 The reason for this is unknown, yet it is likely that defendants detained more than 31 days have fewer court dates to attend while in the community, thereby reducing the number of opportunities defendants may have to fail to appear.
W W W. A R N O L D F O U N DAT I O N . O R G The Hidden Costs of Pretrial Detention | 1 2
Table 2. Multivariate Logistic Regression Predicting Pretrial FTA
ANY FTAODDS RATIO P
Age 0.99 0.00
Female 1.08 0.01
White 1.03 0.81
Black 1.24 0.11
Hispanic 1.40 0.00
Married 0.88 0.00
Risk Level (Reference = Low)
Moderate 1.83 0.00
High 2.63 0.00
On Probation or Parole 1.08 0.05
Offense Type
Drugs 0.98 0.47
Violent 0.70 0.00
Domestic Violence 0.51 0.00
Sex Offense 0.26 0.00
Firearm 0.82 0.04
Theft 1.41 0.00
Traffic 1.59 0.00
Driving Under the Influence 0.50 0.00
Felony 0.54 0.00
Time at Risk 1.00 0.00
Days Spent in Detention (Reference = 1 Day)
2 to 3 Days 1.09 0.01
4 to 7 Days 1.01 0.81
8 to 14 Days 1.00 0.95
15 to 30 Days 0.95 0.53
31 or more Days 0.80 0.01
Constant 0.05 0.00
N 66014
Model X2 3819.16
W W W. A R N O L D F O U N DAT I O N . O R G The Hidden Costs of Pretrial Detention | 1 3
RESEARCH QUESTION 1B
Do the observed effects (of days spent in detention when predicting FTA) differ for sub-populations of defendants?
To determine whether the effects of days spent in detention differ for sub-populations of defendants, several additional logistic regression models were calculated (see Table 3). Separate models were calculated for the following sub-populations: whites, blacks, males, females, charged with a felony, charged with a misdemeanor, low risk, medium risk and high risk.
The analysis was conducted for all defendants released at some point pending trial. When interpreting the results, defendants released within one day were used as the reference or comparison group. For white defendants, even short periods in detention (2 to 3 days and 4 to 7 days), when compared to 1 day, were associated with increases in the odds of FTA, while longer periods were not related to FTA. The same held true for black defendants held 2 to 3 days, with longer periods of time not relating to the likelihood of FTA.
Male and female defendants were similar in that even short amounts of time in detention, when compared to 1 day, were statistically associated with increases in the likelihood of FTA (2 to 3 days for males, and both 2 to 3 days and 4 to 7 days for females).
The 2-to-3-day category was associated with a significant increase in the likelihood of FTA for both felony and misdemeanor defendants. The 4-to-7-day category was significantly related to FTA for misdemeanor defendants (but not felony defendants), while the 8-to-14-day category was significantly related to an increase in the likelihood of FTA for felony defendants only.
For low-risk defendants, every category of detention except 8 to 14 days was associated with a significant increase in the likelihood of FTA. For moderate-risk defendants, a short amount of time in detention (2 to 3 days) was associated with a significant increase in the likelihood of FTA, while longer amounts of time (15 to 30 days and 31 or more days) were associated with significant decreases in likelihood of FTA. For high-risk defendants, only one categorization (31 or more days) was statistically predictive of FTA, indicating a decrease in the likelihood.

W W W. A R N O L D F O U N DAT I O N . O R G The Hidden Costs of Pretrial Detention | 1 4
Table 3. Parameter Estimates for Logistic Regression Analyses Predicting FTA
SUBGROUPDAYS SPENT IN
DETENTION (Reference = 1 day)
ODDS RATIO P LOWER 95% CI UPPER 95% CI
White
53,135 2 to 3 Days 1.17 0.00 1.09 1.25
4 to 7 Days 1.17 0.01 1.04 1.31
8 to 14 Days 1.03 0.66 0.90 1.18
15 to 30 Days 1.05 0.62 0.87 1.25
31 or more Days 0.87 0.20 0.71 1.07
Black
11,676 2 to 3 Days 1.17 0.02 1.03 1.33
4 to 7 Days 0.99 0.93 0.77 1.27
8 to 14 Days 1.17 0.19 0.93 1.47
15 to 30 Days 0.90 0.56 0.64 1.27
31 or more Days 0.98 0.92 0.68 1.42
Male
47,200 2 to 3 Days 1.14 0.00 1.06 1.22
4 to 7 Days 1.11 0.10 0.98 1.25
8 to 14 Days 1.04 0.56 0.91 1.20
15 to 30 Days 0.91 0.30 0.75 1.09
31 or more Days 0.89 0.29 0.73 1.10
Female
18,581 2 to 3 Days 1.27 0.00 1.13 1.42
4 to 7 Days 1.24 0.03 1.03 1.50
8 to 14 Days 1.14 0.25 0.91 1.43
15 to 30 Days 1.29 0.08 0.97 1.72
31 or more Days 0.91 0.62 0.64 1.30
Felony
11,249 2 to 3 Days 1.26 0.03 1.02 1.55
4 to 7 Days 1.15 0.29 0.88 1.51
8 to 14 Days 1.34 0.02 1.05 1.71
15 to 30 Days 1.30 0.08 0.97 1.74
31 or more Days 1.10 0.56 0.80 1.51
Misdemeanor
46,454 2 to 3 Days 1.17 0.00 1.09 1.25
4 to 7 Days 1.14 0.04 1.01 1.29
8 to 14 Days 0.99 0.91 0.83 1.18
15 to 30 Days 0.85 0.21 0.66 1.10
31 or more Days 0.78 0.13 0.56 1.08

W W W. A R N O L D F O U N DAT I O N . O R G The Hidden Costs of Pretrial Detention | 1 5
Low
44,379 2 to 3 Days 1.22 0.00 1.13 1.33
4 to 7 Days 1.22 0.01 1.05 1.43
8 to 14 Days 1.06 0.55 0.87 1.29
15 to 30 Days 1.41 0.01 1.10 1.79
31 or more Days 1.31 0.05 1.00 1.72
Moderate
19,300 2 to 3 Days 1.12 0.03 1.01 1.24
4 to 7 Days 1.08 0.29 0.93 1.26
8 to 14 Days 1.06 0.48 0.90 1.25
15 to 30 Days 0.78 0.03 0.62 0.98
31 or more Days 0.77 0.05 0.60 0.99
High
2,161 2 to 3 Days 0.88 0.39 0.65 1.18
4 to 7 Days 0.84 0.38 0.57 1.24
8 to 14 Days 0.82 0.31 0.55 1.21
15 to 30 Days 0.75 0.26 0.45 1.23
31 or more Days 0.41 0.00 0.22 0.74
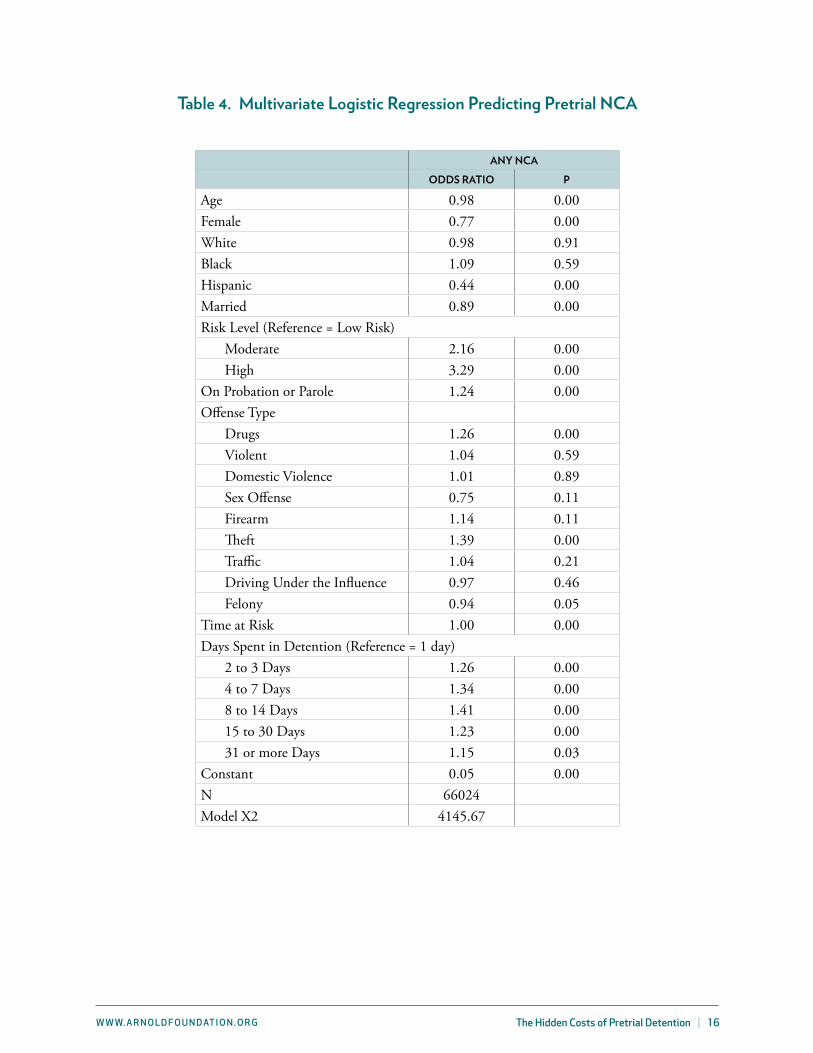
RESEARCH QUESTION 1C
Is the length of pretrial detention related to the likelihood of pretrial NCA once other relevant statistical controls are considered?
The analysis discussed in Research Question 1a was replicated using NCA as the dependent variable. As before, the variable of particular interest was length of days spent in detention. Every category of days spent in detention was significantly related to the likelihood of NCA. Every category in ascending order (2 to 3 days through 31 or more days) was associated with a significant increase in the likelihood of NCA; however, the impact of 31 or more days was not as large as the impact of other detention time periods.3
3 The argument can be made that at least some of the detained defendants would have recidivated regardless of the time in pretrial detention, and that the decision to detain those defendants was appropriate given their higher propensity to reoffend.
W W W. A R N O L D F O U N DAT I O N . O R G The Hidden Costs of Pretrial Detention | 1 6
Table 4. Multivariate Logistic Regression Predicting Pretrial NCA
ANY NCAODDS RATIO P
Age 0.98 0.00Female 0.77 0.00White 0.98 0.91Black 1.09 0.59Hispanic 0.44 0.00Married 0.89 0.00Risk Level (Reference = Low Risk)
Moderate 2.16 0.00High 3.29 0.00
On Probation or Parole 1.24 0.00Offense Type
Drugs 1.26 0.00Violent 1.04 0.59Domestic Violence 1.01 0.89Sex Offense 0.75 0.11Firearm 1.14 0.11Theft 1.39 0.00Traffic 1.04 0.21Driving Under the Influence 0.97 0.46Felony 0.94 0.05
Time at Risk 1.00 0.00Days Spent in Detention (Reference = 1 day)
2 to 3 Days 1.26 0.004 to 7 Days 1.34 0.008 to 14 Days 1.41 0.0015 to 30 Days 1.23 0.0031 or more Days 1.15 0.03
Constant 0.05 0.00N 66024Model X2 4145.67
W W W. A R N O L D F O U N DAT I O N . O R G The Hidden Costs of Pretrial Detention | 1 7
RESEARCH QUESTION 1D
Do the observed effects (of days spent in detention when predicting NCA) differ for sub-populations of defendants?
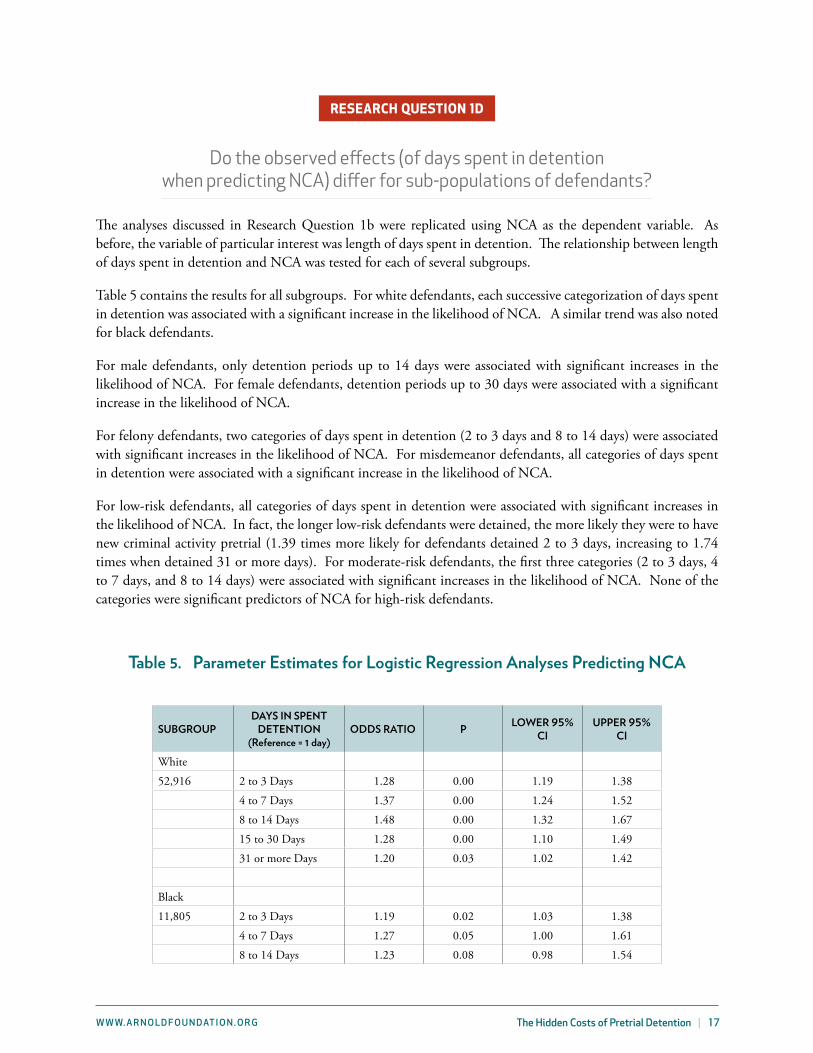
The analyses discussed in Research Question 1b were replicated using NCA as the dependent variable. As before, the variable of particular interest was length of days spent in detention. The relationship between length of days spent in detention and NCA was tested for each of several subgroups.
Table 5 contains the results for all subgroups. For white defendants, each successive categorization of days spent in detention was associated with a significant increase in the likelihood of NCA. A similar trend was also noted for black defendants.
For male defendants, only detention periods up to 14 days were associated with significant increases in the likelihood of NCA. For female defendants, detention periods up to 30 days were associated with a significant increase in the likelihood of NCA.
For felony defendants, two categories of days spent in detention (2 to 3 days and 8 to 14 days) were associated with significant increases in the likelihood of NCA. For misdemeanor defendants, all categories of days spent in detention were associated with a significant increase in the likelihood of NCA.
For low-risk defendants, all categories of days spent in detention were associated with significant increases in the likelihood of NCA. In fact, the longer low-risk defendants were detained, the more likely they were to have new criminal activity pretrial (1.39 times more likely for defendants detained 2 to 3 days, increasing to 1.74 times when detained 31 or more days). For moderate-risk defendants, the first three categories (2 to 3 days, 4 to 7 days, and 8 to 14 days) were associated with significant increases in the likelihood of NCA. None of the categories were significant predictors of NCA for high-risk defendants.
Table 5. Parameter Estimates for Logistic Regression Analyses Predicting NCA
SUBGROUPDAYS IN SPENT
DETENTION (Reference = 1 day)
ODDS RATIO P LOWER 95% CI
UPPER 95% CI
White
52,916 2 to 3 Days 1.28 0.00 1.19 1.38
4 to 7 Days 1.37 0.00 1.24 1.52
8 to 14 Days 1.48 0.00 1.32 1.67
15 to 30 Days 1.28 0.00 1.10 1.49
31 or more Days 1.20 0.03 1.02 1.42
Black
11,805 2 to 3 Days 1.19 0.02 1.03 1.38
4 to 7 Days 1.27 0.05 1.00 1.61
8 to 14 Days 1.23 0.08 0.98 1.54

W W W. A R N O L D F O U N DAT I O N . O R G The Hidden Costs of Pretrial Detention | 1 8
15 to 30 Days 1.18 0.28 0.87 1.60
31 or more Days 0.91 0.60 0.65 1.29
Male
47,209 2 to 3 Days 1.26 0.00 1.17 1.36
4 to 7 Days 1.31 0.00 1.17 1.46
8 to 14 Days 1.44 0.00 1.28 1.62
15 to 30 Days 1.16 0.07 0.99 1.36
31 or more Days 1.11 0.22 0.94 1.32
Female
18,712 2 to 3 Days 1.32 0.00 1.16 1.50
4 to 7 Days 1.47 0.00 1.21 1.77
8 to 14 Days 1.36 0.01 1.09 1.70
15 to 30 Days 1.62 0.00 1.23 2.11
31 or more Days 1.23 0.19 0.91 1.67
Felony
11,334 2 to 3 Days 1.20 0.05 1.00 1.44
4 to 7 Days 1.22 0.08 0.98 1.51
8 to 14 Days 1.50 0.00 1.23 1.84
15 to 30 Days 1.09 0.50 0.85 1.39
31 or more Days 1.01 0.94 0.78 1.31
Misdemeanor
46,337 2 to 3 Days 1.26 0.00 1.17 1.35
4 to 7 Days 1.38 0.00 1.22 1.56
8 to 14 Days 1.50 0.00 1.28 1.77
15 to 30 Days 1.52 0.00 1.22 1.89
31 or more Days 1.35 0.03 1.03 1.79
Low
44,468 2 to 3 Days 1.39 0.00 1.27 1.52
4 to 7 Days 1.50 0.00 1.30 1.72
8 to 14 Days 1.56 0.00 1.33 1.85
15 to 30 Days 1.57 0.00 1.26 1.95
31 or more Days 1.74 0.00 1.39 2.18
Moderate
19,368 2 to 3 Days 1.12 0.03 1.01 1.24
4 to 7 Days 1.20 0.01 1.05 1.38
8 to 14 Days 1.28 0.00 1.10 1.48
15 to 30 Days 1.03 0.76 0.85 1.25
31 or more Days 0.86 0.18 0.70 1.07
W W W. A R N O L D F O U N DAT I O N . O R G The Hidden Costs of Pretrial Detention | 1 9
High
2,171 2 to 3 Days 1.19 0.27 0.87 1.62
4 to 7 Days 1.25 0.25 0.86 1.83
8 to 14 Days 1.34 0.12 0.93 1.95
15 to 30 Days 1.29 0.27 0.82 2.04
31 or more Days 0.87 0.57 0.53 1.42
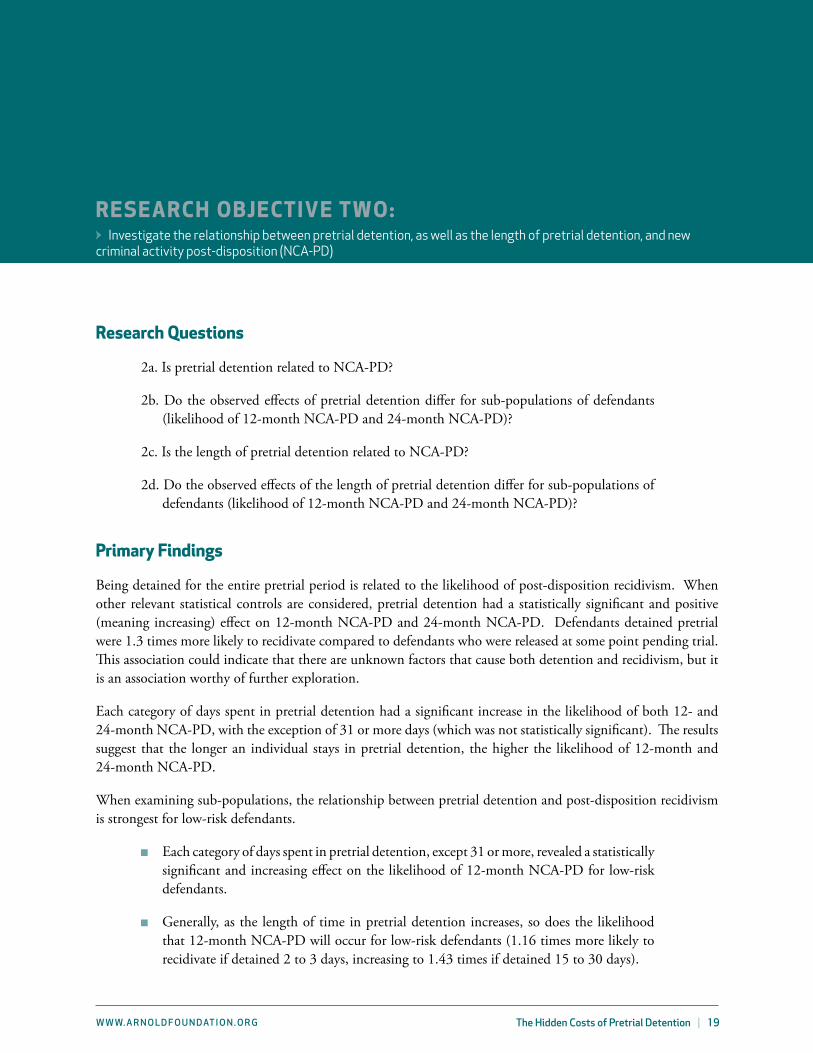
RESEARCH OBJECTIVE TWO: Investigate the relationship between pretrial detention, as well as the length of pretrial detention, and new
criminal activity post-disposition (NCA-PD)
Research Questions
2a. Is pretrial detention related to NCA-PD?
2b. Do the observed effects of pretrial detention differ for sub-populations of defendants (likelihood of 12-month NCA-PD and 24-month NCA-PD)?
2c. Is the length of pretrial detention related to NCA-PD?
2d. Do the observed effects of the length of pretrial detention differ for sub-populations of defendants (likelihood of 12-month NCA-PD and 24-month NCA-PD)?
Primary Findings
Being detained for the entire pretrial period is related to the likelihood of post-disposition recidivism. When other relevant statistical controls are considered, pretrial detention had a statistically significant and positive (meaning increasing) effect on 12-month NCA-PD and 24-month NCA-PD. Defendants detained pretrial were 1.3 times more likely to recidivate compared to defendants who were released at some point pending trial. This association could indicate that there are unknown factors that cause both detention and recidivism, but it is an association worthy of further exploration.
Each category of days spent in pretrial detention had a significant increase in the likelihood of both 12- and 24-month NCA-PD, with the exception of 31 or more days (which was not statistically significant). The results suggest that the longer an individual stays in pretrial detention, the higher the likelihood of 12-month and 24-month NCA-PD.
When examining sub-populations, the relationship between pretrial detention and post-disposition recidivism is strongest for low-risk defendants.
Each category of days spent in pretrial detention, except 31 or more, revealed a statistically significant and increasing effect on the likelihood of 12-month NCA-PD for low-risk defendants.
Generally, as the length of time in pretrial detention increases, so does the likelihood that 12-month NCA-PD will occur for low-risk defendants (1.16 times more likely to recidivate if detained 2 to 3 days, increasing to 1.43 times if detained 15 to 30 days).

W W W. A R N O L D F O U N DAT I O N . O R G The Hidden Costs of Pretrial Detention | 2 0
Each category of days spent in pretrial detention was associated with a significant increase in the likelihood of 24-month NCA-PD for low-risk defendants (1.17 times more likely to recidivate if detained 2 to 3 days, increasing to 1.46 times if detained 15 to 30 days).
Methods and Analysis Results
Multivariate logistic regression models were constructed to investigate the relationship between pretrial detention and NCA post-disposition. Control items included risk level, supervision status, offense type, offense class, incarceration history, and demographics. The analysis was repeated for sub-populations of defendants (i.e., gender, race, offense type, offense level and risk level).
RESEARCH QUESTION 2A
Is pretrial detention related to NCA-PD?
NCA-PD was assessed at both 12-months and 24-months post-disposition. Table 6 presents the results of multivariate logistic regression models that test the effects of pretrial detention when predicting NCA-PD while controlling for age, gender, race, ethnicity, marital status, risk level, supervision status, offense type, offense class, and incarceration history. Two models were calculated, one predicting 12-month NCA-PD and one predicting 24-month NCA-PD.
Being detained pretrial significantly increased the likelihood of 12-month and 24-month NCA-PD (1.3 times more likely to recidivate within both time periods), while controlling for all other variables in the model.
Table 6. Multivariate Logistic Regression Predicting Post-Disposition Recidivism
12 MONTH NCA-PD
24 MONTH NCA-PD
ODDS RATIO P ODDS RATIO PAge 0.99 0.00 0.99 0.00
Female 0.83 0.00 0.83 0.00
White 1.44 0.00 1.40 0.00
Black 1.52 0.00 1.50 0.00
Hispanic 0.56 0.00 0.49 0.00
Married 0.86 0.00 0.87 0.00
Risk Level (Reference = Low Risk)
Moderate 1.56 0.00 1.58 0.00
High 1.75 0.00 1.78 0.00
On Probation or Parole 1.04 0.06 1.11 0.00
Offense Type
Drugs 1.10 0.00 1.12 0.00
Violent 0.98 0.62 0.99 0.76
Domestic Violence 0.97 0.33 0.99 0.87
Sex Offense 0.75 0.02 0.79 0.07
Firearm 0.98 0.71 0.96 0.53

W W W. A R N O L D F O U N DAT I O N . O R G The Hidden Costs of Pretrial Detention | 2 1
Theft 1.17 0.00 1.17 0.00
Traffic 0.96 0.06 0.94 0.00
Driving Under the Influence 0.77 0.00 0.81 0.00
Felony 0.83 0.00 0.89 0.00
Incarceration 1.09 0.00 1.14 0.00
Detained Pretrial 1.30 0.00 1.29 0.00
Constant 0.32 0.00 0.59 0.00
N 84,999 71,062
Model X2 3010.15 3056.05
RESEARCH QUESTION 2B
Do the observed effects of pretrial detention differ for sub-populations of defendants (likelihood of 12-month NCA-PD and 24-month NCA-PD)?
Table 7 presents the results of several logistic regression models that estimate the effects of pretrial detention on 12-month NCA-PD, while controlling for age, gender, race, ethnicity, marital status, risk level, supervision status, offense type, offense class, and incarceration history. The results are divided into subgroups as in previous analyses (white, black, male, female, felony, misdemeanor, low risk, moderate risk, and high risk). Pretrial detention was statistically significant and had a positive (increasing) effect on the likelihood of 12-month NCA-PD for all models with the exception of felony defendants.
Similar results were revealed for 24-month NCA-PD (see Table 8). Pretrial detention was a statistically significant and positive (increasing) predictor of 24-month NCA-PD while controlling for all other aforementioned variables. Similar results were observed for all subgroups, with the exception of felony defendants, where pretrial detention was not a significant predictor of 24-month NCA-PD.
Table 7. Parameter Estimates for Logistic Regression Analyses Predicting 12-Month Recidivism
SUBGROUP N ODDS RATIO P LOWER 95% CI UPPER 95% CIWhite 67885 1.32 0.00 1.26 1.38
Black 15817 1.21 0.00 1.10 1.32
Male 62109 1.31 0.00 1.25 1.37
Female 22884 1.25 0.00 1.15 1.36
Felony 14845 1.00 0.95 0.91 1.10
Misdemeanor 59333 1.45 0.00 1.38 1.52
Risk Level
Low 52303 1.27 0.00 1.20 1.35
Moderate 28452 1.32 0.00 1.24 1.40
High 4238 1.33 0.00 1.15 1.54
Table 8. Parameter Estimates for Logistic Regression Analyses
W W W. A R N O L D F O U N DAT I O N . O R G The Hidden Costs of Pretrial Detention | 2 2
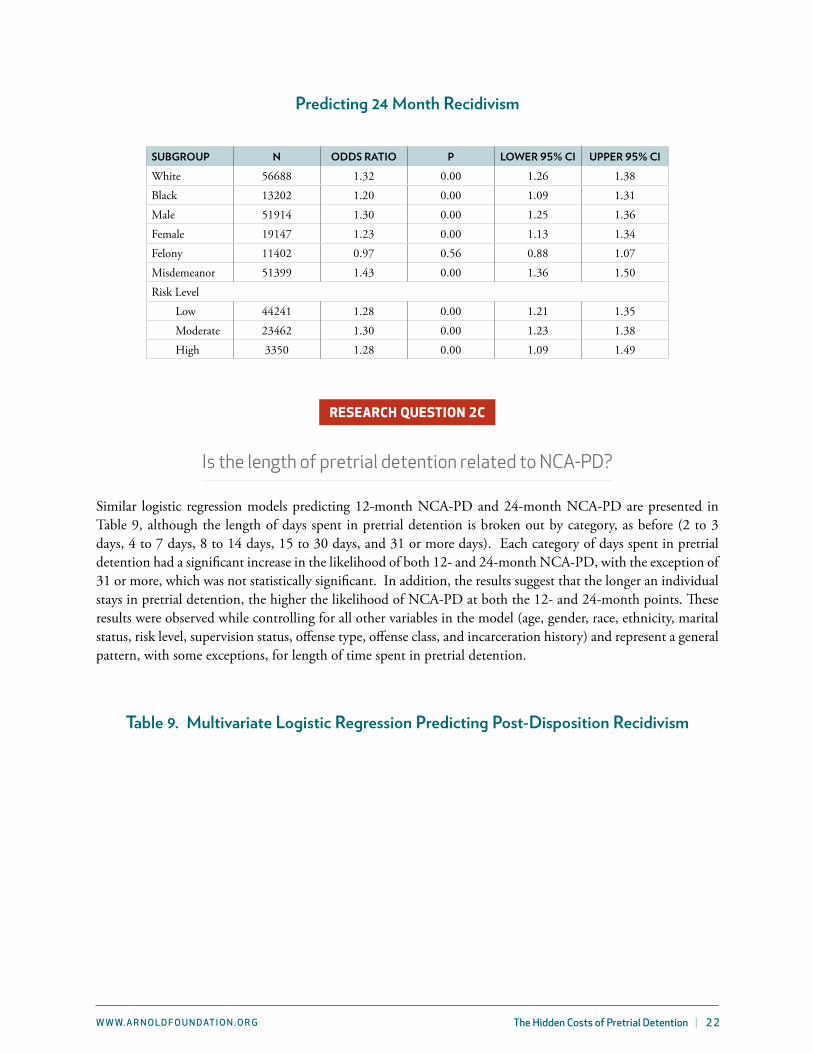
Predicting 24 Month Recidivism
SUBGROUP N ODDS RATIO P LOWER 95% CI UPPER 95% CIWhite 56688 1.32 0.00 1.26 1.38
Black 13202 1.20 0.00 1.09 1.31
Male 51914 1.30 0.00 1.25 1.36
Female 19147 1.23 0.00 1.13 1.34
Felony 11402 0.97 0.56 0.88 1.07
Misdemeanor 51399 1.43 0.00 1.36 1.50
Risk Level
Low 44241 1.28 0.00 1.21 1.35
Moderate 23462 1.30 0.00 1.23 1.38
High 3350 1.28 0.00 1.09 1.49
RESEARCH QUESTION 2C
Is the length of pretrial detention related to NCA-PD?
Similar logistic regression models predicting 12-month NCA-PD and 24-month NCA-PD are presented in Table 9, although the length of days spent in pretrial detention is broken out by category, as before (2 to 3 days, 4 to 7 days, 8 to 14 days, 15 to 30 days, and 31 or more days). Each category of days spent in pretrial detention had a significant increase in the likelihood of both 12- and 24-month NCA-PD, with the exception of 31 or more, which was not statistically significant. In addition, the results suggest that the longer an individual stays in pretrial detention, the higher the likelihood of NCA-PD at both the 12- and 24-month points. These results were observed while controlling for all other variables in the model (age, gender, race, ethnicity, marital status, risk level, supervision status, offense type, offense class, and incarceration history) and represent a general pattern, with some exceptions, for length of time spent in pretrial detention.
Table 9. Multivariate Logistic Regression Predicting Post-Disposition Recidivism

W W W. A R N O L D F O U N DAT I O N . O R G The Hidden Costs of Pretrial Detention | 2 3
12 MONTH NCA-PD
ODDS RATIO
P 24 MONTH NCA-PD
ODDS RATIO
P
Age 0.99 0.00 0.99 0.00
Female 0.82 0.00 0.82 0.00
White 1.44 0.00 1.41 0.00
Black 1.52 0.00 1.51 0.00
Hispanic 0.57 0.00 0.50 0.00
Married 0.86 0.00 0.87 0.00
Risk Level (Reference = Low Risk)
Moderate 1.56 0.00 1.57 0.00
High 1.81 0.00 1.80 0.00
On Probation or Parole 1.06 0.02 1.11 0.00
Offense Type
Drugs 1.09 0.00 1.11 0.00
Violent 0.97 0.48 0.98 0.56
Domestic Violence 0.94 0.06 0.96 0.28
Sex Offense 0.76 0.03 0.79 0.06
Firearm 0.97 0.64 0.95 0.37
Theft 1.16 0.00 1.16 0.00
Traffic 0.96 0.06 0.94 0.00
Driving Under the Influence 0.76 0.00 0.81 0.00
Felony 0.81 0.00 0.86 0.00
Incarceration 1.11 0.00 1.16 0.00
Days in Spent Detention (Reference = 1 day)
2 to 3 Days 1.15 0.00 1.16 0.00
4 to 7 Days 1.31 0.00 1.31 0.00
8 to 14 Days 1.41 0.00 1.42 0.00
15 to 30 Days 1.36 0.00 1.37 0.00
31 or more Days 0.96 0.25 1.06 0.10
Constant 0.30 0.00 0.55 0.00
N 84,443 70,565
Model X2 3056.05 3402.06
RESEARCH QUESTION 2D.

W W W. A R N O L D F O U N DAT I O N . O R G The Hidden Costs of Pretrial Detention | 2 4
Do the observed effects of the length of pretrial detention differ for sub-populations of defendants (likelihood of 12-month NCA-PD and
24-month NCA-PD)?
Table 10 presents the results for several logistic regression models predicting the likelihood of 12-month NCA-PD. The results are divided by defendant subgroup (race, gender, offense level and risk type). In addition, the effects of each amount of time are presented categorically (e.g., 2 to 3 days, 4 to 7 days, and so on).
In general, it appears that the longer a defendant spends in pretrial detention, the more likely 12-month NCA-PD is to occur. For white defendants, each category of days in pretrial detention was statistically significant when predicting 12-month NCA-PD, with the exception of 31 or more days. For black defendants, a similar pattern was observed, but the lowest length of pretrial detention (2 to 3 days) approached, but did not reach, statistical significance.
Male and female defendants were nearly identical in that each category of days spent in pretrial detention, except 31 or more days, was statistically significant and positive (increasing) in predicting the likelihood of 12-month NCA-PD.
For felony defendants, only the categories of 4 to 7 days and 8 to 14 days reached statistical significance when predicting 12-month NCA-PD. Both categories had an increasing effect on the likelihood of 12-month NCA-PD while all other categories were not significantly predictive.
For misdemeanor defendants, each category of days spent in pretrial detention, with the exception of 31 or more days, revealed statistically significant and positive (increasing) effects on the likelihood of 12-month NCA-PD.
When low-risk defendants were isolated, each category of days spent in pretrial detention, with the exception of 31or more days, revealed a statistically significant and positive (increasing) effect on the likelihood of 12-month NCA-PD.
When moderate-risk defendants were isolated, the lowest length of pretrial detention lost significance. Further, while the ensuing lengths of pretrial detention (4 to 7 days, 8 to 14 days, 15 to 30 days) revealed a statistically significant and increasing likelihood of 12-month NCA-PD, the final category (31 or more days) reversed the previously established trend. Those detained 31 or more days were significantly less likely to have 12-month NCA-PD.
For high-risk defendants, none of the categories of days spent in pretrial detention were predictive of 12-month NCA-PD, except for the category of 31 or more days. Defendants who were detained for 31 or more days had a significantly lower likelihood of 12-month NCA-PD.
Table 11 presents similar results to those that were presented in Table 10, although the outcome variable was NCA-PD at the 24-month point.
For white, black, female and male defendants, each category of days spent in detention, except 31 or more days, was associated with a significant increase in the likelihood that NCA-PD will occur at the 24-month point. In addition, it appears that generally the strength of the relationship may increase with each increase in the amount of time spent in pretrial detention.

W W W. A R N O L D F O U N DAT I O N . O R G The Hidden Costs of Pretrial Detention | 2 5
For felony defendants, the middle three categories (4 to 7 days, 8 to 14 days, and 15 to 30 days) were statistically related to 24-month NCA-PD. Each of these three time categories was associated with a significant increase in the likelihood of-24 month NCA-PD.
The same pattern that was observed above for white, black, male and female defendants was also revealed for misdemeanor defendants, with each category of days spent in pretrial detention, except 31 or more days, being associated with a significant increase in the likelihood of 24-month NCA-PD. Likewise, the strength of the relationship may increase with each increase in the amount of time.
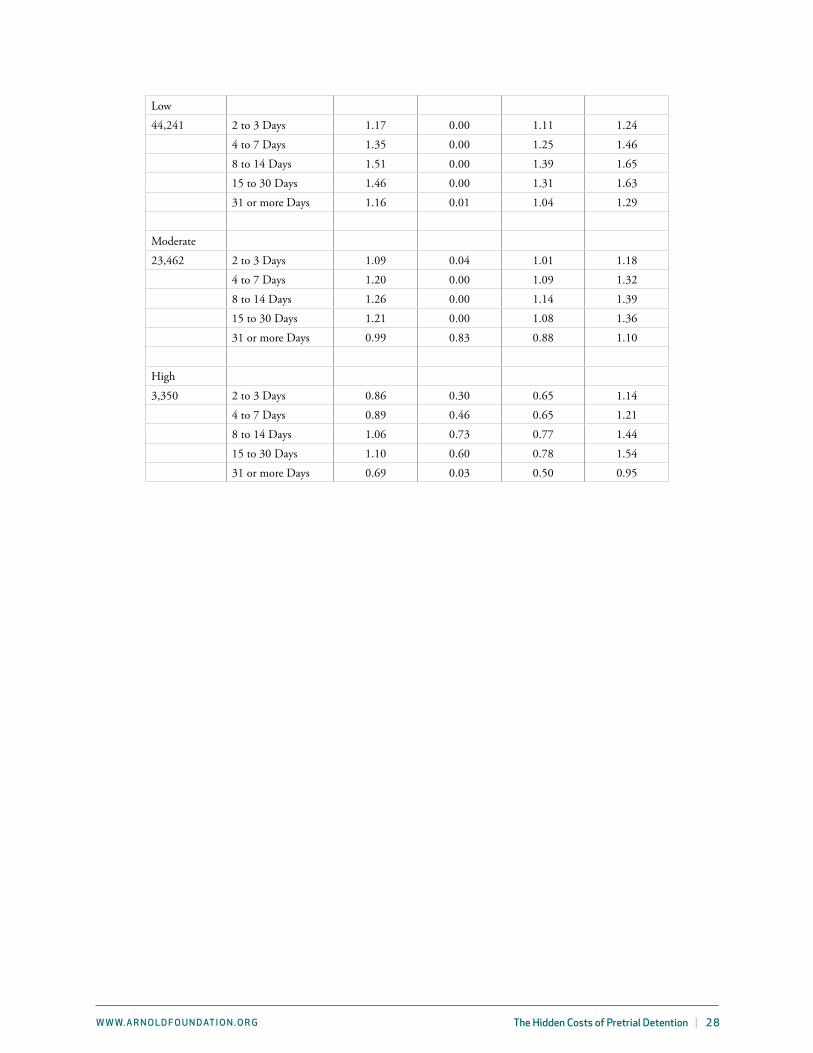
For low-risk defendants, each category of days spent in detention was associated with a significant increase in the likelihood of 24-month NCA-PD. The strength of the relationship appears to increase with each increase in the amount of pretrial detention time but drops at 31 days or more.
For moderate-risk defendants, all categories of days spent in detention pretrial, except 31 or more, was associated with a significant increase in the likelihood of 24-month NCA-PD. As was observed in several examples before, the strength of the relationship generally appears to increase as the amount of time spent in pretrial detention increases.
For high-risk defendants, only 31 or more days spent in detention pretrial was significantly associated with 24-month NCA-PD, and the relationship was negative. In other words, defendants who spent 31 or more days in pretrial detention had a statistically significant reduction in the likelihood of NCA-PD at the 24-month point.
Table 10. Parameter Estimates for Logistic Regression Analyses Predicting 12 Month Recidivism
SUBGROUP
DAYS IN SPENT DETENTION (REFERENCE = 1 DAY)
ODDS RATIO P LOWER 95% CI UPPER 95% CI
White
67,885 2 to 3 Days 1.16 0.00 1.11 1.22
4 to 7 Days 1.33 0.00 1.25 1.43
8 to 14 Days 1.42 0.00 1.32 1.52
15 to 30 Days 1.38 0.00 1.27 1.50
31 or more Days 0.97 0.50 0.90 1.05
Black
15,817 2 to 3 Days 1.09 0.07 0.99 1.21
4 to 7 Days 1.19 0.02 1.02 1.37
8 to 14 Days 1.31 0.00 1.15 1.50
15 to 30 Days 1.21 0.03 1.02 1.43
31 or more Days 0.86 0.06 0.74 1.01
Male
62,109 2 to 3 Days 1.15 0.00 1.09 1.21
4 to 7 Days 1.31 0.00 1.22 1.40

W W W. A R N O L D F O U N DAT I O N . O R G The Hidden Costs of Pretrial Detention | 2 6
8 to 14 Days 1.45 0.00 1.35 1.56
15 to 30 Days 1.39 0.00 1.27 1.51
31 or more Days 0.97 0.44 0.90 1.05
Female
22,884 2 to 3 Days 1.16 0.00 1.07 1.26
4 to 7 Days 1.29 0.00 1.15 1.46
8 to 14 Days 1.27 0.00 1.12 1.45
15 to 30 Days 1.26 0.01 1.07 1.48
31 or more Days 0.92 0.29 0.80 1.07
Felony
14,845 2 to 3 Days 1.10 0.18 0.96 1.27
4 to 7 Days 1.24 0.01 1.05 1.46
8 to 14 Days 1.40 0.00 1.20 1.62
15 to 30 Days 1.16 0.10 0.97 1.38
31 or more Days 0.97 0.67 0.83 1.13
Misdemeanor
59,333 2 to 3 Days 1.15 0.00 1.10 1.21
4 to 7 Days 1.31 0.00 1.22 1.40
8 to 14 Days 1.44 0.00 1.32 1.56
15 to 30 Days 1.36 0.00 1.24 1.50
31 or more Days 0.94 0.23 0.85 1.04
Low
52,303 2 to 3 Days 1.16 0.00 1.10 1.23
4 to 7 Days 1.32 0.00 1.21 1.43
8 to 14 Days 1.45 0.00 1.33 1.59
15 to 30 Days 1.43 0.00 1.28 1.61
31 or more Days 1.09 0.11 0.98 1.21
Moderate
28,452 2 to 3 Days 1.07 0.10 0.99 1.15
4 to 7 Days 1.21 0.00 1.10 1.34
8 to 14 Days 1.28 0.00 1.16 1.41
15 to 30 Days 1.23 0.00 1.10 1.38
31 or more Days 0.88 0.02 0.79 0.98
High
4,238 2 to 3 Days 0.96 0.78 0.74 1.25
4 to 7 Days 1.04 0.79 0.78 1.39
8 to 14 Days 1.21 0.19 0.91 1.61
15 to 30 Days 1.18 0.31 0.86 1.61
31 or more Days 0.68 0.01 0.51 0.91
Table 11. Parameter Estimates for Logistic Regression Analyses Predicting 24 Month Recidivism

W W W. A R N O L D F O U N DAT I O N . O R G The Hidden Costs of Pretrial Detention | 2 7
SUBGROUP DAYS SPENT IN DETENTION (Reference = 1 day)
ODDS RATIO P LOWER 95% CI
UPPER 95% CI
White
56,688 2 to 3 Days 1.17 0.00 1.12 1.23
4 to 7 Days 1.35 0.00 1.26 1.44
8 to 14 Days 1.45 0.00 1.35 1.55
15 to 30 Days 1.40 0.00 1.29 1.53
31 or more Days 1.06 0.17 0.98 1.15
Black
13,202 2 to 3 Days 1.12 0.02 1.02 1.23
4 to 7 Days 1.16 0.04 1.00 1.35
8 to 14 Days 1.28 0.00 1.12 1.46
15 to 30 Days 1.21 0.03 1.02 1.43
31 or more Days 1.04 0.62 0.89 1.22
Male
51,914 2 to 3 Days 1.15 0.00 1.10 1.21
4 to 7 Days 1.30 0.00 1.22 1.39
8 to 14 Days 1.42 0.00 1.32 1.52
15 to 30 Days 1.39 0.00 1.28 1.52
31 or more Days 1.07 0.10 0.99 1.16
Female
19,147 2 to 3 Days 1.19 0.00 1.10 1.29
4 to 7 Days 1.33 0.00 1.18 1.49
8 to 14 Days 1.40 0.00 1.23 1.58
15 to 30 Days 1.25 0.01 1.07 1.47
31 or more Days 1.03 0.72 0.88 1.20
Felony
11,402 2 to 3 Days 1.11 0.14 0.97 1.28
4 to 7 Days 1.28 0.00 1.09 1.51
8 to 14 Days 1.42 0.00 1.22 1.64
15 to 30 Days 1.26 0.01 1.06 1.50
31 or more Days 1.11 0.19 0.95 1.30
Misdemeanor
51,399 2 to 3 Days 1.16 0.00 1.11 1.21
4 to 7 Days 1.30 0.00 1.21 1.39
8 to 14 Days 1.46 0.00 1.34 1.58
15 to 30 Days 1.36 0.00 1.23 1.49
31 or more Days 1.05 0.33 0.95 1.17
W W W. A R N O L D F O U N DAT I O N . O R G The Hidden Costs of Pretrial Detention | 2 8
Low
44,241 2 to 3 Days 1.17 0.00 1.11 1.24
4 to 7 Days 1.35 0.00 1.25 1.46
8 to 14 Days 1.51 0.00 1.39 1.65
15 to 30 Days 1.46 0.00 1.31 1.63
31 or more Days 1.16 0.01 1.04 1.29
Moderate
23,462 2 to 3 Days 1.09 0.04 1.01 1.18
4 to 7 Days 1.20 0.00 1.09 1.32
8 to 14 Days 1.26 0.00 1.14 1.39
15 to 30 Days 1.21 0.00 1.08 1.36
31 or more Days 0.99 0.83 0.88 1.10
High
3,350 2 to 3 Days 0.86 0.30 0.65 1.14
4 to 7 Days 0.89 0.46 0.65 1.21
8 to 14 Days 1.06 0.73 0.77 1.44
15 to 30 Days 1.10 0.60 0.78 1.54
31 or more Days 0.69 0.03 0.50 0.95
APPENDIX
Appendix A: Table A-1
PRETRIAL NCA-PD 12 NCA-PD 24JAIL BY COUNTY N % N % N %
ADAIR 588 0.52 638 0.45 525 0.43
ALLEN 475 0.42 515 0.36 368 0.3
BALLARD 282 0.25 346 0.24 299 0.25
BARREN 1,595 1.42 1,787 1.25 1,383 1.14
BELL 1,253 1.12 1,376 0.97 1,117 0.92
BOONE 3,219 2.87 3,608 2.53 3,198 2.64
BOURBON 508 0.45 683 0.48 560 0.46
BOYD 1,388 1.24 2,132 1.5 1,929 1.59
BOYLE 1,080 0.96 1,474 1.03 1,269 1.05
BRECKINRIDGE 439 0.39 498 0.35 398 0.33
BULLITT 1,698 1.52 1,792 1.26 1,307 1.08
BUTLER 259 0.23 249 0.17 213 0.18
CALDWELL 410 0.37 479 0.34 393 0.32
CALLOWAY 608 0.54 749 0.53 666 0.55
CAMPBELL 1,993 1.78 2,756 1.93 2,535 2.09
CARROLL 1,371 1.22 1,625 1.14 1,358 1.12
CARTER 783 0.7 941 0.66 757 0.62
CASEY 398 0.36 456 0.32 394 0.32
CHRISTIAN 2,314 2.07 3,399 2.38 2,838 2.34
CLARK 746 0.67 1,195 0.84 1,051 0.87
CLAY 633 0.57 1,003 0.7 902 0.74
CLINTON 210 0.19 224 0.16 169 0.14
CRITTENDEN 183 0.16 251 0.18 201 0.17
DAVIESS 2,703 2.41 3,266 2.29 2,874 2.37
ESTILL 296 0.26 390 0.27 324 0.27
FAYETTE 6,971 6.22 10,868 7.62 9,901 8.16
FLOYD 1,079 0.96 1,541 1.08 1,270 1.05
FRANKLIN 1,661 1.48 2,077 1.46 1,753 1.45
FULTON 325 0.29 415 0.29 359 0.3
GRANT 739 0.66 928 0.65 799 0.66
GRAVES 1,201 1.07 1,434 1.01 1,172 0.97
GRAYSON 777 0.69 858 0.6 676 0.56
GREENUP 462 0.41 796 0.56 694 0.57
HARDIN 2,335 2.08 2,887 2.02 2,560 2.11
HARLAN 1,305 1.16 1,618 1.13 1,344 1.11
HART 390 0.35 520 0.36 417 0.34
HENDERSON 1,341 1.2 2,067 1.45 1,900 1.57
HICKMAN 113 0.1 145 0.1 125 0.1
HOPKINS 1,456 1.3 1,901 1.33 1,686 1.39
JACKSON 263 0.23 371 0.26 316 0.26
JEFFERSON 22,189 19.81 27,095 19 22,910 18.89
JESSAMINE 1,449 1.29 1,937 1.36 1,652 1.36
JOHNSON 2,896 2.59 3,287 2.31 2,722 2.24
KENTON 5,015 4.48 6,540 4.59 5,929 4.89
KNOX 1,019 0.91 1,319 0.93 1,184 0.98
LARUE 212 0.19 293 0.21 241 0.2
LAUREL 1,637 1.46 2,270 1.59 1,976 1.63
LEE 923 0.82 1,210 0.85 986 0.81
LESLIE 274 0.24 357 0.25 301 0.25
LETCHER 715 0.64 788 0.55 652 0.54
LEWIS 185 0.17 248 0.17 203 0.17
LINCOLN 638 0.57 852 0.6 721 0.59
LOGAN 604 0.54 818 0.57 720 0.59
MADISON 1,804 1.61 2,405 1.69 2,145 1.77
MARION 709 0.63 878 0.62 722 0.6
MARSHALL 619 0.55 671 0.47 585 0.48
MASON 1,033 0.92 1,198 0.84 972 0.8
MCCRACKEN 1,933 1.73 2,606 1.83 2,333 1.92
MCCREARY 501 0.45 612 0.43 497 0.41
MEADE 445 0.4 529 0.37 422 0.35
MONROE 220 0.2 258 0.18 214 0.18
MONTGOMERY 1,136 1.01 1,382 0.97 1,106 0.91
MUHLENBERG 605 0.54 816 0.57 678 0.56
NELSON 826 0.74 955 0.67 821 0.68
OHIO 635 0.57 703 0.49 606 0.5
OLDHAM 805 0.72 872 0.61 713 0.59
PERRY 1,147 1.02 1,420 1 1,062 0.88
PIKE 2,328 2.08 2,599 1.82 2,054 1.69
POWELL 400 0.36 640 0.45 558 0.46
PULASKI 1,605 1.43 2,056 1.44 1,693 1.4
ROCKCASTLE 584 0.52 806 0.57 664 0.55
ROWAN 1,111 0.99 1,310 0.92 1,055 0.87
RUSSELL 407 0.36 404 0.28 338 0.28
SCOTT 725 0.65 951 0.67 798 0.66
SHELBY 1,401 1.25 1,680 1.18 1,356 1.12
SIMPSON 540 0.48 619 0.43 450 0.37
TAYLOR 779 0.7 958 0.67 833 0.69

TODD 203 0.18 300 0.21 278 0.23
UNION 374 0.33 506 0.35 439 0.36
WARREN 3,293 2.94 4,334 3.04 3,417 2.82
WAYNE 373 0.33 424 0.3 320 0.26
WEBSTER 324 0.29 369 0.26 297 0.24
WHITLEY 1,223 1.09 1,570 1.1 1,242 1.02
WOODFORD 336 0.3 468 0.33 435 0.36
Appendix B: References
Ares, C.E., Rankin, A. & Sturz, H. (1963). The Manhattan Bail Project: An interim report on the use of pre-
trial parole. 38 New York University Law Review. 67-92.
Beeley, A. (1927). The Bail System in Chicago. Chicago: University of Chicago Press. (Reprinted, 1966).
Cadigan, T. P., & Lowenkamp, C. T. (2011). Implementing risk assessment in the federal pretrial services system. Federal Probation, 75 (2), 30-34.
Foote, C. (1954). Compelling appearance in court: Administration of bail in Philadelphia. 102 University of Pennsylvania Law Review 1031-1079.
Foote, C. (1958). A study of the administration of bail in New York City. 106 University of Pennsylvania Law Review.
Freed, D.J. & Wald, P.M. (1964). Bail in the United States. Working paper for the National Conference on Bail and Criminal Justice.
Frase, R. (2009) What explains persistent racial disproportionality in Minnesota’s prison and jail populations? Crime and Justice: A Review of Research, 38:201-280.
Leipold, A.D. (2005). How the pretrial process contributes to wrongful convictions. The American Criminal Law Review, 42(4):1123-1165.
Schlesinger, T. (2005). Racial and ethnic disparity in pretrial criminal processing. Justice Quarterly, 22(2):170-192.
Schlesinger, T. (2007). The cumulative effects of racial disparities in criminal processing. Journal of the Institute of Justice & International Studies, 7:261-278.
Ulmer, J. T. 2012 Recent Developments and New Directions in Sentencing Research. Justice Quarterly, 29(1):1-40.
Wice, P.B. (1974). Freedom for Sale: A national study of pretrial release. Lanham, MD: Lexington Books.
Wooldredge, J. (2012). Distinguishing race effects on pre-trial release and sentencing decisions. Justice Quarterly, 29(1):41-75.