The Hidden Costs of Energy: Coal Electricity …...India v. the United States • In the US, health...
21
The Hidden Costs of Energy: Coal Electricity Generation in the US and India Maureen Cropper, University of Maryland and Resources for the Future (RFF) Sarath Guttikunda, Urban Emissions Info., Delhi Nicholas Z. Muller, Middlebury College and NBER 1
Transcript of The Hidden Costs of Energy: Coal Electricity …...India v. the United States • In the US, health...

The Hidden Costs of Energy: Coal Electricity Generation in the US and India
Maureen Cropper, University of Maryland and
Resources for the Future (RFF) Sarath Guttikunda, Urban Emissions Info., Delhi
Nicholas Z. Muller, Middlebury College and NBER
1
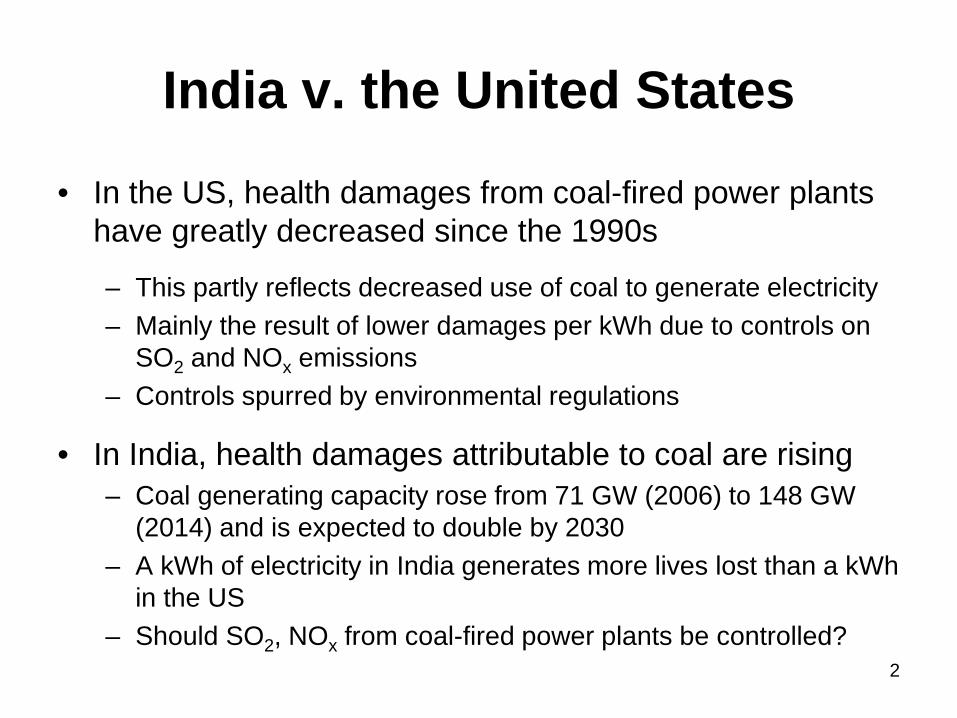
India v. the United States
• In the US, health damages from coal-fired power plants have greatly decreased since the 1990s
– This partly reflects decreased use of coal to generate electricity – Mainly the result of lower damages per kWh due to controls on
SO2 and NOx emissions – Controls spurred by environmental regulations
• In India, health damages attributable to coal are rising – Coal generating capacity rose from 71 GW (2006) to 148 GW
(2014) and is expected to double by 2030 – A kWh of electricity in India generates more lives lost than a kWh
in the US – Should SO2, NOx from coal-fired power plants be controlled?
2
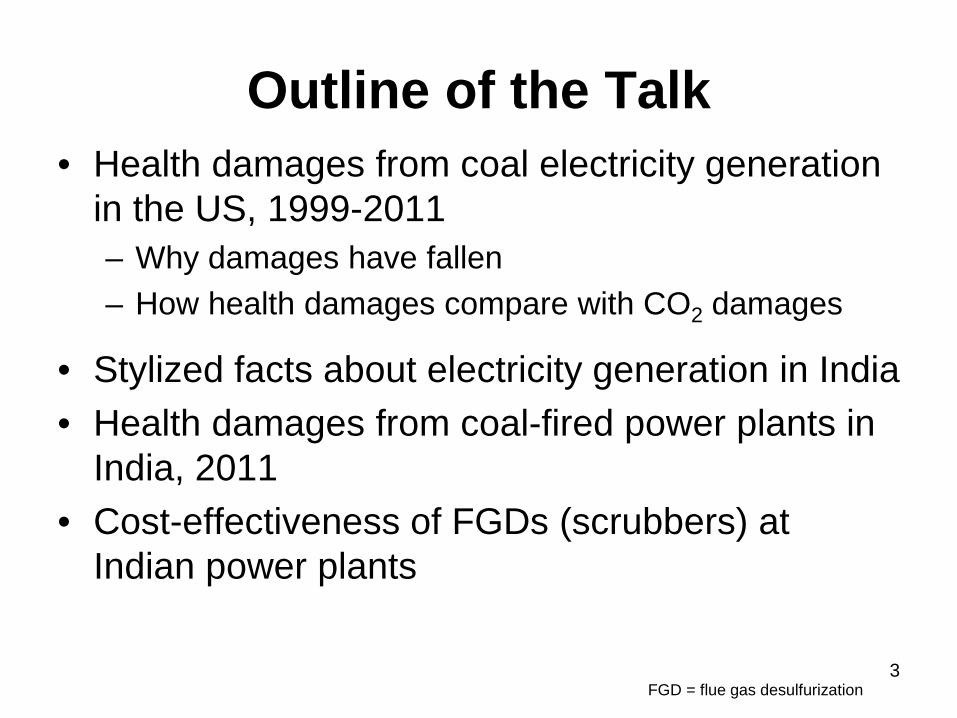
Outline of the Talk • Health damages from coal electricity generation
in the US, 1999-2011 – Why damages have fallen – How health damages compare with CO2 damages
• Stylized facts about electricity generation in India • Health damages from coal-fired power plants in
India, 2011 • Cost-effectiveness of FGDs (scrubbers) at
Indian power plants
3 FGD = flue gas desulfurization

Measuring Health Damages – Bottom-up approach using emissions by plant
• Emissions of PM2.5, SO2, NOx, VOC, NH3
– Estimate impact of emissions on ambient PM2.5
• Allowing for secondary particle formation – Dose-response functions translate change in
ambient PM2.5 into damages • Morbidity (chronic bronchitis), premature mortality
– Value health endpoints • Mortality typically dominates value of damages
4

Measurement of Damages in US – AP2 Model used (Muller, Science 2014) – Source of emissions is National Emissions
Inventory – Source-receptor matrix allows conversion of
SO2, NOx to PM2.5 – Premature mortality based on Pope et al.
(2002) – Lives valued using a $6 million Value of a
Statistical Life (VSL) – Change in damages primarily reflects change
in emissions/kWh over time 5
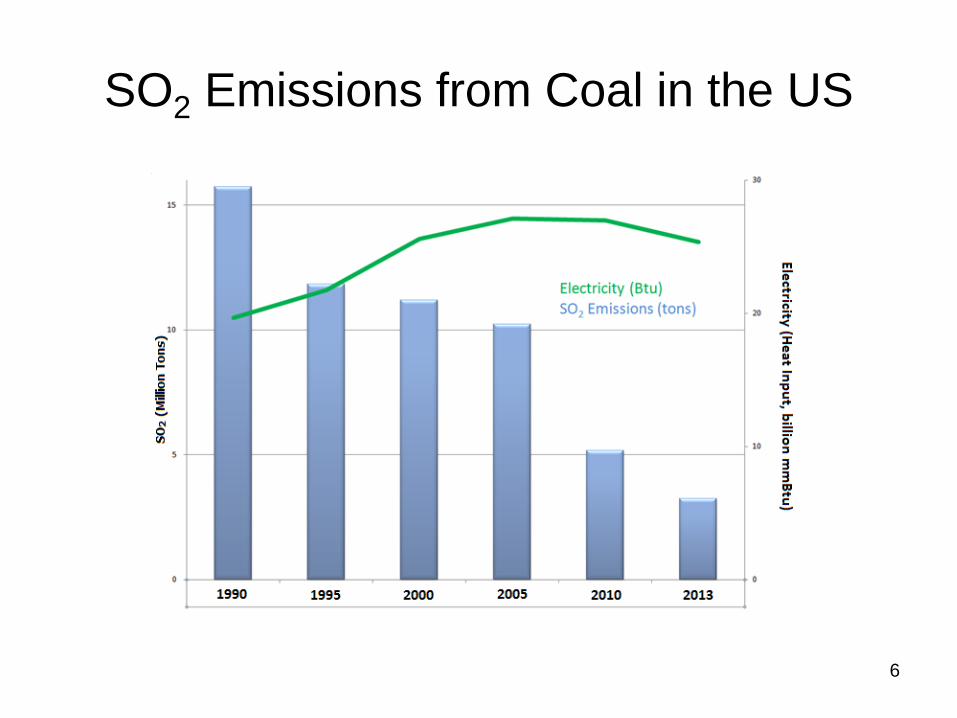
SO2 Emissions from Coal in the US
6
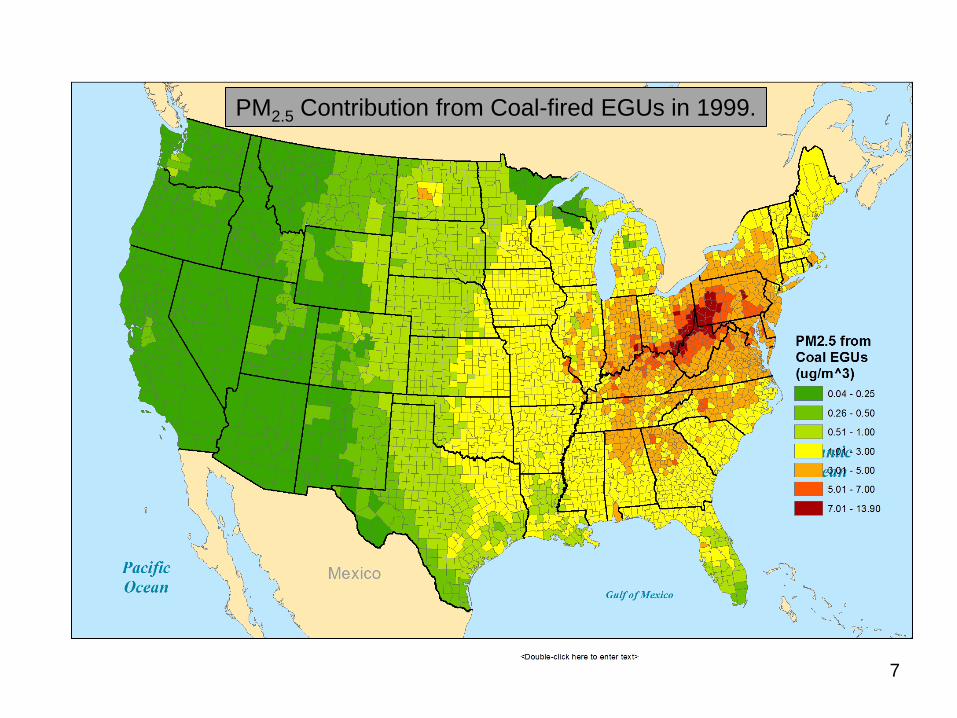
PM2.5 Contribution from Coal-fired EGUs in 1999.
7

PM2.5 Contribution from Coal-fired EGUs in 2011.
8 EGU = energy generating unit

Health Damages from Coal in the US 1999-2011
– Premature deaths attributable to coal plants fall from 27,000 (1999) to 9,470 (2011)
• Reduction of 65% – Deaths per kWh fall by 60% – This due primarily to reductions in SO2
emissions • NOx impacts 2 orders of magnitude smaller than
SO2 – Value of health damages 2011 = $68.4 billion
(2007$) – 3.4 cents/kWh 9
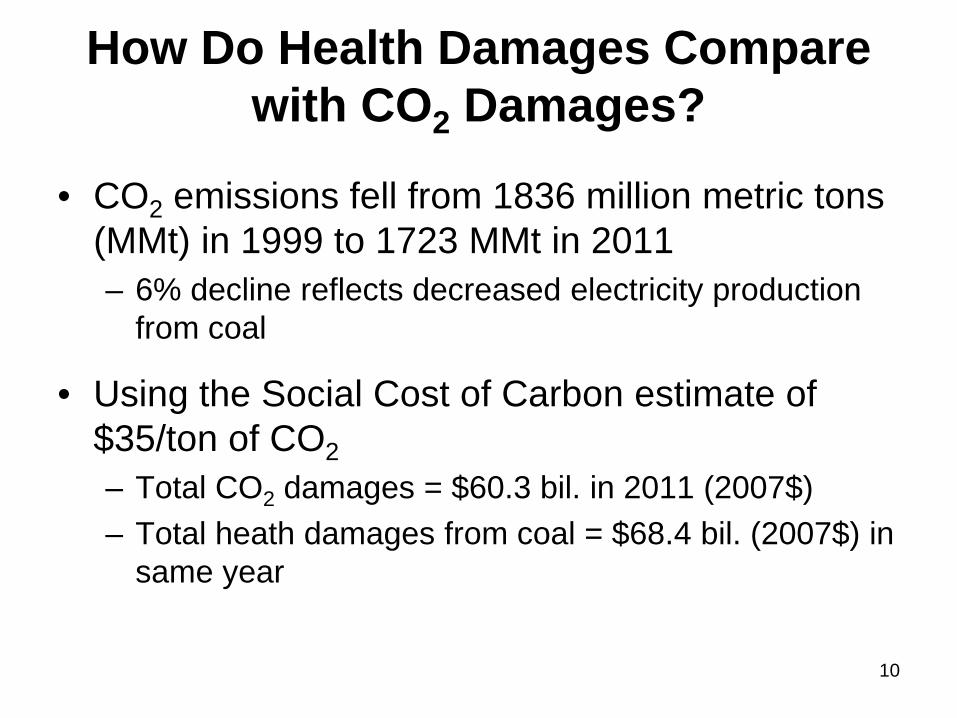
How Do Health Damages Compare with CO2 Damages?
• CO2 emissions fell from 1836 million metric tons
(MMt) in 1999 to 1723 MMt in 2011 – 6% decline reflects decreased electricity production
from coal
• Using the Social Cost of Carbon estimate of $35/ton of CO2 – Total CO2 damages = $60.3 bil. in 2011 (2007$) – Total heath damages from coal = $68.4 bil. (2007$) in
same year
10

Installed Capacity in India, 1947-2014
11

Coal-fired thermal power plants
Atmospheric Environment (2014)
2011-12 Operational 111 plants 80,000 to 115,000 premature deaths GBD study estimate - 695,000 deaths from all sources in 2010

Coal-Fired Power Plants in India
• Generate about 70% of electricity in India
• Coal burned per kWh 60% greater than in US
• Ash content of coal = 30-50%; Sulfur content = 0.5% by weight
• Plants have electrostatic precipitators (ESPs) to remove PM, although ash content affects their efficiency
• No limits on SO2 emissions, but – Minimum stack height requirements – EGUs over 500 MW must leave space for a scrubber
13

Impact of Coal Plant Emissions on Ambient Air Quality in India
• Coal-fired power plants in India emitted about 4.6 million tons of SO2 in 2010-11
• Net generation about 0.620 Trillion kWh (cf. 1.733 Trillion kWh in the US in 2011, with ~ equal tons SO2 – Emission rate in India per kWh over twice as high as the US – Reflects lack of pollution controls; more coal burned per kWh
• PM2.5 emissions/kWh also higher in India: 2 lbs/MWh v. 0.5 lbs/MWh in the US (2005)
• Applying CAMx to emissions from coal plants in India yields an estimated change in annual average PM2.5 of 3.6 µg/m³ (population-weighted) 14
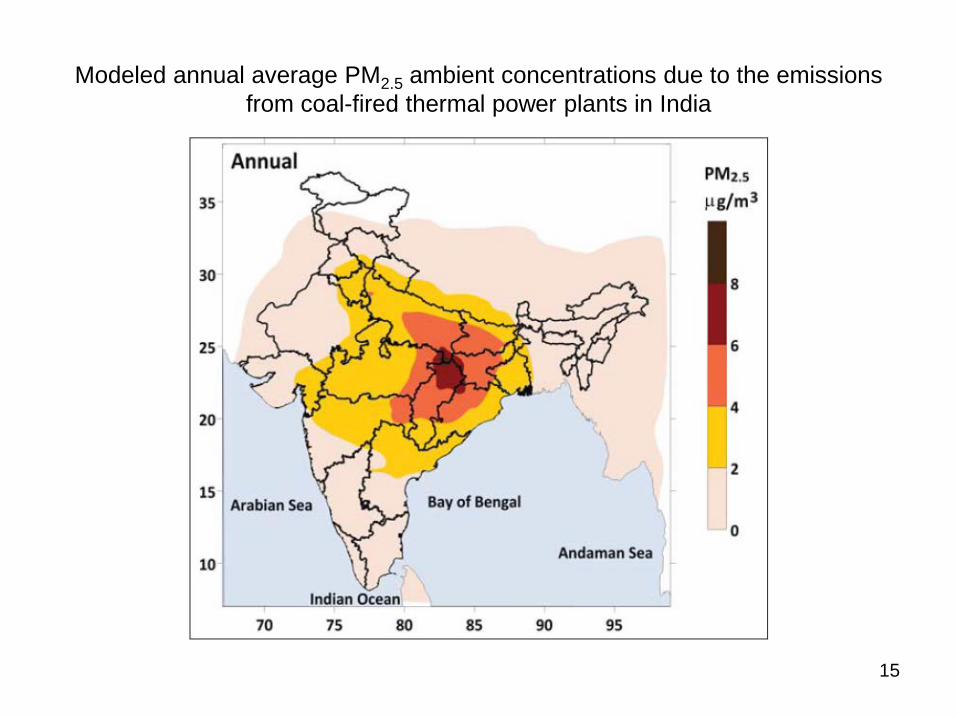
Modeled annual average PM2.5 ambient concentrations due to the emissions from coal-fired thermal power plants in India
15

Health Impacts of Coal-Fired Power Plants in India
• Power plant emissions associated with 80,000 deaths per year – Estimate based on transferring Pope et al. (2002) to India – Can be compared with 10,000 deaths associated with coal-fired
power plants in the US in 2011
• What accounts for the difference? – Exposed population is much higher in India – Annual average change in PM2.5 from coal-fired power plants is
4X greater than in the US (3.6 v. 0.85 μg/m³)
• Note that this ignores morbidity impacts, mortality under age 30
16

Policy Issues
• Should India place more stringent controls on emissions from coal-fired power plants?
• Currently: No emissions limits on SO2 or NOx from coal-fired power plants
• Should flue gas desulfurization units (FGDs) be required?
• Should regulations on coal washing be strengthened? – Ash content of coal must be ≤ 34% in sensitive and critically
polluted areas – Only 5% of domestic coal was washed in 2007 – 25% of plants violated PM standards in 2008 (self-reported)
17

Is Retrofitting FGDs Cost-Effective?
• Malik (2013) investigates cost per life saved of retrofitting 72 coal-fired power plants with FGDs – Lagrangian plume model used to estimate impact on
ambient air quality – Pope et al. (2002) used to estimate mortality impacts
• Cost per life saved by installing a scrubber – On average, 6 million Rs. (95,000 USD) – Cost ranges from 1.6 to 32 million Rs. per life saved – VSL for India (transferred from US) = 7.5 million Rs.
• Scrubber raises electricity costs per kWh by about 5%
18

30 Coal-fired Power Plants with Highest Sulfate Deaths
19

India v. the United States
• In the US, health damages from coal-fired power plants have greatly decreased since the 1990s
– This partly reflects decreased use of coal to generate electricity – Mainly the result of lower damages per kWh due to controls on
SO2 and NOx emissions – Controls spurred by environmental regulations
• In India, health damages attributable to coal are rising – Coal generating capacity rose from 71 GW (2006) to 148 GW
(2014) and is expected to double by 2030 – A kWh of electricity in India generates more lives lost than a kWh
in the US – Should SO2, NOx from coal-fired power plants be controlled?
20

Concluding Remarks
• Health benefits of controlling emissions from coal-fired power plants are clear – In the US, controls on SO2 clearly pass the benefit-
cost test – In India they do at power plants with large exposed
populations • Strengthening environmental regulations in
India likely to take time – Supreme Court has forced installation of 3 FGDs – But need greater appreciation of health impacts
21