The Heterogeneity and Metastability of Multipotent Hematopoietic Cells
115
University of Miami Scholarly Repository Open Access Dissertations Electronic eses and Dissertations 2013-07-19 e Heterogeneity and Metastability of Multipotent Hematopoietic Cells Wendy W. Weston University of Miami, [email protected] Follow this and additional works at: hps://scholarlyrepository.miami.edu/oa_dissertations is Open access is brought to you for free and open access by the Electronic eses and Dissertations at Scholarly Repository. It has been accepted for inclusion in Open Access Dissertations by an authorized administrator of Scholarly Repository. For more information, please contact [email protected]. Recommended Citation Weston, Wendy W., "e Heterogeneity and Metastability of Multipotent Hematopoietic Cells" (2013). Open Access Dissertations. 1079. hps://scholarlyrepository.miami.edu/oa_dissertations/1079
Transcript of The Heterogeneity and Metastability of Multipotent Hematopoietic Cells

University of MiamiScholarly Repository
Open Access Dissertations Electronic Theses and Dissertations
2013-07-19
The Heterogeneity and Metastability ofMultipotent Hematopoietic CellsWendy W. WestonUniversity of Miami, [email protected]
Follow this and additional works at: https://scholarlyrepository.miami.edu/oa_dissertations
This Open access is brought to you for free and open access by the Electronic Theses and Dissertations at Scholarly Repository. It has been accepted forinclusion in Open Access Dissertations by an authorized administrator of Scholarly Repository. For more information, please [email protected].
Recommended CitationWeston, Wendy W., "The Heterogeneity and Metastability of Multipotent Hematopoietic Cells" (2013). Open Access Dissertations.1079.https://scholarlyrepository.miami.edu/oa_dissertations/1079

UNIVERSITY OF MIAMI
THE HETEROGENEITY AND METASTABILITY OF MULTIPOTENT HEMATOPOIETIC CELLS
By
Wendy W. Weston
A DISSERTATION
Submitted to the Faculty of the University of Miami
in partial fulfillment of the requirements for the degree of Doctor of Philosophy
Coral Gables, Florida
August 2013

©2013 Wendy W. Weston All Rights Reserved

UNIVERSITY OF MIAMI
A dissertation submitted in partial fulfillment of the requirements for the degree of
Doctor of Philosophy
THE HETEROGENEITY AND METASTABILITY OF MULTIPOTENT HEMATOPOIETIC CELLS
Wendy W. Weston Approved: ________________ _________________ Roland Jurecic, Ph.D. M. Brian Blake, Ph.D. Associate Professor of Dean of the Graduate School Microbiology and Immunology and Cell Biology ________________ _________________ Nevis Fregien, Ph.D. Mike Xu, Ph.D. Associate Professor of Cell Biology Professor of Cell Biology ________________ Robert Levy, Ph.D. Professor of Microbiology and Immunology

WESTON, WENDY W. (Ph.D., Molecular Cell and Developmental Biology) The Heterogeneity and Metastability of (August 2013) Multipotent Hematopoietic Cells Abstract of a dissertation at the University of Miami. Dissertation supervised by Associate Professor Roland Jurecic. No. of pages in text. (101)
Increasing numbers of studies are reporting phenotypic and functional
heterogeneity within a variety of stem cell types as well as the existence of inter-
convertible subsets within hematopoietic stem cells (HSCs), suggesting that
these cells are alternating between several metastable states. The extent of
heterogeneity and metastability in HSCs remains to be explored in depth. The
metastability of HSCs is most likely positively and negatively regulated by
currently unknown cell intrinsic and extrinsic mechanisms emanating from HSC
niches. But the regulation of HSC metastability by bone marrow (BM) niche cells
is not currently understood.
Numerous studies have shown that phenotypic, functional and molecular
features of EML cells closely resemble or are identical to the features of adult
HSCs and multipotent hematopoietic progenitors (MPPs). Thus, EML cells
represent the closest known in vitro counterpart of HSC/MPPs.
This investigation sought to analyze in depth the heterogeneity and
metastability of the EML cell line, as well as investigate the effect of BM niche
cells on their metastability. Our data illustrate that EML cells are very

heterogeneous and consist of several cell subsets with distinct expression of
HSC markers, cell cycle profile and capacity to differentiate. Remarkably, each
cell subset has the capacity to self-renew, as well as to produce other subsets
and restore the parental EML cell population. Our findings show that EML cells
oscillate between several inter-convertible metastable states with distinct
phenotypic and functional features. Equally important, our in depth studies have
also found that the metastability of EML cell line is homeostatically maintained
and tightly regulated by currently unidentified cell intrinsic mechanisms.
We therefore sought to investigate whether bone marrow (BM) niche cells will
affect the metastability of EML cells in a co-culture environment. Our results
indicate that mesenchymal and osteoblast cells do affect the metastability of EML
cells by shifting the metastability process towards increased production and
maintenance of more quiescent cell subsets.
Understanding how the metastability of HSCs is regulated is imperative to
deciphering the characteristics of HSCs when in a particular “state”. This
knowledge will ultimately help provide us the ability to alter the state of HSCs for
specific purposes, for example, more effective bone marrow transplant,
accelerated differentiation of HSCs post-transplant, reduced GVHD, lower
susceptibility to chemotherapy, etc.

iii
ACKNOWLEDGEMENTS
I would like to thank Jennifer Zayas for her mentorship, serial culture and PCR
work. Additionally, I would like to thank John George for his work obtaining the
microarray data and Ruben Perez for all his time and effort, particularly with
PCR. Additionally, I would like to acknowledge Shannon Opiela at the Sylvester
Flow Cytometry Core Lab for all her help in flow cytometry and cell sorting.
Finally, thank you to my mentor, Dr. Roland Jurecic, for passing on some of his
expansive knowledge about hematopoietic stem cells and for his mentorship,
critical thinking and editing abilities.
iv
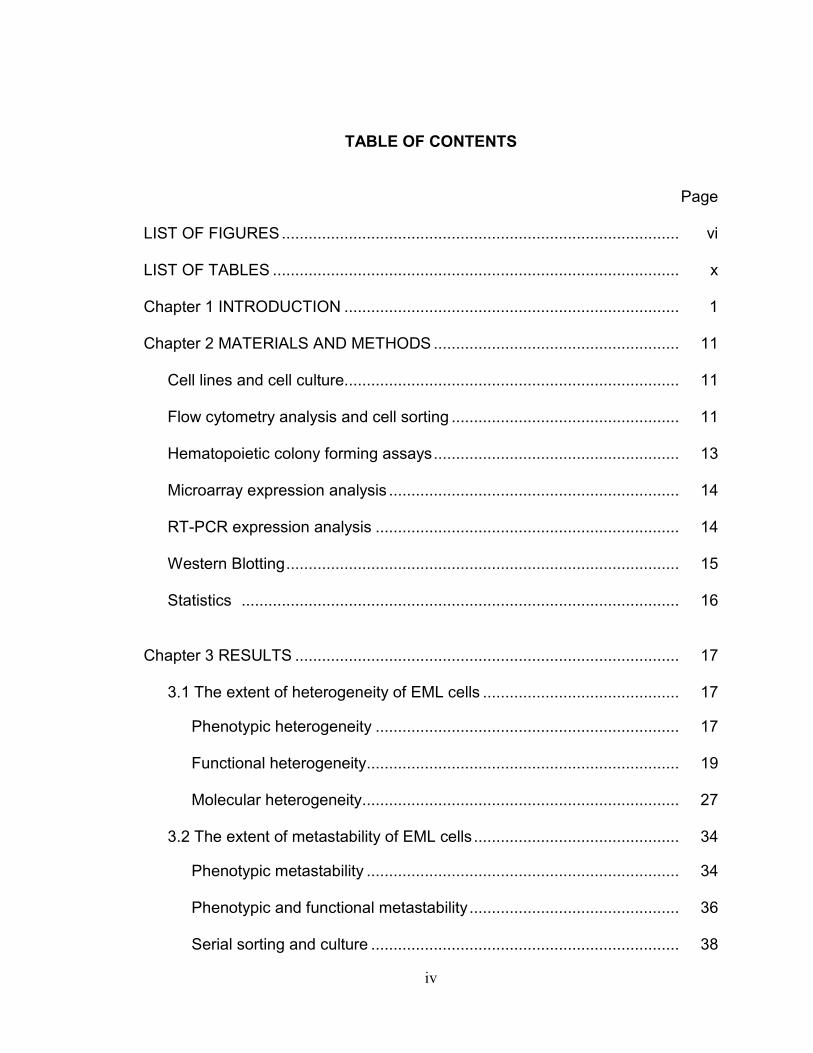
TABLE OF CONTENTS
Page
LIST OF FIGURES ......................................................................................... vi LIST OF TABLES ........................................................................................... x Chapter 1 INTRODUCTION ........................................................................... 1 Chapter 2 MATERIALS AND METHODS ....................................................... 11 Cell lines and cell culture........................................................................... 11 Flow cytometry analysis and cell sorting ................................................... 11 Hematopoietic colony forming assays ....................................................... 13 Microarray expression analysis ................................................................. 14 RT-PCR expression analysis .................................................................... 14 Western Blotting ........................................................................................ 15 Statistics .................................................................................................. 16 Chapter 3 RESULTS ...................................................................................... 17 3.1 The extent of heterogeneity of EML cells ............................................ 17
Phenotypic heterogeneity .................................................................... 17 Functional heterogeneity ...................................................................... 19 Molecular heterogeneity ....................................................................... 27 3.2 The extent of metastability of EML cells .............................................. 34
Phenotypic metastability ...................................................................... 34 Phenotypic and functional metastability ............................................... 36 Serial sorting and culture ..................................................................... 38

v
3.3 The regulation of metastability of EML cells ........................................ 41 The effect of OP9 mesenchymal cells on EML metastability ............... 42 The effect of MC3T3 osteoblast cells on EML metastability................. 58 The effect of 3T3 fibroblast cells on metastability ................................ 73 Chapter 4 CONCLUSION AND DISCUSSION ............................................... 78 WORKS CITED…………… ............................................................................ 89

vi
LIST OF FIGURES
Page
Figure 1. HSCs give rise to all the blood cell types. ........................................ 2 Figure 2. The maintenance and multilineage differentiation of multipotent hematopoietic cell line EML. ........................................................................... 6 Figure 3. Adult HSC reside in the osteoblastic and vascular niches in the bone marrow. .................................................................................................. 8 Figure 4. The HSC-niche synapse .................................................................. 8 Figure 5. Flow cytometry analysis shows that the multipotent hematopoietic cell line EML is phenotypically heterogeneous. .................................................... 18 Figure 6. The broad spectrum of CD34 expression and gating ...................... 18 Figure 7. The CD34 subsets of EML cells are heterogeneous for expression of HSC markers. ................................................................................................. 20 Figure 8. The EML cell line and its cell subsets are functionally heterogeneous and exhibit distinct multilineage differentiation pattern. .................................. 21 Figure 9. The EML cell line and its cell subsets are functionally heterogeneous and exhibit distinct cell cycle profiles .............................................................. 23 Figure 10. The analysis of proliferation kinetics of CD34neg, CD34low, CD34int and CD34high EML cell subsets. ............................................................................. 25 Figure 11. The existence of a separate population with reduced initial CFSE labeling in CD34neg and CD34low EML cell subsets. ........................................ 26 Figure 12. CFSE labeling of EML cells distinguished two separate populations, designated CFSEmain and CFSEsatellite populations ......................................... 26 Figure 13. The molecular heterogeneity of the multipotent hematopoietic cell line EML .................................................................................................. 30 Figure 14. EML cells are predominantly Sca-1 positive .................................. 30 Figure 15. EML cells differ in their expression of STK and JAM4 but not C/EBP±. .................................................................................................. 33

vii
Figure 16. The cells within EML cell line oscillate between several inter-convertible and self-renewing metastable states. ........................................... 35 Figure 17. Flow cytometry analysis of CD27, VEGFR1, CD201 and CD150 HSC marker expression on day 14 progeny of total EML cells and each parental EML cell subset. .................................................................................................. 37 Figure 18. Flow cytometry analysis of cell cycle on day 14 progeny of total EML cells and each parental EML cell subset. ....................................................... 39 Figure 19. Each EML subset and its progeny retain the capacity to re-establish parental population of EML cells after serial sorting and cell culture. ............. 40 Figure 20. Flow cytometry analysis shows that EML cells can be separated from OP9-GFP cells. ............................................................................................... 43 Figure 21. OP9 cells do not express CD34, CD150 and VEGR1 HSC markers 44 Figure 22. Representative flow cytometry data of CD34 expression on the progeny of EML cells alone or in the presence of OP9-GFP cells. ................. 46 Figure 23. The progeny of EML cells grown on OP9 cells contain a higher percentage of CD34neg and CD34low EML cells .............................................. 47 Figure 24. EML cells were co-cultured with OP9-GFP cells for 8 days and returned to culture without OP9-GFP cells for another 7 days........................ 49 Figure 25. EML cells grown in the presence of OP9 cells express significantly less CD150 .................................................................................................. 50 Figure 26. EML cells co-cultured with OP9-GFP cells contain a higher percentage of cells in the G0 phase of the cell cycle. ..................................... 52 Figure 27. The analysis of the progeny of CD34neg EML cells cultured in the absence or presence of OP9-GFP cells. ........................................................ 53 Figure 28. The analysis of the progeny of CD34low EML cells cultured in the absence or presence of OP9-GFP cells. ........................................................ 54 Figure 29. The analysis of the progeny of CD34int EML cells cultured in the absence or presence of OP9-GFP cells. ........................................................ 55 Figure 30. The analysis of the progeny of CD34high EML cells cultured in the absence or presence of OP9-GFP cells. ........................................................ 56

viii
Figure 31. OP9 cells promote the maintenance of CD34neg and CD34low EML subsets .................................................................................................. 57 Figure 32. MC3T3 cells express CD34 and VEGR1 HSC markers but do not express c-kit or CD150 ................................................................................... 59 Figure 33. Gating strategy ensures evaluation of EML cells ........................... 60 Figure 34. Representative flow cytometry data of CD34 expression on the progeny of EML cells alone or in the presence of MC3T3 cells. ..................... 62 Figure 35. The progeny of EML cells grown on MC3T3 cells contain a higher percentage of CD34neg and CD34low EML cells .............................................. 63 Figure 36. EML cells were co-cultured with MC3T3 cells for 14 days and returned to culture without MC3T3 cells for 3 and 7 days. ............................................ 64 Figure 37. EML cells grown in the presence of MC3T3 cells express significantly less CD150 .................................................................................................. 66 Figure 38. EML cells co-cultured with MC3T3 cells contain a higher percentage of cells in the G0 phase of the cell cycle. ........................................................ 67 Figure 39. The analysis of the progeny of CD34neg EML cells cultured in the absence or presence of MC3T3 cells. ............................................................ 68 Figure 40. The analysis of the progeny of CD34low EML cells cultured in the absence or presence of MC3T3 cells. ............................................................ 69 Figure 41. The analysis of the progeny of CD34int EML cells cultured in the absence or presence of MC3T3 cells. ............................................................ 70 Figure 42. The analysis of the progeny of CD34high EML cells cultured in the absence or presence of MC3T3 cells. ............................................................ 71 Figure 43. MC3T3 cells promote the maintenance of CD34neg and CD34low EML subsets .................................................................................................. 72 Figure 44. NIH/3T3 cells do not express the HSC markers CD34, c-kit, CD150 or VEGFR1 .................................................................................................. 74 Figure 45. Gating strategy for selection of EML cells in co-culture with NIH/3T3 cells .................................................................................................. 75 Figure 46. Representative flow cytometry data of CD34 expression on EML cells with and without NIH/3T3 cells. ...................................................................... 76

ix
Figure 47. There is no significant change in the frequency of CD34 subsets when EML cells are grown in the presence of NIH/3T3 cells. ................................ 77 Figure 48. Model showing the intrinsic metastability of EML cells .................. 81 Figure 49. Model showing the effect of BM niche cells on EML cell metastability .................................................................................................. 84 Figure 50. Model of HSC metastability in the BM niche .................................. 86

x
LIST OF TABLES
Page
Table 1. Microarray results reveal little difference between CD34neg and CD34pos subsets of EML cells in hematopoiesis and HSC-relevant genes as well as lineage-associated genes.. ............................................................ 28 Table 2. Microarray results reveal little difference between CD34neg and CD34pos subsets of EML cells in hematopoietic cell surface markers, receptors and adhesion molecules. ................................................................ 29

1
Chapter 1: Introduction
Adult hematopoietic stem cells (HSCs) are multipotent stem cells that reside in
the bone marrow and give rise to all the blood cell types from the myeloid
(monocytes and macrophages, neutrophils, basophils, eosinophils, erythrocytes,
megakaryocytes/ platelets, dendritic cells), and lymphoid lineages (T-cells, B-
cells, NK-cells) (Figure 1). The HSCs maintain homeostasis of the hematopoietic
system by replacing differentiated blood cells lost through physiological turnover,
disease, or injury. The life-long maintenance and regenerative capacity of the
hematopoietic system depend on self-renewal and differentiation of HSCs.
HSCs undergo symmetric or asymmetric self-renewal division in order to
maintain the HSC pool and produce new mature blood cells1-7.
The population of HSCs constitutes ~0.01% of cells in the adult human and
mouse bone marrow and contains cells with long-term and short-term
regeneration capacities, which in turn give rise to multipotent hematopoietic
progenitors (MPPs), common myeloid and lymphoid progenitors (CMPs and
CLPs) (Figure 1). The functional definition of HSCs in the HSC field is the ability
to produce at least 1% of lympho-myeloid progeny in the recipient’s peripheral
blood at 16 weeks post-transplantation.
Numerous studies have reported the phenotypic and functional heterogeneity
within a variety of stem cell types, including ES cells and adult neural, intestinal
and hematopoietic stem cells (HSCs), which arises from the coexistence of
different cell subsets8-28. More importantly an increasing number of studies is
also reporting the existence of inter-convertible metastable cell subsets within

2
Adapted from: Pallavi Sontakke, et. al. (2012) Mechanisms involved in HSC self-renewal and hematopoietic lineage commitment. Univ. of Groningen Figure 1. HSCs give rise to all the blood cell types. Division of HSCs produces daughter cells and may produce a progenitor which can differentiate into myeloid or lymphoid progeny, ultimately producing all the hematopoietic cell types. LT-HSC=long term HSC, ST-HSC=short term HSC, MPP=multipotent progenitor, CMP=common myeloid progenitor, CLP=common lymphoid progenitor, GMP=granulocyte/macrophage progenitor, MEP=megakaryocyte/erythroid progenitor, mK=megakaryocyte.
3
the pool of ES cells, intestinal stem cells, HSCs and cancer stem cells17, 21, 27, 29-
43.
Mounting experimental evidence supports the notion that the hematopoietic
system is maintained by a consortium of HSC subtypes with distinct functional
characteristics8, 9, 11, 16, 18, 21, 24. Differential expression of certain HSC markers
(e.g. CD34 and CD150) and Hoechst dye efflux capacity have enabled
identification of functionally distinct and inter-convertible subsets of HSCs. The
studies by the Ogawa group were the first to reveal that mouse long-term
repopulating HSCs (LTR-HSCs) alternate in vivo between LSK CD34- and LSK
CD34+/low states44-49. Other reports suggested that mouse LTR-HSCs oscillate
between LKS Flk2- CD34- dormant and LKS Flk2- CD34+ activated states38, 39, 50.
Based on differential expression of CD150 marker and Hoechst dye efflux
capacity, several studies have shown that LTR-HSCs could be divided into two
functionally and potentially inter-convertible distinct subsets: (1) a CD150hi subset
with a high propensity to generate myeloid progeny, and (2) a CD150low subset
with a high propensity for differentiation into lymphoid lineages8, 18, 22, 31, 51. These
findings are profoundly shifting our perception of HSCs from being a functionally
uniform cell pool to a dynamic pool of multiple inter-convertible cell subsets.
The precise role of metastability in HSC biology remains unclear, and the
characteristics, extent and the regulation of HSC metastability remain to be fully
explored. The ability to “switch” between different inter-convertible functional
states could be enabling HSCs and multipotent hematopoietic cells in general to
respond differently to various external cues and signals from cells in the bone

4
marrow (BM) environment in which HSCs reside and other hematopoietic cells,
as well as to stress, infection, inflammation, and injury caused by radiation and
chemotherapy agents. Since the cellular and molecular components of BM
niches regulate the survival, self-renewal and differentiation of HSCs and
multipotent hematopoietic cells16, 39, 52-77, it is likely that they also are involved in
the cell extrinsic regulation of the metastability of HSCs and multipotent
hematopoietic cells.
Studying the regulation of HSC metastability in vivo or in vitro is technically
and practically complicated because of the low frequency of HSCs and
associated difficulties in capturing oscillating cell states in vivo, as well as the
difficulties in long-term in vitro maintenance of functional HSCs. The multipotent,
self-renewing murine hematopoietic cell line EML is a well characterized in vitro
surrogate for HSCs and multipotent progenitors (MPPs), and is emerging as a
unique model to study the heterogeneity and metastability of multipotent
hematopoietic cells36, 41, 42, 78-105.
The multipotent SCF-dependent hematopoietic cell line EML was derived from
the bone marrow (BM) cells of 5-FU treated BDF1 mice99. This cell line has
normal karyotype, is not transformed, and is the only known hematopoietic cell
line with well documented multilineage (erythroid, myeloid, lymphoid)
differentiation capacity79, 87, 89, 90, 92, 98-100, 105. In the presence of SCF, EML cells
undergo proliferative self-renewal, while in the presence of specific cytokines
and/or stroma they differentiate into erythroid, granulocyte-macrophage,
megakaryocyte, and B cell progenitors (Figure 2) 87, 89, 92, 98, 99, 105. Moreover, we

5
have reported that in the OP9-DL1 co-culture system, supplemented with
cytokines (SCF, IL-7 and Flt3L), EML cells undergo T cell differentiation90, 106
(Figure 2).
Numerous studies including our own have shown that phenotypic, functional
(lineage commitment, differentiation) and molecular features (transcriptional
regulation, signal transduction pathways, cellular and molecular responses to
cytokines, etc.) of EML cells closely resemble or are identical to the features of
adult HSCs and multipotent hematopoietic progenitors (MPPs). Thus, the EML
cell line represents the most similar in vitro counterpart of HSCs and MPPs to
date, and is being used as an important and relevant model to study the
maintenance, lineage commitment and differentiation of multipotent
hematopoietic cells36, 41, 42, 78-105.
Papers by Chang et al.32 and Pina et al.36 have shown that EML cells
reversibly oscillate between several cell subsets, and include analysis of certain
characteristics of EML cell metastability based on the range of expression of
HSC marker Sca-1. These studies suggested that inter-convertible metastable
states of EML cells reflect either (a) slowly fluctuating transcriptomes that may
govern reversible priming and cell fate decision, or (b) the oscillation between
self-renewing and committed cell states32, 36. Based on differential expression of
CD34 marker our laboratory has previously reported that EML cells reversibly
oscillate between CD34- and CD34+ metastable cell states41, 42.

6
Figure 2. The maintenance and multilineage differentiation of multipotent hematopoietic cell line EML.

7
In this study, we sought to analyze in depth the heterogeneity and metastable
properties of EML cells. Our findings have revealed extensive phenotypic and
functional cell heterogeneity within EML cell line, due to the coexistence of
several cell subsets with distinct HSC marker expression patterns, cell cycle
profile and the propensity to differentiate. Furthermore, our data show that each
EML cell subset is metastable with the capacity to both self-renew and produce
all other cell subsets, and re-establish the parental EML cell population. Taken
together, our findings show that EML cell line consists of distinct cell subsets that
co-exist in a dynamic equilibrium and oscillate between self-renewing and inter-
convertible metastable states with distinct phenotypic and functional features.
Equally important, our results support the notion that the dynamic equilibrium of
metastable EML cell subsets is homeostatically maintained and regulated by
currently unknown cell intrinsic mechanisms.
Within the BM, HSCs reside in at least two specialized areas (niches): (1) an
endosteal niche, containing osteoblasts, mesenchymal stem cells (MSCs) and
CXCL12-abundant reticular (CAR) cells, and (2) a perivascular endothelial niche,
containing vascular endothelial cells, MSCs, macrophages and CAR cells
(Figure 3). The cellular and molecular components (adhesion proteins, secreted
and membrane-bound cytokines, chemokines, extracellular matrix components,
etc.) of BM niches comprise the so called HSC-niche synapse, which regulates
HSC survival, self-renewal, lineage priming and differentiation (Figure 4)54, 73-77,
107-112.

8
Figure 3. Adult HSC reside in the osteoblastic and vascular niches in the bone marrow.
Figure 4. HSC self-renewal and differentiation are regulated by cell intrinsic and extrinsic pathways which interact through the synapse between HSC and niche cells.
Anne Wilson & Andreas Trumpp (2006).
Ehninger A , and Trumpp A J Exp Med 2011;208:421-428

9
Since the EML cell line is perpetually maintained in the absence of cellular
and molecular components of BM niches (with an exception of SCF)99, 105, our
findings support the notion that the dynamic equilibrium of metastable EML cell
subsets is maintained and regulated by currently unknown cell intrinsic
mechanisms. Furthermore, the perpetual metastability of EML cells without the
influence of cellular and molecular components of BM niches points to the cell
intrinsic propensity of EML cells to be metastable. Thus, we sought to determine
(1) whether and how specific types of BM niche cells affect EML cell
metastability, and (2) if the changes in EML cell metastability, induced by specific
types of niche cells, are transient or persist long-term, and are irreversible or not.
Our results indicate that mesenchymal and osteoblast cells do affect the
metastability of EML cells by shifting the metastability process towards increased
production and maintenance of more quiescent cell subsets. There was a
concurrent decrease in the production and maintenance of more proliferative cell
subsets. This niche cell effect was reversible, indicating that the intrinsic
heterogeneous distribution and metastable profile is not permanently affected by
the BM niche cells.
Moreover, these results provide the first demonstration that the EML cell
metastability can be influenced by niche cells, further underscoring the biological
significance of this approach. Our findings also strengthen and emphasize the
biological relevance of EML cell line as a unique experimental model to study the
characteristics and regulation of multipotent hematopoietic cell metastability.

10
Since the cellular and molecular components of BM niches regulate the
survival, self-renewal and differentiation of HSCs and multipotent hematopoietic
cells73-77, it is likely that the components of the BM niches are also involved in the
cell extrinsic regulation of the metastability of HSCs and multipotent
hematopoietic cells.
Based on our findings we hypothesize that under homeostatic (non-stressed
or diseased) conditions, the metastability of HSCs within the BM is attenuated,
due to niche influences. However, HSCs may increase their level of metastability
after injury to BM niches or themselves (caused by radiation, chemotherapy
agents, or chronic inflammation), or upon the exit of HSCs from BM niches113, 114.
Thus, in response to stress and damage HSCs may become more metastable to
better balance their self-renewal and differentiation.
The ability to “switch” between different inter-convertible functional states
could be enabling HSCs and multipotent hematopoietic cells in general to
respond differently to various external cues and signals from the BM niches and
other hematopoietic cells, as well as to stress, infection, inflammation, and injury
caused by radiation and chemotherapy agents.
Learning how the metastability of multipotent hematopoietic cells is regulated,
and how this can be manipulated, is central for the better understanding of this
fascinating cellular process. This knowledge may also provide us the ability to
alter the state of HSCs for more effective bone marrow transplant, accelerated
differentiation of HSCs post-transplant, lower susceptibility to chemotherapy, etc.

11
Chapter 2: Materials and Methods
Cell lines and cell culture
The Stem Cell Factor (SCF)-dependent EML cell line was kindly provided by
Dr. Steve Collins (Fred Hutchinson Cancer Research Center, Seattle, WA). EML
cells were maintained in IMDM with L-glutamine (Gibco), and supplemented with
20% (vol/vol) equine serum (Hyclone), 1% Penicillin/Streptomycin (Sigma) and
10% (vol/vol) conditioned media from the BHK/MKL cell line (constitutively
expressing recombinant soluble SCF) as previously described99. EML cells were
maintained at a density of 0.5 - 5.0 x 10⁵ cells/ml, and were passaged every
other day. The BHK/MKL cell line was maintained in DMEM with L-glutamine
(Gibco), 10% fetal bovine serum (Hyclone), and 1% Penicillin/Streptomycin
(Sigma). Conditioned media was collected from confluent BHK/MKL cell cultures
at 48 and 96 hours, centrifuged at 1200 rpm for 10 minutes, filtered through a
0.45 μm membrane and frozen in 50 ml aliquots at -20oC.
Co-culture experiments were conducted in 6-well plates. Adherent cell lines
were grown to 90% confluency in their respective optimal media. EML cells were
seeded onto adherent cultures at a concentration of 0.75 x 10⁵ cells/ml in EML
growth media. EML cells were passed onto fresh 90% confluent adherent
cultures every 2 days at 0.75 x 10⁵ cells/ml. Parallel suspension cultures were
maintained in the same manner without adherent cells.
Flow cytometry analysis and cell sorting
EML cells were harvested, washed with phosphate buffered saline (PBS), and
incubated with antibodies at the recommended concentrations for 40 min on ice,

12
followed by double wash in PBS. Centrifugation steps were carried out at 1200
rpm for 10 min at 4°C. The cells were analyzed live or after fixation in 10%
neutral buffered formalin. The following antibodies were used: IgG2a and IgG2b
isotype controls (eBioscience), anti-c-kit APC (eBioscience, clone 2B8), anti-Sca-
1 PE-Cy7 (eBioscience, clone D7), anti-Flk-2 PE (eBioscience, clone A2F10),
anti-CD49b PE-Cy7 (eBioscience, clone DX5), anti-CD34 FITC (eBioscience,
clone RAM34), anti-CD34 eFluor660 (eBioscience, clone RAM34), anti-CD150
APC (eBioscience, clone 9D1), anti-CD201 AlexaFluor647 (eBioscience, clone
mRCR-16), anti-VEGFR1 APC (R&D Systems, clone 141522) and anti-CD27
PE-Cy7 (eBioscience, clone LG.7F9). Before labeling of cells with multiple
antibodies, different fluorochromes were checked for compatibility and
compensation utilizing the BD Fluorescence Spectrum Viewer. The cell cycle
profile of total EML cells and purified CD34neg, CD34low, CD34int and CD34high
EML cell subsets was analyzed by Propidium Iodide (PI), Hoechst 33342, and Ki-
67/7-AAD staining. For staining with PI (BIOTIUM) the cells were re-suspended
in cold 70% ethanol, washed in PBS, treated with 0.1 mg/ml RNase A, and
incubated with 0.1 μg/μl PI. For staining with Hoechst 33342 (SIGMA) the cells
were re-suspended in cold PBS/1% formaldehyde, and incubated with 5 μg/ml
Hoechst at 37oC for 15 minutes. For analysis of Ki-67 expression, the EML cells
were first labeled with anti-CD34 FITC antibody. Staining of labeled EML cells
with Ki-67-eFluor450 (eBioscience, clone B56) followed the eBioscience Protocol
B for Staining Intracellular Antigens for Flow Cytometry
(http://www.ebioscience.com/media/pdf/best-protocols/staining-intracellular-

13
antigens-for-flow-cytometry.pdf), utilizing the Foxp3/Transcription factor staining
buffer set (eBioscience), followed by addition of 1:100 μl of 7-AAD (BioLegend) in
PBS. To examine their proliferation kinetics, total EML cells and EML cell subsets
were first labeled with anti-CD34 eFluor660 antibody (eBioscience) as described.
Staining of live cells was performed by adding 1.5 uM CFSE in 1 ml of 0.1%
FBS/1X PBS for 8 minutes at room temperature, followed by addition of 1 ml of
warm FBS and 10 minute incubation in 37oC water bath. The cells were washed
3 times in 2% FBS/1X PBS and placed in culture. The expression of various
markers was analyzed on BD LSR II or BD LSRFortessa flow cytometers (BD
Biosciences) and data analyzed with FlowJo software (Tree Star). The cells were
sorted on a FACSAria II sorter (BD Biosciences).
Hematopoietic colony forming assays
To assess their multilineage differentiation capacity, total EML cells and
purified CD34neg, CD34low, CD34int and CD34high EML cell subsets were plated in
2 ml of 0.3% low melting temperature agarose (SeaPlaque, Cambrex) with 2X
IMDM (Gibco), 20% heat inactivated equine serum (Hyclone) and 10% SCF-
conditioned medium in replicate 6-well plates (103 cells/well). The media was
supplemented with 0.1 ng/ml of recombinant mouse interleukin 3 (IL-3) (R&D
Systems), 8 U/ml of recombinant human erythropoietin (Epo) (Ortho Biotech), or
3 ng/ml of recombinant mouse thrombopoietin (Tpo) (R&D Systems). Cultures
were maintained at 37oC, 5% CO2 for 7-10 days. The burst-forming erythroid
units (BFU-E), granulocyte/macrophage colony forming units (CFU-GM) and
megakaryocyte colony forming units (CFU-Meg) were counted 7-10 days after

14
plating. Data from multiple independent experiments are shown as mean +
standard deviation (SD).
Microarray expression analysis
To examine molecular differences between EML cell subsets we analyzed the
transcriptomes in three separately purified samples of CD34neg cells and
combined CD34int and CD34high subsets, refrerred to in the text as CD34+ cells.
The microarray expression analysis was performed by Ocean Ridge Biosciences
(ORB, Palm Beach Gardens, FL) using Agilent mouse microarrays. The mRNA
samples were prepared from total EML cells and purified CD34neg and CD34+
EML cells using Micro-FastTrack™ 2.0 mRNA and mRNA DIRECT Isolation Kits
(Life Technologies). Ocean Ridge Biosciences performed additional purification
of mRNA, sample labeling, microarray hybridization and data analysis. The
results were provided by ORB in Log2 transformed form and are presented as
mean ± s.d. (n=3). The < 1.5-fold difference in expression was not considered
significant. To identify differences in the hematopoietic transcriptomes between
EML cell subsets we specifically examined the expression of (1) genes important
for overall hematopoiesis and HSC maintenance and function, (2) hematopoietic
cell surface markers, receptors and adhesion molecules, and (3) genes
associated with erythroid, megakaryocytic, myeloid and lymphoid lineage
specification and development.
RT-PCR expression analysis
Total RNA and mRNA were isolated using the RNeasy Mini and Micro Kits
(Qiagen) and Micro-FastTrack™ 2.0 mRNA and mRNA DIRECT Isolation Kits

15
(Life Technologies). Equal amount of total or mRNA from each cell sample was
reverse transcribed using Superscript III System (Invitrogen). Polymerase chain
reactions (PCR) were performed in an Eppendorf Mastercyler for 35-40 cycles
(95°C for 30-45 seconds, 57-62°C for 45 seconds, and 72°C for 30-45 seconds).
Serial dilutions of cDNA were used in semi-quantitative reverse transcription
(RT)-PCR analysis. PCR products were run on 1% agarose (SeaKem, Cambrex)
gels and visualized with ethidium bromide staining on AlphaImager 3400 (Alpha
Innotech). The RNA content of samples was normalized based on the
amplification of HPRT as a control gene. Primer sequences are listed in the table
below.
Rae-28 5’-GTGCTACATGGTGACAGCTT 3’-AGCTAGGAAAGCTGACCTCT
GATA2 5’-GGCGTCAAGTACCAAGTGTCAC 3’-CTCCCGGCCTTCTGAGCAGGAG
Bmi-1 5’-AAGGAAGAGGTGAATGATAAAAGG 3’-ACTACAAAAGGAAGCAAACTGGAC
c-kit 5’-TCCTCACTCACGGGCGGATC 3’-TGGAGGTGGGGTGGGGAACT
GATA1 5’-GGAGCCCTCTCAGCTCAGC 3’-GACTTCCTGGTCGACCACCG
PU.1 5’-CGGATGACTTGGTTACTTACG 3’-TTGGACGAGAACTGGAAGGTA
HPRT 5’-GTTGAGAGATCATCTCCACC 3’-AGCGATGATGAACCAGGTTA
STK/RON 5’-CACCCTTTGTGGCTCCAACTTC 3’-TTCCATTGACCAGCACAGCTCG
JAM4 5’-TAACCAAATGGTGGTGCTGA 3’-CCACCATGACAGACACTTGG
C/EBP± 5’-TAGGTTTCTGGGCTTTGTGG 3’-AGCATAGACGTGCACACTGC
Western blotting
The cells were lysed in 100 μl of modified RIPA buffer (150 mM NaCl, 1% NP-
40, 150 mM Tris, pH 7.5, 1 mM EDTA), supplemented with protease inhibitor
(Roche), PhosStop (Roche), 10mM HEPES and 200mM PMSF. 25 μg of protein
was run on 12% SDS-PAGE gels (Bio-Rad Mini Protean-TGX) and transferred to

16
nitrocellulose membranes (Bio-Rad Trans-Blot). The membranes were incubated
overnight with 1:500 rabbit anti-C/EBP± monoclonal antibody (Epitomics, clone
EP709Y) in 5% BSA at 4oC, washed and then incubated overnight at 4oC with
1:10,000 goat anti-rabbit polyclonal IgG (H&L)-HRP secondary antibody
(Rockland). The proteins were detected with TMB Membrane Peroxidase
Substrate System (KPL) for detection of HRP. The human monocytic cell line U-
937 (ATCC, CRL-1593.2) was used as a positive control for expression of
C/EBP± protein. The membranes were stripped and incubated with rabbit anti-
GAPDH antibody (Sigma-Aldrich).
Statistics
Statistical significance was determined using a two-tailed unpaired Student t-
test (Prism Software, Graphpad). Data are expressed as mean + standard
deviation (SD). The number of independent samples and experiments are
provided in the figure legends. Statistical significance and P values are indicated
by asterisks and specified in the figure legends. P values of < 0.05 were
considered statistically significant.

17
Chapter 3: Results
3.1 The extent of heterogeneity of EML cells
Phenotypic heterogeneity
A precise characterization of EML cell heterogeneity remained to be explored
from a combined phenotypic, functional and molecular perspective. To evaluate
the heterogeneity of EML cell line we first examined the expression of several
classical HSC cell surface markers28, 115-124. The flow cytometry analysis revealed
that almost all EML cells are Sca-1+ c-kit+ Flk2– and CD49b– (alpha2-integrin),
but reproducibly exhibit varying expression levels of CD34, CD27, VEGFR1,
CD201 and CD150 markers (Figure 5A and B).
Range of expression of certain HSC markers (e.g. CD34 and CD150) and
differential Hoechst dye efflux capacity have enabled identification of functionally
distinct subsets of HSCs, such as Lin-Sca1+c-kit+(LSK) CD34– and LSK CD34low
LTR-HSCs, and CD150hi myeloid-biased and CD150low lymphoid-biased HSCs 8,
18, 22, 31, 45, 47-50, 125.
Based on the range of expression of the commonly used HSC marker,
CD3436, 40, 42, 105, 120, 125, 126, EML cells can be divided into CD34neg, CD34low,
CD34int and CD34high cell subsets (Figure 6). Although the frequency of each cell
subset within EML cell line fluctuates slightly, their overall average proportions
remained very stable throughout multiple cell passages. The analysis of
expression of CD27, CD201, VEGFR1 and CD150 markers has revealed further
reproducible phenotypic heterogeneity within EML cell subsets, with e.g. CD34neg
and CD34low subsets containing the highest percentage of VEGFR1+ cells, and

18
Figure 5. Flow cytometry analysis shows that the multipotent hematopoietic cell line EML is phenotypically heterogeneous. A) Representative flow cytometry analysis of HSC marker expression on EML cells. These data show that almost all EML cells express Sca-1 and c-kit markers on the cell surface and do not express Flk2 and CD49b markers, but reproducibly exhibit heterogeneous expression of CD150, CD201, VEGFR1(FLT1), CD27 and CD34 markers. B) Average percent of cells expressing CD27, CD201, VEGFR1, CD150 and CD34 on EML cells. Data are mean ± s.d. (n=4).
Figure 6. Based on the broad spectrum of CD34 expression EML cells can be reproducibly divided into CD34neg, CD34low, CD34int and CD34high cell subsets.
A
B C
D20
1 A
lexa
Flu
or6
47

19
CD34int and CD34high subsets containing the highest percentage of CD150+,
CD27+ and CD201+ cells (Figure 7).
Cumulatively, these results further underscore the phenotypic cell
heterogeneity within EML cell line, which consists of CD34neg, CD34low, CD34int
and CD34high EML cell subsets with distinct HSC marker expression profiles.
Functional heterogeneity
To investigate the functional differences between CD34neg, CD34low, CD34int
and CD34high EML cell subsets, we analyzed their multilineage differentiation
potential, cell cycle profile and proliferation kinetics. The multilineage
differentiation potential of FACS purified CD34neg, CD34low, CD34int and CD34high
cell subsets (~99% purity) was analyzed by colony forming cell (CFC) assays for
hematopoietic progenitors 87, 105. These assays have reproducibly shown that
CD34neg cells differentiate minimally or not at all, whereas CD34low, CD34int and
CD34high cells show an increasing propensity to differentiate into myeloid,
erythroid and megakaryocytic lineages in response to single or multiple cytokines
(Figure 8).
Notably, these findings are very similar to the report that in CFC assays,
mouse LSK CD34high BM cells differentiate efficiently into myelo-erythroid
lineages, while the CD34low and CD34- BM cells differrentiate poorly or not at
all16. Although the difference in the propensity of EML cell subsets to differentiate
is evidenced by their variances in ability to respond to cytokines, it may also be
affected by differences in proliferation kinetics and cell cycle status. For this
reason we did extensive evaluation of the cell cycle profile of each CD34 subset.

20
Figure 7. The CD34 subsets of EML cells are heterogeneous for expression of HSC markers. A) Representative flow cytometry data showing HSC marker expression on CD34 subsets of EML cells. These data show that CD34 subsets of EML cells reproducibly exhibit heterogeneous expression of CD27, CD201, VEGFR1 and CD150 markers. B) Average percent of cells expressing CD27, CD201, VEGFR1 and CD150 on each of the CD34 subsets of EML cells. This analysis has revealed differential and heterogeneous expression of the CD27, CD201, VEGFR1 and CD150 markers within CD34neg, CD34low, CD34int and CD34high EML cell subsets. Data are mean ± s.d. *p<0.05, **p<0.01 (n=3-4)
A
B
CD
201
Ale
xaF
luo
r647
CD
201
Ale
xaF
luo
r647
CD
201
Ale
xaF
luo
r647
CD
201
Ale
xaF
luo
r647

21
Figure 8. The EML cell line and its cell subsets are functionally heterogeneous and exhibit distinct multilineage differentiation pattern. The analysis of multilineage differentiation capacity of EML cells and FACS purified CD34neg, CD34low, CD34int and
CD34high EML cell subsets through CFC assays has (1) revealed that EML cell line is functionally heterogeneous, and (2) reproducibly shown that only a very small percentage of CD3neg cells differentiates into erythroid and myeloid lineages, whereas CD34low, CD34int and CD34high cells show an increasing propensity to differentiate into myeloid, erythroid and megakaryocytic lineages in response to single or multiple cytokines. (n=15).

22
When a cell is in the G0 phase of the cell cycle, it is not dividing. When cells
are in the S and G2/M phases, they are either duplicating their DNA in
preparation for division or are in the process of dividing. The cell cycle profile of
CD34neg, CD34low, CD34int and CD34high EML cell subsets was analyzed by
Propidium iodide (PI), Hoechst 33342 and Ki-67 vs. 7-AAD staining. PI staining
has reproducibly shown that each cell subset contains a significantly different
percentage of cells in G0/G1 and S/G2/M phases as compared to all other
subsets. The majority of CD34neg are in G0/G1 phase, whereas the percentage of
cells in S and G2/M phases gradually, but significantly, increases from CD34low to
CD34high cell subset (Figure 9A).
Hoechst staining reproducibly generated similar results, with the majority of
CD34neg being in G0/G1 phase, and significant differences in the frequency of
cells in G0/G1 phase between CD34low, CD34int and CD34high cell subsets
(Figure 9B). The Ki-67 vs. 7-AAD analysis further underscored our cell cycle
analysis by revealing that significantly more CD34neg cells were in G0 phase
specifically compared to CD34low, CD34int and CD34high EML cell subsets (Figure
9C). Also in agreement with PI and Hoechst data, there are significantly more
cells in S/G2/M in CD34high EML cells compared to CD34int, CD34int compared to
CD34low and CD34low compared to CD34neg cells (Figure 9C). Based on the cell
cycle data, the CD34neg subset of EML cells is composed of cells that are not
dividing, while more division is occurring in the each cell subset expressing
progressively more CD34. These results further underscore the functional
heterogeneity of EML cell subsets and suggest that the varied

23
Figure 9. The EML cell line and its cell subsets are functionally heterogeneous and exhibit distinct cell cycle profiles. The analysis of the cell cycle profile of CD34neg, CD34low, CD34int and CD34high EML cell subsets by A) Propidium iodide, B) Hoechst 33342 and C) Ki-67 vs, 7-AAD has revealed that the majority of CD34neg cells are in G0/G1 phase, whereas the percentage of cells in S and G2/M phases gradually, but significantly, increases from CD34low to CD34high cell subset. Data are shown as mean + SD. * P value <0.05, ** P value <0.001
A
B
C
Propidium Iodide
Hoechst 33342
Ki-67 vs. 7-AAD
(n=7)
(n=3)
(n=3)
G0/G1
S
G2/M
Gating strategy for PI based on Watson model
of cell cycle gates.
G0/G1 G2/M
S
Gating strategy for Hoechst 33342 based on
Watson model of cell cycle gates.
G0
G1 S/G2/M
Propidium Iodide
Co
un
t C
ou
nt
Hoechst 33342
Ki-
67
7-AAD
Gating strategy for Ki-67 vs. 7-AAD based on
negative controls and DNA content.

24
propensity to differentiate may be due, at least in part, to their differences in cell
cycle status.
To examine proliferation kinetics, purified CD34neg, CD34low, CD34int and
CD34high cell subsets were labeled with CFSE and their division evaluated at 24
hour time points for 5 days (Figure 10). While the cells in the CD34int and
CD34high subsets divided synchronously and with similar frequency, the cells in
the CD34low subset divided slightly asynchronously with a small portion of cells
dividing less frequently. On the other hand, the cells within CD34neg subset
exhibited more asynchronous and delayed division at all time points (Figure 10).
The CFSE labeling also revealed two distinct cell populations within the
CD34neg and CD34low subsets: a CFSEMain population with a uniformly high level
of CFSE labeling, and a CFSESatellite population (~30% and ~14% of CD34neg and
CD34low cells, respectively) with a lower level of CFSE labeling (Figure 11A).
Moreover, these CFSESatellite fractions of CD34neg and CD34low subsets appear to
be proliferating slower than the CFSEMain population (Figure 11B). In contrast,
the CD34int and CD34high cell subsets contained very small percentage of or
almost no CFSESatellite cells, respectively, which divided more synchronously with
the CFSEMain population (Figure 11A and B).
Importantly, the CFSE labeling of total EML cells also revealed two distinct
populations: a CFSEMain population (90-92% cells), and a CFSESatellite population
(8-10% cells) (Figure 12). Notably, the CFSESatellite population consists of
significantly more CD34neg and CD34low cells and significantly less CD34int and
CD34high cells than the CFSEMain population (Figure 12).

25
Figure 10. The analysis of proliferation kinetics of CD34neg, CD34low, CD34int and CD34high EML cell subsets. A) Overlay of CFSE signal for each CD34 subset at 24 hour time points following labeling shows division of the CFSE signal. B) Histograms of the overlay in (A) showing CFSE signal for each 24 hour time point. The CD34neg and CD34low cells (or a subset of these cells) exhibited reduced division compared to the CD34int and CD34high EML cell subsets (n=2). For example, in one experiment at 96 hours, 13.12% of CD34neg cells may not have divided from the 24 hour time point compared to 0.04% of CD34high cells that may not have divided.
A
B

26
Figure 11. The existence of a separate population with reduced initial CFSE labeling in CD34neg and CD34low EML cell subsets. A) CFSE labeling shows some cells in the CD34neg and CD34low cell subsets have reduced CFSE labeling at 0 hours compared to CD34int and CD34high cell subsets. (n=2) B) Overlay of CFSE labeling at 0 and 24 hours reveals that the cells in the CD34neg and CD34low subsets with reduced initial labeling has not divided by 24 hours. (n=2). Figure 12. CFSE labeling of EML cells distinguished two separate populations, designated CFSEmain and CFSEsatellite populations. CD34 labeling of the CFSEmain population shows a similar distribution to EML total. In contrast, cells in the CFSEsatellite population are primarily CD34neg and CD34low (n=2).
A
B
CFSEmain small cells
CFSEsatellite small cells
Cell size is not responsible for the
reduced CFSE levels.

27
These findings suggest that the CFSESatellite population within CD34neg and
CD34low subsets could be contributing to observed asynchronous division within
these EML cell subsets. The CFSE labeling has revealed an additional
heterogeneity within EML cell line, and particularly within the CD34neg cell subset,
which may be due to 1) an increased CFSE efflux capacity of CFSESatellite cells,
or 2) reduced activity or amount of intracellular esterases required to cleave the
acetate groups and render CFSE fluorescence. It is unlikely that immediate
division is responsible for the CFSEsatellite population, as EML cells divide
approximately every 18 hours and we have shown that the CD34neg subset of
EML cells were primarily in G0.
Cumulatively, these findings have revealed additional phenotypic and
functional cell diversity within the EML cell line, and support the notion that the
EML cell line consists of several cell subsets with distinct HSC marker
expression patterns, cell cycle profile and the propensity to differentiate.
Molecular heterogeneity
To investigate if molecular heterogeneity exists within the EML cell line, the
transcriptomes were analyzed in three batches of separately purified CD34neg
and total CD34+ EML cells (containing CD34 low, CD34int and CD34high subsets) to
examine the expression of: (1) genes important for HSC maintenance and overall
hematopoiesis, (2) hematopoietic cell surface markers, receptors and adhesion
molecules, and (3) genes associated with erythroid, megakaryocytic, myeloid and
lymphoid lineage specification and development87, 90, 98 (Table 1, Table 2 and
Figure 13). Interestingly, there was very little or no difference in the expression

28
Table 1. Microarray results reveal little difference between CD34neg and CD34pos subsets of EML cells in hematopoiesis and HSC-relevant genes as well as lineage-associated genes. nd= no difference defined as fold change < 1.5, NE= not expressed (n=3).
Gene symbol
Fold difference in expression CD34- EML/ CD34+ EML
Gene symbol
Fold difference in expression CD34- EML/ CD34+ EML
GATA-2 ndRae28 nd Mdr1 ndHoxA3 nd c-mpl ndHoxA4 nd Lnk ndHoxA9 nd GATA-1 ndHoxB4 nd Fog1 ndRunx1 nd Klf1 1.79
Runx2 nd Nfe2 nd
Runx3 nd EpoR ndSCL/Tal1 nd VWF 1.68
Jarid2 ndTie2/Tek 1.91 PU.1 nd
Tgm2 nd Mzf1 ndGrb10 nd Irf8 ndE2f1 nd Junb nd
Mdm2 nd c-myc ndElf4 nd Id1 -1.81
Foxo1 nd Id2 ndFoxo3a ndCdc42 ndPML nd
Esam1 ndBmi-1 ndEvi1 1.52
Fbxw7alpha nd
C/EBPα -2.26C/EBPβ ndC/EBPδ nd Pbx1 NE
Cbfb ndAldh1 nd RAG1 NEAbcg2 nd Tcfe2a nd
Pax5 ndIkaros nd
Abcc1 nd LYL1 ndSox4 nd Gfi1 ndJun nd E2A (Tcf3) nd
STAT3 nd HEB (Tcf12) ndSMAD1 nd E2-2 (Tcf4) nd
Ets 1 ndEts 2 nd
Hes1 1.87 T-bet ndBcl3 nd GATA-3 ndBcl6 nd Lck -1.83Bcl9 nd Ebf1 NE
Ctla2 ndDntt (TdT) -2.12
Tcf7 -2.65
NE
Myeloperoxidase (Mpo)
nd
nd
Hematopoiesis and HSC-relevant genes
Lineage-associated genes
MkE lineages
Macrophage expressed gene
1 (Mpeg1)
Myeloid lineages
ndMFNG (manic
fringe)
Abcb1(b)p-glycoprotein
nd
Myeloid cell leukemia
sequence 1 (Md1)
Lymphoid lineages

29
Table 2. Microarray results reveal little difference between CD34neg and CD34pos subsets of EML cells in hematopoietic cell surface markers, receptors and adhesion molecules. nd= no difference defined as fold change < 1.5, NE= not expressed (n=3).
Gene symbol
Fold difference in expression CD34- EML/ CD34+ EML
Gene symbol
Fold difference in expression CD34- EML/ CD34+ EML
c-kit nd Syndecan 1 NECD34 -1.83 N-cadherin NECD38 4.9 CXCR4 nd
CD150 nd CCR5 ndCD244 nd CCR7 ndCD48 nd CCR9 ndCD44 nd Pecam1 (CD31) nd
Notch1 nd
Flk-2/Flt3 ndThy-1 (CD90) NE VCAM1 NE
STK/RON/Mst1r 1.86 ICAM-1 ndCD27 -2.4 ICAM-2 nd
CD47 (IAP) nd Integrin ±1 ndCD41 (Itga2b) nd Integrin ±2 NE
CD105 (Endoglin) nd Integrin ±4 ndTnfrsf1± -2.52 Integrin ±5 ndTnfrsf1² nd Integrin ±6 nd
IL-1R NE Integrin ±7 ndIL-3Ra nd Integrin ±8 NEIL-6R nd Integrin ±9 1.88
G-CSFR nd Integrin ±M NEM-CSFR nd Integrin ±V NE
GM-CSFR± nd Integrin ±X NETGFR 1 nd Integrin ² 1 nd
Integrin ² 2 nd
Integrin ² 3 ndFc³ R II low afinity nd Integrin ² 4 nd
Integrin ² 5 ndIntegrin ² 8 NE
CD154 (CD40L) NE Notch1 ndNotch2 ndNotch3 nd
JAM3 -1.98 Notch4 ndJAM4 2.3
Cell surface markers, receptors and adhesion molecules
L-selectin (CD62L)
NE
Fc³ R I high affinity
-2.6
Fc³ R III low afinity
nd
CD71 (Transferrin receptor)
nd
Cell surface markers, receptors and adhesion molecules

30
Figure 13. The molecular heterogeneity of the multipotent hematopoietic cell line EML. A) Microarray data (log2 transformed) of some hematopoietic genes reveals that CD34neg and CD34pos EML cells are very similar in their expression of many HSC/MPP genes. B) PCR verifies the microarray data shown in (A). C) PCR dilutions showing increasing expression of PU.1 RNA and decreasing expression of GATA1 RNA as CD34 expression increases. Data are mean ± s.d. (n=2).
Figure 14. EML cells are predominantly Sca-1 positive. All CD34 subsets of EML cells express Sca-1. Importantly, CD34negSca-1pos cells are a large portion of the CD34neg population (n=3).
A
B
** **
**
C

31
of most of the genes examined, including transcription factors (TFs) important for
hematopoiesis (GATA-2, Bmi-1, Rae28 etc.) (Table 1, Table 2 and Figure 13).
These results are similar to findings of previous studies, which examined the
gene expression profiles of CD34+ and CD34- EML cells using microarrays and
RNA-Seq technology, and revealed that the overall expression levels of most
mRNAs are similar in CD34+ and CD34- EML cells42, 102.
However, we did detect differences in the expression of PU.1, GATA-1 and
C/EBP± TFs, associated with myeloid and erythroid lineage specification and
restriction32, 36, 84, 127-133 (Table 1 and Figure 13). Slightly higher expression of
GATA-1 was found in CD34neg cells, whereas total CD34+ EML cells expressed
higher levels of PU.1 and especially C/EBP± (Table 1 and Figure 13).
The expression of these genes was further examined by RT-PCR and
Western analysis in purified CD34neg and total CD34+ EML cells, as well as
purified CD34neg, CD34 low, CD34int and CD34high cell subsets. The semi-
quantitative RT-PCR analysis found that the expression of PU.1 is indeed slightly
but not significantly higher in CD34int and CD34high cell subsets than in CD34neg
and CD34 low cells, while the expression of GATA-1 was slightly but not
significantly higher in CD34neg cells than in CD34 low, CD34int and CD34high cell
subsets (Figure 13C).
These results are in partial agreement with the findings of previous studies32,
36, 128, 131, 132, which found significantly higher expression of GATA-1 and lower
expression of PU.1 in Sca-1neg/low than in Sca-1high EML cells. Additionally, the
Sca-1neg/low EML cells were found to express significantly higher levels of GATA-1

32
than Sca-1high EML cells, although at the single cell level the population of Sca-
1neg/low EML cells is quite heterogeneous for expression of GATA-1. Further
subdivision of Sca-1neg/low EML cells on the basis of CD34 expression has shown
that the expression of GATA-1 is confined to Sca1neg/low CD34− cells, while the
expression of GATA-1 in the Sca1neg/low CD34+ cell compartment is minimal36.
The analysis of different EML cell subpopulations most likely accounts for the
differences in the GATA-1 and PU.1 expression levels between these studies
and our studies. Flow analysis shows that the majority of cells in the CD34neg
EML subset are Sca-1+, with only a small fraction of cells being Sca-1neg/low
(Figure 14). Thus, the analysis of CD34− and CD34+ subpopulations of
Sca1neg/low EML cells is actually excluding CD34neg Sca-1int/high cells and CD34+
Sca-1int/high cells, which constitute the majority of CD34neg and CD34+ EML cell
subsets (Figure 14).
Previous studies have shown that loss of C/EBP± results in increased self-
renewal of HSCs134. Notably, although the total CD34+ EML cells and CD34 low,
CD34int and CD34high cell subsets expressed higher level of C/EBP± transcript
than CD34neg subset (Figure 13A), the Western analysis detected no significant
difference in the expression of C/EBP± protein between all four cell subsets
(Figure 15B). Among other genes confirmed to be expressed at a higher level in
CD34neg cells is a HSC-derived receptor STK, and a junctional adhesion
molecule 4 (JAM4), expressed in LSK CD34- and LSK CD34+ BM cells
containing HSCs and MPPs, but not in more differentiated cells (Figure 15A)135,
136. Other important genes with slightly up-regulated expression in CD34neg EML

33
Figure 15. EML cells differ in their expression of STK and JAM4 but not C/EBP±. A) PCR analysis of purified CD34neg and CD34pos EML cells reveals that CD34pos EML cells express less STK and JAM4 RNA than CD34neg EML cells. B) In contrast to microarray data, PCR analysis on purified CD34neg, CD34low, CD34int, and CD34high EML cells shows no significant difference in C/EBP± RNA levels. C) In agreement, Western blot of the purified CD34 subsets reveals no significant difference in C/EBP± protein expression.
A
B
C

34
cells include: CD38 (another marker for mouse HSCs), Tie2/TEK, Klf1, EpoR and
VWF (Table 1and Table 2). The genes found to be down-regulated in CD34neg
EML cells include: CD27 and CD34, c-mpl, JAM3, Tnfrsf1±, Gfi1, Sox4, Dnt, Lck
and Tcf7 (Table 1 and Table 2). Interestingly, Tcf7 was also found to be strongly
down-regulated in Sca-1- CD34- EML cell subset in comparison to Sca-1+ CD34+
subset, and appears to be regulating the switch between self-renewal and
differentiation in EML cells102.
Overall, these studies have revealed that the hematopoietic transcriptome
signatures of EML cell subsets are quite similar and are less diverse than their
functional heterogeneity suggests.
3.2 The extent of metastability of EML cells
Phenotypic metastability
Since the average frequency of each EML cell subset is stable throughout
multiple cell passages, it was important to determine how each of the EML cell
subsets were continuously maintained. The CD34-, CD34low, CD34int and
CD34high EML cell subsets were purified (>99%) by sorting on a FACSAria II, and
individually cultured (Figure 16). To maximally avoid cross-contamination
between cell subsets and variable cell viability, only sorts which yielded the
highest cell purity (>99%) and viability (>95%) were used for these experiments.
Multiple independent cultures of purified cell subsets were maintained by serial
cell passage for up to 14 days, and the expression of CD34 on the progeny of
each cell subset analyzed every 2 days (Figure 16). Remarkably, this temporal
analysis of the progeny of each EML cell subset found that by day 12 of

35
Figure 16. The cells within EML cell line oscillate between several interconvertible and self-renewing metastable states. The CD34neg, CD34low, CD34int and CD34high EML cell subsets were purified by FACS (>99% purity, >95% viability). Multiple independent cultures of purified cell subsets were maintained by serial cell passage for 12 days, and the expression of CD34 on the progeny of each cell subset analyzed every 2 days. This temporal analysis of the progeny of each EML cell subset reproducibly revealed that by day 12 of culture each cell subset reproducibly generated all other subsets and reestablished complete parental EML population. The CD34neg cell subset exhibited the slowest kinetics while the CD34high cells ubset exhibited the fastest kinetics of generating other cell subsets and reestablishing the parental EML population.

36
culture each cell subset had reproducibly generated all other subsets and
reestablished the complete parental EML population (Figure 16). However, the
kinetics with which each EML cell subset generated other subsets and
reestablished parental EML population differed. Specifically, CD34neg cells were
the slowest and CD34high cells exhibited the most rapid kinetics. For example, it
took 6 to 8 days for CD34high and CD34int cell subsets, 8 to 10 days for the
CD34low subset, and 10 and 12 days for the CD34neg subset to generate all other
subsets and re-establish the complete parental EML population (Figure 16 and
data not shown).
Phenotypic and functional metastability
In order to address how the distribution of common HSC markers or the cell
cycle profiles were affected, another set of experiments were performed. In these
experiments, the purified CD34neg, CD34low, CD34int and CD34high cell subsets
were cultured separately for 14 days, and the expression of HSC markers on the
total day 14 progeny analyzed by flow cytometry. Notably, each parental cell
subset reproducibly generated new CD34neg, CD34low, CD34int and CD34high cell
subsets with a heterogeneous expression pattern of CD27, VEGFR1, CD201 and
CD150 markers (Figure 17A), which was not different (no statistical significance)
from the pattern on parental EML cells (Figure 17B). More importantly, all new
CD34neg, CD34low, CD34int and CD34high cell subsets, generated by each of the
parental EML cell subsets, exhibited a heterogeneous expression pattern of
CD27, VEGFR1, CD201 and CD150 markers (Figure 17C), which was also not

37
Figure 17. Flow cytometry analysis of CD27, VEGFR1, CD201 and CD150 HSC marker expression on day 14 progeny of total EML cells and each parental EML cell subset. The parental and purified CD34neg, CD34low, CD34int and CD34high EML cell subsets were cultured for 14 days and the progeny was analyzed by flow cytometry. A) The average percent of cells expressing CD27, CD201, VEGFR1 and CD150 on the 14 day progeny of parental EML cells. B) The analysis of 14 day progeny of parental and CD34 subsets shows that each subset has re-established the same average expression levels of CD27, CD201, VEGFR1 and CD150 markers as the parental EML cells. Data are mean ± s.d. (n=3) *p<0.05. C) The 14 day progeny of purified CD34 subsets were again gated for CD34neg, CD34low, CD34int and CD34high. The expression pattern of CD27, CD201, VEGFR1 and CD150 markers reveal that each subset re-established a similar distribution to the parental EML cells (A), even at the level of the CD34 subsets. Data shown as means + s.d. (n=2).
A
B
CD34 neg CD34 low CD34 int CD34 high
C
Progeny of parental EML
Progeny of CD34 neg
Progeny of CD34 low
Progeny of CD34 int
Progeny of CD34 high

38
statistically different versus the pattern expressed by parental EML cell subsets
(Figure 17B).
The analysis of the cell cycle profile of the day 14 progeny of each parental
EML cell subset also reproducibly showed that (1) the cell cycle profile of the
cumulative progeny of each cell subset closely resembled the cell cycle profile of
the parental population of EML cells (Figure 18A and B), and (2) the cell cycle
profile of each of the new CD34neg, CD34low, CD34int and CD34high cell subsets
generated by each parental cell subset closely resembled the cell cycle profiles
of parental cell subsets (Figure 18B and C). It is clear that CD34neg EML cells
had a higher percentage of cells in G0 with decreasing percentages of cells in G0
in CD34low, CD34int and CD34high cell subsets, as well as lower percentages of
cells in G2/M within the CD34neg EML subset and increasing percentages of cells
in G2/M in CD34low, CD34int and CD34high cell subsets.
Serial sorting and culture
The metastability of each EML cell subset was further tested through serial
cell sorting and culture. The EML cells were sorted into parental CD34neg,
CD34low, CD34int and CD34high subsets (cell purity >99% and viability >95%) and
cultured for 14 days (Figure 19A). The analysis of CD34 expression on day 14
progeny of each parental cell subset again showed that each subset generated
all other subsets and reestablished the parental EML cell population (Figure
19A). After 14 days of culture the primary progeny of each of the parental cell
subsets (Figure 5a) was sorted into separate sets of “primary” CD34neg, CD34
low, CD34int and CD34high subsets (99% purity) (Figure 19A). The CFC assays

39
Figure 18. Flow cytometry analysis of cell cycle on day 14 progeny of total EML cells and each parental EML cell subset. The parental and purified CD34neg, CD34low, CD34int and CD34high EML cell subsets were cultured for 14 days and the progeny was analyzed for cell cycle status by flow cytometry. A) The average percent of cells in G0, S, or G2/M for the 14 day progeny of parental EML cells. B) The analysis of 14 day progeny of parental and CD34 subsets shows that each subset has re-established the same average cell cycle profile as the parental EML cells. Data are mean ± s.d. (n=3) *p<0.05. C) The 14 day progeny of purified CD34 subsets were again gated for CD34neg, CD34low, CD34int and CD34high. The cell cycle profiles reveal that each subset re-established a similar distribution to the parental EML cells (A), even at the level of the CD34 subsets. Data shown as means + s.d. (n=2).
A
B
G1/G0 S G2/M
C

40
Figure 19. Each EML subset and its progeny retain the capacity to re-establish parental population of EML cells after serial sorting and cell culture. A) The CD34neg, CD34low, CD34int and CD34high EML cell subsets were purified by FACS and independently cultured for 2 weeks. The progeny of each of the “parental” CD34neg, CD34low, CD34int and CD34high EML cell subset was again sorted into CD34neg, CD34low, CD34int and CD34high “primary” cell subsets. B) The CFC assays on these primary cell subsets have shown that the CD34high subset retained their distinct differentiation pattern. Data are shown as mean + s.d. (n = 15). C) All of the primary CD34neg, CD34low, CD34int and CD34high cell subsets were cultured independently for another 2 weeks. D) The analysis of CD34 expression on their progeny after 14 days of culture has shown that each of the secondary cell subsets has produced other cell subsets and restored the CD34 expression profile of parental EML cell population (n=5).
A
B
C
D

41
found that each of the primary cell subsets retained their distinct differentiation
pattern (Figure 19B and data not shown). Each of these primary cell subsets
was then cultured for 14 days (Figure 19C). The analysis of CD34 expression
profile on their progeny showed that each of the primary cell subsets again
produced all other cell subsets and reestablished the parental EML cell
population (Figure 19D and data not shown).
These experiments demonstrated that even after serial sorting and culture,
each of the serially generated EML cell subsets retained the capacity to generate
all other subsets and to re-establish the parental EML cell population, while
maintaining distinct phenotypic and functional properties of each cell subset.
Cumulatively, these findings: (1) demonstrate that each cell subset has the
capacity to generate all other subsets and reestablish the parental EML cell
population, while maintaining distinct features of each cell subset, and (2) confirm
the notion that EML cell line consists of cells alternating between several inter-
convertible and self-renewing metastable states.
3.3 The regulation of metastability of EML cells
The regulation of HSC metastability remains to be fully explored. The
continuous maintenance and metastability of EML cells in an environment that
has no other cellular components (niche-free) make this cell line a truly
exceptional model to study the factors from within the cells (cell intrinsic) and
factors from outside the cells (cell extrinsic) mechanisms that regulate the
metastability of multipotent hematopoietic cells. To address if distinct populations
of BM niche cells can regulate the metastability of EML cells, we initiated co-

42
culture experiments consisting of EML cells with or without specific cells known
to be a part of the BM niche.
The effect of OP9 mesenchymal cells on EML metastability
EML cells were first co-cultured with the murine MSC-like cell line OP9137,
which has been used to study the maintenance and differentiation of ES cells
and mouse and human HSCs 106, 138-143. OP9 cells were established from the
calvaria of op (osteopetrosis) newborn mice. These mice have a mutation in the
gene encoding macrophage colony-stimulating factor (M-CSF) therefore, the
cells do not produce functional M-CSF. OP9 cells have been shown to support
hematopoietic differentiation99, 130-135 and are thought to be mesenchymal stem
cells by some137.
In the OP9 co-cultures a portion of EML cells remains in suspension in close
proximity to OP9 cells, while other cells adhered loosely to OP9 cells and could
be separated from OP9 cells by short trypsinization (which does not affect CD34
expression) (data not shown). In the experiments described below, because OP9
cells grew very well and were healthy in complete EML media, OP9-GFP cells
(produced from the GFP-only retroviral vector MigR1) were used to exclude them
during the analysis of EML cells and their progeny (Figure 20). OP9 cells were
evaluated for endogenous expression of CD34, CD150 and VEGFR1 and did not
express these proteins (Figure 21).
To explore for an effect of OP9 cells on EML cell metastability, total EML cells
were co-cultured with OP9 cells for 8 days as previously described90. The co-
cultures were established by seeding 3 X 10⁴ EML cells/well into multiple 6-well

43
Figure 20. Flow cytometry analysis shows that EML cells can be separated from OP9-GFP cells. A) Unstained EML cells were used to set the negative gate for GFP expression. B) OP9-GFP cells were evaluated for expression of GFP and were 100% positive for GFP expression. C) Backgating of the EML and OP9-GFP populations together show that EML cells can be individually analyzed based on FSC vs. SSC parameters followed by negative selection for GFP expression.
C
A B

44
Figure 21. OP9 cells do not express CD34, CD150 and VEGR1 HSC markers. OP9 cells were stained for CD34, CD150 and VEGFR1. Representative flow cytometry data shows that the OP9 cell line is negative for CD34, CD150 and VEGR1. (n=3)
0.3%
99.7%
99.6%
0.4%
99.0%
98.8%
1.0%
1.2%
99.7%
99.1%
0.3%
0.9%
CD34 CD150 VEGFR1

45
plates containing a confluent monolayer of OP9 cells, and maintained in
complete EML media 99, 105. Every 48 hours of co-culture, the non-adherent and
adherent progeny of EML cells was collected and combined. An aliquot of these
cells was used to analyze for expression of HSC markers and cell cycle profile.
Cells were passaged and/or expanded on alternating days from collection to
avoid over-handling and ensure proper health and cell concentration of both EML
and OP9 cells.
Remarkably, in striking contrast to the same batches of EML cells cultured
without OP9 cells, the EML cells co-cultured with OP9 cells have reproducibly
(n=3) generated progeny containing (a) statistically significantly higher
percentage of CD34neg EML cells, (b) similar percentage of CD34low EML cells
and (c) significantly lower percentage of CD34int and CD34high EML cells than the
same batches of EML cells cultured without OP9 cells (Figure 22 and Figure
23). From this data we can surmise that the presence of OP9 cells both
attenuates the metastability of EML cells by reducing the range of oscillation and
promoting the maintenance of CD34neg and CD34low EML cells.
In order to determine if the ability of OP9 cells to alter population frequencies
of EML CD34 subsets required the continual presence of OP9 cells, or some
transient period of interaction could induce this long lasting change, the EML
cells cultured on OP9 cells for 8 days were removed from co-culture and placed
back in suspension, without OP9 cells. The CD34 expression on the EML cells
returned to suspension approached the parental expression levels after 7 days

46
Figure 22. Representative flow cytometry data of CD34 expression on the progeny of EML cells alone or in the presence of OP9-GFP cells. Cells were harvested and stained with CD34 antibody conjugated to APC and analyzed by flow cytometry. Selection of intact EML cells based on FSC vs. SSC (A) was followed by selection of GFP-FITC negative cells (B). Unstained EML cells grown on OP9-GFP cells were used to establish the negative APC gate for CD34-APC (C). The parental EML cells were evaluated for CD34 expression and split into two populations: 1) EML cells grown in suspension and 2) EML cells grown on OP9-GFP cells (D). Samples were collected every two days from each population and evaluated for CD34 expression.
D
Day 8
D
A B
Day 2
EML with OP9 Elimination of GFPpos cells
EML with OP9 Unstained
C
Day 4 Day 6
Day 0
EML without OP9 EML without OP9 EML without OP9 EML without OP9
EML without OP9
EML with OP9 EML with OP9 EML with OP9 EML with OP9

47
Figure 23. The progeny of EML cells grown on OP9 cells contain a higher percentage of CD34neg and CD34low EML cells. The progeny of EML cells grown on OP9 cells showed a significant increase in the percentage of CD34neg and CD34low EML cells with a concurrent significant decrease in the percentage of CD34int and CD34high EML cells. Values shown are average ± s.d., *p value<0.05, **p value<0.01 (n=3).
EML without OP9-GFPEML with OP9-GFP

48
without OP9 cells (Figure 24A and 24B). This indicates that either contact with
or paracrine signaling from OP9 cells was required for maintenance of the
reduced metastability.
The previous experiment was designed to determine if OP9 cells affected the
frequencies of EML CD34 subsets hence, the course of study was designed as
long as previously required for EML cells to re-establish the parental population
(Figure 16). In order to ensure that the results were not due to an extended
period of instability or adjustment in the presence of OP9 cells, we co-cultured
EML cells on OP9 cells for 20 days as described above. The analysis of CD34
expression on the EML cells from these cultures revealed that EML cells cultured
with OP9 cells still had significantly more CD34neg and CD34low EML cells
compared to EML cells grown in suspension and significantly less CD34int and
CD34high EML cells compared to EML cells grown in suspension (Figure 24C). It
is clear that the OP9 cell effect on EML cell metastability is not due to a period of
instability or adjustment, but is maintained.
Based on the findings that: (1) CD34neg and CD34low EML cells express less
CD150 and more VEGFR1 than CD34int and CD34high EML cells (Figure 8), and
(2) OP9 cells promote the maintenance of more CD34neg and CD34low EML cells
(Figure 23) EML cells grown on OP9 cells were investigated to determine if they
exhibited a change in CD150 and VEGFR1 expression. Interestingly, the progeny
of EML cells from OP9 co-cultures contained a significantly lower percentage of
CD150+ cells than the cells grown without OP9 cells (Figure 25). The reduced
amount of CD150 on the cell surface of EML cells grown on OP9 cells is

49
Figure 24. EML cells were co-cultured with OP9-GFP cells for 8 days and returned to culture without OP9-GFP cells for another 7 days. The CD34 expression on the EML cells returned to suspension for 7 days was approaching the parental expression levels. A) Representative flow cytometry showing the CD34 expression on EML cells in suspension and EML cells returned to suspension following growth on OP9 cells for 7 days. B) The average CD34 expression on the EML cells returned to suspension was approaching the parental expression levels after 7 days without OP9 cells. Values shown are average ± s.d., *p value<0.05, **p value<0.01 (n=3). C) Flow cytometry data shows that the increased percentage of CD34neg and CD34low EML cells when grown on OP9 cells persists for 20 days.
Day 15 Day 20
EML without OP9-GFPEML with OP9-GFP
EML without OP9 EML without OP9
EML with OP9 EML with OP9
EML with OP9

50
Figure 25. EML cells grown in the presence of OP9 cells express significantly less CD150. A) Representative flow cytometry data showing gating for data collection of 8 day progeny of EML cells from OP9-GFP co-culture experiment. All cells were collected and stained for CD150 conjugated to PE-Cy7 or stained for VEGFR1 conjugated to PE. Intact EML cells were selected by FSC vs. SSC profile followed by negative for GFP. Unstained EML cells grown on OP9 cells were used to set the negative gate for PE-Cy7 and PE. B) The average percentage of EML cells expressing CD150 or VEGFR1 following 8 days of suspension or co-culture with OP9 cells shows that there are significantly less EML cells expressing CD150 when EML cells are grown on OP9 cells compared to EML cells grown in suspension. Values shown are average ± s.d., *p value<0.05, **p value<0.01 (n=3).
A
B
EML without OP9-GFP EML with OP9-GFP
EML with OP9
EML with OP9
EML with OP9 EML with OP9 EML with OP9
EML without OP9 EML without OP9 EML without OP9 EML without OP9
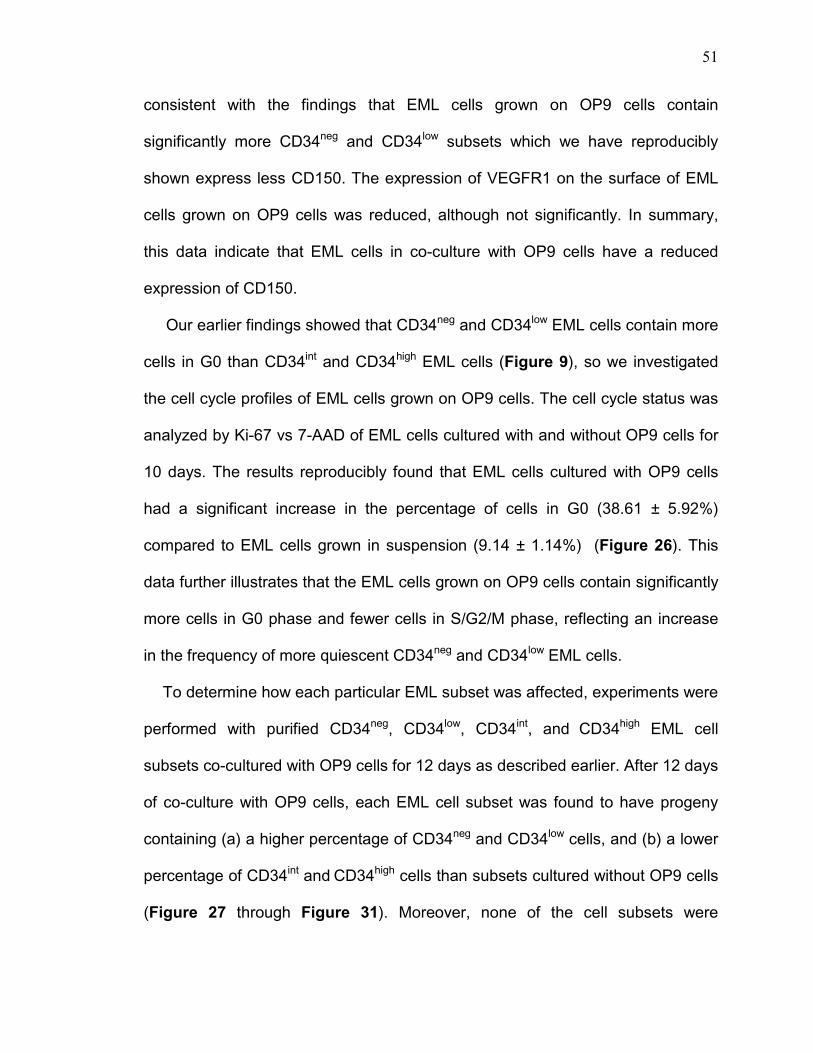
51
consistent with the findings that EML cells grown on OP9 cells contain
significantly more CD34neg and CD34low subsets which we have reproducibly
shown express less CD150. The expression of VEGFR1 on the surface of EML
cells grown on OP9 cells was reduced, although not significantly. In summary,
this data indicate that EML cells in co-culture with OP9 cells have a reduced
expression of CD150.
Our earlier findings showed that CD34neg and CD34low EML cells contain more
cells in G0 than CD34int and CD34high EML cells (Figure 9), so we investigated
the cell cycle profiles of EML cells grown on OP9 cells. The cell cycle status was
analyzed by Ki-67 vs 7-AAD of EML cells cultured with and without OP9 cells for
10 days. The results reproducibly found that EML cells cultured with OP9 cells
had a significant increase in the percentage of cells in G0 (38.61 ± 5.92%)
compared to EML cells grown in suspension (9.14 ± 1.14%) (Figure 26). This
data further illustrates that the EML cells grown on OP9 cells contain significantly
more cells in G0 phase and fewer cells in S/G2/M phase, reflecting an increase
in the frequency of more quiescent CD34neg and CD34low EML cells.
To determine how each particular EML subset was affected, experiments were
performed with purified CD34neg, CD34low, CD34int, and CD34high EML cell
subsets co-cultured with OP9 cells for 12 days as described earlier. After 12 days
of co-culture with OP9 cells, each EML cell subset was found to have progeny
containing (a) a higher percentage of CD34neg and CD34low cells, and (b) a lower
percentage of CD34int and CD34high cells than subsets cultured without OP9 cells
(Figure 27 through Figure 31). Moreover, none of the cell subsets were

52
Figure 26. EML cells co-cultured with OP9-GFP cells contain a higher percentage of cells in the G0 phase of the cell cycle. A) Representative flow cytometry data showing gating for data collection of EML cells from the 8 day OP9-GFP co-culture experiment. All cells were collected from suspension and from concurrent culture on OP9-GFP cells. The collected cells were stained with Ki-67 antibody conjugated to eFluor450 followed by addition of 7-AAD. Intact EML cells were selected by FSC vs. SSC profile followed by negative for GFP. Unstained EML cells grown with OP9-GFP cells were used to set the negative gate for eFluor450 and 7-AAD. B) The average percentage of EML cells in each indicated stage of the cell cycle shows that EML cells grown with OP9-GFP cells contain a significantly higher percentage of cells in G0 than EML cells grown without OP9-GFP cells. Values shown are average ± s.d., *p value<0.05, **p value<0.01 (n=3).
A
B
EML w/out OP9-GFP EML with OP9-GFP
EML without OP9 EML with OP9
EML with OP9 EML with OP9
EML with OP9

53
Figure 27. The analysis of the progeny of CD34neg EML cells cultured in the absence or presence of OP9-GFP cells. Purified CD34neg EML cells were split into two populations: 1) EML cells grown in suspension and 2) EML cells grown on OP9-GFP cells. Every two days, cells from each population were collected and stained with CD34 antibody conjugated to APC. EML cells were selected based on FSC vs. SSC profile followed by negative for GFP expression. Unstained CD34neg cells in suspension were used to establish the negative gate for APC. The flow cytometry data shows that when CD34neg EML cells are grown on OP9 cells, higher percentages of CD34neg and CD34low EML cells are maintained compared to EML cells grown in suspension, whereas CD34int and CD34high EML cells are not.
Day 0
Day 2 Day 4 Day 6 Day 8 Day 10 Day 12
neg

54
Figure 28. The analysis of the progeny of CD34low EML cells cultured in the absence or presence of OP9-GFP cells. Purified CD34low EML cells were split into two populations: 1) EML cells grown in suspension and 2) EML cells grown on OP9-GFP cells. Every two days, cells from each population were collected and stained with CD34 antibody conjugated to APC. EML cells were selected based on FSC vs. SSC profile followed by negative for GFP expression. Unstained CD34low cells in suspension were used to establish the negative gate for APC. The flow cytometry data shows that when CD34low EML cells are grown on OP9 cells, higher percentages of CD34neg and CD34low EML cells are maintained compared to EML cells grown in suspension, whereas CD34int and CD34high EML cells are not.
Day 2 Day 4 Day 6 Day 8 Day 10 Day 12
Day 0
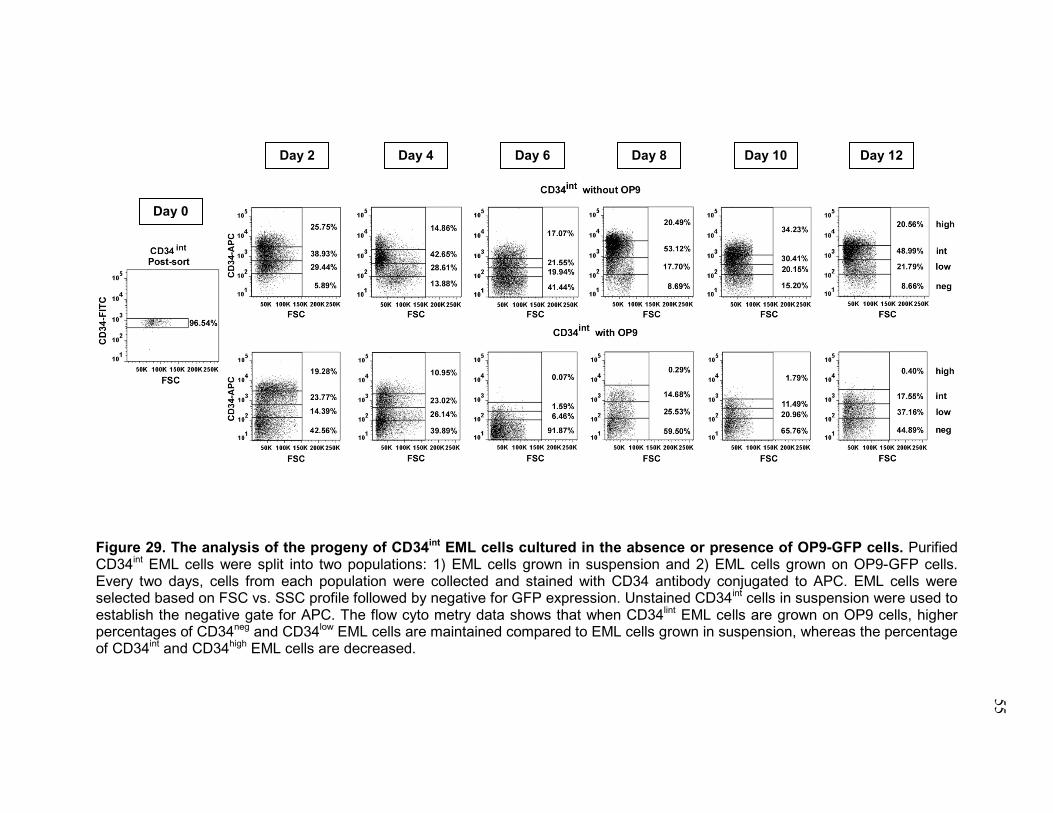
55
Figure 29. The analysis of the progeny of CD34int EML cells cultured in the absence or presence of OP9-GFP cells. Purified CD34int EML cells were split into two populations: 1) EML cells grown in suspension and 2) EML cells grown on OP9-GFP cells. Every two days, cells from each population were collected and stained with CD34 antibody conjugated to APC. EML cells were selected based on FSC vs. SSC profile followed by negative for GFP expression. Unstained CD34int cells in suspension were used to establish the negative gate for APC. The flow cyto metry data shows that when CD34lint EML cells are grown on OP9 cells, higher percentages of CD34neg and CD34low EML cells are maintained compared to EML cells grown in suspension, whereas the percentage of CD34int and CD34high EML cells are decreased.
Day 2 Day 4 Day 6 Day 8 Day 10 Day 12
Day 0

56
Figure 30. The analysis of the progeny of CD34high EML cells cultured in the absence or presence of OP9-GFP cells. Purified CD34high EML cells were split into two populations: 1) EML cells grown in suspension and 2) EML cells grown on OP9-GFP cells. Every two days, cells from each population were collected and stained with C D34 antibody conjugated to APC. EML cells were selected based on FSC vs. SSC profile followed by negative for GFP expression. Unstained CD34 high cells in suspension were used to establish the negative gate for APC. The flow cytometry data shows that when CD34 high EML cells are grown on OP9 cells, higher percentages of CD34neg and CD34low EML cells are maintained compared to EML cells grown in suspension, whereas the percentage of CD34int and CD34high EML cells are decreased.
Day 2 Day 4 Day 6 Day 8 Day 10 Day 12
Day 0

57
Figure 31. OP9 cells promote the maintenance of CD34neg and CD34low EML subsets. The increase in the percentage of CD34neg and CD34low EML subsets occurs with concurrent decline in the percentage of CD34int and CD34high EML subsets.
CD34 neg without OP9-GFP CD34 neg with OP9-GFP
CD34 high without OP9-GFP CD34 high with OP9-GFP
CD34 int without OP9-GFP CD34 int with OP9-GFP
CD34 low without OP9-GFP CD34 low with OP9-GFP

58
able to completely reestablish the CD34 expression profile and cell subset
content of the parental EML cell line.
In total, the results from these studies indicated that OP9 cells affect EML cell
metastability by attenuating and shifting the metastability process towards
increased production and maintenance of CD34neg and CD34low cell subsets, and
decreased production of CD34int and CD34high cell subsets.
The effect of MC3T3 osteoblast cells on EML metastability
Osteoblasts are a large component of the endosteal niche for HSCs. In order
to evaluate if osteoblasts can regulate the metastability of EML cells, EML cells
were co-cultured with subclone 4 (ATCC CRL-2593) of murine osteoblast cell line
MC3T3-E1 (derived from the BM of C57BL/6 mice)144, 145. These cells have been
used extensively to study bone production and osteogenic differentiation145-147
MC3T3 cells were grown in complete growth medium to establish healthy
growing cultures. Flow cytometry analysis showed that MC3T3 cells did not
express c-kit and CD150, but some expressed CD34, Sca-1 and VEGFR1
(Figure 32). Since all EML cells, their subsets and their progeny are 100% c-kit+,
and MC3T3 cells are c-kitneg, in this co-culture system the progeny of EML cells
were analyzed by gating on c-kit+ cells (Figure 33).
Total EML cells were first co-cultured with MC3T3 cells for 14 days as
described above for the OP9 co-cultures. Notably, by day 14 the EML cells co-
cultured with MC3T3 cells reproducibly (n=3) generated progeny containing (a)
significantly higher (p<0.05) percentages of CD34neg cells, (b) similar
percentages of CD34low cells and (c) lower percentages (p<0.05) of CD34int and

59
Figure 32. MC3T3 cells express CD34 and VEGR1 HSC markers but do not express c-kit or CD150. MC3T3 cells were stained for CD34, CD150 and VEGFR1. Representative flow cytometry data shows that MC3T3 cells do not express CD150 and c-kit proteins, but do express CD34 and VEGFR1. (n=3.).

60
Figure 33. Gating strategy ensures evaluation of EML cells. The gating strategy for elimination of MC3T3 cells involved selection of characteristic FSC vs. SSC distribution followed by selection of cells that are positive for c-kit expression.

61
CD34high cells than the populations of EML cells cultured without MC3T3 cells
(Figure 34 and Figure 35). As a result, the overall CD34 expression profile and
cell subset content of day 14 progeny of EML cells from MC3T3 co-cultures
differed from day 14 progeny of EML cells cultured without MC3T3 cells and
parental EML cell line (Figure 35 and data not shown).
In summary, the presence of MC3T3 cells attenuates the metastability of EML
cells and promotes the production and maintenance of CD34neg and CD34low
EML cells.
In order to determine if the effect of MC3T3 cells on EML metastability
required the continual presence of MC3T3 cells or represented a permanent
change in the CD34 distribution, the EML cells cultured on MC3T3 cells for 14
days were removed from co-culture and returned to suspension, without MC3T3
cells. The CD34 expression on the EML cells which had been returned to
suspension for 3 days approximated the CD34 expression of the parental
population (Figure 36A). This experiment was repeated and the 14 day co-
cultured cells were returned to suspension for 7 days. The CD34 expression
onthese EML cells returned to suspension was not significantly different (p<0.05)
from the parental population (Figure 36B), indicating that either permanent
contact with MC3T3 cells, or continued paracrine signaling from MC3T3 cells, is
required for maintenance of the reduced CD34 expression level.
Based upon the finding that MC3T3 cells promote the maintenance of more
CD34neg and CD34low EML cells, it was decided to investigate if EML cells grown
on MC3T3 cells exhibited a change in CD150 and VEGFR1 expression. Similar

62
Figure 34. Representative flow cytometry data of CD34 expression on the progeny of EML cells alone or in the presence of MC3T3 cells. Collected cells were stained with CD34 antibody conjugated to APC and analyzed by flow cytometry. Selection of intact EML cells based on FSC vs. SSC (A) was followed by selection of c-kit positive cells (B). Unstained EML cells grown on MC3T3 cells were used to establish the negative gate for CD34 (C). The parental EML cells were evaluated for CD34 expression and split into two populations: 1) EML cells grown in suspension and 2) EML cells grown on MC3T3 cells (D). Samples were collected from each population every two days for 14 days and evaluated for CD34 expression.
Day 0
Day 2 Day 4 Day 6 Day 8 Day 10 Day 12 Day 14
A B C
D EML without MC3T3
EML without MC3T3
EML without MC3T3 EML without MC3T3 EML without MC3T3 EML without MC3T3 EML without MC3T3 EML without MC3T3
EML with MC3T3 EML with MC3T3 EML with MC3T3 EML with MC3T3 EML with MC3T3 EML with MC3T3 EML with MC3T3

63
Figure 35. The progeny of EML cells grown on MC3T3 cells contain a higher percentage of CD34neg and CD34low EML cells. The progeny of EML cells grown on MC3T3 cells showed a significant increase in the percentage of CD34neg and CD34low EML cells with a concurrent significant decrease in the percentage of CD34int and CD34high EML cells compared to EML cells grown in suspension. Values shown are average shown are average ± s.d., *p value<0.05, **p value<0.01 (n=3).
EML without MC3T3EML with MC3T3

64
Figure 36. EML cells were co-cultured with MC3T3 cells for 14 days and returned to culture without MC3T3 cells for 3 and 7 days. The CD34 expression on the EML cells returned to suspension for 7 days was approaching the parental expression levels. A) Representative flow cytometry of EML cells in suspension and EML cells returned to suspension following growth with MC3T3 cells for 14 days. The CD34 expression on the EML cells returned to suspension was approaching the parental expression levels after 3 days without MC3T3 cells. B) Representative flow cytometry data and graphs of a separate experiment showing that EML cells returned to suspension for 7 days following co-culture with MC3T3 cells for 14 days are not significantly different from the progeny of parental EML cells continuously cultured without MC3T3 cells. Values shown are average ± s.d., *p value<0.05, **p value<0.01 (n=3).
EML without MC3T3EML with MC3T3
EML without MC3T3EML with MC3T3
EML without MC3T3 EML without MC3T3
EML with MC3T3- 14 days EML with MC3T3- 14 days

65
to findings in OP9 co-culture experiments, the 14 day progeny of EML cells from
MC3T3 co-cultures contained a significantly lower percentage of CD150+
cells(14.23 ± 4.20%) than the cells grown without MC3T3 cells (42.40 ± 4.77%)
(Figure 37). The expression of VEGFR1 on EML cells grown on MC3T3 cells
was reduced, although not significantly. These data indicate that EML cells in co-
culture with MC3T3 cells had significantly reduced expression of CD150, as seen
in CD34neg and CD34low subsets of EML cells.
We next investigated the cell cycle profiles of EML cells grown on MC3T3
cells. The progeny of EML cells from MC3T3 co-cultures reproducibly contained
significantly more cells in G0 phase (non-dividing) and fewer cells in S/G2/M
phase (actively dividing) as compared to EML cells grown without MC3T3 cells,
reflecting the increase in percentage of CD34neg and CD34low EML cells (Figure
38).
In the next set of experiments, purified CD34neg, CD34low, CD34int, and
CD34high EML cell subsets were co-cultured with MC3T3 cells for 14 days as
previously described. As seen with EML cells grown on OP9 cells, co-culture of
each EML cell subset with MC3T3 cells generated progeny containing higher
percentages of CD34neg and CD34low cells, as well as lower percentages of
CD34int and CD34high cells compared to subsets cultured without MC3T3 cells
(Figure 39 through Figure 43). Moreover, the CD34 cell subset content of the
parental population was not re-established by any of the cell subsets grown on
MC3T3 cells.

66
Figure 37. EML cells grown in the presence of MC3T3 cells express significantly less CD150. A) Representative flow cytometry data showing gating for data collection of 8 day progeny of EML cells from MC3T3 co-culture experiment. All cells were collected and stained for CD150 conjugated to PE-Cy7 or stained for VEGFR1 conjugated to PE. Intact EML cells were selected by FSC vs. SSC profile followed by positive for c-kit. Unstained EML cells grown on MC3T3 cells were used to set the negative gate for PE-Cy7 and PE. B) The average percentage of EML cells expressing CD150 or VEGFR1 following 14 days of suspension or co-culture with MC3T3 cells shows that there are significantly less EML cells expressing CD150 when EML cells are grown on MC3T3 cells compared to EML cells grown in suspension. Values shown are average ± s.d., *p value<0.05, **p value<0.01 (n=3).
A
B
EML without MC3T3 EML with MC3T3
EML with MC3T3 EML with MC3T3
EML without MC3T3 EML without MC3T3 EML without MC3T3 EML without MC3T3

67
Figure 38. EML cells co-cultured with MC3T3 cells contain a higher percentage of cells in the G0 phase of the cell cycle. A) Representative flow cytometry data showing gating for data collection of EML cells from the 14 day MC3T3 co-culture experiment. All cells were collected from suspension and from concurrent culture on MC3T3 cells. The collected cells were stained with Ki-67 antibody conjugated to eFluor450 followed by addition of 7-AAD. Intact EML cells were selected by FSC vs. SSC profile followed by positive for c-kit. Unstained EML cells grown on MC3T3 cells were used to set the negative gate for eFluor450 and 7-AAD. B) The average percentage of EML cells that are in each indicated stage of the cell cycle shows that EML cells grown on MC3T3 cells have a significantly higher percentage of cells in G0 than EML cells in suspension. Values shown are average ± s.d., *p value<0.05, **p value<0.01 (n=3).
A
B
EML w/out MC3T3 EML with MC3T3
EML with MC3T3
EML without MC3T3 EML without MC3T3
EML with MC3T3

68
Figure 39. The analysis of the progeny of CD34neg EML cells cultured in the absence or presence of MC3T3 cells. Purified CD34neg EML cells were split into two populations: 1) EML cells grown in suspension and 2) EML cells grown on MC3T3 cells. Every two days, cells from each population were collected and stained with CD34 antibody conjugated to APC. EML cells were selected based on FSC vs. SSC profile followed by positive for c-kit expression. Unstained CD34neg cells in suspension were used to establish the negative gate for APC. The flow cytometry data shows that when CD34neg EML cells are grown on MC3T3 cells, higher percentages of CD34neg and CD34low EML cells are maintained compared to EML cells grown in suspension, whereas CD34int and CD34high EML cells are not.
Day 0
Day 4 Day 6 Day 8 Day 14
CD34neg without MC3T3
CD34neg with MC3T3
CD34neg Post-sort
high
int
low
neg
high
int
low
neg

69
Figure 40. The analysis of the progeny of CD34low EML cells cultured in the absence or presence of MC3T3 cells. Purified CD34low EML cells were split into two populations: 1) EML cells grown in suspension and 2) EML cells grown on MC3T3 cells. Every two days, cells from each population were collected and stained with CD34 antibody conjugated to APC. EML cells were selected based on FSC vs. SSC profile followed by positive for c-kit expression. Unstained CD34low cells in suspension were used to establish the negative gate for APC. The flow cytometry data shows that when CD34low EML cells are grown on MC3T3 cells, higher percentages of CD34neg and CD34low EML cells are maintained compared to EML cells grown in suspension, whereas CD34int and CD34high EML cells are not.
Day 0
Day 4 Day 6 Day 8 Day 14
CD34low without MC3T3
CD34low with MC3T3
CD34low Post-sort
high
int
low
neg
high
int
low
neg

70
Figure 41. The analysis of the progeny of CD34int EML cells cultured in the absence or presence of MC3T3 cells. Purified CD34int EML cells were split into two populations: 1) EML cells grown in suspension and 2) EML cells grown on MC3T3 cells. Every two days, cells from each population were collected and stained with CD34 antibody conjugated to APC. EML cells were selected based on FSC vs. SSC profile followed by positive for c-kit expression. Unstained CD34int cells in suspension were used to establish the negative gate for APC. The flow cytometry data shows that when CD34lint EML cells are grown MC3T3 cells, higher percentages of CD34neg and CD34low EML cells are maintained compared to EML cells grown in suspension, whereas the percentage of CD34int and CD34high EML cells are decreased.
Day 0
Day 4 Day 6 Day 8 Day 14
CD34int without MC3T3
CD34int with MC3T3
CD34int Post-sort
high
int
low
neg
high
int
low
neg

71
Figure 42. The analysis of the progeny of CD34high EML cells cultured in the absence or presence of MC3T3 cells. Purified CD34high EML cells were split into two populations: 1) EML cells grown in suspension and 2) EML cells grown on MC3T3 cells. Every two days, cells from each population were collected and stained with CD34 antibody conjugated to APC. EML cells were selected based on FSC vs. SSC profile followed by positive for c-kit expression. Unstained CD34 high cells in suspension were used to establish the negative gate for APC. The flow cytometry data shows that when CD34 high EML cells are grown on MC3T3 cells, higher percentages of CD34neg and CD34low EML cells are maintained compared to EML cells grown in suspension, whereas the percentage of CD34int and CD34high EML cells are decreased.
Day 0
Day 4 Day 6 Day 8 Day 14
CD34high without MC3T3
CD34high with MC3T3
CD34high Post-sort
high
int
low
neg
high
int
low
neg

72
Figure 43. MC3T3 cells promote the maintenance of CD34neg and CD34low EML subsets. The increase in the percentage of CD34neg and CD34low EML subsets occurs with concurrent decline in the percentage of CD34int and CD34high EML subsets. Values shown are average ± s.d., *p value<0.05, **p value<0.01 (n=3).
Per
cen
t C
D34
neg
EM
L c
ells
P
erce
nt
CD
34 n
eg E
ML
cel
ls
Per
cen
t C
D34
neg
EM
L c
ells
P
erce
nt
CD
34 n
eg E
ML
cel
ls
CD34 high without MC3T3 CD34 high with MC3T3
CD34 int without MC3T3 CD34 int with MC3T3
CD34 low without MC3T3 CD34 low with MC3T3
CD34 neg without MC3T3 CD34 neg with MC3T3

73
These results indicate that the metastability of EML cells is attenuated by MC3T3
cells, resulting in the production and maintenance of more CD34neg and CD34low cell
subsets and reduced production and maintenance of CD34int and CD34high EML cells.
The effect of 3T3 fibroblast cells on metastability
NIH/3T3 cells are a fibroblast cell line established in 1962 from Swiss mouse embryo
tissue.148 Fibroblasts are not thought to be a component of the bone marrow niche,
hence this cell line was chosen to investigate if the effect observed is specific to BM
niche cells. NIH/3T3 cells grew well in complete EML media and, with the exception of a
small percentage of VEGFR1+ cells, did not express other HSC markers (Figure 44).
Total EML cells were co-cultured with NIH3T3 cells for 12 days as described for OP9
co-cultures. Since NIH3T3 cells do not express CD34 or c-kit, in this co-culture system
the progeny of EML cells was again analyzed by gating on c-kit+ cells (Figure 45).
These experiments have reproducibly (n=3) shown that co-culture with NIH3T3 cells
had no significant effect (p<0.05) on the production or maintenance of any EML CD34
subsets (Figure 46 and Figure 47).

74
Figure 44. NIH/3T3 cells do not express the HSC markers CD34, c-kit, CD150 or VEGFR1. Representative flow cytometry data showing that NIH/3T3 cells do not express CD34, VEGFR1, CD150 or c-kit. (n=3)

75
Figure 45. Gating strategy for selection of EML cells in co-culture with NIH/3T3 cells. The gating strategy for selection of EML cells involved selection based on FSC vs. SSC profile, followed by selection of cells that are positive for c-kit expression.

76
Figure 46. Representative flow cytometry data of CD34 expression on EML cells with and without NIH/3T3 cells. Collected cells were stained with CD34 antibody conjugated to APC and analyzed by flow cytometry. Selection of intact EML cells based on FSC vs. SSC (A) was followed by selection of c-kit positive cells (B). Unstained EML cells grown on NIH/3T3 cells were used to establish the negative gate for CD34 (C). The parental EML cells were evaluated for CD34 expression and split into two populations: 1) EML cells grown in suspension and 2) EML cells grown on NIH/3T3 cells (D). Samples were collected every two days from each population and evaluated for CD34 expression.
D
Day 0
Day 2 Day 4 Day 6 Day 8
A B C EML with NIH/3T3
EML without NIH/3T3
EML with NIH/3T3
EML without NIH/3T3

77
Figure 47. There is no significant change in the frequency of CD34 subsets when EML cells are grown in the presence of NIH/3T3 cells. EML cells grown on NIH/3T3 cells showed no significant change in all subsets of CD34 expression Values shown are average ± s.d., *p value<0.05, **p value<0.01 (n=3).
EML without NIH/3T3EML with NIH/3T3

78
Chapter 4: Conclusion and Discussion
An apparent and increasingly better characterized phenotypic and functional
heterogeneity among HSCs supports the notion that the hematopoietic system is
maintained by an increasingly complex pool of HSC subsets with distinct
phenotypic and functional characteristics8-20, 22-24, 28. More importantly, some of
these HSC subsets are inter-convertible and exist as “metastable” cell states9, 16-
18, 24, 29-33, 36, 38-43, 45, 47-50, 125. These findings are profoundly changing our
perception of the HSC pool from being a functionally uniform cell population to a
dynamic pool of multiple inter-convertible cell subsets, and are also resurrecting
the question, are the stem cells permanent cellular entities or do they exist in
several states with distinct functional features30, 43?
Studies by Chang et al. and Pina et al. have shown that EML cells reversibly
oscillate between several inter-convertible states, and analyzed certain
characteristics of EML cell metastability based on the range of expression of
HSC marker Sca-132, 36. These studies suggested that inter-convertible
metastable states of EML cells reflect either (a) slowly fluctuating transcriptomes
that may govern reversible priming and cell fate decision, or (b) the oscillation
between self-renewing and committed cell states. Based on differential
expression of CD34 marker we previously reported that EML cells reversibly
oscillate between CD34- and CD34+ metastable cell states34, 35.
In this study we (1) analyzed in depth the phenotypic and functional
characteristics and the extent of EML cell metastability, and (2) determined

79
whether and how specific types of BM niche cells affect the metastability of EML
cells.
Previous studies have clearly indicated that EML cell line is phenotypically and
functionally heterogeneous. The analysis of the expression of an array of HSC
cell surface markers on EML cells has revealed extensive phenotypic cell
heterogeneity within EML cell line, which is due to the coexistence of several cell
subsets with distinct HSC marker expression profiles. Based on the range of
expression of CD34 marker EML cells can be reproducibly divided into CD34neg,
CD34low, CD34int and CD34high cell subsets, which themselves are phenotypically
heterogeneous and exhibit distinct expression patterns of HSC markers.
The in depth analysis of multilineage differentiation potential, cell cycle profile
and proliferation kinetics of CD34neg, CD34low, CD34int and CD34high EML cell
subsets has revealed that each cell subset exhibits distinct cell cycle profile and
the propensity to differentiate into myelo-erythroid lineages.
To study the molecular differences between EML cell subsets we analyzed the
expression of (1) genes important for HSC maintenance and overall
hematopoiesis, (2) hematopoietic cell surface markers, receptors and adhesion
molecules, and (3) erythroid, megakaryocytic, myeloid and lymphoid-lineage
associated genes80, 83, 91 in CD34– and total CD34+ EML cells (containing CD34
low, CD34int and CD34high subsets). Interestingly, the microarray-based
transcriptome analysis has revealed that the hematopoietic transcriptome
signatures of EML cell subsets are quite similar and are less diverse than their
functional heterogeneity suggests.

80
Our in depth studies have revealed further rather extensive phenotypic and
functional cell heterogeneity within EML cell line, which resembles the
heterogeneity within mouse HSC pool. More importantly, our findings strongly
support the notion that EML cell line consists of several cell subsets with distinct
HSC marker expression pattern, cell cycle profile and the propensity to
differentiate.
Since the average frequency of each EML cell subset is stable throughout
multiple cell passages, we sought to determine how all EML cell subsets are
continuously maintained. These studies have reproducibly demonstrated that
each EML cell subset has the capacity to generate all other subsets and to re-
establish the parental EML cell population, while maintaining distinct phenotypic
and functional properties of each cell subset. Moreover, these studies have
clearly demonstrated that even after serial sorting and culture, each of the
serially generated EML cell subsets retained the capacity to generate all other
subsets and re-establish the parental EML cell population, while maintaining
distinct phenotypic and functional properties of each cell subset. Cumulatively,
these results strongly confirm the notion that EML cell line consists of cells
alternating between several inter-convertible and self-renewing metastable states
(Figure 48).
In summary, our results (1) strongly confirm the notion that EML cell line is
phenotypically and functionally heterogeneous, and (2) show that EML cell line
consists of distinct cell subsets that co-exist in a dynamic equilibrium and

81
Figure 48. Model showing the intrinsic metastability of EML cells. In suspension culture, EML cells are intrinsically metastable. EML cells will oscillate between CD34neg, CD34low, CD34int and CD34high expression, with the phenotypic and functional differences for each subset.
VEGFR1
G0
CD150
differentiation
proliferation
EML cells in suspension culture

82
oscillate between self-renewing and inter-convertible metastable states with
distinct phenotypic and functional features.
Within the BM, HSCs reside in at least two specialized niches: (1) an
endosteal niche, consisting of osteoblasts, mesenchymal stem cells (MSCs) and
CXCL12-abundant reticular (CAR) cells, and (2) a perivascular endothelial niche,
consisting of vascular endothelial cells, MSCs, macrophages and CAR cells. The
cellular and molecular components (adhesion proteins, secreted and membrane-
bound cytokines, chemokines, extracellular matrix components, etc.) of BM
niches comprise the so called HSC-niche synapse, which regulates HSC
survival, self-renewal, lineage priming and differentiation47, 66-70, 100-105.
Since the EML cell line is perpetually maintained in the absence of cellular and
molecular components of BM niches (with an exception of SCF)99, 105, our results
support the notion that the dynamic equilibrium of metastable EML cell subsets is
homeostatically maintained and regulated by currently unknown cell intrinsic
mechanisms.
Furthermore, the perpetual metastability of EML cells without the influence of
cellular and molecular components of BM niches points to the cell intrinsic
propensity of EML cells to be metastable.
To study the metastability of EML cells in the biological context of BM niche
components, we sought to determine whether and in what way specific types of
BM niche cells affect EML cell metastability.
The analysis of EML cell metastability in co-culture system with mesenchymal
stem cells and osteoblasts has reproducibly revealed that these niche cell types

83
do affect EML cell metastability by attenuating and shifting the metastability
towards increased production and maintenance of CD34neg and CD34low cell
subsets, and decreased production of the CD34high cell subset (Figure 49).
Additionally, the reduced amount of CD150 on the cell surface of EML cells
grown on mesenchymal stem cells and osteoblasts agrees with the fact that EML
cells grown on mesenchymal stem cells and osteoblasts have significantly more
CD34neg and CD34low EML subsets, which has been shown to express less
CD150.
The experiments designed to determine whether the changes in the
metastability of EML cells, induced by specific types of BM niche cells, are
transient or persist long-term, and are irreversible or not, have shown: (1) that the
observed effects of niche cells on EML cell metastability persist for as long as the
EML cells are in co-culture with these cells, and (2) that the effects of niche cells
on the metastability of EML cells are reversible.
More importantly, these findings infer that that a contact with and/or paracrine
signals from niche cells are responsible for affecting the EML cell metastability.
Our results are the first to show that the EML cell metastability can be influenced
by niche cells, further underscoring and emphasizing the biological relevance of
EML cell line as a unique experimental model to study the characteristics and
regulation of multipotent hematopoietic cell metastability.
Moreover, EML cell line represents a unique experimental model to (1) test the
effects of an array of different cell lines and primary cells, representing specific
types of BM niche cells (osteoblasts, mesenchymal stem cells (MSCs),

84
Figure 49. Model showing the effect of BM niche cells on EML cell metastability. Osteoblasts and mesenchymal cells attenuate the metastability of EML cells towards the production and maintenance of more CD34neg and CD34low EML cells.
G0
CD150
differentiation
proliferation
EML cells in co-culture with BM niche cells
Osteoblasts or mesenchymal cells
85
Vascular endothelial cells, CAR cells, macrophages) on metastability, and (2)
analyze the cumulative effect of several specific types of BM niche cells on the
metastability of EML cells to more appropriately mimic the BM niche
environment. In the latter case total EML cells and all four cell subsets would be
co-cultured with different combinations of niche cell types: (1) Osteoblasts +
MSCs (1:1 cell ratio; partially mimicking the composition of endosteal niche), (2)
Vascular endothelial cells (VECs) + MSCs (1:1 cell ratio; partially mimicking the
composition of perivascular niche), and (3) Osteoblasts + VECs + MSCs (1:1:1
cell ratio; partially mimicking the composition of both niches)54, 73-77, 107-112.
Lastly, our studies are providing a strong platform to (1) determine whether
the specific types of BM niche cells are affecting EML cell metastability through
direct cell-cell contact, via secreted bioactive factors (cytokines, chemokines) or
through both venues, and (2) identify molecular pathways that are involved in
cell-intrinsic and niche-mediated cell extrinsic regulation of metastability.
Since the cellular and molecular components of BM niches regulate the
survival, self-renewal and differentiation of HSCs and multipotent hematopoietic
cells30, 73-76, it is likely that they also are involved in the cell extrinsic regulation of
the metastability of HSCs and multipotent hematopoietic cells. Based on our
findings we hypothesize that under homeostatic conditions the metastability of
BM-residing HSCs is likely very attenuated, due to niche influences. Thus,
removal of HSCs from BM niches could results in increased metastability and
proliferative rate (Figure 50).

86
Metastability Figure 50. Model of HSC metastability in the BM niche. Under normal conditions the cells of the BM niche attenuate the metastability of HSCs. When the niche is perturbed, the HSCs are no longer regulated by the BM niche cells. They respond by exhibiting their intrinsic metastability in response to the insult. When the niche is recovered, the regulation exerted by the niche cells will, once again, attenuate the metastability and promote the maintenance of more quiescent HSCs.
Ost
eob
last
s an
d m
esen
chym
al c
ells
Endosteal niche
HSCs during normal conditions HSCs during niche damage

87
In addition, HSCs may increase their level of metastability after injury to BM
niches or themselves (caused by radiation, chemotherapy agents, or chronic
inflammation) 113, 114. Thus, in response to stress and damage HSCs may
become more metastable to better balance their self-renewal and differentiation.
The ability to “switch” between different inter-convertible functional states
could be enabling HSCs and multipotent hematopoietic cells in general to
respond differently to various external cues and signals from the BM niches and
other hematopoietic cells, as well as to stress, infection, inflammation, and injury
caused by radiation and chemotherapy agents.
Learning how the metastability of multipotent hematopoietic cells is regulated,
and how it can be manipulated, is of central importance for better understanding
of this fascinating cellular process. This knowledge may also provide us the
ability to alter the state of HSCs for more effective bone marrow transplant,
accelerated differentiation of HSCs post-transplant, lower or higher susceptibility
to chemotherapy, etc.
Further studies of EML cells will significantly improve our understanding of the
regulation of the metastability of multipotent hematopoietic cells, and will pave
the way for studying the characteristics and regulation of metastability of primary
HSCs. These studies also have the potential to uncover mechanisms that will
enable us to manipulate the metastability, and “push” multipotent hematopoietic
cells into specific functional states, which could be very useful in the future for ex
vivo manipulation and transplantation of HSCs.

88
In summary, this project has shown that multipotent hematopoietic EML cell
line is phenotypically and functionally heterogeneous, consisting of cells that
oscillate between different self-renewing and inter-convertible metastable states
with distinct phenotypic and functional features. Equally important, our in depth
studies have also shown that the metastability of EML cell line is homeostatically
maintained and seems to be tightly regulated by currently unknown cell intrinsic
mechanisms. Furthermore, our data have shown for the first time and also
support the notion that the heterogeneity and metastability of EML cells can be
affected and manipulated by BM niche cells in a reversible manner.

89
Works Cited
1. Sitnicka, E., Ruscetti, F., Priestley, G., Wolf, N. & Bartelmez, S. Transforming growth factor beta 1 directly and reversibly inhibits the initial cell divisions of long-term repopulating hematopoietic stem cells. Blood 88, 82-88 (1996).
2. Iscove, N.N. & Nawa, K. Hematopoietic stem cells expand during serial
transplantation in vivo without apparent exhaustion. Current Biology 7, 805-808 (1997).
3. Faubert, A., Lessard, J. & Sauvageau, G. Are genetic determinants of
asymmetric stem cell division active in hematopoietic stem cells? Oncogene 23, 7247-7255 (2004).
4. Zon, L.I. Intrinsic and extrinsic control of haematopoietic stem-cell self-
renewal. Nature 453, 306-313 (2008). 5. Brummendorf, T.H., Dragowska, W., Zijlmans, J.M., Thornbury, G. &
Lansdorp, P.M. Asymmetric cell divisions sustain long-term hematopoiesis from single-sorted human fetal liver cells. The Journal of Experimental Medicine 188, 1117-1124 (1998).
6. Takano, H., Ema, H., Sudo, K. & Nakauchi, H. Asymmetric division and
lineage commitment at the level of hematopoietic stem cells: Inference from differentiation in daughter cell and granddaughter cell pairs. The Journal of Experimental Medicine 199, 295-302 (2004).
7. Beckmann, J., Scheitza, S., Wernet, P., Fischer, J.C. & Giebel, B.
Asymmetric cell division within the human hematopoietic stem and progenitor cell compartment: identification of asymmetrically segregating proteins. Blood 109, 5494-5501 (2007).
8. Beerman, I. et al. Functionally distinct hematopoietic stem cells modulate
hematopoietic lineage potential during aging by a mechanism of clonal expansion. Proceedings of the National Academy of Sciences of the United States of America 107, 5465-5470 (2010).
9. Benveniste, P. et al. Intermediate-term hematopoietic stem cells with
extended but time-limited reconstitution potential. Cell Stem Cell 6, 48-58 (2010).
10. Chi, A.W. et al. Identification of Flt3CD150 myeloid progenitors in adult
mouse bone marrow that harbor T lymphoid developmental potential. Blood 118, 2723-2732 (2011).

90
11. Dykstra, B. et al. Long-term propagation of distinct hematopoietic differentiation programs in vivo. Cell Stem Cell 1, 218-229 (2007).
12. Enver, T., Pera, M., Peterson, C. & Andrews, P.W. Stem cell states, fates,
and the rules of attraction. Cell Stem Cell 4, 387-397 (2009). 13. Fleming, W.H. et al. Functional heterogeneity is associated with the cell
cycle status of murine hematopoietic stem cells. The Journal of Cell Biology 122, 897-902 (1993).
14. Glotzbach, J.P. et al. An information theoretic, microfluidic-based single
cell analysis permits identification of subpopulations among putatively homogeneous stem cells. PloS One 6, e21211 (2011).
15. Graf, T. & Stadtfeld, M. Heterogeneity of embryonic and adult stem cells.
Cell Stem Cell 3, 480-483 (2008). 16. Grassinger, J., Haylock, D.N., Williams, B., Olsen, G.H. & Nilsson, S.K.
Phenotypically identical hemopoietic stem cells isolated from different regions of bone marrow have different biologic potential. Blood 116, 3185-3196 (2010).
17. Hayashi, K., Lopes, S.M., Tang, F. & Surani, M.A. Dynamic equilibrium
and heterogeneity of mouse pluripotent stem cells with distinct functional and epigenetic states. Cell Stem Cell 3, 391-401 (2008).
18. Hock, H. Some hematopoietic stem cells are more equal than others. The
Journal of Experimental Medicine 207, 1127-1130 (2010). 19. Kiel, M.J. et al. SLAM family receptors distinguish hematopoietic stem and
progenitor cells and reveal endothelial niches for stem cells. Cell 121, 1109-1121 (2005).
20. Li, L. & Clevers, H. Coexistence of quiescent and active adult stem cells in
mammals. Science (New York, N.Y. 327, 542-545 (2010). 21. MacArthur, B.D. et al. Nanog-dependent feedback loops regulate murine
embryonic stem cell heterogeneity. Nature Cell Biology 14, 1139-1147 (2012).
22. Morita, Y., Ema, H. & Nakauchi, H. Heterogeneity and hierarchy within the
most primitive hematopoietic stem cell compartment. The Journal of Experimental Medicine 207, 1173-1182 (2010).
23. Raaijmakers, M.H. & Scadden, D.T. Divided within: heterogeneity within
adult stem cell pools. Cell 135, 1006-1008 (2008).

91
24. Schroeder, T. Hematopoietic stem cell heterogeneity: subtypes, not unpredictable behavior. Cell Stem Cell 6, 203-207 (2010).
25. Singh, A.M., Hamazaki, T., Hankowski, K.E. & Terada, N. A
heterogeneous expression pattern for Nanog in embryonic stem cells. Stem Cells (Dayton, Ohio) 25, 2534-2542 (2007).
26. Tonge, P.D. et al. Prepatterning in the stem cell compartment. PloS One
5, e10901 (2010). 27. Tonge, P.D., Shigeta, M., Schroeder, T. & Andrews, P.W. Functionally
defined substates within the human embryonic stem cell compartment. Stem Cell Research 7, 145-153 (2011).
28. Wiesmann, A. et al. Expression of CD27 on murine hematopoietic stem
and progenitor cells. Immunity 12, 193-199 (2000). 29. Benz, C. et al. Hematopoietic stem cell subtypes expand differentially
during development and display distinct lymphopoietic programs. Cell Stem Cell 10, 273-283 (2012).
30. Blau, H.M., Brazelton, T.R. & Weimann, J.M. The evolving concept of a
stem cell: entity or function? Cell 105, 829-841 (2001). 31. Challen, G.A., Boles, N.C., Chambers, S.M. & Goodell, M.A. Distinct
hematopoietic stem cell subtypes are differentially regulated by TGF-[beta]1. Cell Stem Cell 6, 265-278 (2010).
32. Chang, H.H., Hemberg, M., Barahona, M., Ingber, D.E. & Huang, S.
Transcriptome-wide noise controls lineage choice in mammalian progenitor cells. Nature 453, 544-547 (2008).
33. Gupta, P.B. et al. Stochastic state transitions give rise to phenotypic
equilibrium in populations of cancer cells. Cell 146, 633-644 (2011). 34. Hanna, J. et al. Metastable pluripotent states in NOD-mouse-derived
ESCs. Cell Stem Cell 4, 513-524 (2009). 35. Malhotra, S. & Kincade, P.W. Wnt-related molecules and signaling
pathway equilibrium in hematopoiesis. Cell Stem Cell 4, 27-36 (2009). 36. Pina, C. et al. Inferring rules of lineage commitment in haematopoiesis.
Nature Cell Biology 14, 287-294 (2012). 37. van Es, J.H. et al. Dll1+ secretory progenitor cells revert to stem cells
upon crypt damage. Nature Cell Biology 14, 1099-1104 (2012).

92
38. Wilson, A. et al. Hematopoietic stem cells reversibly switch from dormancy to self-renewal during homeostasis and repair. Cell 135, 1118-1129 (2008).
39. Wilson, A. et al. Dormant and self-renewing hematopoietic stem cells and
their niches. Annals of the New York Academy of Sciences 1106, 64-75 (2007).
40. Ye, Z.J., Kluger, Y., Lian, Z. & Weissman, S.M. Two types of precursor
cells in a multipotential hematopoietic cell line. Proceedings of the National Academy of Sciences of the United States of America 102, 18461-18466 (2005).
41. Zayas, J., Nachtman, R.G., George, J., Jurecic, R. RNA-Binding Protein
Pum2 Promotes Self-renewal and Suppresses Differentiation of Multipotent Hematopoietic Cells by Maintaining Them in Inactive CD34– State. The Journal of Immunology 178, 81.3 (2007).
42. Zayas, J., George, J., Nachtman, R.G., Jurecic, R. Varying Levels of
CD34 Expression Correlate with Maintenance and Differentiation of HSC/MPP-Like Cell Line EML. ASH Annual Meeting Abstracts 110, 4050 (2007).
43. Zipori, D. The nature of stem cells: state rather than entity. Nature
Reviews. Genetics 5, 873-878 (2004). 44. Ito, T., Tajima, F. & Ogawa, M. Developmental changes of CD34
expression by murine hematopoietic stem cells. Experimental Hematology 28, 1269-1273 (2000).
45. Ogawa, M. Changing phenotypes of hematopoietic stem cells.
Experimental Hematology 30, 3-6 (2002). 46. Ogawa, M. et al. Expression and function of c-kit in hemopoietic progenitor
cells. The Journal of Experimental Medicine 174, 63-71 (1991). 47. Sato, T., Laver, J.H. & Ogawa, M. Reversible expression of CD34 by
murine hematopoietic stem cells. Blood 94, 2548-2554 (1999). 48. Tajima, F., Deguchi, T., Laver, J.H., Zeng, H. & Ogawa, M. Reciprocal
expression of CD38 and CD34 by adult murine hematopoietic stem cells. Blood 97, 2618-2624 (2001).
49. Tajima, F., Sato, T., Laver, J.H. & Ogawa, M. CD34 expression by murine
hematopoietic stem cells mobilized by granulocyte colony-stimulating factor. Blood 96, 1989-1993 (2000).

93
50. Matsuoka, S. et al. CD34 expression on long-term repopulating hematopoietic stem cells changes during developmental stages. Blood 97, 419-425 (2001).
51. Yilmaz, O.H., Kiel, M.J. & Morrison, S.J. SLAM family markers are
conserved among hematopoietic stem cells from old and reconstituted mice and markedly increase their purity. Blood 107, 924-930 (2006).
52. Adams, G.B. et al. Stem cell engraftment at the endosteal niche is
specified by the calcium-sensing receptor. Nature 439, 599-603 (2006). 53. Adams, G.B. & Scadden, D.T. The hematopoietic stem cell in its place.
Nature Immunology 7, 333-337 (2006). 54. Arai, F., Hirao, A. & Suda, T. Regulation of hematopoietic stem cells by
the niche. Trends in Cardiovascular Medicine 15, 75-79 (2005). 55. Arai, F. & Suda, T. Maintenance of quiescent hematopoietic stem cells in
the osteoblastic niche. Annals of the New York Academy of Sciences 1106, 41-53 (2007).
56. Calvi, L.M. et al. Osteoblastic cells regulate the haematopoietic stem cell
niche. Nature 425, 841-846 (2003). 57. Haug, J.S. et al. N-cadherin expression level distinguishes reserved
versus primed states of hematopoietic stem cells. Cell Stem Cell 2, 367-379 (2008).
58. Huang, X., Cho, S. & Spangrude, G.J. Hematopoietic stem cells:
generation and self-renewal. Cell Death and Differentiation 14, 1851-1859 (2007).
59. Jung, Y. et al. Hematopoietic stem cells regulate mesenchymal stromal
cell induction into osteoblasts thereby participating in the formation of the stem cell niche. Stem Cells (Dayton, Ohio) 26, 2042-2051 (2008).
60. Kiel, M.J. & Morrison, S.J. Maintaining hematopoietic stem cells in the
vascular niche. Immunity 25, 862-864 (2006). 61. Kiel, M.J. & Morrison, S.J. Uncertainty in the niches that maintain
haematopoietic stem cells. Nature Reviews 8, 290-301 (2008). 62. Kopp, H.G., Avecilla, S.T., Hooper, A.T. & Rafii, S. The bone marrow
vascular niche: home of HSC differentiation and mobilization. Physiology (Bethesda, Md 20, 349-356 (2005).

94
63. Lo Celso, C. et al. Live-animal tracking of individual haematopoietic stem/progenitor cells in their niche. Nature 457, 92-96 (2009).
64. Parmar, K., Mauch, P., Vergilio, J.A., Sackstein, R. & Down, J.D.
Distribution of hematopoietic stem cells in the bone marrow according to regional hypoxia. Proceedings of the National Academy of Sciences of the United States of America 104, 5431-5436 (2007).
65. Porter, R.L. & Calvi, L.M. Communications between bone cells and
hematopoietic stem cells. Archives of Biochemistry and Biophysics 473, 193-200 (2008).
66. Raaijmakers, M.H. & Scadden, D.T. Evolving concepts on the
microenvironmental niche for hematopoietic stem cells. Current Opinion in Hematology 15, 301-306 (2008).
67. Suda, T., Arai, F. & Hirao, A. Hematopoietic stem cells and their niche.
Trends in Immunology 26, 426-433 (2005). 68. Sugiyama, T., Kohara, H., Noda, M. & Nagasawa, T. Maintenance of the
hematopoietic stem cell pool by CXCL12-CXCR4 chemokine signaling in bone marrow stromal cell niches. Immunity 25, 977-988 (2006).
69. Wilson, A. & Trumpp, A. Bone-marrow haematopoietic-stem-cell niches.
Nature Reviews 6, 93-106 (2006). 70. Xie, Y. et al. Detection of functional haematopoietic stem cell niche using
real-time imaging. Nature 457, 97-101 (2009). 71. Yahata, T. et al. Quiescent human hematopoietic stem cells in the bone
marrow niches organize the hierarchical structure of hematopoiesis. Stem Cells (Dayton, Ohio) 26, 3228-3236 (2008).
72. Yin, T. & Li, L. The stem cell niches in bone. The Journal of Clinical
Investigation 116, 1195-1201 (2006). 73. Zhang, J. & Li, L. Stem cell niche: microenvironment and beyond. The
Journal of Biological Chemistry 283, 9499-9503 (2008). 74. Lymperi, S., Ferraro, F. & Scadden, D.T. The HSC niche concept has
turned 31. Has our knowledge matured? Annals of the New York Academy of Sciences 1192, 12-18 (2010).
75. Ehninger, A. & Trumpp, A. The bone marrow stem cell niche grows up:
mesenchymal stem cells and macrophages move in. The Journal of Experimental Medicine 208, 421-428 (2011).

95
76. Lander, A.D. et al. What does the concept of the stem cell niche really mean today? BMC Biology 10, 19 (2012).
77. Ferraro, F., Celso, C.L. & Scadden, D. Adult stem cels and their niches.
Advances in Experimental Medicine and Biology 695, 155-168 (2010). 78. Aoyama, K. et al. Stromal cell CD9 regulates differentiation of
hematopoietic stem/progenitor cells. Blood 93, 2586-2594 (1999). 79. Arcasoy, M.O., Maun, N.A., Perez, L., Forget, B.G. & Berliner, N.
Erythropoietin mediates terminal granulocytic differentiation of committed myeloid cells with ectopic erythropoietin receptor expression. European Journal of Haematology 67, 77-87 (2001).
80. Bourette, R.P. et al. Suppressor of cytokine signaling 1 interacts with the
macrophage colony-stimulating factor receptor and negatively regulates its proliferation signal. The Journal of Biological Chemistry 276, 22133-22139 (2001).
81. Chiang, M.Y. & Monroe, J.G. BSAP/Pax5A expression blocks survival and
expansion of early myeloid cells implicating its involvement in maintaining commitment to the B-lymphocyte lineage. Blood 94, 3621-3632 (1999).
82. Choong, M.L., Yong, Y.P., Tan, A.C., Luo, B. & Lodish, H.F. LIX: a
chemokine with a role in hematopoietic stem cells maintenance. Cytokine 25, 239-245 (2004).
83. Dickson, G.J., Kwasniewska, A., Mills, K.I., Lappin, T.R. & Thompson, A.
Hoxa6 potentiates short-term hemopoietic cell proliferation and extended self-renewal. Experimental Hematology 37, 322-333 e323 (2009).
84. Du, Y. et al. Mapping gene expression patterns during myeloid
differentiation using the EML hematopoietic progenitor cell line. Experimental Hematology 30, 649-658 (2002).
85. Du, Y., Tsai, S., Keller, J.R. & Williams, S.C. Identification of an
interleukin-3-regulated aldoketo reductase gene in myeloid cells which may function in autocrine regulation of myelopoiesis. The Journal of Biological Chemistry 275, 6724-6732 (2000).
86. Gaines, P. et al. Mouse neutrophils lacking lamin B-receptor expression
exhibit aberrant development and lack critical functional responses. Experimental Hematology 36, 965-976 (2008).

96
87. Jing, X., Infante, J., Nachtman, R.G. & Jurecic, R. E3 ligase FLRF (Rnf41) regulates differentiation of hematopoietic progenitors by governing steady-state levels of cytokine and retinoic acid receptors. Experimental Hematology 36, 1110-1120 (2008).
88. Khanna-Gupta, A. et al. Growth factor independence-1 (Gfi-1) plays a role
in mediating specific granule deficiency (SGD) in a patient lacking a gene-inactivating mutation in the C/EBPepsilon gene. Blood 109, 4181-4190 (2007).
89. Kirito, K., Fox, N. & Kaushansky, K. Thrombopoietin stimulates Hoxb4
expression: an explanation for the favorable effects of TPO on hematopoietic stem cells. Blood 102, 3172-3178 (2003).
90. Kutlesa, S., Zayas, J., Valle, A., Levy, R.B. & Jurecic, R. T-cell
*differentiation of multipotent hematopoietic cell line EML in the OP9-DL1 coculture system. Experimental Hematology 37, 909-923 (2009).
91. Lawson, N.D. & Berliner, N. Representational difference analysis of a
committed myeloid progenitor cell line reveals evidence for bilineage potential. Proceedings of the National Academy of Sciences of the United States of America 95, 10129-10133 (1998).
92. Lawson, N.D., Krause, D.S. & Berliner, N. Normal neutrophil differentiation
and secondary granule gene expression in the EML and MPRO cell lines. Experimental Hematology 26, 1178-1185 (1998).
93. Lee, H.M., Zhang, H., Schulz, V., Tuck, D.P. & Forget, B.G. Downstream
targets of HOXB4 in a cell line model of primitive hematopoietic progenitor cells. Blood 116, 720-730 (2010).
94. Lemieux, M.E. et al. Inactivation of a single copy of Crebbp selectively
alters pre-mRNA processing in mouse hematopoietic stem cells. PloS One 6, e24153 (2011).
95. Ma, X. et al. Development of a murine hematopoietic progenitor
complementary DNA microarray using a subtracted complementary DNA library. Blood 100, 833-844 (2002).
96. Nalbant, D. et al. FAM20: an evolutionarily conserved family of secreted
proteins expressed in hematopoietic cells. BMC Genomics 6, 11 (2005). 97. Pawlak, G., Grasset, M.F., Arnaud, S., Blanchet, J.P. & Mouchiroud, G.
Receptor for macrophage colony-stimulating factor transduces a signal decreasing erythroid potential in the multipotent hematopoietic EML cell line. Experimental Hematology 28, 1164-1173 (2000).

97
98. Si, J. & Collins, S.J. IL-3-induced enhancement of retinoic acid receptor activity is mediated through Stat5, which physically associates with retinoic acid receptors in an IL-3-dependent manner. Blood 100, 4401-4409 (2002).
99. Tsai, S., Bartelmez, S., Sitnicka, E. & Collins, S. Lymphohematopoietic
progenitors immortalized by a retroviral vector harboring a dominant-negative retinoic acid receptor can recapitulate lymphoid, myeloid, and erythroid development. Genes & Development 8, 2831-2841 (1994).
100. Weiler, S.R. et al. D3: a gene induced during myeloid cell differentiation of
Linlo c-Kit+ Sca-1(+) progenitor cells. Blood 93, 527-536 (1999). 101. Williams, S.C. et al. C/EBPepsilon is a myeloid-specific activator of
cytokine, chemokine, and macrophage-colony-stimulating factor receptor genes. The Journal of Biological Chemistry 273, 13493-13501 (1998).
102. Wu, J.Q. et al. Tcf7 is an important regulator of the switch of self-renewal
and differentiation in a multipotential hematopoietic cell line. PLoS Genetics 8, e1002565 (2012).
103. Xia, Z.B., Dai, M.S., Magoulas, C., Broxmeyer, H.E. & Lu, L. Differentially
expressed genes during in vitro differentiation of murine embryonic stem cells transduced with a human erythropoietin receptor cDNA. Journal of Hematotherapy & Stem Cell Research 9, 651-658 (2000).
104. Yokota, T. et al. Growth-supporting activities of fibronectin on
hematopoietic stem/progenitor cells in vitro and in vivo: structural requirement for fibronectin activities of CS1 and cell-binding domains. Blood 91, 3263-3272 (1998).
105. Zayas, J., Spassov, D.S., Nachtman, R.G. & Jurecic, R. Murine
hematopoietic stem cells and multipotent progenitors express truncated intracellular form of c-kit receptor. Stem Cells and Development 17, 343-353 (2008).
106. Schmitt, T.M. & Zuniga-Pflucker, J.C. Induction of T cell development from
hematopoietic progenitor cells by delta-like-1 in vitro. Immunity 17, 749-756 (2002).
107. Omatsu, Y. et al. The essential functions of adipo-osteogenic progenitors
as the hematopoietic stem and progenitor cell niche. Immunity 33, 387-399 (2010).
108. Mendez-Ferrer, S. et al. Mesenchymal and haematopoietic stem cells
form a unique bone marrow niche. Nature 466, 829-834 (2010).

98
109. Chow, A. et al. Bone marrow CD169+ macrophages promote the retention of hematopoietic stem and progenitor cells in the mesenchymal stem cell niche. The Journal of Experimental Medicine 208, 261-271 (2011).
110. Frenette, P.S., Pinho, S., Lucas, D. & Scheiermann, C. Mesenchymal
stem cell: Keystone of the hematopoietic stem cell niche and a stepping-stone for regenerative medicine. Annu Rev Immunol (2013).
111. Kunisaki, Y. & Frenette, P.S. The secrets of the bone marrow niche:
Enigmatic niche brings challenge for HSC expansion. Nature Medicine 18, 864-865 (2012).
112. Nakamura-Ishizu, A. & Suda, T. Hematopoietic stem cell niche: an
interplay among a repertoire of multiple functional niches. Biochimica et Biophysica Acta 1830, 2404-2409 (2013).
113. Yoder, M.C. Aortic tissue as a niche for hematopoiesis. Circulation 125,
565-567 (2012). 114. Massberg, S. et al. Immunosurveillance by hematopoietic progenitor cells
trafficking through blood, lymph, and peripheral tissues. Cell 131, 994-1008 (2007).
115. Adolfsson, J. et al. Upregulation of Flt3 expression within the bone marrow
Lin(-)Sca1(+)c-kit(+) stem cell compartment is accompanied by loss of self-renewal capacity. Immunity 15, 659-669 (2001).
116. Balazs, A.B., Fabian, A.J., Esmon, C.T. & Mulligan, R.C. Endothelial
protein C receptor (CD201) explicitly identifies hematopoietic stem cells in murine bone marrow. Blood 107, 2317-2321 (2006).
117. Christensen, J.L. & Weissman, I.L. Flk-2 is a marker in hematopoietic
stem cell differentiation: a simple method to isolate long-term stem cells. Proceedings of the National Academy of Sciences of the United States of America 98, 14541-14546 (2001).
118. Hattori, K. et al. Placental growth factor reconstitutes hematopoiesis by
recruiting VEGFR1(+) stem cells from bone-marrow microenvironment. Nature Medicine 8, 841-849 (2002).
119. Li, C.L. & Johnson, G.R. Murine hematopoietic stem and progenitor cells:
I. Enrichment and biologic characterization. Blood 85, 1472-1479 (1995). 120. Osawa, M., Hanada, K., Hamada, H. & Nakauchi, H. Long-term
lymphohematopoietic reconstitution by a single CD34-low/negative hematopoietic stem cell. Science (New York, N.Y) 273, 242-245 (1996).

99
121. Yang, L. et al. Identification of Lin(-)Sca1(+)kit(+)CD34(+)Flt3- short-term hematopoietic stem cells capable of rapidly reconstituting and rescuing myeloablated transplant recipients. Blood 105, 2717-2723 (2005).
122. Gerber, H.P. et al. VEGF regulates haematopoietic stem cell survival by
an internal autocrine loop mechanism. Nature 417, 954-958 (2002). 123. Kent, D.G. et al. Prospective isolation and molecular characterization of
hematopoietic stem cells with durable self-renewal potential. Blood 113, 6342-6350 (2009).
124. Wagers, A.J. & Weissman, I.L. Differential expression of alpha2 integrin
separates long-term and short-term reconstituting Lin-/loThy1.1(lo)c-kit+ Sca-1+ hematopoietic stem cells. Stem cells (Dayton, Ohio) 24, 1087-1094 (2006).
125. Goodell, M.A. et al. Dye efflux studies suggest that hematopoietic stem
cells expressing low or undetectable levels of CD34 antigen exist in multiple species. Nature Medicine 3, 1337-1345 (1997).
126. Guo, Y., Lübbert, M. & Engelhardt, M. CD34− Hematopoietic stem cells:
Current concepts and controversies. Stem Cells (Dayton, Ohio) 21, 15-20 (2003).
127. Fukuchi, Y., Ito, M., Shibata, F., Kitamura, T. & Nakajima, H. Activation of
CCAAT/enhancer-binding protein alpha or PU.1 in hematopoietic stem cells leads to their reduced self-renewal and proliferation. Stem Cells (Dayton, Ohio) 26, 3172-3181 (2008).
128. Iwama, A. et al. Use of RDA analysis of knockout mice to identify myeloid
genes regulated in vivo by PU.1 and C/EBPalpha. Nucleic Acids Research 26, 3034-3043 (1998).
129. McDevitt, M.A., Shivdasani, R.A., Fujiwara, Y., Yang, H. & Orkin, S.H. A
"knockdown" mutation created by cis-element gene targeting reveals the dependence of erythroid cell maturation on the level of transcription factor GATA-1. Proceedings of the National Academy of Sciences of the United States of America 94, 6781-6785 (1997).
130. Suh, H.C. et al. C/EBPalpha determines hematopoietic cell fate in
multipotential progenitor cells by inhibiting erythroid differentiation and inducing myeloid differentiation. Blood 107, 4308-4316 (2006).
131. Takahashi, S. et al. Role of GATA-1 in proliferation and differentiation of
definitive erythroid and megakaryocytic cells in vivo. Blood 92, 434-442 (1998).

100
132. Zhang, P. et al. Negative cross-talk between hematopoietic regulators: GATA proteins repress PU.1. Proceedings of the National Academy of Sciences of the United States of America 96, 8705-8710 (1999).
133. Zhang, P. et al. Enhancement of hematopoietic stem cell repopulating
capacity and self-renewal in the absence of the transcription factor C/EBP alpha. Immunity 21, 853-863 (2004).
134. Koschmieder, S., Halmos, B., Levantini, E. & Tenen, D.G. Dysregulation
of the C/EBPalpha differentiation pathway in human cancer. J Clin Oncol 27, 619-628 (2009).
135. Nagamatsu, G. et al. A CTX family cell adhesion molecule, JAM4, is
expressed in stem cell and progenitor cell populations of both male germ cell and hematopoietic cell lineages. Molecular and Cellular Biology 26, 8498-8506 (2006).
136. Iwama, A., Okano, K., Sudo, T., Matsuda, Y. & Suda, T. Molecular cloning
of a novel receptor tyrosine kinase gene, STK, derived from enriched hematopoietic stem cells. Blood 83, 3160-3169 (1994).
137. Gao, J. et al. Characterization of OP9 as authentic mesenchymal stem cell
line. Journal of Genetics and Genomics 37, 475-482 (2010). 138. Nakano, T. In vitro development of hematopoietic system from mouse
embryonic stem cells: a new approach for embryonic hematopoiesis. International Journal of Hematology 65, 1-8 (1996).
139. Nakano, T., Kodama, H. & Honjo, T. In vitro development of primitive and
definitive erythrocytes from different precursors. Science (New York, N.Y) 272, 722-724 (1996).
140. Suwabe, N., Takahashi, S., Nakano, T. & Yamamoto, M. GATA-1
regulates growth and differentiation of definitive erythroid lineage cells during in vitro ES cell differentiation. Blood 92, 4108-4118 (1998).
141. Suzuki, A. & Nakano, T. Development of hematopoietic cells from
embryonic stem cells. International Journal of Hematology 73, 1-5 (2001). 142. La Motte-Mohs, R.N., Herer, E. & Zuniga-Pflucker, J.C. Induction of T-cell
development from human cord blood hematopoietic stem cells by Delta-like 1 in vitro. Blood 105, 1431-1439 (2005).
143. Ji, J. et al. OP9 stroma augments survival of hematopoietic precursors
and progenitors during hematopoietic differentiation from human embryonic stem cells. Stem Cells (Dayton, Ohio) 26, 2485-2495 (2008).

101
144. Kodama H. A., A.Y., Sudo H., Kasai S., Yamamoto S. Establishment of a clonal osteogenic cell line from newborn mouse calvaria. Jpn J Oral Biol. 23, 899-901 (1981).
145. Wang, D. et al. Isolation and characterization of MC3T3-E1 preosteoblast
subclones with distinct in vitro and in vivo differentiation/mineralization potential. Journal of Bone and Mineral Research 14, 893-903 (1999).
146. Sudo, H., Kodama, H.A., Amagai, Y., Yamamoto, S. & Kasai, S. In vitro
differentiation and calcification in a new clonal osteogenic cell line derived from newborn mouse calvaria. The Journal of Cell Biology 96, 191-198 (1983).
147. Ueno, A. et al. Constitutive expression of thrombospondin 1 in MC3T3-E1
osteoblastic cells inhibits mineralization. Journal of Cellular Physiology 209, 322-332 (2006).
148. Todaro, G.J. & Green, H. Quantitative studies of the growth of mouse
embryo cells in culture and their development into established lines. The Journal of Cell Biology 17, 299-313 (1963).