The heavy metal status of South Australian Dolphins · The heavy metal status of South Australian...
62
The heavy metal status of South Australian Dolphins E N V I R O N M E N T P R O T E C T I O N A U T H O R I T Y Photo courtesy of newspix.com.au/ Chris Crerar
-
Upload
truongphuc -
Category
Documents
-
view
214 -
download
0
Transcript of The heavy metal status of South Australian Dolphins · The heavy metal status of South Australian...

The heavy metal status of South Australian Dolphins
E N V I R O N M E N T P R O T E C T I O N A U T H O R I T Y
Phot
o co
urte
sy o
f ne
wsp
ix.c
om.a
u/ C
hris
Cre
rar

The heavy metal status of South Australian dolphins
Authors: Nicole Butterfield and Sam Gaylard
Cover photo: Newspix.com.au/Chris Crerar
The Environment Protection Authority would like to acknowledge and thank the South Australian Museum and the University of Adelaide for access to data and technical input into this document.
For further information please contact:
Environment Protection Authority GPO Box 2607 Adelaide SA 5001
Telephone: (08) 8204 2004 Facsimile: (08) 8204 9393 Free call (country): 1800 623 445
Web site: www.epa.sa.gov.au
E-mail: [email protected]
ISBN 1 921125 01 2
November 2005
© Environment Protection Authority
This document may be reproduced in whole or part for the purpose of study or training, subject to the inclusion of an acknowledgment of the source and to its not being used for commercial purposes or sale. Reproduction for purposes other than those given above requires the prior written permission of the Environment Protection Authority.
Printed on recycled paper
TABLE OF CONTENTS
GLOSSARY ....................................................................................... III
SUMMARY........................................................................................ IV
1 INTRODUCTION.............................................................................1 1.1 Dolphins in South Australia ......................................................... 1 1.2 Metals in the South Australian marine environment ........................... 3 1.3 Bioaccumulation and biomagnification of metals............................... 4 1.4 Metal toxicity ......................................................................... 5 1.5 Other studies on heavy metals in dolphins ...................................... 6
2 METHODS.................................................................................. 11 2.1 Dolphin collection...................................................................11 2.2 Ageing and tooth categories ......................................................11 2.3 Dolphin movements and regional classification................................11 2.4 Dolphin selection....................................................................11 2.5 Quality assurance ...................................................................14 2.6 Statistical analysis ..................................................................15
3 RESULTS ................................................................................... 17 3.1 Re-analysis ...........................................................................17 3.2 Intra-organ metal distribution ....................................................17 3.3 Correlations between mercury and selenium ..................................18 3.4 Cadmium .............................................................................18 3.5 Lead ...................................................................................22 3.6 Mercury ...............................................................................26 3.7 Zinc....................................................................................29
4 DISCUSSION ............................................................................... 33 4.1 Heavy metals in dolphins ..........................................................33
5 CONCLUSIONS ............................................................................ 38
REFERENCES ................................................................................... 39
APPENDIX 1 All results for heavy metals and selenium in dolphins.............. 44
APPENDIX 2 Re-analyses of heavy metals and selenium in dolphin liver ....... 48
APPENDIX 3 Metal concentrations in subsamples of dolphin liver ............... 50
APPENDIX 4 Statistical summary of metals in dolphins by region and species 53
i
List of Figures
Figure 1 Common dolphin (Delphinus delphis) .....................................................2 Figure 2 Bottlenose dolphin (Tursiops spp.) ........................................................3 Figure 3 Distribution of dolphin collection sites.................................................. 13 Figure 4 Correlation between mercury and selenium in dolphin livers ....................... 18 Figure 5 Median, 20th and 80th percentiles of cadmium in dolphin livers ................... 20 Figure 6 Cadmium in South Australian dolphins .................................................. 21 Figure 7 Median, 20th and 80th percentile of lead in dolphin livers.......................... 23 Figure 8 Median, 20th and 80th percentile of lead in dolphin bone .......................... 24 Figure 9 Lead in South Australian dolphins........................................................ 25 Figure 10 Median, 20th and 80th percentiles of mercury in dolphin livers .................... 27 Figure 11 Mercury in South Australian dolphins.................................................... 28 Figure 12 Median, 20th and 80th percentiles of zinc in dolphin livers ......................... 30 Figure 13 Zinc in South Australian dolphins ........................................................ 31 Figure 14 Cadmium concentrations in subsamples from four dolphin livers................... 50 Figure 15 Lead concentrations in subsamples from four dolphin livers ........................ 50 Figure 16 Mercury concentrations in subsamples from four dolphin livers .................... 51 Figure 17 Selenium concentrations in subsamples from four dolphin livers................... 51 Figure 18 Zinc concentrations in subsamples from four dolphin livers......................... 52
List of Tables
Table 1 Summary of studies on cadmium in dolphins.............................................7 Table 2 Summary of studies on lead in dolphins...................................................8 Table 3 Summary of studies on mercury and selenium in dolphins.............................9 Table 4 Summary of studies on zinc in dolphins ................................................. 10 Table 5 Summary of dolphin liver results obtained from the study by Butterfield (2003) 14 Table 6 Summary of dolphin liver results obtained by the EPA (this study)................. 14 Table 7 Summary of all dolphin liver results used in this study............................... 14 Table 8 Summary of dolphin bone results obtained and used by the EPA for this study .. 14 Table 9 Statistical summary of metal concentrations in five subsamples of dolphin
liver ......................................................................................... 17 Table 10 Classification scheme for cadmium in South Australian dolphins ................... 19 Table 11 Classification scheme for lead in South Australian dolphins......................... 22 Table 12 Classification scheme for mercury in South Australian dolphins .................... 26 Table 13 Classification scheme for zinc in South Australian dolphins ......................... 29
ii

GLOSSARY
biological half-life The length of time it takes for the body to eliminate half of the total amount of a chemical after it is absorbed into the body
bioaccumulation When a toxic substance is absorbed via water and food at a greater rate than it is excreted and it accumulates in the body tissues
biomagnification An increase in concentration of a toxic substance through each successive level of the food chain
median The central data point in a distribution, which is used to measure central tendency when there is not a normal distribution
seston Particulate matter such as plankton, organic detritus and inorganic particles such as silt suspended in seawater
standard deviation A measure of the spread of samples from the mean; in simpler terms, the average distance between sample points and the mean
tooth category A classification used to age dolphins, based on the growth layers of their teeth
iii

SUMMARY
There has been growing concern over heavy metal accumulation in South Australian dolphins in recent years. Dolphins are popular and highly valued residents of South Australian waters and play an important role in the marine ecosystem. Human impact on dolphins and their environment has been significant over the years and has led to the development of the Adelaide Dolphin Sanctuary, which aims to ensure their protection. The impact of heavy metals is of particular concern because of potential toxic effects on marine life and on the health and productivity of the entire ecosystem.
Dolphins are at the top of the food chain, and are susceptible to pollutants such as heavy metals that may accumulate through the food chain. Several major industries, wastewater treatment plants and stormwater runoff contribute metals to South Australian coastal waters. However, little is known about the heavy metal status of South Australian dolphins. The Environment Protection Authority (EPA) has undertaken this study to assess this topic, building on previous work by The University of Adelaide and the South Australian Museum (Butterfield 2003).
The main objectives of the study were to:
• assess heavy metal (cadmium, lead, mercury and zinc) and selenium concentrations in liver as well as lead concentrations in bone from dolphins collected along the South Australian coastline
• examine differences in metal concentrations in dolphins from three different regions: Gulf St Vincent, Spencer Gulf and the Southern Ocean
• examine differences in metal concentrations in the three dolphin species found in South Australian waters, the short-beaked common dolphin (Delphinus delphis), Indo-Pacific bottlenose dolphin (Tursiops aduncus) and common bottlenose dolphin (Tursiops truncatus)
• determine the consistency of metal concentrations within dolphin liver to provide confidence that a subsample is representative of the entire organ.
The major findings of the study were:
• Cadmium, lead (in liver) and zinc concentrations in South Australian dolphins were all classified as low; however, there were individual dolphins that had high cadmium, lead or zinc concentrations. This is likely to be due to a combination of natural and anthropogenic sources and inherent variation within the population.
• Lead concentrations were significantly higher in dolphins from Gulf St Vincent than in those from Spencer Gulf. Specifically, bone lead concentrations were classified as moderate in Tursiops spp. collected along the Adelaide metropolitan coastline, which suggests long-term rather then recent exposure. Leaded petrol, which was phased out by 2002, was a possible source.
• Bottlenose dolphins (Tursiops spp.) had higher metal concentrations than the short-beaked common dolphin (D. delphis) from all regions. This may be due to differences in diet, life span, habitat and movements between species. D. delphis
iv

had low metal concentrations and showed no differences between regions, which suggests that they are not a suitable indicator of heavy metals in water.
• Mercury concentrations were classified as high in Tursiops spp. collected in all regions. These were the highest median concentrations in Tursiops spp. observed in available published literature. However, mercury and selenium were correlated in most dolphin livers, indicating that a less toxic complex (HgSe) had formed and that mercury concentrations had minimal effects on dolphin health. It is thought that the mercury is from natural origins.
A small study undertaken as part of this project indicated that metals were evenly distributed in dolphin livers and therefore subsamples taken from any part of the organ are suitably representative of the whole organ.
Future work undertaken by the EPA, government and industry should continue the investigation of the sources of anthropogenic pollution; monitor ambient water and emissions concentrations; license industry; and educate industries, business and the community.
Examining lead concentrations in dolphin bones in another five years’ time may indicate whether the cessation of use of leaded petrol has resulted in a reduction in bioavailable lead in dolphins in the marine environment. A greater understanding of the bioavailability and geological sources of metals in South Australian marine waters might explain some of the regional variability observed in this study. Greater knowledge of the effect of metals on dolphin health (pathology) would provide valuable information on the significance of concentrations.
v


The heavy metal status of South Australian dolphins
1 INTRODUCTION Dolphins are popular and highly valued residents of South Australian waters and play an important role in the marine ecosystem. Human impact on dolphins and their environment (e.g. pollution, stormwater runoff, introduced marine pests, entanglements, noise and rubbish) has increased over the years and has led to the development of the Adelaide Dolphin Sanctuary. The sanctuary covers 118 km2, extending from the Port Adelaide River to Port Gawler. It aims to protect dolphins and their environment by working with community, industry and local and state governments to minimise impacts, educate communities and patrol the area. Heavy metals, which may accumulate through the food chain, are a particular concern because dolphins are long-lived and at the top of the food chain and are therefore susceptible to such pollutants. The effects of heavy metals on marine life may be acute or long-term, and may have a significant impact on the health and productivity of the entire ecosystem.
Dolphins are useful as biological indicators of the heavy metals accumulated from marine waters due to their position in the food chain and long life span. Major industries, wastewater treatment plants and stormwater runoff contribute heavy metals to South Australian coastal waters each year. Currently, there is little known about the heavy metal burden of South Australian dolphins.
The Environment Protection Authority (EPA) has undertaken this study to assess the heavy metal status of dolphins in South Australian coastal waters. Dolphin tissues collected by the South Australian Museum over the last 20 years have supplemented previous work by The University of Adelaide and the South Australian Museum (Butterfield 2003) and the EPA (EPA 2000).
The main objectives of the study were to:
• assess heavy metal concentrations—specifically cadmium (Cd), lead (Pb), mercury (Hg) and zinc (Zn), and also selenium (Se) in liver as well as lead in bone—from dolphins collected along the South Australian coastline
• examine differences in metal concentrations in dolphins from the three different regions: Gulf St Vincent, Spencer Gulf and the Southern Ocean
• examine differences in metal concentrations in the three dolphin species found in South Australian waters: the short-beaked common dolphin (Delphinus delphis), Indo-Pacific bottlenose dolphin (Tursiops aduncus) and common bottlenose dolphin (Tursiops truncatus)
• determine the consistency of metal concentrations within dolphin liver to determine if a subsample is representative of the entire organ.
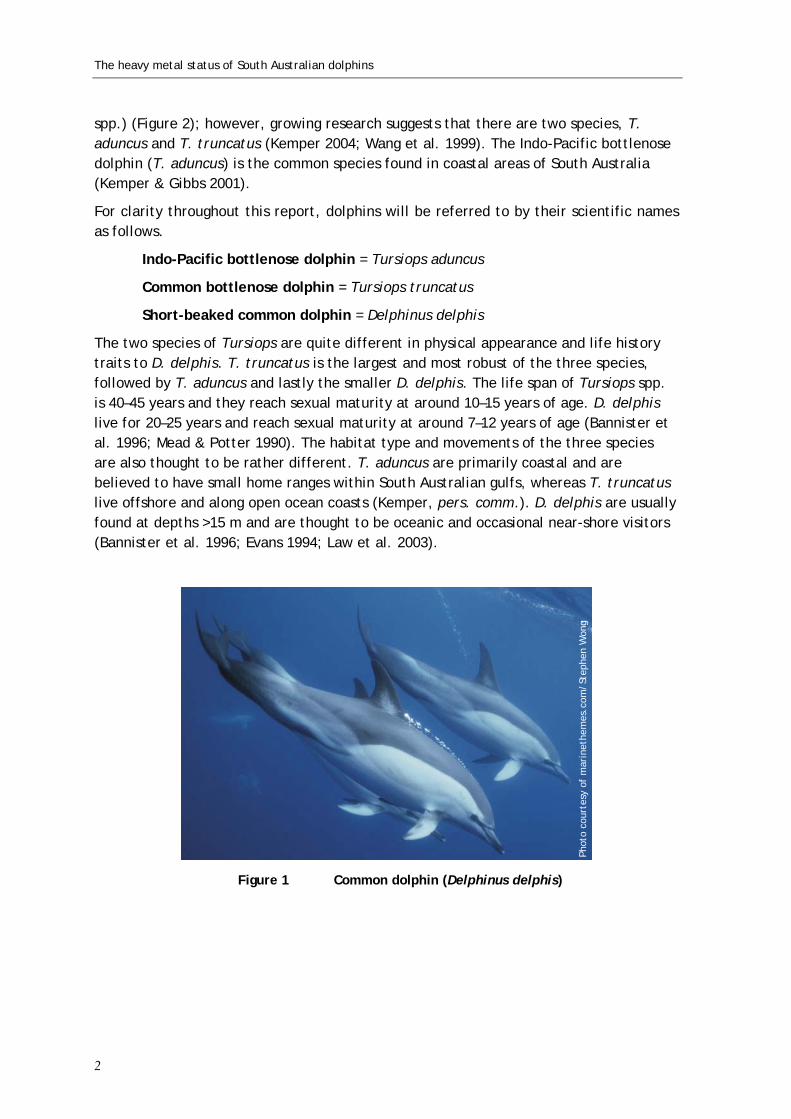
1.1 Dolphins in South Australia Three species of dolphin inhabit South Australian waters: the short-beaked common dolphin (Delphinus delphis) (Figure 1), Indo-Pacific bottlenose dolphin (Tursiops aduncus) and common bottlenose dolphin (Tursiops truncatus) (C. Kemper, pers. comm. 2003). There has been uncertainty over the taxonomy of bottlenose dolphins (Tursiops
1
The heavy metal status of South Australian dolphins
spp.) (Figure 2); however, growing research suggests that there are two species, T. aduncus and T. truncatus (Kemper 2004; Wang et al. 1999). The Indo-Pacific bottlenose dolphin (T. aduncus) is the common species found in coastal areas of South Australia (Kemper & Gibbs 2001).
For clarity throughout this report, dolphins will be referred to by their scientific names as follows.
Indo-Pacific bottlenose dolphin = Tursiops aduncus
Common bottlenose dolphin = Tursiops truncatus
Short-beaked common dolphin = Delphinus delphis
The two species of Tursiops are quite different in physical appearance and life history traits to D. delphis. T. truncatus is the largest and most robust of the three species, followed by T. aduncus and lastly the smaller D. delphis. The life span of Tursiops spp. is 40–45 years and they reach sexual maturity at around 10–15 years of age. D. delphis live for 20–25 years and reach sexual maturity at around 7–12 years of age (Bannister et al. 1996; Mead & Potter 1990). The habitat type and movements of the three species are also thought to be rather different. T. aduncus are primarily coastal and are believed to have small home ranges within South Australian gulfs, whereas T. truncatus live offshore and along open ocean coasts (Kemper, pers. comm.). D. delphis are usually found at depths >15 m and are thought to be oceanic and occasional near-shore visitors (Bannister et al. 1996; Evans 1994; Law et al. 2003).
Phot
o co
urte
sy o
f m
arin
ethe
mes
.com
/Ste
phen
Won
g
Figure 1 Common dolphin (Delphinus delphis)
2

The heavy metal status of South Australian dolphins
Phot
o co
urte
sy o
f C.
D.
Mac
leod
Figure 2 Bottlenose dolphin (Tursiops spp.)
1.2 Metals in the South Australian marine environment Heavy metals occur naturally and enter the environment through geological processes such as weathering of rocks, gassing from soils, forest fires, and emissions from geothermal regions and volcanoes (Clark 1998; Hoffman et al. 1995). However, anthropogenic pollution from industrial activities and agricultural and stormwater runoff is also a major contributor to metals in the environment. The main sources include emissions from the mining, smelting and refining of metals; effluent from sewage treatment works; vehicle emissions; domestic and industrial burning of fossil fuels; and leaching of fertilisers and pesticides.
In South Australia, National Pollutant Inventory data (NPI 2004) revealed the Port Pirie lead and zinc smelter in upper Spencer Gulf as the main source of cadmium, lead, selenium and zinc and a major source of mercury emissions in 2002–03. The smelter has been discharging metals since operations began in 1889; however, some emission levels have declined over the last few years (NPI 2004). Other major industries that discharge metals into Spencer Gulf include OneSteel steelworks and iron ore mines in Whyalla, and the NRG Flinders northern power station in Port Augusta. Gulf St Vincent sources include SA Water Corporation wastewater treatment plants at Glenelg, Bolivar and Christies Beach, the Torrens Island and Pelican Point power stations, and the recently closed Mobil Oil Refinery at Lonsdale (NPI 2004). Other major non-natural sources include stormwater runoff, motor vehicles, commercial shipping and boating, and atmospheric deposition (NPI 2004).
Geological sources of metals are much more difficult to trace, but may influence concentrations in South Australian waters. Mercury, for example, is concentrated in three main geographical regions worldwide (Gustin 2003). One of these locations, along the south-eastern coast of Australia, may increase background concentrations of mercury in South Australia. Cadmium is also released into the environment through natural processes, but little is known about its geology in South Australia. Anthropogenic
3

The heavy metal status of South Australian dolphins
pollution makes a far greater contribution to the atmosphere than geological sources of lead and zinc on a worldwide basis (Clark 1998).
Numerous studies have examined the metal status of South Australian marine sediments, plants, invertebrates and fish. Elevated cadmium, lead, zinc (Ferguson 1983; Harbison 1984; Olsen 1983; Ward & Hutchings 1996; Ward et al. 1982; Ward & Young 1982) and mercury (Olsen 1983) have been found in the sediments of Port Pirie in upper Spencer Gulf, as well as in seagrasses (Ward 1987), some invertebrates and fish (Olsen 1983). A recent study of razorfish and sediments in northern Spencer Gulf found regions of elevated cadmium, lead and zinc in sediments in the northern area of the gulf, and high lead, selenium and zinc levels in razorfish collected near Port Pirie (Corbin & Wade 2004).
Increased lead, mercury and zinc have also been reported in the sediments of the Barker Inlet (Harbison 1984). However, Maher (1985) found that cadmium was undetectable in fish, and lead and zinc were low in invertebrates and fish from Gulf St Vincent. Similarly, Olsen (1983) reported low mercury in invertebrates and fish from Gulf St Vincent, the lower south-east and the Eyre peninsula. Recently, Edwards et al. (2001) also reported low cadmium but high lead in fish from the Barker Inlet. Similarly, the EPA reported an improvement in metal concentrations since 1995–96 and found moderate zinc and low concentrations of cadmium, lead and mercury in the Port River estuary waters (Wade 2002) and fish (EPA 2000). However, Gaylard (2004) showed that there may have been an increase in zinc concentrations in Gulf St Vincent waters between 1995 and 2002.
The assessment of metals in dolphins in this study provides an important link to these studies and contributes valuable information in examining the extent of metal accumulation near the top of a marine food chain.
1.3 Bioaccumulation and biomagnification of metals Heavy metals enter the marine environment through the air, soil and water and are incorporated into the sediments and water. In sediments metals may be bound to particles of clay or organic matter and have very limited biological availability. Micro-organisms may convert these metals into a biologically available form which can then be taken up by benthic (bottom-dwelling) organisms. Other physical and chemical conditions, such as pH and temperature, can affect the bioavailability of metals. The solubility and bioavailability of most metals is thought to increase with a decrease in pH, while an increase in temperature may increase the uptake and elimination of metals (Wang 1987).
The ability of organisms to accumulate metals depends on their rates of uptake, metabolism and excretion. Influential factors include the length of exposure, body size, sex, age, longevity and diet. In this process, known as bioaccumulation, metals accumulate in the body tissues of organisms if the absorption rate exceeds the rate of excretion. Long-lived animals such as dolphins tend to accumulate metals. Therefore, adults can have higher metal loads than younger animals and some metals show an age related increase. Copper is an exception and has shown a steady age related decrease in
4

The heavy metal status of South Australian dolphins
a variety of marine mammals (Bowles 1999; Honda et al. 1983; O’Shea 1999; Wood & Van Vleet 1996), including South Australian dolphins (Butterfield 2003).
The route of metal uptake may be directly through water (gills), air (lungs) or skin, or by diet. Fish predominantly absorb metals directly from the water (gills), whereas the main route of metal accumulation in dolphins is diet. Metal loads can be transferred along the food chain in increasingly higher concentrations through a process known as biomagnification (Bell & Pollard 1989; Jennings et al. 2001). Dolphins are at the top of the food chain and can therefore accumulate high metal loads from their prey. The large quantity of prey consumed and the long life span of dolphins further enhances their capacity to accumulate metals (Aguilar et al. 1999; Bowles 1999).
1.4 Metal toxicity Heavy metals may be harmful to marine life and this, in turn, may have ecological impacts on the marine environment. The toxic effects of metals can be either acute, causing immediate harm (e.g. death), or chronic, having a longer-term effect (e.g. impaired reproduction). Heavy metals such as cadmium, lead and mercury have no known biological function and may be toxic at low concentrations. Cadmium is known to cause skeletal deformities, kidney failure and cancer in mammals (Alloway & Ayres 1997). Lead can cause brain damage; liver and kidney disease; behavioural and growth problems; and birth defects (Hoffman et al. 1995). Mercury has been linked to liver disease (Rawson et al. 1993), liver and kidney failure and brain disorders in marine mammals. Essential elements such as zinc and selenium may also be harmful in excess concentrations.
Physical and chemical conditions in the marine environment, including pH, temperature and salinity, strongly influence the actual toxicity of metals. Metal toxicity is thought to increase with an increase in salinity and temperature, but this is variable between species. The effect of pH is also variable—most studies have found that, with an increase in pH (Wang 1987), cadmium and zinc toxicity increases while lead and mercury toxicity decreases.
Other factors, such as the concentration of metals accumulated and an organism’s ability to store, excrete and detoxify different metals, vary between metals and species and may be further influenced by age, sex and body size. These factors also influence the extent of toxic effects experienced by an organism.
To reduce metal toxicity, one response mechanism used by organisms is the development of compounds called metallothioneins, which bind to metals to reduce their toxicity and regulate the concentrations of essential elements. High exposure to metals increases the activity of metallothioneins and may allow high metal concentrations to accumulate while preventing toxic effects to the organism.
Mercury and selenium may bind together to form the less toxic and more storable mercury selenide (HgSe). The HgSe compound is thought to be an adaptation that evolved in marine mammals to deal with exposure to high mercury concentrations in their environment (Bowles 1999; O’Shea 1999). Similar concentrations of mercury and
5

The heavy metal status of South Australian dolphins
selenium (in a molar ratio close to 1:1) in an organism suggest that the complex has formed, but it is usually only observed with high mercury concentrations (Bowles 1999). Although reported in other organisms, marine mammals are the most well known for having this detoxification strategy.
1.5 Other studies on heavy metals in dolphins Several studies on metals in common and bottlenose dolphins have been published during the past 15 years, as summarised in tables 1–3. Results can be presented as either wet weight (ww) or dry weight (dw), but dry weight is preferable as it provides a more accurate and consistent result. A general conversion method of 73% moisture in liver, 75% in kidney and 8% in bone was used to convert data from these studies to dry weight (if not available), based on moisture content determined in previous studies (Cardellicchio et al. 2002; Frodello et al. 2000; Siebert et al. 1999). Wet and dry weight results are presented, with converted data being identified and used as a guide for comparison.
Comparison of results between studies needs to be undertaken with caution. As previously discussed, variations in dolphin species, age, size, sex and life span may significantly influence heavy metal accumulation. Additionally, many of the international studies target a very limited number of dolphins. Studies such as this one, that investigate a larger data set, will generally show a much greater range of results for the same dolphin population.
6

The heavy metal status of South Australian dolphins
1.5.1 Cadmium
The kidneys are the main storage site of cadmium but it also accumulates in the liver. The literature on cadmium in dolphins is summarised in Table 1. The highest average cadmium concentrations were 113 mg/kg (dw), reported in the kidney of T. truncatus from Argentina (Marcovecchio et al. 1994); and 4.1 mg/kg (dw) in the liver of Tursiops spp. from the Mediterranean Sea (Frodello & Marchand 2001). Previous studies on dolphins from South Australian waters reported an average kidney cadmium concentration of 45.6 mg/kg (dw) in Tursiops spp. and 32.84 mg/kg (dw) in D. delphis (Long et al. 1997), and a median of 28.00 mg/kg (dw) in both Tursiops spp. and D. delphis (EPA 2000).
Table 1 Summary of studies on cadmium in dolphins
Study description Sample size
Data type
Kidney cadmium
concentration (mg/kg)
Liver cadmium concentration
(mg/kg)
Reference
dry weight dry weight
D. delphis and Tursiops spp. from South Australia
15 median mean range
28.00 69.75
0.97–193.00
– EPA 2000
Tursiops spp. from Mediterranean coast of Israel
14 median mean range
1.36* 3.52*
0.24–16.80*
1.52* 1.81*
0.44–4.07*
Roditi-Elasar et al. 2003
Tursiops spp. from Florida
29 mean range
1.30 (n=21) nd–6.40
0.20 nd–1.70
Wood & Van Vleet 1996
Tursiops spp. from NW Mediterranean
4 median 9.10 0.75 Leonzio et al. 1992
D. delphis from South Australia
20 mean 32.84* – Long et al. 1997
Tursiops spp. from South Australia
18 mean 45.60* – Long et al. 1997
Tursiops spp. from Mediterranean Sea
7 mean 3.70 4.10 Frodello & Marchand 2001
Tursiops spp. from Argentina
2 mean 113.60* 2.96* Marcovecchio etal. 1990, 1994
D. delphis from Australia (NSW, Vic, Tas and SA)
24 range nd–130.40* nd–40.70* Kemper et al. 1994
Tursiops spp. from Australia (NSW, Vic, Tas, SA and WA)
21 range nd-102.00* nd-37.00* Kemper et al. 1994
* denotes wet weight data converted to dry weight based on 73% moisture content in liver and 75% in kidney; nd denotes not detected
7

The heavy metal status of South Australian dolphins
1.5.2 Lead
Lead accumulates predominantly in bones but it is also detectable in blood and liver samples. The literature on lead concentrations in dolphin liver and bone is summarised in Table 2. The highest average liver lead concentration was 10 mg/kg (dw), reported in D. delphis from the Mediterranean Sea, and the highest mean bone lead concentration was 6.4 mg/kg (dw) in Tursiops spp. from the Mediterranean Sea (Frodello & Marchand 2001). In previous studies of South Australian Tursiops spp. the average bone lead concentration was 1.68 mg/kg (dw) (Marvanek 1991), and in other parts of Australia bone lead concentrations were mostly below the detection limit (Kemper et al. 1994).
Table 2 Summary of studies on lead in dolphins
Study description Sample size
Data type
Bone lead concentration
(mg/kg)
Liver lead concentration
(mg/kg)
Reference
dry weight dry weight Tursiops spp. from South Australia
13 mean 1.68* – Marvanek 1991
Tursiops spp. from Mediterranean Sea
7 mean 6.40 3.70 Frodello & Marchand 2001
D. delphis from Mediterranean Sea
2 mean 4.30 10.00 Frodello & Marchand 2001
D. delphis and Tursiops spp. from British Isles
3 mean — nd Law et al. 1991
D. delphis from west Atlantic Ocean
15 mean – nd Carvalho et al. 2002
D. delphis from Australia (NSW, Vic, Tas and SA)
22 range nd–1.08* nd–11.10* Kemper et al. 1994
Tursiops spp. from Australia (NSW, Vic, Tas, SA and WA)
10 range – 0.19–3.70* Kemper et al. 1994
* denotes data converted to dry weight based on 8% moisture content in bone and 73% in liver; nd denotes not detected
8
The heavy metal status of South Australian dolphins
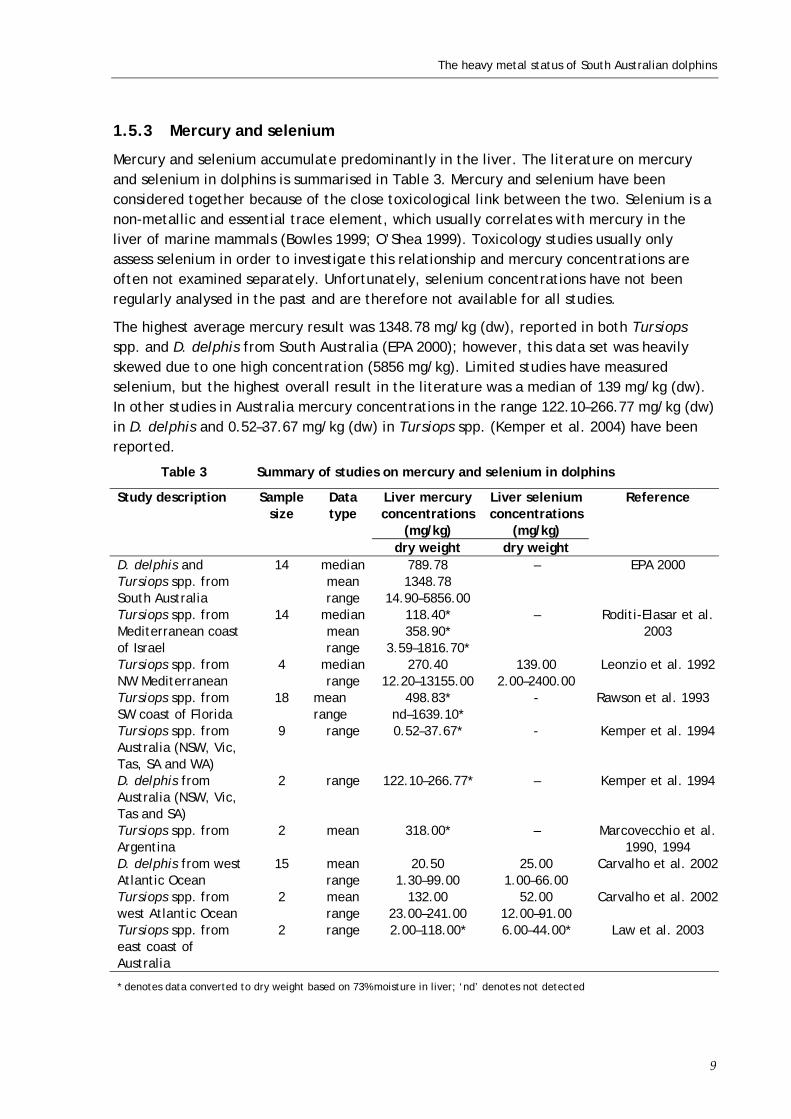
1.5.3 Mercury and selenium
Mercury and selenium accumulate predominantly in the liver. The literature on mercury and selenium in dolphins is summarised in Table 3. Mercury and selenium have been considered together because of the close toxicological link between the two. Selenium is a non-metallic and essential trace element, which usually correlates with mercury in the liver of marine mammals (Bowles 1999; O’Shea 1999). Toxicology studies usually only assess selenium in order to investigate this relationship and mercury concentrations are often not examined separately. Unfortunately, selenium concentrations have not been regularly analysed in the past and are therefore not available for all studies.
The highest average mercury result was 1348.78 mg/kg (dw), reported in both Tursiops spp. and D. delphis from South Australia (EPA 2000); however, this data set was heavily skewed due to one high concentration (5856 mg/kg). Limited studies have measured selenium, but the highest overall result in the literature was a median of 139 mg/kg (dw). In other studies in Australia mercury concentrations in the range 122.10–266.77 mg/kg (dw) in D. delphis and 0.52–37.67 mg/kg (dw) in Tursiops spp. (Kemper et al. 2004) have been reported.
Table 3 Summary of studies on mercury and selenium in dolphins
Study description Sample size
Data type
Liver mercury concentrations
(mg/kg)
Liver selenium concentrations
(mg/kg)
Reference
dry weight dry weight D. delphis and Tursiops spp. from South Australia
14 median mean range
789.78 1348.78
14.90–5856.00
– EPA 2000
Tursiops spp. from Mediterranean coast of Israel
14 median mean range
118.40* 358.90*
3.59–1816.70*
– Roditi-Elasar et al. 2003
Tursiops spp. from NW Mediterranean
4 median range
270.40 12.20–13155.00
139.00 2.00–2400.00
Leonzio et al. 1992
Tursiops spp. from SW coast of Florida
18 mean range
498.83* nd–1639.10*
- Rawson et al. 1993
Tursiops spp. from Australia (NSW, Vic, Tas, SA and WA)
9 range 0.52–37.67* - Kemper et al. 1994
D. delphis from Australia (NSW, Vic, Tas and SA)
2 range 122.10–266.77* – Kemper et al. 1994
Tursiops spp. from Argentina
2 mean 318.00* – Marcovecchio et al. 1990, 1994
D. delphis from west Atlantic Ocean
15 mean range
20.50 1.30–99.00
25.00 1.00–66.00
Carvalho et al. 2002
Tursiops spp. from west Atlantic Ocean
2 mean range
132.00 23.00–241.00
52.00 12.00–91.00
Carvalho et al. 2002
Tursiops spp. from east coast of Australia
2 range 2.00–118.00* 6.00–44.00* Law et al. 2003
* denotes data converted to dry weight based on 73% moisture in liver; ‘nd’ denotes not detected
9
The heavy metal status of South Australian dolphins
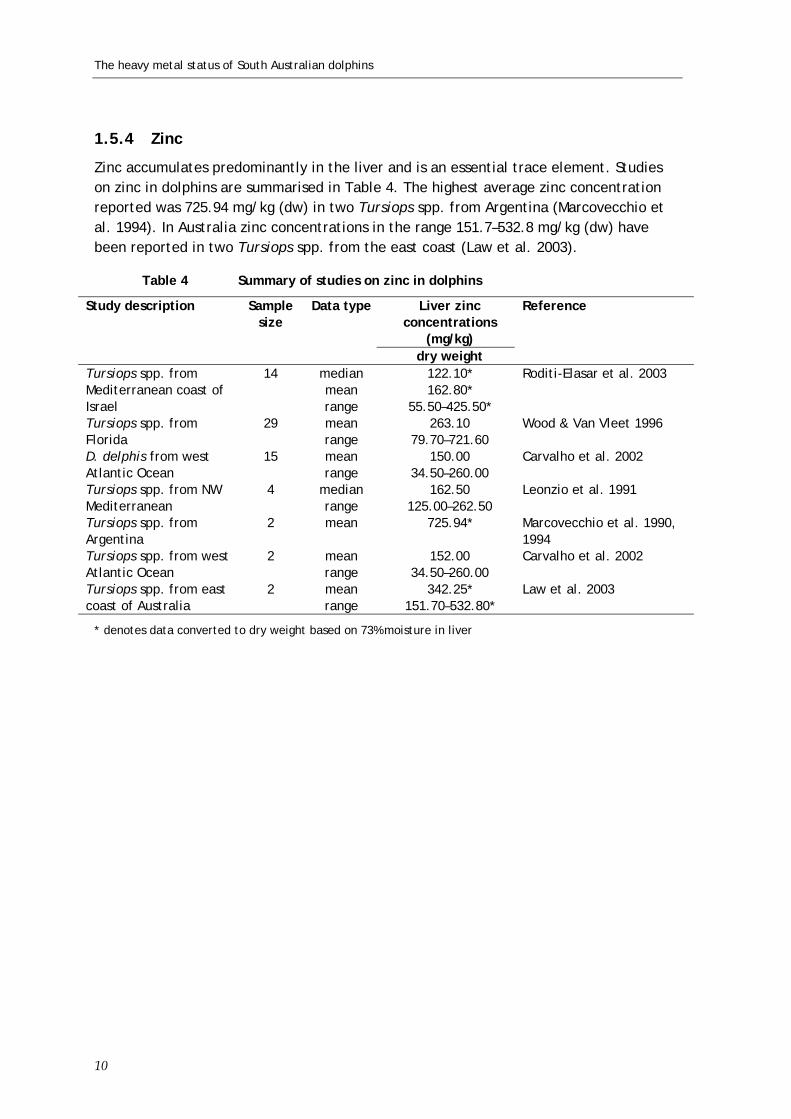
1.5.4 Zinc
Zinc accumulates predominantly in the liver and is an essential trace element. Studies on zinc in dolphins are summarised in Table 4. The highest average zinc concentration reported was 725.94 mg/kg (dw) in two Tursiops spp. from Argentina (Marcovecchio et al. 1994). In Australia zinc concentrations in the range 151.7–532.8 mg/kg (dw) have been reported in two Tursiops spp. from the east coast (Law et al. 2003).
Table 4 Summary of studies on zinc in dolphins
Study description Sample size
Data type Liver zinc concentrations
(mg/kg)
Reference
dry weight Tursiops spp. from Mediterranean coast of Israel
14 median mean range
122.10* 162.80*
55.50–425.50*
Roditi-Elasar et al. 2003
Tursiops spp. from Florida
29 mean range
263.10 79.70–721.60
Wood & Van Vleet 1996
D. delphis from west Atlantic Ocean
15 mean range
150.00 34.50–260.00
Carvalho et al. 2002
Tursiops spp. from NW Mediterranean
4 median range
162.50 125.00–262.50
Leonzio et al. 1991
Tursiops spp. from Argentina
2 mean 725.94* Marcovecchio et al. 1990, 1994
Tursiops spp. from west Atlantic Ocean
2 mean range
152.00 34.50–260.00
Carvalho et al. 2002
Tursiops spp. from east coast of Australia
2 mean range
342.25* 151.70–532.80*
Law et al. 2003
* denotes data converted to dry weight based on 73% moisture in liver
10
The heavy metal status of South Australian dolphins
2 METHODS
2.1 Dolphin collection The South Australian Museum has been collecting dolphin carcasses found along the South Australian coastline since 1988. Causes of death include entanglements, intentional killing, disease and natural causes. Dolphins are dissected by the SA Museum and tissue samples are stored frozen for future studies.
2.2 Ageing and tooth categories The SA Museum assigns tooth categories (1–5) to measure dolphin age. Tooth categories are based on the degree of closure of the tooth pulp cavity, which fills in as cetaceans age (Mead & Potter 1990). Categories range from young dolphins, with a completely open pulp cavity (1), to old dolphins where the pulp cavity has become closed and sometimes worn (5). The exact ages of dolphins in years are not known at this stage. Relative age classes (neonate, calf, juvenile, sub-adult and adult) are allocated by the SA Museum (Kemper & Gibbs 2001) using tooth categories, physical and sexual maturity, body length and external developmental features.
Studies have shown that metal accumulation increases with age in dolphins (Aguilar et al. 1999; Borrell & Aguilar 1999; Itano et al. 1984). Consequently, it is generally accepted that young dolphins do not accurately reflect metal contamination. Only older dolphins with tooth categories 3–5, mostly sub-adults or adults and some juveniles, were targeted for this study. Tooth categories were not available for all dolphins and therefore body length and sexual and physical maturity were sometimes used to determine their relative age.
2.3 Dolphin movements and regional classification The localities where dolphins are collected do not necessarily reflect where they spent most of their time. T. aduncus is likely to live within coastal areas, whereas T. truncatus is thought to live offshore and along open ocean coasts. D. delphis is considered to live near the coast and in offshore habitats (Bannister et al. 1996). Therefore, in this study dolphin collection sites were categorised into three regions, Gulf St Vincent, Spencer Gulf and the Southern Ocean, as used by Butterfield (2003). These regions were based on established knowledge of oceanography (Noye 1984) and marine bioregions (Edyvane & Baker 1995), and information on dolphin movements.
2.4 Dolphin selection Dolphins selected for this study represented the three species T. aduncus, T. truncatus and D. delphis, and were collected from a range of locations along the South Australian coastline (Figure 3).
11

The heavy metal status of South Australian dolphins
Results for dolphins used in this study were obtained from the study by Butterfield (2003) and new analyses that were undertaken by the EPA. Cadmium, lead, mercury, selenium and zinc results for 56 dolphin livers were obtained from Butterfield (2003) (Table 5), and the EPA analysed the same metals in a further 27 dolphin livers (table 6), resulting in a total sample size of 83 dolphin livers (Table 7). Results for lead in 62 dolphin bone samples were obtained by analyses undertaken by the EPA as part of this study (Table 8).
12

The heavy metal status of South Australian dolphins
Figure 3 Distribution of dolphin collection sites
13

The heavy metal status of South Australian dolphins
Table 5 Summary of dolphin liver results obtained from the study by Butterfield (2003)
Region Tursiops aduncus Delphinus delphis Tursiops truncatus Total Gulf St Vincent 11 7 0 18 Spencer Gulf 14 13 1 28 Southern Ocean 0 5 5 10 Total 25 25 6 56
Table 6 Summary of dolphin liver results obtained by the EPA (this study)
Region Tursiops aduncus Delphinus delphis Tursiops truncatus Total Gulf St Vincent 4 1 0 5 Spencer Gulf 1 10 0 11 Southern Ocean 1 10 0 11 Total 6 21 0 27
Table 7 Summary of all dolphin liver results used in this study
Region Tursiops aduncus Delphinus delphis Tursiops truncatus Total Gulf St Vincent 5 8 0 23 Spencer Gulf 15 23 1 39 Southern Ocean 1 15 5 21 Total 31 46 6 83
Table 8 Summary of dolphin bone results obtained and used by the EPA for this study
Region Tursiops aduncus Delphinus delphis Tursiops truncatus Total Gulf St Vincent 11 9 0 20 Spencer Gulf 9 12 1 22 Southern Ocean 0 14 6 20
Total 20 35 7 62
2.5 Quality assurance There were some concerns over the consistency of data from Butterfield (2003) due to the limited quality assurance testing undertaken. Therefore, for quality assurance purposes the EPA re-analysed a selection of 18 dolphin livers that had been previously analysed by Butterfield (2003). Selection for the re-analyses was based on representing a cross-section of ages, sexes, species, locations, regions and high and low metal concentrations from the initial analyses.
2.5.1 Lead in bone
Lead accumulates highest in bone and therefore the regular analysis of liver may not reflect the true body burden. Samples with elevated organ lead may indicate recent exposure (Frodello & Marchand 2001). Bone lead concentrations were analysed in a selection of 62 dolphins to determine the extent of lead accumulation in South Australian dolphins.
14

The heavy metal status of South Australian dolphins
2.5.2 Tissue subsampling and preparation
Procedures developed by the American National Biomonitoring Specimen Bank (Geraci & Lounsbury 1993; Law 1994) for sampling marine mammal tissue for contaminant analysis were followed in this study.
2.5.3 Heavy metal analysis
The Australian Government Analytical Laboratories (AGAL) in Pymble, New South Wales, undertook the analysis for metal concentrations in liver and bone in this study. They are accredited by the National Association of Testing Authorities (NATA) for the reported analyses. Dry weight results were obtained for all metals.
Metal analyses in Butterfield (2003) were obtained at two different laboratories, mercury analysis in liver by AGAL in Sydney and all other metal analysis by Waite Analytical Services in Adelaide. Results were obtained in wet weight and converted to dry weight to be consistent with EPA analyses, using the general conversion method of 73% moisture in liver and 8% moisture in bone. The dry weight values are therefore approximate values due to variation in moisture content between specimens.
2.5.4 Intra-organ metal distribution experiment
Limited information is available on the distribution of metals within individual organs of cetaceans. There is concern that if metals are not distributed evenly, tissue samples may not be representative of the entire organ. Stein et al. (1992) investigated the intra-organ distribution of cadmium, lead and mercury in the livers of five ‘harbour’ porpoises (Phocoena phocoena) and found no significant difference between different parts of the liver. However, this was the only published work available on the intra-organ distribution of metals and it involved a different species. Therefore, a sub-study was undertaken as part of this study to examine the distribution of metals in four dolphin livers. Five subsamples were obtained from different parts of the liver of each of four dolphins, and analysed under identical conditions for a suite of metals. Metal concentrations in the five subsamples from each individual dolphin liver were compared. Dolphins were selected based on having a range of metal concentrations, i.e. low, moderate and high results. This aimed to determine if any variability or partitioning of metals in the liver is concentration dependant.
2.6 Statistical analysis
2.6.1 Descriptive statistics
Metal results for dolphins were highly variable; therefore, descriptive statistics including the mean, median, standard deviation and 20th and 80th percentiles were used to summarise much of the data.
2.6.2 Inferential statistics
The non-parametric Mann-Whitney U test was used to determine if there was a significant difference in metal concentrations between regions and between species. If
15

The heavy metal status of South Australian dolphins
a significant difference was found, the medians were then examined to determine where the differences were located. The paired t-test was used to determine if there was a significant difference between original and re-analysis results for each metal.
In order to determine if a subsample was representative of the whole organ the coefficient of variation was calculated and compared to the variation in the analytical methods. If the coefficient of variation was less than two times the variation in the analytical method then the sampling was deemed to be representative of the whole organ. The variation information used for the analytical procedures is based on multi-laboratory standard deviations within the Standard Methods for the Examination of Water & Wastewater (APHA, 1998) and information from the Australian Government Analytical Laboratories in NSW. The figures used are based on the conservative estimate of 5% variation in moisture content and the drying procedure; 5% variation in the digestion procedure; and between 5-10% for the ICP AES methods depending on each metal (cold vapour AAS for Hg).
16

The heavy metal status of South Australian dolphins
3 RESULTS The measured concentrations of cadmium, lead, mercury, selenium and zinc in the liver, and lead in the bone, of three species of dolphin are reported. Results are expressed as a dry weight. Results for individual dolphins are provided in appendix 1.
3.1 Re-analysis Comparisons between results from original analyses and re-analyses of 18 dolphins are provided in appendix 2. Overall, there was a strong positive correlation and no significant difference between the original and re-analysis results for cadmium (R2= 0.919), lead (R2=0.998), mercury (R2=0.971), selenium (R2=0.906) and zinc (R2=0.767). This confirms that 2003 and 2004 results for the same dolphins were similar and previous analyses are considered reliable for the purpose of this study.
3.2 Intra-organ metal distribution The majority of studies that investigate organ contaminant concentrations take a single, small sample from the organ and assume this sample is representative of the contaminant concentration in the entire organ. Elemental concentrations in five liver subsamples from each of four dolphins were compared to determine whether a single small sample of liver is representative of the metal concentration in the whole liver. The summary data for each dolphin is summarised in Table 9. Overall, concentrations were very consistent, the mean and median did not differ greatly (appendix 3), and in the majority of cases the variation within the liver was less than two times the variation seen in the analytical methods used (35%).
Table 9 Statistical summary of metal concentrations in five subsamples of dolphin liver
Dolphin Species Tooth category
Statistics Cadmium (mg/kg)
Lead (mg/kg)
Mercury (mg/kg)
Selenium (mg/kg)
Zinc (mg/kg)
1 T. aduncus 5 mean 372.00 0.18 6476.00 1694.00 790.00 median 366.00 0.18 6930.00 1800.00 760.00
standard deviation 1.16 0.11 0.48 3.47 93.97 coefficient of variation 82.01 170.08 8.50 31.62 14.55 2 D. delphis 2 mean 1.42 0.03 5.70 10.96 646.00
median 0.93 0.01 5.90 9.90 630.00 standard deviation 0.53 0.05 52.63 15.40 28.81 coefficient of variation 14.48 33.78 16.55 15.98 14.12 3 T. aduncus 1 mean 6.52 0.07 50.20 12.60 144.00
median 6.40 0.05 51.00 13.00 140.00 standard deviation 1.05 0.04 3.11 1.14 16.73 coefficient of variation 16.10 57.14 6.20 9.05 11.62 4 T. aduncus 3 mean 3.66 0.15 318.00 96.40 204.00
median 3.80 0.12 340.00 93.00 200.00 standard deviation 21.68 0.01 903.23 227.44 57.88 coefficient of variation 5.83 6.20 13.95 13.43 7.33
17

The heavy metal status of South Australian dolphins
3.3 Correlations between mercury and selenium As discussed (section 1.4), mercury and selenium are thought to bind in a molar ratio of 1:1 and form the compound mercury selenide (HgSe), which is significantly less toxic than elemental mercury (Bowles 1999; O’Shea 1999). When looking at this relationship, it is necessary to adjust for the different molecular weights of mercury and selenium. As the ratio of the weights is approximately 2.5:1, if there is a 1:1 relationship between the two metals then it would be expected that the concentration is also in a ratio of 2.5:1. The ratios between the molar concentrations of mercury and selenium in dolphin livers in this study were then used to assess the significance of mercury concentrations. There was a strong positive correlation between mercury and selenium in most dolphin livers (y=2.6559x + 61.571, R2 = 0.9356) (Figure 4).
y = 2.6559x + 61.571R2 = 0.9356
0
2000
4000
6000
8000
10000
12000
0 500 1000 1500 2000 2500 3000 3500 4000 4500
Selenium level (mg/kg dw)
Mer
cury
leve
l (m
g/kg
dw
)
Figure 4 Correlation between mercury and selenium in dolphin livers
3.4 Cadmium Dry weight cadmium levels were assessed as low, moderate or high by using tolerance ranges defined in other studies, levels found in other dolphins and the spread of data in this study.
Fujise et al. (1988) suggested that liver cadmium concentrations >70 mg/kg (dw) cause kidney dysfunction in Dall’s Porpoise (Phocoenoides dalli). The limits for cadmium used in this study are based on the tolerance ranges and levels reported in other studies. The classification scheme for cadmium in South Australian dolphins is shown in table 10.
18

The heavy metal status of South Australian dolphins
Table 10 Classification scheme for cadmium in South Australian dolphins
Cadmium mg/kg (dw) Low Moderate High Median or individual <60 60–150 >150
Overall, liver cadmium concentrations were classified as low in all regions. One T. aduncus from Spencer Gulf had a cadmium concentration of 372 mg/kg dw, which was classified as high. A further four T. aduncus from Gulf St Vincent and Spencer Gulf and two T. truncatus from the Southern Ocean had moderate concentrations of cadmium (Figure 5).
Differences between species
Across the entire state T. truncatus had the highest combined median cadmium concentrations, with 35.50 mg/kg, followed by T. aduncus with a median of 11.00 mg/kg and D. delphis with 2.66 mg/kg.
When cadmium concentrations of the three species were broken down into regions, T. aduncus from Gulf St Vincent and Spencer Gulf had significantly higher concentrations than D. delphis from the same regions (Figure 6). In the Southern Ocean there was no significant difference between cadmium concentrations in T. truncatus and D. delphis.
Differences between regions
Cadmium concentrations in Spencer Gulf were significantly higher than in Gulf St Vincent. The median Southern Ocean concentrations were the highest in the study.
T. aduncus from the Southern Ocean had higher cadmium concentrations overall than all other species and regions, with 25.00 mg/kg, closely followed by T. trucatus from the Southern Ocean with 23.00 mg/kg (Figure 6).
There was no significant difference in cadmium concentrations in T. aduncus from Spencer Gulf and those in Gulf St Vincent. D. delphis from the Southern Ocean and Spencer Gulf had higher cadmium concentrations than the same species from Gulf St Vincent.
19

The heavy metal status of South Australian dolphins
0.00
10.00
20.00
30.00
40.00
50.00
60.00
Gulf St Vincent Spencer Gulf Southern Ocean
Cad
miu
m (m
g/kg
)
D. delphis
T. aduncus
T. truncatus
Figure 5 Median (column), 20th and 80th percentiles (whiskers) of cadmium in dolphin livers by region and species1
1 The sample size (number of dolphins) for Gulf St Vincent T. aduncus = 15 and D. delphis = 8; Spencer Gulf T. aduncus =
14 and D. delphis = 23; Southern Ocean T. aduncus = 2, D. delphis = 10 and T. truncatus = 5. There was one T. truncatus recorded in the Spencer Gulf; however, no summary statistics could be performed on one dolphin so this result was omitted from the graphs.
20

The heavy metal status of South Australian dolphins
Figure 6 Cadmium in South Australian dolphins
21

The heavy metal status of South Australian dolphins
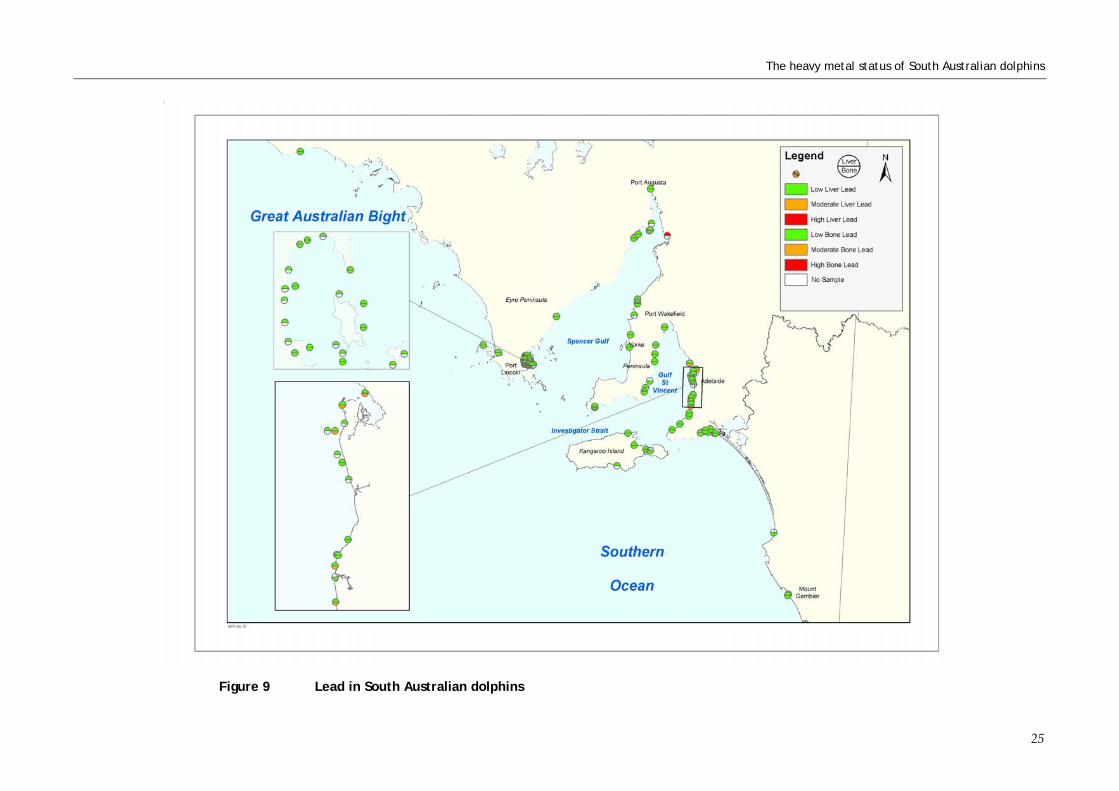
3.5 Lead Elevated concentrations of lead in the liver indicate recent exposure of that dolphin to lead. Longer term storage of lead in dolphins occurs in the bones of the animals and elevated concentrations in bone are usually indicative of historical exposure to lead.
Lead concentrations are typically low, <4 mg/kg (dw) in liver and bone of marine mammals. Based on the available studies of marine mammals worldwide, liver concentrations >10 mg/kg and bone levels >40 mg/kg (dw) are generally regarded as high concentrations. The classification scheme for lead in South Australian dolphins is shown in Table 11.
Table 11 Classification scheme for lead in South Australian dolphins
Lead mg/kg (dw)
Low Moderate High
Median or individual (liver)
<4 4–10 >10
Median or individual (bone)
<4 4–40 >40
Overall, liver lead concentrations were classified as low in all regions. One T. aduncus collected in upper Spencer Gulf had a high liver lead concentration (41 mg/kg) (Figure 7) but all other results were classified as low.
Bone lead concentrations were classified as moderate in Gulf St Vincent T. aduncus, where there were six dolphins with moderate concentrations. All other species and regions were classified as low (Figure 8).
Differences between species
There was a significant difference between the liver lead concentrations in T. aduncus and D. delphis throughout the entire state. The median concentration in T.aduncus (0.52 mg/kg) was over 25 times higher than the median liver lead concentration in D. delphis (0.02 mg/kg). There was also a difference between T. aduncus and T. truncatus across the state.
When the species were broken down into regions liver lead concentrations were significantly higher in T. aduncus than in D. delphis from both Gulf St Vincent and Spencer Gulf. There was no significant difference between liver lead concentrations in T. truncatus from all regions or in D. delphis from the Southern Ocean. Bone lead concentrations across the state were not significantly different between all species. The median bone lead concentration in T. aduncus was 1.95 mg/kg compared to 0.87 mg/kg in D. delphis. This was also the case when the species were separated into regions (figure 9).
22

The heavy metal status of South Australian dolphins
Differences between regions
Liver lead concentrations in all dolphins were signficantly higher in Gulf St Vincent than in both Spencer Gulf and the Southern Ocean. This was also the case with lead concentrations in bone.
When the dolphins were separated into species, there was no significant difference between liver lead in T. aduncus between any regions in the study; however, bone lead concentrations were signficantly higher in Gulf St Vincent than Spencer Gulf. D. delphis and T. truncatus had similar bone and organ lead concentrations in all regions.
0.00
0.50
1.00
1.50
2.00
2.50
3.00
3.50
4.00
Gulf St Vincent Spencer Gulf Southern Ocean
Lead
(liv
er) (
mg/
kg)
D. delphis
T. aduncus
T. truncatus
Figure 7 Median (column), 20th and 80th percentile (whiskers) of lead in dolphin liver by region and species.2
2 The sample size (number of dolphins) for Gulf St Vincent T. aduncus = 15 and D. delphis = 8; Spencer Gulf T. aduncus =
15 and D. delphis = 23; Southern Ocean D. delphis = 15 and T. truncatus = 6.
23

The heavy metal status of South Australian dolphins
0.00
1.00
2.00
3.00
4.00
5.00
6.00
7.00
Gulf St Vincent Spencer Gulf Southern Ocean
Lead
(bon
e) (m
g/kg
)
D. delphis
T. aduncus
T. truncatus
Figure 8 Median (column), 20th and 80th percentile (whiskers) of lead in dolphin bone by region and species.3
3 The sample size (number of dolphins) for Gulf St Vincent T. aduncus = 11 and D. delphis = 9; Spencer Gulf T. aduncus = 9 and D. delphis = 12; Southern Ocean D. delphis = 14 and T. truncatus = 7.
24
The heavy metal status of South Australian dolphins
Figure 9 Lead in South Australian dolphins
25

The heavy metal status of South Australian dolphins
3.6 Mercury Dry weight mercury levels were assessed as low, moderate or high by using tolerance ranges defined in other studies, levels found in other dolphins, and the spread of data in this study.
Liver damage is thought to occur outside the limit of tolerance for mercury (400–1600 mg/kg dw) in the liver of marine mammals (Bowles 1999; Frodello et al. 2000; Law et al. 1991). The classification scheme for mercury in South Australian dolphins is shown in Table 12.
Selenium was not classified individually in this report due to its tendency to bind with mercury in marine mammals. The action of selenium in lessening the toxicity of mercury in marine mammals is outlined in section 3.3.
Table 12 Classification scheme for mercury in South Australian dolphins
Mercury mg/kg (dw)
Low Moderate High
Median or individual
<400 400–1600 >1600
Overall, mercury concentrations were classified as high in T. aduncus from Spencer Gulf and Gulf St Vincent, moderate in T. truncatus in the Southern Ocean and low in D. delphis in all regions (Figure 10).
Differences between species
Mercury concentrations in T. aduncus were significantly higher than in both D. delphis and T. truncatus across the entire state. T. truncatus was also significantly higher than D. delphis.
Species comparisons revealed significantly higher mercury concentrations in T. aduncus from Gulf St Vincent compared to D. delphis. This was most evident when examining the median mercury concentration in T. aduncus (4060 mg/kg), which was over 35 times higher than the median for D. delphis (115 mg/kg) from the same region. This significant difference is also seen in Spencer Gulf. T. truncatus was significantly higher than D. delphis in the Southern Ocean (Figure 11).
Differences between regions
Mercury concentrations across all species in both gulfs were significantly higher than in the Southern Ocean; however, they were not different from each other.
Mercury concentrations were high in T. aduncus from all regions; however, there was no significant difference between regions. The median mercury concentration in Gulf St Vincent was 4060 mg/kg compared to 2135 mg/kg in Spencer Gulf and 3515 mg/kg in the Southern Ocean. Mercury in D. delphis was low across all regions, with medians of 115 mg/kg, 110 mg/kg and 90 mg/kg in Gulf St Vincent, Spencer Gulf and the Southern Ocean respectively.
26

The heavy metal status of South Australian dolphins
T. truncatus mercury concentrations were classified as moderate in the Southern Ocean. There were insufficient T. truncatus samples to compare between regions.
0.00
1000.00
2000.00
3000.00
4000.00
5000.00
6000.00
Gulf St Vincent Spencer Gulf Southern Ocean
Mer
cury
(mg/
kg)
D. delphis
T. aduncus
T. truncatus
Figure 10 Median (column), 20th and 80th percentiles (whiskers) of mercury in dolphin liver by region and species. 4
4 The sample size (number of dolphins) for Gulf St Vincent T. aduncus = 15 and D. delphis = 8; Spencer Gulf T. aduncus =
15 and D. delphis = 23; Southern Ocean D. delphis = 15 and T. truncatus = 6.
27

The heavy metal status of South Australian dolphins
Figure 11 Mercury in South Australian dolphins
28

The heavy metal status of South Australian dolphins
3.7 Zinc Elevated concentrations and the impact of zinc are difficult to assess as it is an essential trace element that is homeostatically controlled in the liver. Law et al. (1991) proposed that zinc is regulated in the liver of marine mammals within a range of 80–400 mg/kg (dw) and that concentrations outside this range indicate an impaired regulatory function within the animal. Therefore, concentrations above this range do not necessarily signify high zinc levels due to anthropogenic pollution.
The classification scheme set in this study took into account both the homoeostatic range and zinc values reported in dolphins in other studies (table 13).
Table 13 Classification scheme for zinc in South Australian dolphins
Zinc mg/kg (dw) Low Moderate High Median or individual
<400 400–700 >700
Overall, zinc concentration was classified as low in all species and across all regions (Figure 12).
One T. aduncus collected in Gulf St Vincent had a zinc concentration of 1530 mg/kg and three collected from Spencer Gulf had 1190, 790 and 999 mg/kg respectively. These individual dolphins were classified as high.
Differences between species
There were no significant differences between the zinc concentrations in the different species of dolphin throughout the state. When the dolphins were separated into regions the Spencer Gulf T. aduncus had significantly higher zinc concentrations than D. delphis from the same region.
Generally, all zinc results were very similar between species. The average concentration in Southern Ocean T. aduncus was highest in the study region, with 435 mg/kg; however, this was using a limited data set (n = 2). This value was higher than the other two species in the Southern Ocean, with D. delphis having 166.50 mg/kg and T. truncatus 190 mg/kg. The median Spencer Gulf T. aduncus was also higher than D. delphis and T. truncatus from all regions (Figure 13).
Differences between regions
When comparing all dolphins there were no significant differences between the three regions. However, after separating the dolphins by regions the Gulf St Vincent T. aduncus had significantly higher zinc concentrations than those in Spencer Gulf.
29

The heavy metal status of South Australian dolphins
0.00
100.00
200.00
300.00
400.00
500.00
600.00
700.00
Gulf St Vincent Spencer Gulf Southern Ocean
Zinc
(mg/
kg)
D. delphis
T. aduncus
T. truncatus
Figure 12 Median (column), 20th and 80th percentiles (whiskers) of zinc in dolphin liver by region and species5
5 The sample size (number of dolphins) for Gulf St Vincent T. aduncus = 15 and D. delphis = 8; Spencer Gulf T. aduncus =
15 and D. delphis = 23; Southern Ocean D. delphis = 15 and T. truncatus = 5.
30

The heavy metal status of South Australian dolphins
Figure 13 Zinc in South Australian dolphins
31


The heavy metal status of South Australian dolphins—
4 DISCUSSION
4.1 Heavy metals in dolphins The majority of dolphins in this study had metal concentrations comparable to dolphins from other parts of the world. Out of the 83 dolphin livers and 62 dolphin bones analysed, there were 30 high concentrations, which may be due to natural variation within the population, natural sources of metals in the marine environment or anthropogenic pollution. There were significant differences between metal concentrations in dolphins from different regions, which suggests local sources of metals from geological and anthropogenic activities are being accumulated in dolphin tissues.
The main anthropogenic sources in Spencer Gulf are the lead–zinc smelter at Port Pirie, the steelworks at Whyalla and the power stations at Port Augusta, which discharge large quantities of metals (NPI 2004). The oil refinery at Lonsdale (no longer operational); SA Water Corporation wastewater treatment plants at Glenelg, Bolivar and Christies Beach; and the Torrens Island and Pelican Point power stations and urban stormwater discharge various quantities of metals into Gulf St Vincent (NPI 2004).
4.1.1 Re-analysis
There was no significant difference between original and re-analysis results, which confirms that 2003 and 2004 results for the same dolphins were similar, and previous analyses are considered reliable for the purpose of this study.
4.1.2 Intra-organ metal distribution
Overall, there was little difference between metal concentrations in subsamples, which suggests that metals are distributed evenly in these dolphin livers. The small variations observed were not unexpected, as there is likely to be some variation in the liver itself and in the analytical procedure, especially when analysing very small concentrations (e.g. lead). Findings provide confidence in analysing subsamples to represent whole dolphin livers in this study and suggest that the results from numerous other studies may be reliable.
4.1.3 Differences between species
When dolphins were compared on a state level it was shown that for every metal T. aduncus had significantly higher metal concentrations than D. delphis. Even when broken down into regions T. aduncus had significantly higher cadmium and mercury levels than D. delphis in both gulfs and also higher cadmium, lead (liver) and zinc in Spencer Gulf. The metal concentrations in T. truncatus were also higher than in D. delphis; however, low sample numbers have meant that these results have been treated with caution. These facts clearly show that there are vast differences in metal concentrations between Tursiops spp. and D. delphis, which should be taken into consideration when using these species as indicators of metals in the environment.
33

The heavy metal status of South Australian dolphins
This variation in metal accumulation was most likely due to the differences in diet, life span, movements and habitat use of the three species. The most important factor is diet, as this is the main route of metal accumulation in marine mammals (Aguilar et al. 1999). T. aduncus have a varied diet and generally feed on bottom- or near-bottom-dwelling cephalopods and fish. In contrast, the diet of D. delphis is more specialised and they typically feed on oceanic shoaling fish and cephalopods (Kemper & Gibbs 2001). It is considered that in South Australia T. aduncus consume more cephalopods than fish and D. delphis the opposite (Kemper & Gibbs 2001). Cephalopods, particularly squid, are known to have naturally elevated levels of cadmium (Honda et al. 1983; O’Shea 1999; Szefer et al. 1994), and high concentrations have been reported in marine mammals that consume a high proportion of squid (Caurant & Amiard-Triquet 1995; Leonzio et al. 1992; Marcovecchio et al. 1994; Szefer et al. 1994).
The life span of the species is also a significant factor in metal loads, as most metals accumulate over time. Tursiops spp. live for 40–45 years whereas D. delphis live for around half that at just 20–25 years (Bannister et al. 1996; Mead & Potter 1990). Therefore, it is not surprising that Tursiops spp. accumulates higher metal loads than D. delphis.
Differences in the habitat use and movements of the three species may also influence their metal accumulation. T. aduncus typically live in coastal areas which are often close to urban and industrial metal sources and are therefore most likely to be exposed to higher metal loads. D. delphis usually live further away from the coast and are less likely to be influenced by local metal sources. Based on the known habitat ranges of the dolphins (section 1.1.), T. truncatus should be less likely to accumulate metals than T. aduncus. However, findings of this study suggest that T. truncatus may have a wider range than originally thought, or the higher accumulation of metals is primarily due to life span and food source rather than habitat use.
4.1.4 Regional status of dolphins
There were noticeable differences in metal concentrations in dolphins from the three different regions. In summary, one or both of the gulfs had higher metal concentrations for all metals except zinc, where there was no difference. Similar metal concentrations in D. delphis from all regions supports the theory that they have large home ranges and may use coastal and offshore habitats. The absence of regional differences and the low metal concentrations in D. delphis suggest that they may not be suitable bio-indicators of the targeted metals for specific regions. Consequently, D. delphis are generally only discussed when they show noticeable regional differences. The differences between dolphin species are important when considering results from individual sites.
4.1.5 Cadmium
Overall, cadmium was classified as low in all regions and in most of the dolphins tested was not at a level that would be indicative of impacts on health. There was one high cadmium concentration of 372 mg/kg found in the liver of one T. aduncus collected in Port Victoria, Spencer Gulf. The effect of this cadmium level on the dolphin is unknown;
34

The heavy metal status of South Australian dolphins—
however, it has been established that metallothioneins6 bind cadmium molecules and act to protect against cadmium toxicity in marine invertebrates and fish (Bustamante et al. 2001; Cosson et al. 1991). Moderate cadmium concentrations were found in six Tursiops spp. collected around the less industrialised lower portions of both gulfs, around Yorke Peninsula, Port Lincoln and Kangaroo Island, suggesting naturally high background levels of cadmium.
General regional comparisons strengthen this hypothesis. First, the cadmium levels seen in the Southern Ocean and Spencer Gulf were significantly higher than in Gulf St Vincent. The median concentrations in all species from the Southern Ocean were higher than those seen in the same species in the other regions. Given the lack of sources of cadmium in this region it would follow that the levels seen are due to the accumulation of low levels naturally present in Southern Australian waters. Also, Tursiops spp. had significantly higher cadmium concentrations than D. delphis across the state and in both gulfs. As stated above, Tursiops spp. feeds more on cephalopods than fish, while in D. delphis it is the opposite. Long et al. (1997) showed that the southern calamary (Sepioteuthis australis) contained over 100 times more mean cadmium than other dolphin prey species, such as the six specimens examined. This may be contributing to higher cadmium in Tursiops spp. than in D. delphis.
4.1.6 Lead
Overall, liver lead levels were low in all regions and most dolphins. However, one T. aduncus from Port Germein in upper Spencer Gulf had a high liver concentration (41 mg/kg dw), higher than all other dolphins in this study and more than double the highest concentration reported in the literature (18 mg/kg dw). Bone is the target organ for long-term lead accumulation (90% of total body burden) (Bowles 1999; O’Shea 1999) and therefore this high liver concentration was particularly surprising. It may be indicative of a recent lead exposure in that dolphin but, unfortunately, there was no bone available from the dolphin for analysis. Overall, Spencer Gulf dolphins had low lead concentrations.
Bone lead concentrations were moderate in Gulf St Vincent T. aduncus but low in all other regions and dolphins. Moderate lead concentrations found in the bone of six Gulf St Vincent T. aduncus were higher than results reported from other parts of Australia (Kemper et al. 1994), Japan (Honda et al. 1982) and the British Isles (Law et al. 1991).
Dolphins from Gulf St Vincent had significantly higher liver lead levels than both other regions. The bone lead concentrations also showed a similar pattern, with Gulf St Vincent and Spencer Gulf results significantly higher than those from dolphins in the Southern Ocean. As stated above, lead concentrations in the liver are indicative of recent exposure and the longer term storage is in the bone. This is consistent with the use of leaded petrol, predominantly in Gulf St Vincent. The moderate classification of lead in bone would imply that the levels seen in Gulf St Vincent are historical and may decline if there is in fact a relationship to the phasing out of leaded petrol in 2002.
6 Metallothioneins: a biochemical mechanism where the bioavailability of a metal ion is reduced by binding it to another
molecule, which can lead to excretion or storage.
35

The heavy metal status of South Australian dolphins
4.1.7 Mercury
Mercury was classified as high in T. aduncus across the state, and was significantly higher than the D. delphis mercury concentrations in all regions, which were classified as low. Both the Gulf St Vincent and Spencer Gulf mercury concentrations were significantly higher than those from the Southern Ocean. However, two TursIops spp. with high mercury concentrations were collected in the Southern Ocean, specifically at Fowlers Bay on the west coast and Pelican Point in the far South East. Even though it is a small sample size, it would imply a natural source of mercury not just within the gulfs. One possibility is that South Australian waters may receive geological mercury from a mercuriferous belt located along the eastern coast of Australia (Working Group on Mercury in Fish 1980). In fact, Olsen (1983) reported higher concentrations of mercury, lead and cadmium in the oceanic surface waters of South Neptune Island in South Australia than in oceans from other parts of the world. The explanation for this was that natural sources of metals may reach South Australian coastal waters through mixing with oceanic waters at certain times of year (Olsen 1983). Additionally, there are very few mercury discharges into the marine environment (NPI 2004), implying that the origin of the mercury in these dolphins is from natural sources. High mercury concentrations reported in dolphins from the Mediterranean Sea are also thought to be due to naturally high background levels (O’Shea 1999).
The high mercury concentrations found in individual dolphins in this study (up to 9080 mg/kg) were much higher than those reported in dolphins from other parts of Australia (Kemper et al. 1994), Argentina (Marcovecchio et al. 1994), the west Atlantic Ocean (Carvalho et al. 2002), Mediterranean coast of Israel (Roditi-Elasar et al. 2003), Florida (Rawson et al. 1993) and the north-west Mediterranean (Leonzio et al. 1992). Only one particular dolphin from all these studies showed a higher mercury concentration (13,155.60 mg/kg dw), but even in this case the median was still well below the median concentration of Tursiops spp. in this study.
It is interesting to note that, while mercury of natural origin is thought to be the source of the very high mercury levels in Tursiops spp., similarly long-lived marine species at a similar trophic level do not show the same level of mercury accumulation. Olsen (1983) measured two great white sharks of unknown age (over 5 m and 3 m long respectively) and both had mercury concentrations less than 10 mg/kg wet weight (~less than 40 mg/kg dw if the 73% conversion factor is used). The same report states that school sharks, which have been documented to live 45+ years, had mercury concentrations of 4.5 mg/kg wet weight(~17 mg/kg dw). Leonzio et al. (1992) suggested that fish have an additional excretory system in the gills but dolphins, being mammals, lack this ability, which may result in an accumulation of mercury. Although this may account for the elevated results in Tursiops spp., it would follow that D. delphis would also lack this excretory system and therefore accumulate similar mercury levels. However, this study has shown that even with the lower life span of D. delphis taken into account, this is not the case. The explanation may lie in a combination of the lack of excretory system, the elevated natural mercury in southern Australian waters, the longer life span of Tursiops spp., the different favoured prey items and their respective mercury accumulation, and the differing habitat use by the two species. Further research is needed to ascertain
36

The heavy metal status of South Australian dolphins—
why the Tursiops spp. from this study have accumulated considerably more mercury than in other regions of the world.
Overall, these findings suggest high natural background levels of mercury in South Australian coastal waters, with possible small contributions from anthropogenic sources such as the lead–zinc smelter in Port Pirie and wastewater treatment plants.
4.1.8 Mercury and selenium relationship
The positive relationship found between mercury and selenium in most dolphin livers was expected. This has been reported in many D. delphis, T. truncatus (Leonzio et al. 1992) and other marine mammals (Endo et al. 2002; Leonzio et al. 1992). The formation of the HgSe complex is believed to explain how there have been occurrences of very high mercury concentrations in marine mammals with no obvious effects on their health (Bowles 1999; O’Shea 1999). Adverse effects from mercury presumably occur when the mercury concentration is high and exceeds the selenium concentration so that there is some mercury left unbound (Bowles 1999). Most dolphins in this study had a mercury to selenium molar ratio close to 1:1, which indicates that a HgSe complex had formed, resulting in no observable adverse effects from mercury in these dolphins. In addition to the mercury and selenium relationship Betti & Nigro (1996) have reported that Tursiops spp. cells are more resistant to DNA damage than both human and rat cells, which may be an artefact of the high exposure encountered by this species.
4.1.9 Zinc
Overall, zinc was classified as low for all regions, suggesting that it is not a concern for the South Australian dolphins studied. One T. aduncus collected in North Haven, Gulf St Vincent, and three from Spencer Gulf had high zinc concentrations. High zinc concentrations found in several dolphins in this study are higher than the maximum reported in dolphins from the British Isles (155 mg/kg) (Law et al. 1991), Argentina (725 mg/kg) (Marcovecchio et al. 1994), west Atlantic Coast (481 mg/kg) (Carvalho et al. 2002), Florida (721 mg/kg) (Wood & Van Vleet 1996) and the Mediterranean coast of Israel (425 mg/kg) (Roditi-Elasar et al. 2003). However, zinc concentrations are difficult to assess as zinc is an essential trace element that is regulated in the liver. High levels are thought to be due to impairment of this regulatory function and do not necessarily reflect high levels of zinc in the environment (Law et al. 1991).
37

The heavy metal status of South Australian dolphins
5 CONCLUSIONS The major findings of this study were:
• Cadmium, lead and zinc concentrations in South Australian dolphins were all classified as low; however, there were individual dolphins that had high cadmium, lead or zinc concentrations. This is probably due to a combination of natural and anthropogenic sources and inherent variation within the population.
• Tursiops spp. had higher metal concentrations than D. Delphis from all regions. This may be due to differences in diet, life span, habitat and movements between species. D. delphis had low metal concentrations and showed no differences between regions, which suggests that they are not a suitable bio-indicator for the targeted metals or regions.
• Mercury concentrations were classified as high in T. aduncus collected in all regions. These were the highest median concentrations seen in Tursiops spp. from anywhere in the world in available published literature. However, mercury and selenium concentrations were correlated in most dolphin livers, indicating that a less toxic complex (HgSe) had formed and that mercury concentrations had minimal impact on dolphin health.
• Lead concentrations were significantly higher in dolphins from Gulf St Vincent than in those from Spencer Gulf. Specifically, lead concentrations in bone were moderate in Tursiops spp. collected along the Adelaide metropolitan coastline, which suggests long-term rather then recent exposure. Leaded petrol, which was phased out prior to 2002, may be a possible source.
• A small study undertaken as part of this project indicated that metals were evenly distributed in dolphin livers and therefore subsamples taken from any part of the organ are suitably representative of the whole organ.
Future work undertaken by the EPA, government and industry will include continuing to investigate the sources of anthropogenic pollution; monitoring ambient water and discharges; and educating industry, business and the community.
Examining lead concentrations in dolphin bones in another five years’ time may indicate whether the cessation of use of leaded petrol has resulted in a reduction in bioavailable lead in the marine environment.
38

The heavy metal status of South Australian dolphins—
REFERENCES
Aguilar, A, Borrell, A & Pastor, T 1999, ‘Biological factors affecting the variability of persistent pollutant concentrations in cetaceans’, Journal of Cetacean Research Management Special issue 1, 83–116.
Alloway, BJ & Ayres, DC 1997, Chemical principles of environmental pollution, Chapman and Hall, London, UK.
Bannister, JL, Kemper, CM & Warneke, RM 1996, The action plan for Australian cetaceans, Australian Nature Conservation Society, Canberra, Australia.
Bell, JD & Pollard, DA 1989, ‘Ecology of fish assemblages and fisheries associated with seagrasses’, in AWD Larkum, AJ McComb and SA Shepherd (eds) Biology of seagrasses, Elsevier, Amsterdam, pp. 565–609.
Betti, C & Nigro, M 1996, The comet assay for the evaluation of the genetic hazard of pollutants in Cetaceans: preliminary results on the genotoxic effects of methyl mercury on the bottlenose dolphin (Tursiops truncatus) lympocytes In vitro. Marine Pollution Bulletin 32 (7) 545-548.
Borrell, A & Aguilar, A 1999, ‘A review of organochlorine and metal pollutants in marine mammals from Central and South America’, Journal of Cetacean Research Management Special issue 1, 195–207.
Bowles, D 1999, ‘An overview of the concentrations and effects of metals in cetacean species’, Journal of Cetacean Research Management Special issue 1, 125–148.
Butterfield, N 2003, Dolphins as bio-indicators of the heavy metal status in South Australian waters, Honours thesis, University of Adelaide, South Australia.
Bustamante, P Cosson, RP, Gallien, I, Caurant, F & Miramand, P 2001. Cadmium detoxification processes in the digestive gland of cephalopods in relation to accumulated cadmium concentrations. Marine Environmental Research 53, 227–241
Cardellicchio, N, Decataldo, A, Di Leo, A & Misino, A 2002, ‘Accumulation and tissue distribution of mercury and selenium in striped dolphins (Stenella coeruleoalba) from the Mediterranean Sea (southern Italy)’, Environmental Pollution 116, 265–271.
Carvalho, ML, Pereira, RA & Brito, J 2002, ‘Heavy metals in soft tissues of Tursiops truncatus and Delphinus delphis from west Atlantic Ocean by X-ray spectrometry’, The Science of the Total Environment 292, 247–254.
Caurant, F & Amiard-Triquet, C 1995, ‘Cadmium contamination in pilot whales Globicephala melas: source and potential hazard to the species’, Marine Pollution Bulletin 30(3), 207–210.
Clark, RB 1998, Marine pollution, Oxford University Press, USA.
Clesceri, LS, Greenberg, AE and Eaton, AD 1998, Standard methods for the examination of water and wastewater, 20th edn, American Public Health Association, American Water Works Association and Water Environment Federation.
39

The heavy metal status of South Australian dolphins
Corbin, T & Wade, S 2004, Heavy metal concentrations in razorfish (Pinna bicolor) and sediments across the northern Spencer Gulf, Environment Protection Authority, South Australia.
Cosson, RP, Amiard-Triquet, C & Amiard, J C 1991, Metallothioneins and detoxification, Is the use of detoxification proteins for MTs a language abuse? Water Air and Soil Pollution 57/58, 555–567.
Edwards, JW, Edyvane, KS, Boxall, VA, Hamann, M & Soole, KL 2001, ‘Metal concentrations in seston and marine fish flesh near industrial and metropolitan centres in South Australia’, Marine Pollution Bulletin 42, 389–396.
Edyvane, KS & Baker, J 1995, The South Australian marine regionalisation project, workshop proceedings on ‘Towards a Marine Regionalisation for Australia’, Sydney, New South Wales, 4–6 March 1994.
Endo, T, Haraguchi, K & Sakata, M 2002, ‘Mercury and selenium concentrations in the internal organs of toothed whales and dolphins marked for human consumption in Japan’, The Science of the Total Environment 300, 15–22.
Environment Protection Agency (EPA) 2000, Special survey of the Port River—heavy metals and PCBs in dolphins, sediments and fish, Environment Protection Agency, Department for Environment, Heritage and Aboriginal Affairs, South Australia.
Evans, WE 1994, ‘Common dolphin, white bellied porpoise Delphinus delphis Linnaeus, 1958’, in SH Ridgeway & SR Harrison (eds) Handbook of marine mammals, Academic Press, USA, pp. 191–209.
Ferguson, J 1983, ‘Concentration and speciation of lead, zinc and cadmium in seawater-like effluent and adjacent marine environments, Port Pirie, South Australia’, Australian Journal of Marine and Freshwater Research 34, 375–385.
Frodello, JP & Marchand, B 2001, ‘Cadmium, copper, lead and zinc in five toothed whale species of the Mediterranean Sea’, International Journal of Toxicology 20, 339–343.
Frodello, JP, Romeo, M & Viale, D 2000, ‘Distribution of mercury in the organs and tissues of five toothed whale species of the Mediterranean’, Environmental Pollution 108, 447–452.
Fujise, Y, Honda, K, Tatsukawa, R & Mishima, S 1988, ‘Tissue distribution of heavy metals in Dall’s porpoise in the Northwestern Pacific’, Marine Pollution Bulletin 19, 226–230.
Gaylard, S 2004, Ambient water quality of the Gulf St. Vincent metropolitan coastal waters—Report number 2, 1995–2002, Environment Protection Authority, South Australia.
Geraci, JR & Lounsbury, VJ 1993, Marine mammals ashore: a field guide for strandings, Texas A&M Sea Grant, Texas, USA.
Gustin, MS 2003, ‘Are mercury emissions from geologic sources significant? A status report’, The Science of the Total Environment 304, 153–167.
40

The heavy metal status of South Australian dolphins—
Harbison, P 1984, ‘Regional variation in the distribution of trace metals in modern intertidal sediments of northern Spencer Gulf, South Australia’, Marine Geology 61, 221–247.
Hoffman, DJ, Rattner, BA, Burton, GA (Jr) & Cairns, J 1995, Lead in the environment, in DJ Pain (ed) Lead, CRC Press Inc, Florida, USA, pp. 356–361.
Honda, K, Tatsukawa, R & Fujiyama, T 1982, ‘Distribution characteristics of heavy metals in the organs and tissues of striped dolphin, Stenella coeruleoalba’, Agricultural and Biological Chemistry 46(12), 3011–3021.
Honda, K, Tatsukawa, R, Itano, K, Miyazaki, N & Fujiyama, T 1983, ‘Heavy metal concentrations in muscle, liver and kidney tissue of striped dolphin, Stenella coeruleoalba, and their variations with body length, weight, age and sex’, Agricultural and Biological Chemistry 47, 1219–1228.
Itano, K, Kawai, S, Miyazaki, N, Tatsukawa, R & Fujiyama, T 1984, ‘Body burdens and distribution of mercury and selenium in striped dolphins’, Agricultural and Biological Chemistry 48, 1117–1121.
Jennings, S, Kaiser, MJ & Reynolds, JD 2001, ‘Production processes’, in Marine fisheries ecology, Blackwell Science Ltd, UK.
Kemper, CM 2004, ‘Osteological variation and taxonomic affinities of bottlenose dolphins, Tursiops spp., from South Australia’, Australian Journal of Zoology 52, 29–48.
Kemper, C, Gibbs, P, Obendorf, D, Marvanek, S & Lenghaus, C 1994, ‘A review of heavy metal and organochlorine concentrations in marine mammals in Australia’, The Science of the Total Environment 154, 129–139.
Kemper, CM & Gibbs, SE 2001, ‘Dolphin interactions with tuna feedlots at Port Lincoln, South Australia and recommendations for minimising entanglements’, Journal of Cetacean Research Management 3(3) 283–292.
Law, RJ 1994, Collaborative UK Marine Mammal Project: summary of data produced 1988-1992, Fisheries Research Technical Report No. 97, UK.
Law, RJ, Fileman, CF, Hopkins, AD, Baker, JR, Harwood, J, Jackson, OB, Kennedy, S, Martin, AR & Morris, RJ 1991, ‘Concentrations of trace metals in the livers of marine mammals (seals, porpoises and dolphins) from waters around the British Isles’, Marine Pollution Bulletin 22(4) 183–191.
Law, RJ, Morris, RJ, Allchin, CR, Jones, BR & Nicholson, MD 2003, ‘Metals and organochlorines in small cetaceans on the east coast of Australia’, Baseline/Marine Pollution Bulletin 46, 1200–1211.
Leonzio, C, Focardi, S & Fossi, C 1992, ‘Heavy metals and selenium in stranded dolphins of the Northern Tyrrhenian (NW Mediterranean)’, The Science of the Total Environment 119, 77–84.
Long, M, Reid, RJ & Kemper, CM 1997, ‘Cadmium accumulation and toxicity in the bottlenose dolphin Tursiops truncatus, the common dolphin Delphinus delphis, and some dolphin prey species in South Australia’, Australian Mammalogy 20, 25–33.
41
The heavy metal status of South Australian dolphins
Maher, WA 1985, ‘Trace metal concentrations in marine organisms from St Vincent Gulf, South Australia’, Water, Air and Soil Pollution 29, 77–84.
Marcovecchio, JE, Gerpe, MS, Bastida, RO, Rodriguez, DH & Moron, SG 1994, ‘Environmental contamination and marine mammals in coastal waters from Argentina: an overview’, The Science of the Total Environment 154, 141–151.
Marcovecchio, JE, Moreno, VJ, Bastida, RO, Gerpe, MS & Rodriguez, DH 1990, ‘Tissue distribution of heavy metals in small cetaceans from the Southwestern Atlantic Ocean’, Marine Pollution Bulletin 21(1), 299–304.
Marvanek, S 1991, Lead and cadmium in the tissues of marine mammals, with a focus on Spencer Gulf, South Australia, Honours thesis, Flinders University, South Australia.
Mead, JG & Potter, CW 1990, ‘Natural history of bottlenose dolphins along the central Atlantic coast of the US’, in S Leatherwood & RR Reeves (eds) The bottlenose dolphin, Academic Press Inc, San Diego, USA, pp. 165–195.
Nassery D 1992, ‘Cadmium—from paddock to plate’, ACRES Australia, March 2, p. 27.
National Pollutant Inventory (NPI) 2004, <www.npi.gov.au/>.
Noye, J 1984, ‘Physical processes and pollution in the waters of Spencer Gulf’, Marine Geology 61, 197–220.
Olsen, AM 1983, Heavy metal concentrations of fish, other aquatic biota, River Murray and South Australian aquatic environments, Department of Fisheries, South Australia.
O’Shea, TJ 1999, ‘Environmental contaminants and marine mammals’, in S Rommel & JE Reynolds (eds) Biology of marine mammals, Smithsonian Institution Press, USA, pp. 510–536.
Rawson, AJ, Patton, GW, Hofmann, S, Pietra, GG & Johns, L 1993, ‘Liver abnormalities associated with chronic mercury accumulation in stranded Atlantic bottlenose dolphins’, Ecotoxicology and Environmental Safety 25, 41–47.
Roditi-Elasar, M, Kerem, D, Hornung, H, Kress, N, Shoham-Frider, E, Goffman, O & Spanier, E 2003, ‘Heavy metal concentrations in bottlenose and striped dolphins off the Mediterranean coast of Israel’, Baseline/Marine Pollution Bulletin 46, 491–521.
Siebert, U, Joiris, C, Holsbeek, L, Benkes, H, Failing, K, Frese, K & Petzinger, E 1999, ‘Potential relationship between mercury concentrations and necropsy findings in cetaceans from German waters of the North and Baltic Seas’, Marine Pollution Bulletin 38(4), 285–295.
Stein, JE, Tilbury, KL, Brown, DW, Wigren, CA, Meador, JP, Robisch, PA, Chan, S-L & Varanasi, U 1992, Intra-organ distribution of chemical contaminants in tissues of harbor porpoises (Phocoena phocoena) from the Northwest Atlantic, NOAA Technical Memorandum NMFS-NWFSC-3, National Fisheries Service, USA.
Szefer, P, Szefer, K, Pempkowiak, J, Skwarzec, B, Bojanowski, R & Holm, E 1994, ‘Distribution and coassociations of selected metals in seals of the Antarctic’, Environmental Pollution 83, 341–349.
42

The heavy metal status of South Australian dolphins—
Wade, S 2002, Ambient water quality of the Port River estuary 1995–2000, Environment Protection Authority, South Australia.
Walker, CH, Hopkin, SP, Sibly, RM & Peakall, DB 1996, Principles of Ecotoxicology, Taylor and Francis Ltd, United Kingdom.
Wang, JY, Chou, L-S & White, BN 1999, ‘Mitochondrial DNA analysis of sympatric morphotypes of bottlenose dolphins (genus: Tursiops) in Chinese waters’, Molecular Ecology 8, 1603–1612.
Wang, W 1987, ‘Factors affecting metal toxicity to (and accumulation by) aquatic organisms – overview’, Environment International 13, 437–457.
Ward, TJ 1987, ‘Temporal variation of metals in the seagrass Posidonia australis and its potential as a sentinel accumulator near a lead smelter’, Marine Biology, 95, 315–321.
Ward, TJ & Hutchings, PA 1996, ‘Effects of trace metals on infaunal species composition in polluted intertidal and subtidal marine sediments near a lead smelter, Spencer Gulf, South Australia’, Marine Ecology Progress Series 135, 123–135.
Ward, TJ, Warren, LJ & Swaine, DJ 1982, Effects of heavy metals on aquatic life, Final report ILZRO project CH-6/ZH-212, CSIRO Heavy Metals Task Force, South Australia.
Ward, TJ & Young, PC 1982, ‘Effects of sediment trace metals and particle size on the community structure of epibenthic seagrass fauna near a lead smelter, South Australia’, Marine Ecology Progress Series 9, 137–146.
Wood, CM & Van Vleet, ES 1996, ‘Copper, cadmium and zinc in liver, kidney and muscle tissues of bottlenose dolphins (Tursiops truncatus) stranded in Florida’, Marine Pollution Bulletin 32(12), 886–889.
Working Group on Mercury in Fish 1980, Report on mercury in fish and fish products, Australian Government Publishing Service, Canberra, Australia.
43

The heavy metal status of South Australian dolphins
APPENDIX 1 All results for heavy metals and selenium in dolphins
Dolphin museum number
Collection location Tooth category
Cadmium (liver) mg/kg
Lead (liver) mg/kg
Lead (bone) mg/kg
Mercury (liver) mg/kg
Selenium (liver) mg/kg
Zinc (liver) mg/kg
ww dw ww dw ww dw ww dw ww dw ww dw GULF ST VINCENT
Tursiops aduncus (Indo-Pacific bottlenose dolphin) 96.0322 2 km W Semaphore 3 0.95 3.10 0.55 1.80 na na 1366.15 4450.00 494.27 1610.00 104.38 340.00 97.1002 Largs North 5 2.98 8.10 0.40 1.10 na na 1078.24 2930.00 382.72 1040.00 55.20 150.00 97.1232 Moana Beach 5 0.26 0.94 0.36 1.30 4.19 4.50 1867.60 6670.00 803.60 2870.00 50.40 180.00 97.2142 Wool Bay – 21.96 72.00 0.05 0.18 na na 1805.60 5920.00 634.40 2080.00 125.05 410.00 98.1011 St Kilda 4 0.57 2.11 0.41 1.52 5.87 6.40 347.00 1290.00 160.00 592.00 49.00 181.30 98.1151 Black Point 5 0.73 2.70 0.26 0.96 1.20 1.30 550.00 2330.00 200.00 740.00 41.00 151.70 98.1211 Rapid Bay 5 3.10 11.47 0.00 0.00 2.12 2.30 985.00 5130.00 360.00 1332.00 47.00 173.90 98.1311 Christies Beach 5 5.00 18.50 0.30 1.11 4.33 4.70 1186.00 4940.00 410.00 1517.00 67.00 247.90 98.1711 North Semaphore 4 0.49 1.81 0.86 3.18 4.33 4.70 231.00 1010.00 92.00 340.40 39.00 144.30 99.1361 North Haven – 0.05 0.16 0.15 0.52 na na 4.44 15.00 0.71 2.40 452.88 1530.00 00.0421 Port Julia 5 21.00 77.70 0.20 0.74 1.19 1.30 1039.00 4060.00 490.00 1813.00 70.00 259.00 00.2501 Brighton 3 6.30 23.31 0.22 0.81 2.00 2.20 1795.00 7770.00 620.00 2294.00 50.00 203.50 00.2512 Stansbury – na na na na 1.18 1.30 na na na na na na 01.1581 Port Gawler 4 1.10 4.07 0.00 0.00 10.15 11.00 476.00 2020.00 53.00 196.10 137.00 506.90 03.0431 Outer Harbor 5 1.10 4.07 0.41 1.52 6.39 7.00 537.00 1960.00 200.00 740.00 49.00 181.30 03.1432 West Beach – 1.98 7.60 0.34 1.30 na na 1594.71 6110.00 425.43 1630.00 49.59 190.00
na = not analysed, dash (–) = tooth category not known, ww = wet weight, dw = dry weight Liver data from Butterfield 20031, All data from this study2 (Note: All bone data is from this study)
Dolphin museum number
Collection location Tooth category
Cadmium (liver) mg/kg
Lead (liver) mg/kg
Lead (bone) mg/kg
Mercury (liver) mg/kg
Selenium (liver) mg/kg
Zinc (liver) mg/kg
ww dw ww dw ww dw ww dw ww dw ww dw Delphinus delphis (short-beaked common dolphin)
92.0702 1.2 km SSW Port Noarlunga
3 na na na na 1.30 1.40 na na na na na na
93.1082 Clinton shacks 3 0.50 1.30 0.12 0.31 1.83 2.00 65.11 170.00 31.02 81.00 61.28 160.00 94.2012 200 m N Sellicks Beach 3 0.26 0.60 0.07 0.17 1.74 1.90 16.45 38.00 12.12 28.00 86.60 200.00 97.1771 4 km S Snapper Point 3 0.52 1.92 0.00 0.00 1.57 1.70 31.00 150.00 13.00 48.10 39.00 144.30 00.1422 Port Stanvac 4 0.35 1.30 0.04 0.15 1.28 1.40 32.40 120.00 19.98 74.00 54.00 200.00
44

The heavy metal status of South Australian dolphins—
Dolphin museum number
Collection location Tooth category
Cadmium (liver) mg/kg
Lead (liver) mg/kg
Lead (bone) mg/kg
Mercury (liver) mg/kg
Selenium (liver) mg/kg
Zinc (liver) mg/kg
ww dw ww dw ww dw ww dw ww dw ww dw 00.2271 Black Point 4 0.20 0.74 0.00 0.00 0.42 0.45 20.00 110.00 11.00 40.70 115.00 425.50 01.0041 Port Noarlunga 4 0.41 1.52 0.00 0.00 1.54 1.70 57.00 220.00 19.00 70.30 63.00 233.10 01.0721 Coobowie 5 0.77 2.85 0.00 0.00 0.53 0.58 1.80 8.00 24.00 88.80 77.00 284.90 03.0662 10 km WNW Adelaide – 0.72 2.30 0.01 0.04 0.56 0.61 18.72 60.00 13.42 43.00 68.64 220.00
SPENCER GULF Tursiops aduncus (Indo-Pacific bottlenose dolphin)
89.0582 1 km S Port Hughes 5 4.67 16.00 0.24 0.83 na na 2651.36 9080.00 1188.44 4070.00 347.48 1190.00 92.0022 6.5 km E Port Lincoln 3 3.30 11.00 0.15 0.49 na na 687.00 2290.00 243.00 810.00 99.00 330.00 95.0852 6 km E Port Lincoln 3 3.48 11.00 0.04 0.13 na na 195.92 620.00 94.80 300.00 50.56 160.00 95.1592 Cape Donington 4 6.19 19.00 0.05 0.15 na na 938.88 2880.00 326.00 1000.00 198.86 610.00 97.9102 5.2 km SE Port Germein 4 1.07 3.10 14.15 41.00 na na 127.65 370.00 86.25 250.00 96.60 280.00 98.0532 Port Hughes – na na na na 1.37 1.50 na Na na na na na 99.1011 Port Augusta 5 6.10 22.57 0.00 0.00 1.19 1.30 567.00 2940.00 270.00 999.00 270.00 999.00 99.1331 North Shields 5 22.00 81.40 0.00 0.00 0.86 0.94 289.00 1490.00 230.00 851.00 62.00 229.40
na = not analysed, dash (–) = tooth category not known, ww = wet weight, dw = dry weight Liver data from Butterfield 20031, All data from this study2 (Note: All bone data is from this study)
Dolphin museum number
Collection location Tooth category
Cadmium (liver) mg/kg
Lead (liver) mg/kg
Lead (bone) mg/kg
Mercury (liver) mg/kg
Selenium (liver) mg/kg
Zinc (liver) mg/kg
ww dw ww dw ww dw ww dw ww dw ww dw 99.1651 Port Lincoln 3 8.80 32.56 0.00 0.00 0.88 0.96 114.00 570.00 42.00 155.40 34.00 125.80 00.0281 Balgowan 4 3.60 13.32 0.35 1.30 1.29 1.40 833.00 3530.00 550.00 2035.00 60.00 222.00 01.0821 Port Lowley 3 1.80 6.66 0.00 0.00 na na 475.00 1980.00 186.00 688.20 124.00 458.80
01.0902 Port Victoria 5 98.58 372.00 0.05 0.18 1.21 1.30 1716.14 6476.00 448.91 1694.00 209.35 790.00 01.1641 Backy Point 5 3.50 12.95 0.22 0.81 na na 290.00 1130.00 111.00 410.70 85.00 314.50 01.1692 Point Riley 5 16.64 64.00 0.10 0.38 2.38 2.60 2077.40 7990.00 746.20 2870.00 135.20 520.00 02.0221 Whyalla 3 1.70 6.29 0.00 0.00 2.02 2.20 809.00 3550.00 330.00 1221.00 59.00 218.30 02.0331 Whyalla 3 0.80 2.90 0.06 0.21 0.29 0.31 66.00 240.00 33.00 120.00 68.75 250.00
Delphinus delphis (short-beaked common dolphin) 94.1201 3 km WSW Wallaroo 3 0.54 2.00 0.00 0.00 1.12 1.20 65.00 230.00 22.00 81.40 144.00 532.80 97.1651 Whyalla 3 2.40 8.88 0.00 0.00 0.76 0.82 115.00 440.00 44.00 162.80 38.00 140.60 97.1661 Whyalla 4 1.70 6.29 0.00 0.00 1.02 1.10 91.00 330.00 35.00 129.50 30.00 111.00 97.1672 Whyalla 3 9.02 26.00 0.01 0.03 0.79 0.86 166.56 480.00 72.87 210.00 72.87 210.00 97.1982 Port Lincoln 4 4.33 14.00 0.02 0.07 0.83 0.90 80.34 260.00 16.07 52.00 30.90 100.00
45

The heavy metal status of South Australian dolphins
Dolphin museum number
Collection location Tooth category
Cadmium (liver) mg/kg
Lead (liver) mg/kg
Lead (bone) mg/kg
Mercury (liver) mg/kg
Selenium (liver) mg/kg
Zinc (liver) mg/kg
ww dw ww dw ww dw ww dw ww dw ww dw 98.0882 Stinky Creek 3 0.69 2.10 0.01 0.03 na na 14.81 45.00 10.86 33.00 62.51 190.00 98.0892 Port Lincoln 3 0.67 2.00 0.01 0.03 na na 21.04 63.00 15.70 47.00 36.74 110.00 98.1481 Stony Point 5 0.17 0.63 0.00 0.00 2.41 2.60 97.00 390.00 38.00 140.60 51.00 188.70 99.0942 Port Lincoln 3 0.83 2.40 0.02 0.07 na na 10.03 29.00 6.92 20.00 48.44 140.00 99.1302 North Shields 5 0.65 1.70 0.11 0.28 na na 38.40 100.00 21.89 57.00 42.24 110.00 99.1622 Port Lincoln 3 1.44 4.60 0.01 0.02 0.85 0.93 34.43 110.00 6.89 22.00 62.60 200.00 99.1632 Boston Island 4 1.32 4.50 0.07 0.24 na na 29.40 100.00 21.76 74.00 61.74 210.00
na = not analysed, dash (–) = tooth category not known, ww = wet weight, dw = dry weight Liver data from Butterfield (2003)1, All data from this study2 (Note: All bone data is from this study)
Dolphin museum number
Collection location Tooth category
Cadmium (liver) mg/kg
Lead (liver) mg/kg
Lead (bone) mg/kg
Mercury (liver) mg/kg
Selenium (liver) mg/kg
Zinc (liver) mg/kg
ww dw ww dw ww dw ww dw ww dw ww dw 99.1642 Port Lincoln 5 0.90 3.00 0.01 0.03 na na 25.42 85.00 14.65 49.00 56.81 190.00 00.0181 Port Lincoln 4 1.80 6.66 0.00 0.00 0.44 0.48 36.00 130.00 14.00 51.80 56.00 207.20 00.0982 Boston Point 5 0.68 2.30 0.01 0.02 na na 19.54 66.00 13.02 44.00 38.48 130.00 00.1021 North Shields 4 1.40 5.18 0.00 0.00 1.55 1.70 33.00 130.00 17.00 62.90 46.00 170.20 00.1031 Boston Bay 4 0.72 2.66 0.00 0.00 na na 16.00 66.00 6.30 23.31 53.00 196.10 00.1041 North Shields 4 2.00 7.40 0.00 0.00 0.63 0.69 50.00 190.00 22.00 81.40 49.00 181.30 00.1941 Port Lincoln 3 0.74 2.74 0.00 0.00 na na 10.00 43.00 5.20 19.24 51.00 188.70 00.1972 Port Lincoln 3 0.40 1.20 0.00 0.01 0.73 0.80 11.66 35.00 6.99 21.00 33.30 100.00 00.2371 Port Lincoln 3 0.60 2.22 0.00 0.00 na na 23.00 78.00 9.30 34.41 62.00 229.40 02.0381 Port Lincoln 4 0.54 2.00 0.00 0.00 0.44 0.48 23.00 110.00 9.70 35.89 58.00 214.60 03.0732 Port Lincoln – 2.02 6.60 0.01 0.03 na na 76.50 250.00 13.77 45.00 33.66 110.00
SOUTHERN OCEAN Tursiops aduncus (Indo-Pacific bottlenose dolphin)
91.1452 Marion Bay 3 9.36 31.00 0.04 0.14 na na 1253.30 4150.00 428.84 1420.00 78.52 260.00 Delphinus delphis (short-beaked common dolphin)
94.0502 7 km SE Goolwa 3 0.43 1.50 0.03 0.12 0.70 0.76 31.35 110.00 16.25 57.00 42.75 150.00 94.1272 2 km S Goolwa 3 0.46 1.40 0.01 0.37 2.32 2.50 111.52 340.00 55.76 170.00 45.92 140.00 94.1992 2 km NE South End 3 2.28 6.20 0.03 0.08 0.92 0.99 73.40 200.00 40.37 110.00 40.37 110.00 94.2182 1 km W Normanville 3 0.54 1.20 0.13 0.30 0.73 0.78 12.07 27.00 16.09 36.00 67.05 150.00 95.0812 Seal Bay – 10.92 35.00 0.01 0.03 na na 68.64 220.00 17.47 56.00 53.04 170.00 96.0012 200 m W Rhino Head 3 1.01 3.00 0.04 0.12 0.86 0.93 117.25 350.00 60.30 180.00 120.60 360.00
na = not analysed, dash (–) = tooth category not known, ww = wet weight, dw = dry weight
46

The heavy metal status of South Australian dolphins—
Dolphin museum number
Collection location Tooth category
Cadmium (liver) mg/kg
Lead (liver) mg/kg
Lead (bone) mg/kg
Mercury (liver) mg/kg
Selenium (liver) mg/kg
Zinc (liver) mg/kg
ww dw ww dw ww dw ww dw ww dw ww dw Liver data from Butterfield (2003)1, All data from this study2 (Note: All bone data is from this study)
ww dw ww dw ww dw ww dw ww dw ww dw 96.0412 0.8 km S Encounter Bay 4 na na na na 1.47 1.60 na na na na na na 96.0812 Point Sir Isaac 3 1.06 3.40 0.01 0.02 0.49 0.52 6.22 20.00 5.29 17.00 62.20 200.00 97.2041 Port Elliot 3 2.30 8.51 0.00 0.00 1.01 1.10 2.30 11.00 2.80 10.36 26.00 96.20 99.0171 Goolwa Beach 5 0.34 1.26 0.00 0.00 1.09 1.20 26.00 90.00 10.00 37.00 47.00 173.90 00.0191 Kellidae Bay 4 3.60 13.32 0.00 0.00 0.47 0.51 90.00 320.00 35.00 129.50 35.00 129.50 00.0691 South End Rivoli Bay 3 5.60 20.72 0.00 0.00 0.68 0.74 114.00 450.00 55.00 203.50 45.00 166.50 00.1712 Kangaroo Island 3 0.62 1.90 0.03 0.08 0.53 0.57 28.84 89.00 15.88 49.00 32.08 99.00 01.0751 Victor Harbor 3 0.75 2.78 0.00 0.00 0.50 0.55 18.00 68.00 12.00 44.40 80.00 296.00 03.0752 Port Neill – 0.54 1.50 0.01 0.04 2.00 2.20 27.92 78.00 20.05 56.00 89.50 250.00 03.1202 Middleton Beach – 1.75 6.30 0.01 0.02 na na 3.61 13.00 4.45 16.00 50.04 180.00
Tursiops truncatus (common bottlenose dolphin) 89.0092 5 km N Kingston 3 na na na na 1.02 1.10 na na na na na na 94.0082 6 km E Port Lincoln 4 35.49 130.00 0.17 0.62 na na 458.64 1680.00 166.53 610.00 111.93 410.00 94.1221 Pelican Point 5 1.70 6.29 0.00 0.00 0.82 0.88 443.00 2030.00 166.00 614.20 33.00 122.10 99.0522 9.5 km SSW Kingscote 3 6.56 23.00 0.01 0.04 0.68 0.73 42.75 150.00 19.95 70.00 54.15 190.00 99.0631 Strawbridge Point,
Kangaroo Island 4 20.00 74.00 0.00 0.00 0.85 0.93 101.00 370.00 27.00 99.90 68.00 251.60
99.0702 Brown Beach, Kangaroo Island
2 na na na na 0.73 0.80 na na na na na na
99.0972 Goolwa Beach 3 0.30 1.00 0.02 0.08 1.11 1.20 236.34 780.00 103.02 340.00 33.33 110.00 02.0302 Fowlers Bay 5 10.94 48.00 0.03 0.15 0.60 0.66 763.80 3350.00 266.76 1170.00 47.88 210.00
na = not analysed, dash(–) = tooth category not known, ww = wet weight, dw = dry weight, 1Liver data from Butterfield (2003), 2All data from this study (Note: All bone data is from this study)
47

The heavy metal status of South Australian dolphins
APPENDIX 2 Re-analyses of heavy metals and selenium in dolphin liver
Dolphin museum number Cadmium (mg/kg) Lead (mg/kg)
2003 2004 2003 2004 ww dw* ww dw ww dw* ww dw
Tursiops aduncus (Indo-Pacific bottlenose dolphin) 97.123 0.27 1.00 0.26 0.94 0.60 2.22 0.11 1.30
97.91 0.88 3.26 1.07 3.10 13.00 48.10 14.15 41.00
95.085 3.50 12.95 3.48 11.00 <0.2 <0.70 0.04 0.13
98.114 0.03 0.11 0.07 0.23 0.26 0.96 0.19 0.62
01.169 25.00 92.50 16.64 64.00 0.21 0.78 0.10 0.38
02.007 <0.01 <0.04 0.14 0.42 <0.20 <0.70 0.01 0.02
Delphinus delphis (short-beaked common dolphin)
93.108 0.42 1.55 0.50 1.30 <0.20 <0.70 0.12 0.31
94.201 0.26 0.96 0.26 0.60 <0.20 <0.70 0.07 0.17
97.167 8.00 29.60 9.02 26.00 <0.20 <0.70 0.01 0.03
00.142 0.34 1.26 0.35 1.30 <0.20 <0.70 0.04 0.15
00.197 0.50 1.85 0.40 1.20 <0.20 <0.70 0.00 0.01
03.004 <0.01 <0.04 0.01 0.03 <0.20 <0.70 0.00 <0.01
03.044 0.35 1.30 0.33 1.10 <0.20 <0.70 0.00 <0.01
Tursiops truncatus (common bottlenose dolphin)
98.102 3.70 13.69 3.90 10.00 <0.20 <0.70 0.11 0.29
99.052 7.80 86.00 6.56 23.00 <0.20 <0.70 0.01 0.04
99.097 0.12 0.44 0.30 1.00 <0.20 <0.70 0.02 0.08
02.030 8.60 31.80 10.94 48.00 <0.00 <0.70 0.03 0.15
03.002 <0.01 <0.04 0.01 0.02 <0.00 <0.70 0.00 <0.01
Italics = EPA results from 2000, ww = wet weight, dw = dry weight, dw* = data converted from wet weight based on 73% moisture content in liver, na = not analysed, 2003 data = Butterfield 2003, 2004 data = this study
48

The heavy metal status of South Australian dolphins—
Mercury (mg/kg) Selenium (mg/kg) Zinc (mg/kg)
2003 2004 2003 2004 2003 2004 Dolphin museum number ww dw ww dw ww dw* ww dw ww dw* ww dw
Tursiops aduncus (Indo-Pacific bottlenose dolphin) 97.123 1525.00 5410.00 1867.00 6670.00 580.00 2146 803.6 2870.00 50.00 185.00 50.40 180.00
97.91 123.00 410.00 127.65 370.00 68.00 251.60 86.25 250.00 78.00 288.60 96.60 280.00
95.085 na na 195.92 620.00 91.00 336.70 94.80 300.00 50.00 185.00 50.56 160.00
98.114 4.10
19.00 3.04 10.00 <1.00 <3.70 1.79 5.90 121.00 447.70 155.0 510.00
01.169 1936.00 8240.00 20774.00 7990.00 970.00 3589 746.20 2870.00 192.00 710.40 135.2 520.00
02.007 1.10 2.80 1.01 3.00 <1.00 <3.70 2.15 6.40 78.00 288.60 107.52 320.00
Delphinus delphis (short-beaked common dolphin)
93.108 na na 65.11 170.00 29.00 107.3 31.02 81.00 46.00 170.20 61.28 160.00
94.201 na na 16.45 38.00 6.10 22.57 12.12 28.00 66.00 244.20 86.60 200.00
97.167 164.00 600.00 166.50 480.00 52.00 192.40 72.87 210 53.00 196.10 72.87 210.00
00.142 22.00 100.00 32.40 120.00 12.00 44.40 19.98 74.00 49.00 181.30 54.00 200.00
00.197 8.60 43.00 11.66 35.00 4.50 65.65 6.99 21.00 33.00 122.10 33.30 100.00
03.004 0.81 3.60 0.39 0.90 <1.00 <3.70 2.19 5.30 90.00 333.00 103.205 250.00
03.044 4.30 16.00 3.26 11.00 2.80 36.00 3.85 13.00 60.00 222.00 56.24 190.00
Tursiops truncatus (common bottlenose dolphin).
98.102 356.00 1510.00 339.30 870.00 129.00 477.3 144.3 370 33.00 122.10 38.22 98.00
99.052 na na 42.75 150.00 12.00 44.40 19.95 70 37.00 136.90 54.15 190.00
99.097 222.00 1150.00 236.30 780.00 53.00 196.10 103.0 340 19.00 70.30 33.33 110.00
02.030 780 3120.00
763.80 3350.00 240.00 888.0 266.7 1170 36.00 133.20 47.88 210.00
03.002 2.50 10.00 1.41 5.00 <1.00 <3.70 1.27 4.50 30.00 111.00 19.18 68.00
Italics = EPA results from 2000, ww = wet weight, dw = dry weight, dw* = data converted from wet weight based on 73% moisture content in liver, na = not analysed, 2003 data = Butterfield 2003, 2004 data = this study
49

The heavy metal status of South Australian dolphins
APPENDIX 3 Metal concentrations in subsamples of dolphin liver
1 2 3 4 50123456789
320
340
360
380
400
420
Cad
miu
m (m
g/kg
dw
)
Subsample number
Dolphin1 Dolphin2 Dolphin3 Dolphin4
Cadmium
Figure 14 Cadmium concentrations in subsamples from four dolphin livers
1 2 3 4 50.00
0.02
0.04
0.06
0.08
0.10
0.12
0.14
0.16
0.18
0.20
0.22
Lead
(mg/
kg d
w)
Subsample number
Dolphin1 Dolphin2 Dolphin3 Dolphin4
Lead
Figure 15 Lead concentrations in subsamples from four dolphin livers
50

The heavy metal status of South Australian dolphins—
0 1 2 3 4 50
50
100
150
1000
1200
1400
1600
1800
Leve
l (m
g/kg
dry
wei
ght)
Sub-sample number
dolphin1 dolphin2 dolphin3 dolphin4
Mercury
Figure 16 Mercury concentrations in subsamples from four dolphin livers
0 1 2 3 4 50
50
100
150
1000
1200
1400
1600
1800
Leve
l (m
g/kg
dry
wei
ght)
Sub-sample number
dolphin1 dolphin2 dolphin3 dolphin4
Selenium
Figure 17 Selenium concentrations in subsamples from four dolphin livers
51

The heavy metal status of South Australian dolphins
1 2 3 4 5100
200
300
400
500
600
700
800
900
Leve
l (m
g/kg
dry
wei
ght)
Sub-sample number
dolphin1 dolphin2 dolphin3 dolphin4
Zinc
Figure 18 Zinc concentrations in subsamples from four dolphin livers
52

The heavy metal status of South Australian dolphins—
APPENDIX 4 Statistical summary of metals in dolphins by region and species
Region and species Statistics Cadmium (mg/kg) in liver
Lead (mg/kg) in liver
Lead (mg/kg) in bone
Mercury (mg/kg) in liver
Selenium (mg/kg) in liver
Zinc (mg/kg) in liver
Gulf St Vincent Tursiops aduncus
(inshore bottlenose dolphin) n = 15/11
range mean
median 95% CIM standard deviation
0.16–77.70 15.84 4.07
2.08–29.62 24.86
0–3.18 1.07 1.10
0.66–1.61 0.86
1.30–11.00 4.25 4.50
2.20-6.29 3.04
15.00–7770.00 3773.67 4060.00
2456.32–4923.01 2227.13
2.40–2294 1253.13 1332.00
707.39–1493.53 709.79
150–1530 323.32 190.00
129.95–517.36 349.78
Delphinus delphis (common dolphin)
n = 8/9
range mean
median 95% CIM standard deviation
0.60–2.85 1.57 1.41
0.93–2.20 0.76
0–0.31 0.08 0.02
-0.01–0.18 0.12
0.45–2.00 1.30 1.40
0.84–1.77 0.60
8.00–220 109.50 115.00
49.98–169.03 71.20.00
28.00–88.80 59.24 59.20
40.83–77.65 22.02
144.00–425.50 233.48 210.00
159.17–307.78 88.89
Spencer Gulf Tursiops aduncus
(inshore bottlenose dolphin) n = 15/9
range mean
median 95% CIM standard deviation
2.90–372.00 44.98 13.32
-6.63–96.60 93.21
0.13–41.00 3.03 0.18
-2.79–8.85 10.51
0.31–2.60 1.39 1.30
0.87–1.91 0.68
240.00–9080.00 3009.07 22901.00
471.14–4546.99 2777.13
120.00–4070.00 1164.95 851.00
551.88–1778.03 1107.07
160.00–1190.00 446.52 314.50
268.90–624.14 320.74
Delphinus delphis (common dolphin)
n = 23/12
range mean
median 95% CIM standard deviation
0.63–26.00 5.09 2.74
2.71–7.47 5.50
0–0.28 0.04 0.01
0.01–0.07 0.07
0.48–2.60 1.05 0.88
0.67–1.42 0.59
29.00–480.00 163.48 110.00
105.22–221.74 134.73
19.24–210.00 65.10 49.00
43.40–86.79 50.17
100.00–532.80 180.90 188.70
142.92–218.87 87.81
Southern Ocean
53

The heavy metal status of South Australian dolphins—
Region and species Statistics Cadmium (mg/kg) in liver
Lead (mg/kg) in liver
Lead (mg/kg) in bone
Mercury (mg/kg) in liver
Selenium (mg/kg) in Zinc (mg/kg) in liver
liver
Tursiops aduncus (inshore bottlenose
dolphin) n = 1/0
31 0.14 - 4150 1420 260
Delphinus delphis (common dolphin)
n = 15/14
range mean
median 95% CIM standard deviation
1.20–35.00 7.20 3.00
1.98–12.42 9.44
0–0.37 0.08 0.03
0.02–0.14 0.11
0.51–2.50 1.07 0.89
0.71–1.43 0.63
11–450 159.07 90.00
79.07–239.06 144.45
16.00–203.50 78.12 56.00
42.70–113.53 63.95
96.20–360.00 178.07 166.50
137.31–218.84 73.61
Tursiops truncatus (offshore bottlenose
dolphin) n = 6/7
range mean
median 95% CIM standard deviation
1–130 47.05 35.50
–4.29–98.39 48.93
0–0.62 0.15 0.06
–0.10–0.39 0.24
0.66–1.20 0.90 0.88
0.72–1.08 0.19
150–3350 1393.33
1230 126.57–2660.09
1207.09
70–1170 484.02 475.00
53.09–914.95 410.63
110–440 215.62 200.00
100.98–330.26 109.24
All results are expressed on a dry weight basis, CIM = confidence interval of the mean, n = sample size for liver/bone
54