
The Heat Pipe Injection Lance - McGill Universitydigitool.library.mcgill.ca/thesisfile56782.pdfThe...
141
The Heat Pipe Injection Lance by Peter A. Sotos Department of Mining and Metallurgical Engineering McGill University Montreal, Canada May, 1992 A thesis submitted to the Faculty of Graduate Studies and Research in partial fulfillment of the requirements for the degree of Master of Engineering 10 P. Botos 1992
-
Upload
nguyentruc -
Category
Documents
-
view
223 -
download
0
Transcript of The Heat Pipe Injection Lance - McGill Universitydigitool.library.mcgill.ca/thesisfile56782.pdfThe...

The Heat Pipe Injection Lance
by
Peter A. Sotos
Department of Mining and Metallurgical Engineering McGill University Montreal, Canada
May, 1992
A thesis submitted to the Faculty of Graduate Studies and Research in partial fulfillment of the requirements
for the degree of Master of Engineering
10 P. Botos 1992

r 1
1
1
1
1
1
Imagination is more important than knowledge.
Albert Einstei n

c
c
ABSTRACT
The heat pipe is a device which is capable of moving large quantities of heat over very
small temperature gradients. Hs abiIity to transport heat far surpasses the foremost solid
conductor, 'ilver, and its use in engineering applications is constantly increasiJ1& as innovators
begin to r'-Cllize its potential. To date, heat pipe technology has found little use in the
metallurgkal industry. This work focuses on the potential use of heat pipes in injection lancing;
specifically, the need to preserve lances from consumption in the Mitsubishi continuous copper
makmg process of the Kldd Crp.ek smelter located in Tlmmins, Ontario, Canada.
The problems with the Mitsubishi lances presently used are two-fold:
i) the direct costs associated with continuallv feeding stainless steel lances into
the molten copper bath.
ii) the indirect costs associated with improper control over the process since
lance height relative to the bath is unknown.
A heat pipe injection lance is self-cooling, enabling it to maintain a surface temperature weIl
below the Mitsubishl furnace temperatures. A cooled lance has an increased tolerance to furnace
conditions, thereby decreasing its consumption rate. The furnace residence time of a heat pipe
mjection lance is orders of magnitude larger than a standard stainless steel lance, resulting in
materials cost savings. During Hs operation, the exact location of a heat pipe injection lance is
known, solving the second and pérhaps more important problem with the Mitsubishi process;
control of the lancing operatIon.
The work performed can be divided into three stages. The first stage involved the
development and study of a transparent heat pipe which servl'~' .' "Jstrate the principles of hea
pipes, speclfically 1 thermosyphons or wickless heat pipes. second stage dealt wnii the
conception, construction and study of a laboratory scale heat pipe injection lance. The
knowledge gained ln the laboratory was used to build two pilot scale heat pipe injection lances,
Mark 1 a.ld Mark Il, in the third stage of this work.. These lances were tested in the copper
converting furnace at the Kidd Creek smeIter. Through the development of pilot scale heat pipe

1
1
,
injection lances, it is shown that a self-cooled heat pipe lance has a fumace Iife orders of
magnitude greater than a convention al stainless steel lance, with its exact location relative to the
molten copper baLh surface known.
11
1
1
Résumé
Le caloduc est un dispositif capable de transporter de grandes quantités de chaleur avec
un faible gl1'.dient thermique. Sa capacité à transporter la chaleur est bien supérieure à celle du
meilleur conducteur solide, l'argent, et son utilisation dans l'industrie augmente continuel!ement
à mesure que les innovateurs réalisent son potentiel. Jusqu'à aujourd'hui, la technique du
caloduc n'a trouvé que peu d'application dans l'industrie metallurgique. Ce travail a pour but
d'étudier la possibilité d'utilisation de calcduc comme lance à injection, et en particulier, le
besoin de préserver toute consommation des lances dans la procédé Mitsubishi de fabrication
continue du cuivre de l'usine sidérurgique Kidd Creek localisée à Timmins en Ontario, Canada.
Les problemès rencontrés avec les lances MitsublShl sont actuellement de deux ordres:
i) les coûts directs, tngendrés par la consommation continue ces lances en acier
inoxydable dans la bain de cuivre.
ii) les coûts indirects, associés à un contrôle impropre du procédé, du à la
Olauvaix connaissance de la hauteur de la lance par rapport au bain.
Une lance à injection de type caloduc s'auto-refroidit, ce qui lui permet de maintenir une
température en surface bien en dessous des température des fours Mitsubishi. Une lance
refroidie résiste mieux aux conditions du four, et ainsi. son taux de consommation est diminué.
Le temps de maintien dans le four d'une lance à injection de type caloduc est plusiers fois
supérieur à celui des lance~ conventionelles en acier inoxydable, ce qui permet une économie
dans le coût du matériau. Pendant son utili~tion, la localisation de la lance à injection de type
caloduc est exactement connue, ce qui :"é~"ut le second problème posé et peut-être même
d'autres probléme~ plus importants rencontrés dans le procédé Mitsubishi comme par exemple,
le contrôle de l'opération d'injection par lance.
Le présent travail peut être divisé en trois parties. En première partie, le développement
et l'étude d'un caloduc transparent pe: !T'euent d' ill ustrer des thermosyphons ou des caloducs sans
mèche. La seconde partie est consacrée à la conception, la fabrication et l'étude d'une lance à
injection de type caloduc à l'échelle du laboratoire. Enfin, les connaissances acquises en
laboratoire ont ensuite permis de fabriquer deux lances à injection expérimentales de type
111

1
1
-------------
caloduc, Mark 1 et Mark II. Ces lances ont été testées dans le four de cémentation du cuivre
à l'usine Kidd Creek. Le développement des lances à injection expérimentales de type ;aloduc
a permis de montrer que ces lances auto-refroidissantes ont une durée de vie dans le four
plusieurs fois supérieure à celles des lances conventionnelles en acier inoxydable; de plus. leur
localisation par rapport à la surface du bain de cuivre fondu est maintenant connue
préciscmment.
lV
1
1
,
Acknowledgenlents
The author wishes to express his appreciation to his supervisor, Professor Frank
Mucciardi, for his unellding patience, support and enthusiasm. The many discussions held on
a wide variety of topics were both engaging and illummating.
The autnor is indebted to Ernest Mast and Dr. Mike Kozlowski; without their interest and
backing this work would never have gone as far and as smoothly as it did.
Thanks go out to the members of the Metallurgical machine shop, particularly M.
Knoepfel, as weil as Walter Greenland of the Chemical machine shop for performing the
difficult welding of the first two heat pipe injection lances.
To the staff and graduate students of the Department of Mining and Metallurgical
Engineering, who were countlessly relied upon as a resource, the author would like to express
his gratitude.
Finally, but most importantly, 1 would Iike to thank my parents, Eva and Alex Botos,
and my tàmily. Anyu and Apu, without your tireless love and support, 1 would never have been
capable of such a work.
v

National Library of Canada
Canadian Theses Service
NOTICE
THE QUALITY OF THIS MICROFICHE IS HEAVILY DEPENDENT UPON THE QUALITY OF THE THESIS SUBMITTED FOR MICROFILMING.
UNFORTUNATELY THE COLOURED ILLUSTRATIONS OF THIS THESIS CAN ONLY YIELD DIFFERENT TONES OF GREY.
Biblioth~que nationale du Canada
Service des th!ses canadiennes
AVIS
LA QUALITE DE CETTE MICROFICHE DEPEND GRANDEMENT DE LA QUALITE DE LA THESE SOUMISE AU MICROFILMAGE.
MALHEUREUSEMENT, LES DIFFERENTES ILLUSTRATIONS EN COULEURS DE CETTE THESE NE PEUVENT DONNER QUE DES TEINTES DE GRIS.
c
,
Contents
Abstract
Résumé III
Acknowledgements v
Contents vi
List of Figures j~
LIst of Tables Xli
LIst of Micrographs Xl1l
Nomenclature XIV
Chapter 1 The Heat Pipe ....... . . . . . . . . .. 1
1.1
1.2
2.1
Introduction
Applications
1
5
Ulapter 2 Tht: Heat Pipe Injection Lance .. . . . . . . . . .. 10
Introduction ........................................... 10
2.2 The Mitsubishi Process ..... 11
3.1
3.2
3.3
2.2.1 Introduction........ . ... . 11
2.2.2 The Kidd Creek SmeIter .......... . . . . . . . . . . . . . . . . . . . . . 12
2.2.3 Mitsubishi Lances 15
2.2.4 Lance Consumption . . . . . . . . . . . . . . . . . . . . . . . . . . . 17
2.2.5 The Heat Pipe Lance Concept. . . . . . . . . . . . . . . . . . . . . . . . . . .. 18
Introduction ..... .
Capillary Limit
Sonie Limit ..
Chapter 3 Heat Pipe Theory ................ 20
............................... 20
.... 20
.... 24
304 Entrainment Limit ....................................... 24
VI

r 1 3.5 Boiling Limît ................. . ....................... 25
1
Chapter 4 Previous Work . . . . . . . . . . . . . . . . . 27
4.1 Introduction ..... ............................ 27
4.2 Reat Pipes in the Metallurg\cal Industry ... . . . . . . . . . . . . . . . . . . . . . . . 28
5.1
5.2
5.3
Chapter 5
Introduction
Design and Construction .,
Experimental Procedure
The Transparent Heat Pipe .. . . . . . . . . . .. 30
................................ 30
· ..... 30
· .... 32
5.4 Results and Discussion . . . .. ..... . . . .. ..... 34
5.5 Reat Transfer Model of Transparent Thermosyphon . . . . . . . . . . . . . . . . . . . 35
6.1
6.2
6.3
6.4
6.5
7.1
7.2
7.3
7.4
7.5
7.6
7.7
Chapter 6 The Laboratory Scale Heat Pipe Injection Lance . . . . . .. 36
Introduction .... ...................................... 36
The Making of the LSHPIL ..... . · .... 37
Cleaning and Filling of the pipe . . . . · .... 39
Experimental · ..... 42
Rtsults and Discussion ... · ..... 43
Chapter 7 The Mark 1 Heat Pipe Injection Lance . . . . . . . . .. 57
Introduction ........................................... 57
The Making of the Mark 1 Lance ., . . . . . . . . . . . . . . . . . . . . . . . . . . . . 57
Charging of the Sodium . . . .. ..... . . . . . . . . . . 59
Conditioning of the Lance . ..... ..... . . . . . . . . . . 63
ExperimentaI ........... 64
Results and Discussion .............. . ........... 66
Failure of the Mark 1 Lance ........... . 72
Chapter 8 Scanning Electron Microscope Analysi.: of Mark 1 Lance .... 75
vii

r l 8. 1 Introduction. . . . . . . . . . . . . . . . . . . . . . . . . . . . . . . . . . . . . . . . . . . 75
8.2 Sam pIe Preparation and Analysis .............................. 76
8.3 Results and Discussion .................................... 76
Chapter 9 The Mark II Heat Pipe Injection Lance . . . . . . . . .. 86
9. 1 Introduction. . . . . . . . . . . . . . . . . . . . . . . . . . . • . . . . . . . . . . . . . . . 86
9.2 Construction of the Mark II Lance ............................. 86
9.3 Experimental .......................................... 87
9.4 Results and Discussion .................................... 87
9.5 Failure of the Mark II Lance ................................. 93
Appendix A
Appendix B
Appendix C
References
Chapter 10
viii
Conclusions ................. 98
99
104
111
119

•
1
1
1
Figure 1.0 :
Figure 1.1 :
Figure 1.2 :
Figure 1.3 :
Figure 1.4 :
Figure 1.5 :
Figure 2.0 :
Figure 2.1 :
Figure 2.2 :
Figure 5.0 :
Figure 6.0 :
Figure 6.0 :
Figure 6.1 :
Figure 6.2 :
Figure 6.3 :
List of Figur~s
Schematic of a Typical Heat Pipe .............. ......... 2
Schematic of a Thermosyphon Heat Pipe . . . . . . . . . . . .. ...... 3
Heat Pipe Fireplace Application ......................... 5
Solar Collector . . . . . . . . . . . . . . . . . . . . . . . . . . . . . . . . . . .. 6
Industrial Solids Heat Exchanger . . . . . . . . . . . . . . . . . . . . . . . .. 7
Cooling System for Internai Combustion Engine ............... 8
Schematic of Mitsubishi Process ................... ..... 12
%S in Blister Copper versus Copper Losses to C-Slag ........... 14
Mitsubishi Process Furnace Arrangement at Kidd Creek . . . . . . . . . .. 16
Schematic of Experimental Set-up of Refrigerant II Thermosyphon 33
Dimensions and Materials of Laboratory Scale Heat Pipe Injection
Lance ......................................... 36
Sodium Cut by a Knife . . . . . . . . . . . . . . . . . . . . . . . . . . . . . . . 41
LSHPIL - Kidd Creek Simulation Experiments ................ 42
Illustration of Diffusive Layer of the Inert Gasl Vapour Interface and
Inert Gas Hold-Up ................................. 47
LSHPIL Tests at NTC: Furnace Temperature = 1150 oC, Gas Flowrate
= 0 IImin No Fan, Pressure = 0.8 atm. Condenser length = 40 cm ... 48
Figure 6.4 : LSHPIL Tests at NTC: Furnace Temperature = 1200 oC, Gas Flowrate
= 0 IImin, No Fan, Pressure = 0.97 atm, Condenser length = 48 cm . 49
Figure 6.5 : LSHPIL Tests at NTC: Furnace Temperature = 1200 oC, Gas Flowrate
= 50 l/min, No Fan, Pressure = 0.88 atm, Condenser length = 43 cm 50
Figure 6.6 : LSHPIL Tests at NTC: Furnace Temperature = 1200 oC, Gas Flowrate
= 90 l/min, No Fan, Pressure = 0.73 atm, Condenser length = 41 cm 51
Figure 6.7 : LSHPIL Tests at NTC: Furnace Temperature = 1200 oC, Gas Flowrate
= 90 IImin, Fan, Pressure = 0.62 atm, Condenser length = 23 cm .,. 52
IX

1
1
Figure 6.8 :
Figure 6.9 :
Figure 6.10 :
Figure 7.0 :
Figure 7.1 :
Figure 7.2 :
Figure 7.3 :
Figure 7.4 :
Figure 7.5 :
Figure 7.6 :
Figure 7.7 :
Figure 7.8 :
Figure 7.9 :
LSHPIL Tests at NTC: Furnace Temperature = 1200 oC, Gas Flowrate = 50 I/min, Fan, Pressure = 0.65 atm, Condenser length = 24 cm ..... 53
LSHPIL Tests at NTC: Furnace Temperature = 1200 oC, Gas Flowrate
= 0 I/min, Fan, Pressure = 0.68 atm, Condenser length = 30 cm . . .. 54
LSHPIL Tests at NTC: Close-up of Condenser depicting
the Red Hot Glow of t!1e Lance ......................... 55
Mark l, Pilot Scale Heat Pipe Injection Lance . . . . . . . . . . 58
Hand Cut Sodium in Nitrogen Filled Ziploc Bags . . . . . . . . . . . . . . . 60
Mark 1 Sodium Feed Tubes ........................... 61
Mark 1 Lance, Ready for Outdoor Sodium Charging ............. 62
Melting the Sodium Inside of the Mark 1 Lance, Top Section ....... 63
Melting the Sodium Inside of the Mark 1 Lance, Middle Section ..... 64
Part of Experimental Set-up for Kidd Creek Pilot Scale Heat Pipe
Injection Lance Trials ............................... 65
Na Vapeur Pressure and Outer Wall Temperature Curves for Mark 1
Lance Tests, August 13, 1991. ......................... 67
Na Vapour Pressure and Outer Wall Temperature Curves for Mark 1
Lance Test, August 14 (ab ove) , August 15 (below), 1991. ......... 68
Na Vapour Pressure and Outer Wall Temperature Curves for Mark 1
Lance Tests, August 16, 1991. ......................... 69
Figure 7.10 : Chemical Attack of Mark 1 Lance Tip Versus Undamaged Condenser
Section ........................................ 73
Figure 7.11: Top View of a Lance Section Inside the Fumace next to a Condenser
Section ........................................ 74
Figure 8.0 : Sample Dimensions of Mark 1 Lance ...................... 75
Figure 8.1: X-Ray Analysis of Outside Pipe and Sodium Interface,
Section 1, 12000X ................................. 84
Figure 8.2 : X-Ray AnaJ.ysis of Inside Pipe and Sodium Interface,
Section 2, 6500X .................................. 84
Figure 8.3 : X-Ray Analysis of Inside Pipe and Sodium Interface,
x

1 Section 3, 9000X . . . . . . . . . . . . . . . . . . . . . . . . . . . . . . . . . . . 85
Figure 9.0 : Na Vapour Pressure and Outer Wall Temperature Curves for Mark II
Lance Test, De('ember Il (above), December 12 (below), 1991. ..... 88
Figure 9.1 : Na Vé!pour Pressure and Outer Wall Temperature Curves for Mark II
Lance Test, Oecember 13 (above), December 14 (below), 1991. . . . . .. 89
Figure 9.2 : Na Vapour Pressure and Outer Wall Temperature Curves for Mark II
Lance Test, Oecember 15 (above), December 16 (below), 1991. ...... 90
Figure 9.3 : Na Vapour Pressure and Outer Wall Temperature Curves for Mark Il
Lance Test, December 17 (abov(:), December 18 (below), 1991. ..... 91
Figure 9.4 : Na Vapour Pressure and Outer Wall Temperature Curves for Mark Il
Lance Test, Oecember 19, 1991. ...... . . . . . . . . . . . . . . . . . . . 92
Figure 9.5 : Spiral Shadow of Darker Material on the Condenser Section of the Mark
II !..ance . . . . . . . . . . . . . . . . . . . . . . . . . . . . . . . . . . . . . . . . 94
Figure 9.6 : Inner Pipe of the Mark II Lance After Kidd Creek Tests .......... 95
1 Figure 9.7 : Longitudinal Crack on Inner Pipe of Mark II Lance ............. 96
, xi

1
Table 2.0 :
Table 5.0 :
Table 6.0 :
Table 6.1 :
Table 6.2 :
List of Tables
Results of Field Trial Tests for Different Lance Materials . . . . . . . . .. 18
Low Temperature Working Fluids and Their Physical Properties . . . . .. 31
Common Working Substances and Operating Ré..flges ............. 37
LSHPIL - Kidd Creek Simula:ion Experiments, No External Cooling
Fan ........................................... 44
LSHPIL - Kidd Creek Simulation Experiments, External Cooling Fan ... 44
Xll

1
1
List of Mi\~rographs
Micrograph #1- Inner Pipe and Air I~lterface, Section l, 150X ................. 77
Micrograph #2- Inner Pipe and Sodium Interface, Section J, 150X .............. 77
Micrograph #3- Inner Pipe and Air Interface, Section l, 2000X . . . . . . . . . . . . . . . . 78
Micrograph #4- Inner Pipe and Sodium Interface, Section l, 2000X ............. 78
Micrograph #5- Outer Pipe and Air Interface, Section l, 2500X . . . . . . . . . . . . . . . . 79
Micrograph #6- Outer Pipe and Sodium Interface, Section l, 2500X . . . . . . . . . . . .. 79
Micrograph #7- Inner Pipe and Fumace Atmosphere Interface, Section 2,2000X . . . . .. 81
Micrograph #8- Inner Pipe and Sodium Interface, Section 2, 2000X ............. 81
Micrograph #9- Inner Pipe and Sodium Interface, Section 3, 2000X ............. 83
xiii

l Nomenclature
A area,
Ac external surface area of conden~r,
Ac extemal surface area of evaporator,
AI cross-sectional area for liquid flow,
A. area of individual surface pores of the w·,ck,
Ay vapour core cross-sectional area,
CI wetted perimeter for liquid flow,
C. wetted perimeter of the individual surface pores of the wick,
d screen wire diameter,
d, pipe inside diameter,
do pipe outside diameter,
d~ vapour core diameter,
1 0 diffusion coefficient,
<Iv dynamic pressure coefficient,
f, drag coefficient for liquid flow,
fy drag coefficient for vapour flow,
FI frictional coefficklll for liquid flow,
Fv friction al coefficient for vapour flow,
g gravitational acceleration,
he overall heat transfer coefficient at condenser,
he overall heat transfer coefficient at eva:x>rator,
k thermal conductivity,
ke effective thermal conductivity of liquid saturated wick,
K wick permeability,
L effective heat pipe length,
L. length of heat pipe adiabatic section,
Le length of heat pipe condenser,
1 XIV

1 Le length of heat pipe evaporator,
1.. total length of heat pipe,
M molecular weight,
N sereen mesh number,
P pressure,
Pc capillary pressure,
Pcm maximum capillary pressure,
PcDI,e effective capillary pressure available for fluid circulation,
p. liquid pressure,
Po stagnation pressure,
Ppm maximum effective pumping pre3sure,
Ppw saturation vapour pressure at the pipe wick interface,
Pt total pressure,
Py vapour pressure,
1 ~p. liquid pressure drop,
~Py vapour pressure drop,
~P.l. hydrostatic pressure in direction perpendicular to pipe axis,
Q heat flow rate,
Qb,max boiling limit in heat transfer rate,
Qc,max capillary limit on heat transfer rate,
Qe,lDIX entrainment or flooding limit on heat transfer rate,
QI,max sonic limit on heat transfer rate,
(QL)c,1II&It heat transport factor,
r radius of cylinder,
rb bubble radius,
rc effective capillary radius,
rb,. hydraulic radius for liqUld flow,
rb,y hydraulic radius for vapour flow,
r. inside radius of pipe,
t rn boiling nucleation radius,
xv

,( ro outside radius of pipe,
r" vapour core radius,
R universal gas constant,
Rt1 Iiquid flow Reynolds number,
Re" vapour flow Reynolds number,
thickness,
lp pipe wall thickness,
lw ~ tck thickness,
T temperature,
TI gas temperature,
To stagnation temperature,
Tpw temperature at the pipe-wick interface,
T" vapour temperature,
T"", temperature at the wick-vapour interface,
VI liquid velocity,
V" vapour velocity,
w groove width,
x axial position,
Xrd reference axial position from where x is measured,
Xmm axial position where capillary pressure is minimum,
Xmax axial position where capillary pressure is maximum,
{3 profile coefficient for momentum flux,
1'" vapour specifie heat ratio,
E wick porosity,
À latent heat of vaporization,
1-'1 liquid dynamic viscosity,
I-'v vapour dynamic viscosity,
p density,
PI liquid density, , Po vapour density at stagnation condition,
xvi

J
J
·1
Pv
(1
(1
vapour density,
surface tension coefficient,
Stefan-Boltzmann ,:onstant,
liquid frictional stress,
vapour frictional stress,
heat pipe inclination measured from horizontal position,
xvii
t
1
Chapter 1
The Heat Pipe
1.1 Introduction
In 1942, R. Gaugler of the GM corporation, USA, tiled a patent application l for a heat
transfer device to be used in refrigeration systems. It was not until 1964 that the name heat pipe
was given to the device by M. Grover, who independently reinvented the concept2• Grover
added a brief theoretical analysis to describe his work with a stainless steel heat pipe. It soon
followed that severa! articles were published on the application of heat pipes for cooling
electronics, air conditioning, engine cooling and others3•4
•5
• Since Grover's invention,
thousands of papers have been written on the subject of heat pipes, advancing the understanding
of this important device to our present state. That state is only in its infancy as there is far more
to be learned about this remarkable invention.
The heat pipe is essentially a heat transmission devke which is capable of moving very
large quantities of heat over minimal temperature gradients. The amount of heat that it can
transport is orders of magnitude greater than any equivalently sized solid conductor. A suitable
way to describe its heat transfer capabilities is to caU it a super-conductor of heat, much like we
refer to super-conductors in electrical applications. Among the many striking advantages of the
heat pipe are: constructional simplicity, operational flexibility, accessibility to control and abHity
to transfer heat at a high rate over very small temperature gradients6•
Typically, th~ heat pipe is a closed tube or cham ber, varying in shape and size. Inside
the heat pipe is a working substance and a capillary wick. The wick is not always necessary and
when gravit y can be e,:ploited, no wick is required, in which case the pipe is termed a
thermosyphon. Thermosyphon he'u pipes are essentially the focus of this study and will be dealt
with in detail later in this work.
A heat pipe can be divided into 3 regions: the evaporator section, the adiabatic section
1

1
,
and the condenser section. Figure 1.0 shows an illustration of a typical heat pipe. Initially, tlle
heat pipe is evacuated so that the pressure in the container is al a minimum; ideally, um
atmospheres. Heat is absorbed in the evaporator section, conducted through the walls of the
container and :hen transmitted to the working substance. The working substance is chosen
HEATIN
EVAPQRATQR SECTION
Figure 1.0 : Schematic of a Typical Heat Pipe
primaïily because of its properties at the operating temperatures of the evaporator and the
condenser. The substance chosen must have a normal boiling point at or neal the evaporator
temperature. The heat conducted through the walls of the evaporator section is absorbed through
the vaporization of the working substance. As evaporation takes place a pressure gradient is
established and the vapours generated travel to the other end of the pipe, the condenser.
In the condenser section, the environment is at a temperature weIl below the normal
boiling point of the working substance so that the vapour is forced to condense on the walls of
2

1
the container. The latent heat of condensation is then released and conducted through the walls
of the container and out into the environment. The condensate retums back ta the evaporator
by a capiJJary wick or by gravit y when no wick is required (thermosyphan). ln the case af a
wicked heat pipe, depletian af Iiquid by evaporation causes the liquid vapour interface in the
evaporator ta enter into the wick surface and a capillary pressure is develaped there. The
resulting capillary pressure pumps the conc.iensed Iiquid back ta the evaporatar far re
evaporatian. ln the case af a thermosyphon, the condensate flows down the walls as the force
of gravit y retums the liquid back to the evaporator either as a film or as droplets. In the
adiabatic section no heat is transferred. The following figure is a schematic representation of
a thermasyphon, heat pipe.
Condensate
Condensor ..
Qin .. (Hot Section)
t
~onnected to
Pressure Transducer
...... Qeut (Cold Section)
Condensate
Vapeur
1 • Evaporator
Section
Figure 1.1 : Schematic of a Thermosyphon Heat Pipe
3

1
l
1
The evaporation and condensation processes will continue If no blockage of tlow is
incurred and the heat pipe is in a feasible operatmg temperature range. Thus, an equilibrium
condition is set up where continuous vapour and liquid tlow take place.
The key to the heat pipe's tremendous ability to move heat is In the energy absorbed and
released by phase changes. This energy can be absorbed at one location, transported to another
and released without any significant losses. Thus, the heat pipe essentially re~distributes heat
energy very effectively. This is a valuable property that can be incorporated into many
engineering applications. It is also this property that has enabled the Heat Pipe Injection Lance
to perform successfully.
4

l
1
1.1 Applications
Heat pipes are used in a wide variety of applications most of which involve a heat
exchange device. The following are descriptions of patents for a variety of heat pipe
applications.
Heat Recuperator7:
A large portion of the heat which is entrained and lost in the exhaust gas of a fireplace
an be recovered bya heat recuperator. Il is essentially comprised of heat absorbing elements
(evaporators) and heat distributing elements (condensers), with a heat carrier medium in
circulation (the working fluid). This patent claims that 20-35 % of the heat released by buming
wood can be recovered by this system. Referring to Figure 1.2, water, the working substance,
evaporates in duct 2 and condenses in duct 5 using the buming wood, 3, as the heat source. The
condensate is returned through tube Il to the evaporatc.: and a fan, 15, convects the heat given
off at the condenser into the room.
Figure 1.2 : Heat Pipe Fireplace Application
5
•
1
1
1
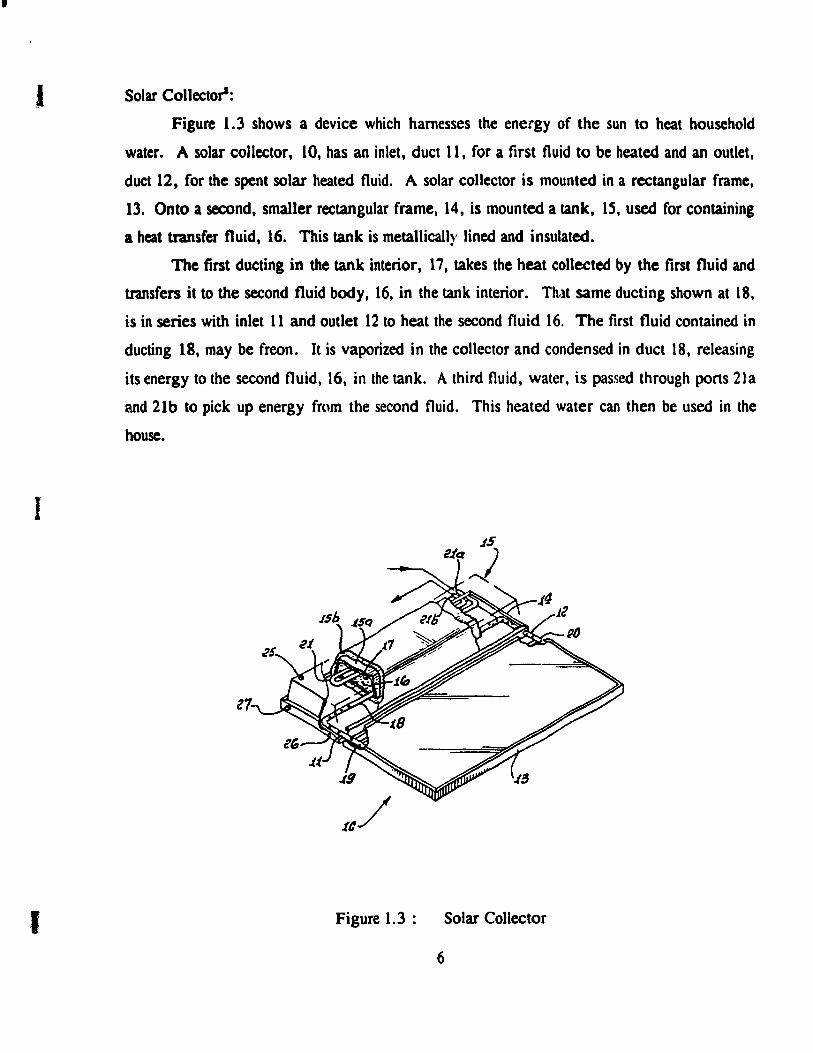
Solar Collector':
Figure 1.3 shows a device which hamesses the energy of the sun to heat household
water. A solu collector, 10, has an inlet, duct Il, for a tirst fluid to be heated and an outlet,
duct 12, for the spent $Olar heated fluide A solar collector is mounted in a rectangular frame.
13. Onto a second, smaller rectangular frame, 14, is mounted a tank, IS. used for containing
a heat transfer fluid, 16. This tank is metallically lined and insulated.
The first ducting in the tank interior, 17, takes the heat collected by the tirsl fluid and
transfers it to the second fluid body, 16, in the tank interior. Th.ll same ducting shown at 18,
is in series with inlet Il and outlet 12 to heat the second fluid 16. The tirst fluid contained in
ducting 18, may be freon. It is vaporized in the collector and condensed in duct 18. releasing
its energy to the second fluid, 16, in the tank. A third fluid, water. is passed through ports 21a
and 21b to pick up energy fmm the second fluide This heated water can then be used in the
house.
Figure 1.3 : Solar Collector
6
1
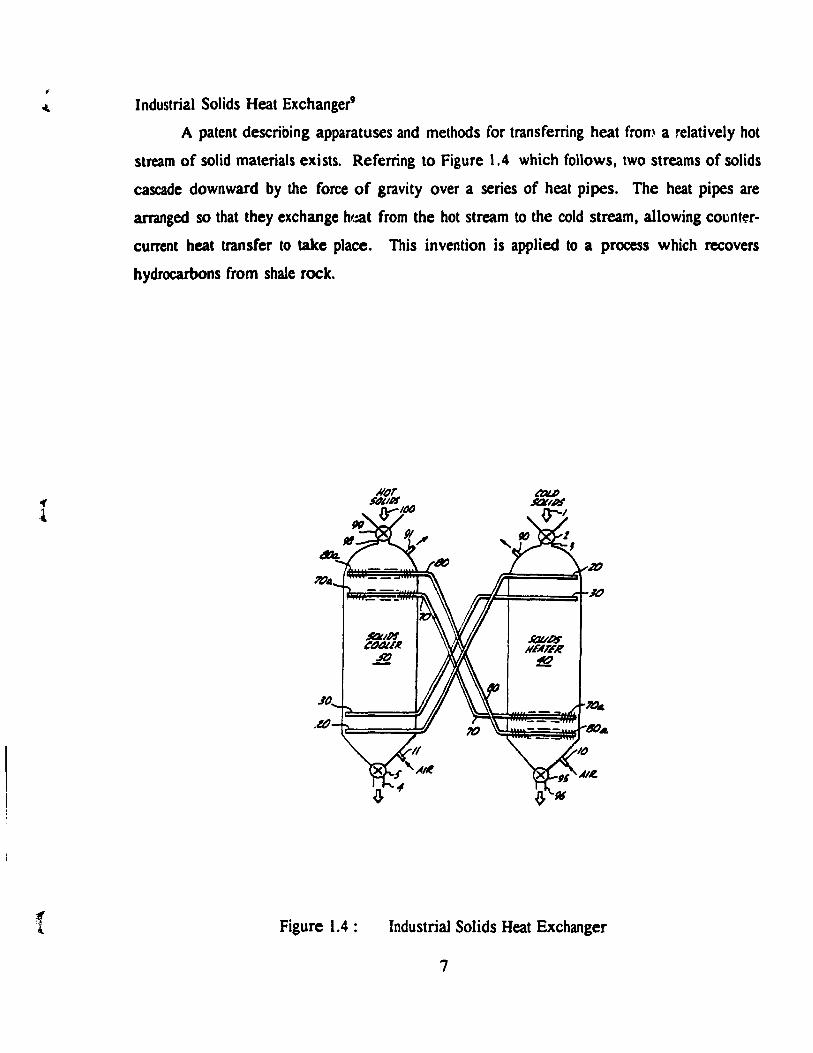
Industrial Solids Heat Exchanger9
A patent describing apparatuses and methods for transferring heat from a relatively hot
stream of saJid materials exists. Referring to Figure 1.4 which follows, two str'eams of soJids
cascade downward by the force of gravit y over a series of heat pipes. The heat pipes are
arranged 50 that they exchange hf.:at from the hot stream to the cold stream, allowing COl'lnter
current heat transfer to take place. This invention is applied to a pracess which recovers
hydrocarbons from shale rock.
/FI,~====rf()
Figure 1.4 : Industrial Solids Heat Exchanger
7

t
1
Cooling System for Internal Combustion EnginelO
According to a patent by Daimler-Benz, heat pipes can be used to cool an internai
combustion engine of an automobile. Such a system has the advantage of dispensing with pumps
to provide the necessary air cooling of the engine. Instead, the evaporation and condensation
of a working fluid can be used to cool the engine, at exact enlieal locations as Figure 1.5
illustrates. Locations 2, 3, 6a, 6b, and 7 indicate thf' 4!ngine space, a conventional combustion
engine, 4 cylinder head, the evaporator and a common condenser, respectively.
~""1<7-_"",--..J1
Figure 1.5 : Cooling System for Internai Combustion Engine
8

(
Heat pipe applications are far less common in the metallurgical industry than they are in
other engineering fields, but they do exist. According to the patent of the Institut de Recherches
de la Siderurgie Francaise (IRSID), heat pipe technology can be used to eliminate complications
caused by aggressive hot slags in the refractory lining of metal smelting equipment.11 This can
be done by arranging heat pipes of high thermal conductivity in the upper annular zone of the
refractory lined smelter, or in the zone where slag is forming. The heat pipes remove heat
between the upper and lower levels of slag, thereby cooling the region and reducing the
damaging effects of the slag.
A patent was found that describes a heat pipe application for cooling blast furnace
tuyeres l2 • Essentially, a blast fumace tuyere is a large copper block with a hole through which
air is blown. Typically, water cooling is used to cool the copper blocks. This is not the safest
way. If the blacks fail, which they eventually will, water may leak into the blast fumace and
cause an explosion. A heat pipe cooled tuyere would draw the heat back to a more manageable
location where it could be cooled safely, with water.
From the extensive literature survey carried out on the subject, it is clear that the
metallurgical industry is not benefitting from heat pipe technology. Il was feit that with the right
application and the proper exposure, this could change. With a view towards increasing the
metallurgical industry's awareness of heat pipe technology, investigations into a heat pipe
injection lance began.
9

1
,.
1
Chapter 2
The Heat Pipe Injection Lance
2.1 Introduction
Realizing the potential of this unique devict:, and the importance of heat energy in the
metallurgical industry, part of the motivation of this work was to elevate the industry's
awareness of heat pipes by finding a suitable applic..ation that could demonstrate its abilities.
Ideally, the application would illustrate the propertie~ of a heat pipe and how these properties
can be exploited to improve a metallurgical process, thereby generating more interest in the use
of heat pipes as a metallurgical tool. At the same time, the development of such an application
would further our understanding and expertise of heat pipes so that any outside interest generated
from our work c"uld be properly dealt with.
A number of possibilities were considered as applications by Professor F. Mucciardi and
the author, at the outset of this work. We were joined by E. Mast of the Noranda Technology
Center, Pointe Claire, Quebec, Canada, in our search for an appropriate application. E. Mast
aIso believed thal the heat pipe was a device with a tremendous potenttal in the metallurgical
indl'stry. Through E. Mast's contact with Dr. M. Kozlowskl of Kidd Creek Mines, Timmins.
Ontario, Canada, and discussions with Dr. F. Mucciardi and the author, the idea of using a heat
pipe in injection lancing was put forth.
The objective of this work wa..: to develop a lance, whereby heat pipe technology would
be used to engineer a self cooling injection lance that could replace the present injection lancing
system used in the Kidd Creek smelter. The potential benefits of using a heat pipe injection
lance are:
i) Savings in lance material costs and,
ii) Control over the lancing operatIon
This novel lance would essentially be an annular, wickless heat pipe (thermosyphon) with the
10
(
(
(
injection chamber being the center of the annulus. The heat pipe injection lance would be
implemented into the Mitsubishi process used at the Kidd Creek smelter.
2.2 The Mitsubishi Process
2.2.1 Introduction
Since the early sixties, copper producers have focused on a process that could
continuously produce molten copper from its concentrates. Although the goal was the same, a
variety of very different processes have emerged. The dominant copper converting proc~sses
existing todayare the Outokumpu and Inco flash fumaces processes, the Noranda process and
the Mitsubishi process. Perhaps none but the Mitsubishi process is truly continuous as the other
processes still use convention al Pierce-Smith converters performing batch operations as opposed
to the continuous matte conversion of the Mitsubishi processl3• Although these new processes
have in common an intent to reduce fuel consumption by utilizing the heat of oxidation of iron
and sulphur contained in the copper concentrates, the technical procedures followed by each
differ significantly'4, In the flash furnace processes, the main reaction proceeds within a solid
gas dispers~on system causing the dust loading of the off-gas to be rather high. AIso, a need
exists for a separate vessel to treat high magnetite slag due to ex cess magnetite generated at the
reaction shaft. In the Noranda process, the raw materials are spread over the bath and oxidation
air L Lllown through tuyeres at the bottom of the reaction vessel. In the Mitsubishi process raw
materials and oxidizing air are blown into the molten bath through lances situated just above the
bath.
It was in 1968 that the Mitsubishi Metal Corporation started a test pilot plant of a
continuous copper smelting and converting process at the Onahama smelter. The basic notions
behind the design of the new process were:
a) Smelting and converting reactions take place in separate fumaces.
b) Transportation of melt to be carried out through launders connecting the fumaces.
c) Top blow lances to be used for air blowing and solid materials feeding.
11

l ln 1971, a semi-commercial plant was started at ~he Onahama smelter. After a number
of years a full scale plant began in March 1974, at the Naoshima smeller. In June 1981, the
second Mitsubishi process was commissioned at the Kidd Creek smelter in Timmins, Ontario,
Canada.
1.2.2 ne Kidd Creek Smelter
Figure 2.0 shows a schematic flowchart of the Mitsubishi process at Kidd Creek. The
process comprises three steps: smelting of raw materials at the S-furnace, separation of the
resulting slag and matte at the SH-furnace and converting of high grade matte at the C-fumaceI4 •
Stag losses can be controlJed to achieve acceptable economic levels and converter slag can be
recycled to the smelting stage.
Cones, Fluxes C-Slal, Fuel Slast Air, 40-50%0,
llunces
S-Furnace
rlux, Coolant Slast Air, 25-30%0,
iuncas C-SIII to S-Furnlce
~ Blister Copper to Anode Furnaca
Dlseerd C - Furnace Sie.
Fig Ire 2.0 : Schematic of Mitsubishi Process
12

(
(
(
The SmeIting Stage
A mixture of copper concentrates. fluxes, reverts and pulverized coal combined with
oxygen enriched air (40-50%) is injected through vertical lances into the molten bath of the S
furnace al speeds of up to 150-300 mis. In aIl there are ten process lances, five of which shroud
the fced pipeSIS. The height of the lances above the bath is approximately 50 cm. Lances are
rotated continuously with periodic adjustments to maintain proper height. The lances are
consumed and replaced periodically.
The consumable lance is made of a stainless steel pipe with no external cooling.
Contained in the S-furnace is a molten bath comprised mostly of matte and a thin layer of slag.
This can allow for deep penetration of thr :l't even without submersion of the lances.
Penetration depths have been calculated in a model developed by Kimural6 to be in the order
of 1.4 m. Hearth erosion just below the lances support this model.
The Converting Stage
Molten copper matte is converted to blister copper by gas injection through stainless steel
lances. The injection lances, like the S-fumace, are above the bath. The injection is a mixture
of pulverized flux and oxygen enriched air. The structure and the operating principles of the
C-furnace are essentially the same as the S-furndce.
The predominant reactions in the C-furnacc are as follows:
Oxygen blown through the lances can oxidize dissolved sulphur in the matte as weil as copper
to regenerate cuprous oxide. The reactions are as follows:
13
, ,

J Plant data relating copper loss to the C-Slag and %S in the blister copper is shown in the
following figure:
From the plant data we can see that bath plants operate close to PS02 = 1 atm. This
suggests that S~ attack is one mecllanism for the chemical deterioration of the consumable
lances since the atmosphere in which the lances operate is predominantly sulphur dioxide. This
attack is much more severe in the C-fumace than in the S-furnace. The result is greater
consumption of the lances in the C-fumace.
14
.\
2.2.3 Mitsubishi Lances
One of the fundamental differences of the Mitsubishi process versus the Noranda process
or the Flash Fumace processes is the top blowing of oxygen enriched air and fluxes into a
molten bath. Top blowing is vital in aIlowing the continuity of the process since no complete
shutdown of production is required to replace the lances, unlike the tuyeres in the Noranda
process. Lances can be replaced one by one allowing continuous blowing from the other lances.
The tuyeres must be constantly replaced in the Noranda process requiring periodic shut down
of the reactor.
Top blowing aIso alloYis the system to be closed, favouring better control of the off-gas.
Rather than large fluctuations from no off-gas to peak off-gas as in the Noranda process, where
the handling system must be designed for peak operation, the Mitsubishi process needs only to
deal with a much smaller steady stream of gas. Environmentally it is much more sound.
Top blowing allows for the three fumace design by not interrupting the cascading flow
of the matte and slag from one furnace to the other. This design was fundamental to the
Mitsubishi process since the very beginning of the deveJopmental work17•
Figure 2.2 shows the Mitsubishi process furnace arrangement at Kidd Creek, ilIustrating
the placement of the lances and the cascading liquid delivery system. The off-gases from the
S-fumace and C-furnace are removed by a fume-hood venting system which in turn delivers the
off gases (predominantly SO,) to an acid plant.
Il is clear that the injection lances of the Mitsubishi process play a key role in the system.
Ideal operation of the Mitsubishi process requires that the process lance tips in both the smelting
and converting fumaces are maintained close to 0.5 m above the bath surface. Due tl) the harsh
conditions in the fumaces, stainless steel lances are consumed and periodically replaced by
threading on a new section. Unfortunately, it is not quite as simple as just replacing the lance.
A .... ajor problem with consumable lances is the fact that their exact whereabouts within the
fumaces are unknown. lf the rate of consumption was uniform and predetermined, the location
of the lances could be easily calculated. However, this is not the case and the result is a process
which Jacks good control. Presently, the only method of determining lance location is by visual
inspection which can only occur when the fumaces are shut down. Proper adjustments are then
made. This is not afl ideal means of control. Certainty of penetration depths cannot be had so
15

that optimization of the process is not achieved.
(Kidd Creek)
Figure 2.2 :
Converting Fu,n,ce
Sm.'llng Furn,CI
51'9 Clun."g Furnace
Mitsubishi Process Fumace Arrangement at Kidd Creek
16

1 '14.
2.2.4 Lance Consumption
The freeboard environ ment in the smelting and converting furnaces is both sulfidizing
and oxidizing with temperatures weil above the maximum working limit for any steel. Stainless
steel is also dissolved by both matte and blister copper. The conditions that the process lances
have to endure are not steady. Due to the cyclic nature of the solids delivery system, variations
in furnace freeboard temperature and S02 levels and changes in lance cooling offered by the
injection are encountered. Splashing from the injection causes accretions of matte and sIag to
form on the lances which can be seen during visual inspection. Accretions can become very
large during standard operation of the furnaces. The following problems have been encountered
during lance operation:
a) Dissolution of the lance tip if lowered into the melt.
b) Melting of the lance tip in proximity of the reaction zone.
c) Enhancement l'f mechanism b) by sudden loss of protective accretion.
d) Mechanical failure of the lance body under a large asymmetric rotating load (accretion)
at high temperature in a corrosive environ ment.
e) Lances which have burned back to the roof may cause localised heating and shorten
the lives of other lances.
f) Thermal cycling.
Investigations into improving lance reliability have been ongoing since the plant was
commissioned. The reasons for these investigations are two-fold; firstly, the direct cost oflance
material and secondly, and perhaps of greater importance is the indirect costs of process
efficiency related to poor control of the lance height.
Tests have been conducted by Kidd Creek both in the plant and in a laboratory. The tests
focused on evaluating the performance of different lance materials taking costs into account.
A number of different candidate lances were tested. The results are presented in the following
table.
17

1
l
Table 2.0 : Results of Field Trial Tests for Different Lance Materials
Mild Steel On S-Fumace Inexpensive But Poor Performance
Assorted Refractory Clad Lances Uncertain Fates-Poor Choice
Diffusion Coated Lances No Improvement
Type 304L No Improvement ,
Type 316 Poor Performance
High Chromium Stainless Steel Large Improvement
Corguard Lance Poor Performance
The investigations found that High Chromium stainless steel (HC) lances cou Id last an
order of magnitude longer than the lances being used. Even with the much higher material
costs, large costs savings in lance consumption were realized when the HC lances were
implemented .
Although the HC lances have improved the situation in the S-Furnace and the C-furnace.
lances are still consumed and lance location is still unknown.
2.2.S The Heat Pipe Lance Concept
The bulk of the experimentation carried out for this work took place at the Kidd Creek
Smelter. The work that preceded it was preparatory lab scale work. The goal of this work was
to investigate the potential of using heat pipe technology to build a self-cooling lance which
could be incorporated into the Mitsubishi Process in the Kidd Creek furnaces. The reasoning
behind a self-cooling lance is: if a quantity of accretion can be frozen onto the lance and
maintained due to the lower temperature of the lance, the lance can be protected from the
atmosphere. Maintaining the lance at a much lower temperature will also slow down the kinetics
of the reactions at the interface, exponentially. If the life of a lance can be improved so that it
is severa! orders of magnitude larger than the present situation and the exact location of the lance
18
.". ,
!
relative to the bath known, materials costs can be reduced and process optimization can be had.
The full potential of top blowing could be realized as direct control over the process would be
achieved .
19
1 Chapter 3
Heat Pipe Theory
3.1 Introduction
With the objectives ofthis work stated, details of the heat pipe's operating principles now
follow. During the operation of a heat pipe it is often desirable to maximize the circulation of
working fluid thereby maximizing heat transport. Four limitations affecting the circulation of
working fluid may be encountered during heat pipe operation. These limitations are the capillary
limit, the sonic limit, the entrainment limit and the bOlling limit. Besides the design criteria and
material constraints, it is these limitations that determine the heat removal ability of the heat
pipe. More specifically, depending on the particular heat pipe system and operating criteria, it
will be one of the aforementioned limits which will determine the maximum possible heat
removal rate of the heat pipe system.
Based on previous work and his own work, Chi includes in his book entitled " Heat Pipe
Theory and Practice: A Sourcebook"6 some practical equatlOns and examples to determine the
aforementioned limitations. These equatlons will be briefly described and then applied to a
conventional heat pipe example. Ail the symbols used in the equations are defined in the
nomenclature section. The solutions to the example are worked out in Appendix A.
The equations which follow incorporate the laws of fluid mechanics and heat transfer to
establish the theory for predicting heat transport limitations.
3.2 Capillary Limit
In wicked heat pipes, the amount of heat that can be transported is restricted by the
amount of liquid which can be returned by the wick, which in turn is a function of the capillary
pressure in the wick. The capillary pressure is a result of pressure differences between the
vapour and the liquid. As vapour flows from the evaporator to the condenser, there exists a
20

vapour pressure gradient along the length of the pipe. The pressure is higher on the evaporator
si de than on the condenser side. Similarly, a liquid pressure gradient exists along the length of
the pipe as the condensate flows from condenser to evaporator. For a capillary pressure to exist
these two pressures must be different.
This pressure difference between the two sides of the liquid-vapour interface, the
capillary pressure, is established by the menisci that form at the interface, i.e. by forcing the
interface back into the wick structure. The pressure balance can be described mathematically
as follows:
If we introduce into this equation the capillary pressure, Pc, defined as the difference between
the vapour pressure and liquid pressure at the vapour-liquid interface, we have:
(2)
There exists a maximum capillary pressure that can develop for a given liquid-wick system. As
the heat rate into the pipe increases, the evaporation rate of fluid in the evaporator increases,
placing a greater demand on the wick to pump the condensed liquid back to the evaporator.
When the wick can no longer return liquid to the evaporator at a rate equal to the rate of
evaporation, the capillary limit is reached. The evaporator dries out and the temperature rises
drastically. Unless the heat source is reduced, the pipe will cease to operate properly and mciy
eventually fail.
The general equation for the capillary limitation on heat load according to Chi is:
P =2.!!..-!:"P =~J"'(dPv _ dP,~ c",.e r ..1. dx dx
c z..
The liquid pressure gradient can be found from:
dP, - = -F,Q± p ,gsinV dx
21
(3)
(4)

l
-_._-----------------------------
In this equation the frictional coefficient for liquid flow is:
and the wick permeability is:
2
K =2E-'...;."J(j,Rt,>
Similarly for the vapour pressure gradient we have:
dP" dQ2 -=-FQ-D-dx v "dx
where the frictional pressure coefficient for vapour flow is:
and the dynamic pressure coefficient for vapour flow is :
These equations can be combined to yield a simplified form:
L,
z2--âPJ. -p,gL,siD1~= J<F,+F )Qdx 'e 0
(5)
(6)
(7)
(8)
(9)
(10)
This equation, which is for a conventional heat pipe, assumes that at x = 0, the end of the
condenser, the capillary pressure is a minimum and at x = L., the end of evaporator, the
capillary pressure is a maximum.
From equation 10 an expression for capillary limitation can be found by first establishing
an expression for the heat transport factor:
22

·f
L, f
(QL)c,rnu =) Qdx o
(11)
The capillary limit can be found from the heat transport factor (QL)c,mu using the following
relation:
(12)
ln order to de mon strate capillary limit calculations, the following example taken from
Chi6 will be considered. This same example, which may be regarded as a typical heat pi~
situation, will also be considered for sonic limit, entrainment Iimit and boiling limit calculations.
The latter operating limits will be described in the following sections. The calculations for this
example are worked out in Appendix A.
Example 1. A O.Sm long water heat pipe, operating at 373.15 K with a wrapped-screen wick
has the following characteristics:
Copper tube o.d., do = 2.54 X 10⁻² m.
Wire screen mesh number, N = 7.87 x 10⁻⁵ m-I •
Screen wire diameter, d = 6.25 X 10⁻⁵ m.
Screen wick thickness, lw = 1 X 10⁻³ m ( 8 layers approx. ).
Copper tube Ld., di = 2.21 X 10⁻² m.
Vapour core diameter, dy = 2.01 X 10⁻² m.
heat pipe inclination, '" = 0 rad.
Condenser length, Le = 0.1 m.
Adiabatic Length, L. = 0.3 m.
Evaporator Length, Le = 0.1 m.
Using equation 10 and referring to Appendix A, we can see that the theoretical capillary
limit for this pipe is 84.5 W.
23

1 1
1
1
3.3 Sonic Limit
The sonic limit is encountered when the vapour velocities in a heat pipe reach sonic
speeds. In a heat pipe with constant vapour core diameter, the vapour stream velocity is
controlled by evaporation and condensation of the working substance. As more vapour is
generated, i.e. increased heat load, the velocity of the vapour will increase to accommodate the
greater mass flow rate of vapour. In tum, more condensation will take place. We can compare
this situation to a compressible fluid flowing through a converging-diverging nozzle. Velocity
variations in such a situation result from a constant mass flow through a variable area. In the
case of the heat pipe, the situation is reversed; the area is constant but the mass flowrate
changes. In both cases, as the fluids are compressible, the velocities change with the changes
in pressure that arise from either a decrease in area or an increase in the mass flowrate.
The sonic limit of a heat pipe can be expressed in the following equation:
(13)
When the sonic limit is reached, a choked flow condition results wherein the flowrate will no
longer increase. Increasing the heat rejection rate beyond the sonic Iimit serves only to decrease
the condenser temperature, creating large axial temperature gradients without increasing the heat
transfer rate.
ln Appendix A, the sonic limit is calculated for the water heat pipe in example 1. The
sonic limit is found to be, Qs.max= 9.19 X 10⁴ W, which is orders of magnitude higher than the
capillary limit.
3.4 Entrainment Limit
Inside the heat pipe a two phase (Le. liquid and vapour) system exists, where one phase
flows in the opposite direction of the other. As the heat input into the heat pipe increases, so
do the velocities of both phases. Since the phases are travelling in opposite directions, any
increase in heat flux amplifies the net change in velocity between the vapour and liquid. Shear
forces exist at the vapour-liquid interface due to the relative vapour to liquid velocity. If the
24

4:
(
(
relative vapour velocity is high enough, a critical limit is reached resulting in vapour tearing
away Iiquid from the surface and entraining it in its flow. This entrain ment limit is reached
when the demand on the liquid return system exceeds its ability, resulting from the excess
entrained liquid which it must accommodate but cannat. The evaporator becomes depleted and
eventually dries out.
The equation to determine the entrain ment heat transport limit in a conventional heat pipe
is:
( OP,,)lfl
Q,~=A). -2r""s
(14)
The entrain ment limit for the heat pipe in eXclmple 1 is calculated in appendix A to be 1.64 x
10" W. This value is smaller than the sonic limit but still orders of magnitude larger
than the capillary limit.
3.5 Boiling Limit
The occurrence of evaporation at a solid-liquid interface is termed boiling. This process
occurs when the temperature of the surface exceeds the liquid saturation temperaturel8 • If it
is exceeded by a large enough temperature, vapour bubbles form at the solid surface. In a heat
pipe, when evaporation occurs within the liquid pool of the evaporator, bubbles can form and
di'\turb the circulation of liquid. If the circulation of fluid to the walls of the pipe is interrupted,
"hot spots" can form and damage the pipe wall. This is another limit which must be considered
when calculating the maximum theoretical heat which can be transported. To determine the
boiling Iimit, the theories of nucleate boiling must be considered. Two separate processes are
involved. (i) nucleation or the formation of bubbles and (ii) growth and motion of these bubbles.
At equilibrium, a spherical bubble near the pipe-wick interface will follow the relation:
(1S)
The liquid pressure is equal to the vapour pressure minus the capillary pressure at the liquid
vapour interface. Using this and the CJausius-Clapeyron equation, T and Pean be related along
25

the saturation Une to yield:
Tv (20 1 T -T =---P Pw IW Âp r C
\1 b
(16)
where (Tpw-Twv) is the temperature drop across the wick structure at the evaporator section.
Using conduction theory, the following relation cao then be calculated:
Qln(r/r.) (T -T \
pw wvJ 21tLJc. (17)
Equating these two equations and replacing rb with rn, the initial radius of the vapour bubbles
at equilibrium, the vapour bubbles will form and grow if:
(l8)
Values of rD have been experimentally determined by Griffith and Wallisl9• Their results
indicate that rD varies from lx104 to 10-3 in. In the absence of non-condensible gases, these
values are much lower. A good estimate for rn in heat pipes is 10-3 to lO-s in., depending on
how good the vacuum is. The boiling Iimit is calculated for example 1 in Appendix A and is
found to be 1394 W.
When considering the four limitations for the conventional heat pipe in example l, it is
c1ear that the sonic limit is the least worrisome, with a value of 9.19 x lO4 W. The entrainment
limit cJosely follows with a value of 1.64 x 10" W. The boiling limit is an order of magnitude
smaller than these limits but still not the determining factor. As suspected the capillary limit is
the limiting factor in heat transport, allowing the heat pipe to transport only 84.5 W.
26

Chapter 4
Previous Work
4.1 Introduction
Since the heat pipe's re-invention by M. Grover in 1963, the acceptance and use of heat
pipes has grown. Besides the specific applications mentioned earlier in this work, vast amounts
of scientific research have been carried out in an effort to better understand the fundamental
princi?les of the heat pipe. Investigations into the performance characteristics of heat pipes such
as heat transport capabilities20•21 , compatibility and reliability of heat pipe materials22, and
operating Iimits of heat pipeS23 have been undertaken.
Even though general heat pipe concepts are straightforward, one finds thal the transport
phenomena taking place within a heat pipe are rather complicated. Modelling heat pipe systems
requires a solid understanding of the two-phase flows that occur during operation. The study
of heat pipes incorporates the sciences of heat transfer, fluid dynamics, materials and
thermodynamics6• Ali of these disciplines must be understood to develop accurate mathematical
models of a heat pipe system.
Work has been done to mathematically model the operation of heat pipes through
numerical analysis by Faghri and Parvani24 and Faghri and Chen25• These works describe the
operation of the heat pipe, predicting the pressure drop and velocity variations within the pipe.
In other work by Faghri, coneentrie annular thermosyphons as weil as heat pipes are considered
wherein fundamental analysis of vapour flow, capillary limit and heat transfer characteristics is
done26•27•2I • Faghri's main eoneem is with the numerical analysis of the fundamental
transport phenomena taking place during heat pipe operation. One of his most recent
publications dealt with the mathematical modelling of heat pipes during start-uJY9.
The operating limits of a heat pipe are a concem in anyapplication. Factors 5uch as
capillary Iimit, sonie Iimit, entrain ment limit and boiling limit must be considered in any heat
27

pipe design. Ivanovsky et 31., investigated the capillary limit in sodium heat pipes wherein they
discuss the optimization of geometric parameters for improving carillary limitJO• Fukano et
al. 31, detennined the operating limits of a copper-methanol two phase thermosyphon by
assessing the efJ:è:cts of tube diameter, system pressure and amount of working fluid on the
periodic oscillations arising from the flooding limits. Dobran analytically investigated dry-out
and flooding of a two-phase thermosyphon based on a lumped parameter ",escription of the
system32• Dobran also investigated the suppression of the sonic limit in high temperature heat
pipes through optimization of heat pipe geometry and selection of working fluid33• He found
that higi. rates of heat transfer can be achieved with large vapour flow cross-sectional areas,
small lengths of the evaporator and adiabatic regions, and normal-to-the-main-flow Iiquid
evaporation in the evaporator.
Studies on the effect of inclination angle of the heat pipe have also been done. Typical
questions that need to be answered might be as follows. What are the influences of inclination
angle on heat transfer performance? What is the relatioriship between inclination angle and the
amount of working fluid required? A study by Negishi and SawadaJ4 revealed that it is
necessary to fill between 40 and 45 % of the evaporator inner volume with ethanol as the
working fluid in a thermosyphon with an inclination angle of no less than 5 degrees to obtain
a steady high heat transfer rate.
4.2 Heat Pipes in the Metallurgical Industry
There has been work done regarding metallurgical investigations of heat pipe technology
but only to a very limited extent. Most of the heat pipe work reported in the literature related
to metals casting, with a view towards controlling solidification rates. This can be done by
strategically locating heat pipes in a casting assembly and using pressure control and temperature
control to regulate the amount of heat that is removed from the castmg. BahadoriJS published
a paper on this subject in 1970. The latent heat of fusion of the liquid metals provides the heat
required for evaporation in a gas-controlled heat pipe. The heat of fUSion can be conducted
away at different rates by the heat pipe depending on the rate of cooling desired. It is weil
understood that cooling rates have a profound effect on microstructure, thereby the tinal
properties of the casting.
28

(
(
(
Work has also been conducted on heat pipe controlled solidification in Czechoslovakia.
Zuzanak36 uses a simple numerical model to examine the effect of heat pipes on casting
solidification and defines fundamental conditions to control the entire process. In a more
involved work Zuzak et al., investigate actively chilling steel in a sand mold casting system:;7
using a sodium heat pipe. Three parts were cast, a plate, a cylinder and a gear wheel, and
numerous experiments were conducted. The goal of the work was to attain practical
applicability of the acquired knowledge to foundry technology.
Wells et al., have developed a computer program aimed at studying the effects of a heat
pipe on the temperature distribution throughout a solidifying alloyl8. A computer program was
generated that could be used to predict the transient, two dimensional temperature distribution
in a solidifying alloy of non-eutectic composition with temperature dependent thermal properties.
When using a heat pipe in conjunction with a conventional chilling system, the model predicted
that the rates of solidification for all locations across the casting could be increased.
Recently, at McGill University, work concerning metallurgical heat pipe applications was
undertaken. H.C. Choi completed his Ph.D entitled "Techniques for the Continuous
Measurement of Melt Temperature" wherein two approaches to the problem of continuous
temperature measurement in steel were discllssed39• The tirst involved a numerical technique
using inverse heat conduction. The second investigated the use of a self cooling heat pipe sleeve
to protect the thermocouple from the molten steel. Choi' s heat pipe investigations comprised
a variety of tests with different materials. In his most conclusive test a shell of copper matte
was frozen onto a stainless steel heat pipe in conditions that had previously dissolved a plain
stainless steel pipe. He thus proved the concept of continuous temperature measurement by
demonstrating that the shell formed by the cooled heat pipe could protect the pipe from the
otherwise damaging environ ment.
The author has also worked with fellow researchers on flow visualization in a transparent
thermosyphon. Valuable insight was gained in understanding the flow phenomena in a
thermosyphon heat pipe. Boiling and condensation phenomena were observed and parameters
such as condensate tlow velocities, condensate tilm thickness and vapour velocities were
calculated and summarized in an internai reporrlO• The transparent thermosyphon work laid
the foundation for much of the work which follows in this thesis.
29

Chapter 5
The Transparent Heat Pipe
S.l Introduction
This section describes work that was conducted with a Pyrex tube thermosyphon heat
pipe, that contained Freon Il as the working fluid. The heat pipe was of typical design. and
was operated in the vertical position, making full use of gravit y to return the working tluid back
to the evaporator.
The previous work with heat pipes conducted at McGill had been successful, yet still the
inner-workings of a heat pipe were somewhat of a mystery. Il was felt that a transparent heat
pipe could shed light on the fluid flow phenomena inside the pipe and !:tE" used as a working
model to demonstrate the pri.nciples of a heat pipe to athers. It was also felt that the transparent
thermosyphon work conducted at low temperatures could be used to determine the most suitable
heat transfer models to use, i.e. whether the condensation is film or dropwise or whether the
regime is laminar or turbulent. Once calculations were made they could be ven tied visually.
Although the verifications would not be rigorous, Le. no physical measurements of film
thickness or vapour velocities were taken, they wou Id determine whether calculations were
reasonable or not, Le. a film thickness of 3 mm versus .1 mm could be discerned by the naked
eye. The calculations and modelling would improve our understanding of the fluid flowand heat
transfer phenomena within the pipe, so that high temperature heat pipes ·-:ould be better
engineered. It was felt to be a worthwhile endeavour, since with low temperature systems the
operating conditions are very mild making experimental design and construction relatively quick
and easy.
S.2 Design and Construction
Originally, the pipe was to be constructed from plexi-glass due to its transparency and
relative toughness as compared to glass. A working fluid with a low operating temperature was
30

(
(
(
then required in order to be compatible with the low melting point of plexiglass. Severa! fluids
were considered and are outlined in the following table:
Table 5.0 : Low Temperature Working Fluids and Their Physical Properties
Fluid Chemical Boil. Melt. Latent Pressure Useful Formula Temp. Temp. Heat Vapour Range
eC) eC) (kT/kg) (bar) (OC)
Refrig. Il CFCl3 23.9 -101 183.4 l.1341 -40-120
Refrig. 12 CF2Cl3 -29.6 -1l4 - 6.8491 -Acetone C3H6O 56.3 -94.5 552 0.0318 0-120
Methanol CH40 64.7 -97.5 1165 0.1860 10-130
Pentane CsH12 -159 367 - -Ethanol C2H6O -143 788 - 0-130
note: thermophysical properties taken at 27 oC and/or 1 bar
The factors which must be considered when choosing a working substance are as
follows41:
- Compatibility with wick and wick material
- Good thermal stability
- Wettability of wick and wall materials
- Vapour pressures not too high or too low over the operating temperature range
- high latent heat of vaporization
- high thermal conductivity
- low liquid and vapour viscosities
- high surface tension
These are the scientific tàctors which must be considered and optimized, but in the real
world we must always yield to cost and availability as they most often govem the materials we
31

" use. Refrigerant Il was a good candidate from a scientitic perspective as it adhered rather weIl
to the aforementioned criteria. It was readily availabie and it was non-tlammable.
As was previously mentioned, the original heat pipe thermosyphon. or simply
thermosyphon, was to be made of plexi-glass, but problems were encolJntered when the plexi
glass was heated in a hot water bath. The temperature gradients and the pressures developed
in the pipe would cause stress fractures. A number of tubes were tested with the final plexi
glass tube having a wall thickness of 1/8 inch, which still was not adequate as it eventually
cracked as weIl. It was decided to switch to pyrex glass, an extremely temperature resistant
material that could withstand fairly large pressures. Although it was originally hopcd that glass
could be avoided due to the risk of shattering while in operation, in the end it was the only
option that time permitted.
S.3 Experimental Procedure
The tube which was to be the thermosyphon container had the following specifications:
- Material: Standard Coming Pyrex Glass
- Outside Diameter: 29 mm
- Inside Diameter: 26 mm
- Total Length : 860 mm
Thermocouples were situated along the length of the thermosyphon, pressed to the outside of the
pipe by a layer of styrofoam insulation held by a plastic ti-wrap. The thermocouples were
attached to wires which led to the data acquisition system. A pressure transducer was also
connected to a Swagelok t-connection consisting of two Nupro valves; one leading to the
pressure transducer and the other leading to a vacuum pump. The pressure transducer was
connected to a power supply and to the data acquisition system. The pressure transducer was
an Omega type which employs a strain gauge situated in front of a pressure sensitive diaphragm.
When the diaphragm is compressed it alters the resistance in the wheatstone bridge arrangement
within the strain gauge correspondingly with the pressure causing the displacement of the
diaphragm. This reading is calibrated according to a simple equation in the data acquisition
system. The experimental set-up is shown in the following figure.
32

"
t 9
AIR' HOSE ~
PRESS URE ATTACHEO / - ~TRANSD CER TD VACUUM PUMP
? AIR 6 HOSE
THERMOCOUPLES 5
'f
3
2
HEAT BATH l DATA 1 - eniTRE: HEAT
STaVE
Figure 5.0 : Schematic of Experimental Set-up of Refrigerant Il Thermosyphon
Glass blowing was used to seal the pipe on the evaporator side and to create a nipple on
the condenser side. Plastic tubing was connected to the nipple at one end and to copper tubing,
leading into the tee, al the other end.
The following lisls the experimental apparatus that was required to perform the
investigations:
- one heating stove
- one metallic heating bath
- one pyrex glass tube
- eight E-type thermocouples
- 70 ml Freon Il (CCI)F)
- one varying voltage transformer
- one vacuum pump
- one thermometer
33

. ,
•
- one omega pressure transducer
- two nupro pressure valves
- swagelok tee-assembly
- Data acquisition system consisting of a voltmeter and Hewlitt Packard computer
A typical experiment involved tirst charging the pipe with Freon so that it surpasses the
evaporator level by about 10%. Since Freon is lost when the pipe is evacuated this was
considered to be 100% of the evaporator volume, which is standard procedure when filling a
heat pipe41. The data acquisition system was then turned on to begin recording results. The heat
pipe was evacuated to removes excess air entrapped in the system to a pressure of approximately
0.1 atm with a vacuum pump. In actuality, the system was purged and the pressure reading
indicated the pressure of freon in the pipe at room temperature. The heating stove and controller
were then switched on and allowed to heat the water for a few hours until the desired amount
of data was collected. Safety glasses were used at ail times for precaution against shattering of
the pyrex glass. The pressure that was maintained during experimentation was in the vicinity
of one atmosphere so that no net forces were imposed on the pipe.
5.4 Results and Discussion
Video tape was made of the transparent thermosyphon during its operation which proved
to be extremely useful in explaining the principles of a heat pipe to those unfamiliar with the
topic. Showing the transparent thermosyphon during operation to those who would later fund
the work in co-operation with McGill on the Kidd Creek Lance project, in the authors opinion,
was a tuming point in getting the project under way. It served to illuminate discussions on the
topic of heat pipes so that a better understanding could be had by ail. BeSldes its use ln
illustrating to others the principles of heat pipes, it shed light on the tluid tlow phenomena in
the pipe and dispelled any scepticism the author had regarding heat pipes. Thus, the first
objective in building a transparent thermosyphon was met.
The second objective was to determine the most appropriate heat transfer model to use
in calculating the operating parameters of the heat pipe, Le. hea~ fluxes, vapour velocities, fluid
velocities. Il was evident that a laminar film of significant thickness was continually runnJng
34

,., j .
down the walls of the pipe, growing thicker as it reached the bottom. From our visual
observations, it was decided that the most appropriate heat transfer analysis to use was that of
laminar film condensation originated by Nusselt. Some of the details of the analysis are
discussed in "Fundamentals of Heat and Mass Transfer" by Incropera and De Witt19 in the
section entitled "Boiling and Condensation". The heat transfer calculations describing the
transparent thermosyphol1 which includes the laminar film condensation analysis are presented
in Appendix B. The results of those calculations will be discussed.
s.s Reat Transfer Model of Transparent Thermosyphon
The four phenomena of heat transfer considered in this analysis are straight forward and
can be found in any text written on the subject of heat transfer. The 'looks referred to in this
work were "Fundamentals of Heat and Mass Transfer" by Incropera and De Witt, previously
mentioned, and "Heat Transfer" by 1.P. Holman42• The four mechanisms are Natural
Convection and Radiation from the outrr surface of the pipe to the atmosphere, Conduction
through the walls of the pipe and laminar film condensation within the pipe.
The aim of the analysis was to determine the heat flux dissipated by the pipe, the vapour
velocity and liquid film velocity of the working substance within the pipe and the film thickness.
Knowing these parameter and how to ca1culate them would a110w proper design of future high
temperature thermosyphons.
Typical values obtained were:
Heat dissipated by pipe, q = 100.7 W
Vapour velocity, vvapour = 0.176 mIs
Condensate velocity, vcond = 0.07 mIs
35

Chapter 6
The Laboratory Scale Heat Pipe Injection Lance
6.1 Introduction
Upon completion of the transparent heat pipe experiments, a laboratory scale heat pipe
injection lance was constructed. Essentially. the lance was an annular heat pipe or
therrnosyphon (no wick was employed). It consisted of a pipe within a pipe, with plates welded
at the ends to seal il. The following figure is a schematic of the laboratory scale heat pipe
injection lance (LSHPIL) showing dimensions and materials.
. 1
o ~
il 1 J:
o o N
INNER PIPE - 31655
6.0 ",,,,on. x 3 0 "'" 1 0
OUTErl PIPE· 31255
33. 3 t"I"'OO. It 2S 4 1"1" 1 D.
Figure 6.0 : Dimensions and Materials of Laboratory Scale Heat Pipe Injection Lance
36

(
(
(
The LSHPIL was tested at McGiIl University's Metallurgical Fumace Laboratory and at
the Noranda Technology Center (NTC). The tests at McGill were run in a 30 kW, 10000 Hz
induction furnace. At Noranda, the experiments were conducted in an electric resistance fumace
capable of reaching temperatures of 1300 oC.
A number of trial runs were first attempted at McGill to condition the LSHPIL. When
charging the sodium, impurities may find their way into the pipe in addition to the impurities
associated with commercial grade sodium. The conditioning process involved heating the
LSHPIL to red hot temperatures for short periods of time so that the sodium in the annulus
could vaporize. The lance was then allowed to cool until it was warm to the touch. The lance
was then re-evacuated to remove any impurities which may have been ejected from the sodium
and the container. The procedure was repeated several times until a vacuum below .01 atm
could be maintained after the heating and cooling down procedures.
The experiments conducted at the NTC involved laboratory scale simulations of some of
the expected conditions in the Kidd Creek C-furnace. Radiation atmospheres comparable to
Kidd Creek's C-fumace were tested with air injection through the center of the lance and
externaI cooling by a fan on the outside of the lance, simulating plant conditions. Unfortunately,
a sulphidizing atmosphere Iike that of the C-fumace could not be arranged.
The section which follows is arranged into two parts. The makjng of the LSHPIL at
McGill and the testing of it at Noranda. The results of the Noranda tests are then discussed.
6.2 The Making of the LSHPIL
The three basic components of a heat pipe are the working substance, the container and
the wick. In our case, a thermosyphon heat pipe was decided upon as the lance would operate
vertically sa that gravit y could be fully exploited. This being the case, no wick was required.
The working substance was chosen based on the criteria listed in chapter 5. The following table
lists some of the more common working substances.
Table 6.0 : Common Working Substances and Operating Ranges
37
,1
l 1 '1 l 5 '!
1

l' Medium Melting Normal Doiling Useful Range Point (OC) Point eC) (OC)
Helium -272 -269 -271 to -269
Nitrogen -210 -196 -203 to -160
Ammonia -78 -33 -60 to 100
Freon II -Ill 24 ·40 to 120
Acetone -95 57 o to 120
Mel.:lanol -98 64 10 to 130
Ethanol -112 78 o to 130
Water 0 100 30 to 200
Toluene -95 110 50 to 200
Thermex 12 257 150 to 395
Mercury -39 361 250 to 650
Cesium 29 670 450 to 900 .-Potassium 62 774 500 to 1000
Sodium 98 892 600 ta 1200
Lithium 179 1340 1000 to 1800
Silver 960 2212 1800 to 2300
Possible candidates for the working substance required by the LSHPIL were potassium,
sodium or lithium. Il was felt that potassium wou Id have too high of a vapour pressure at the
operating temperatures of the C-furnace (- 1200 OC) and that lithium's would be too low.
Sodium, the least expensive of the three metals, was ideal since its operating range seems to
coincide very weil with that of the C-fumace. It has good thermal stability and a high Jatent
heat of vaporization. The viscosities of the Jiquid and vapour are low and the surface tension
is high. As weIl, the thermal conductivity of sodium is very good. Il appeared that sodium was
perfeet for our application.
The next step was to choose the container material. Taking into account the elevated
temperatures the lance would be operating al, metals such as aluminum and copper could not
38

( ..
be considcrcd. Although nickel has a high melting point, its compatibility with a copper/sulphur
environment is poor. Nickel is very soluble in copper. Nickel is also not available in a wide
variely of shapes and sizes. More exotic metals such as titanium, tantalum and niobium could
nol be considered due to their very high costs. In industry, cost is the bottom Hne. The use of
such metaJs could not be justitied from an economic perspective since commercialization of a
heat pipe lance is the end goal.
Stainless steel comes in a wide variety of forms and sizes. It is readily available and
reasonably priced. Il is the materiaJ used for the Mitsubishi lances and according to Iiterature,
it is compatible with sodiumo. Its compatibility with sodium is addressed in the S.E.M. section
of this work. Stainless steel is not completely compatible with the environment of the Kidd
Creek fumaces, as is weil known by the Mitsubishi process, but that is as a normal lance, not
as a heat pipe lance. Stainless steel was the best choice for the pipe container once ail the
factors were considered.
The lance was machined and then welded. The welding of the lance was not a simple
task. Great care must be taken in ensuring not only a strong weld but a leak proof weld; one
that ensures the container can support a vacuum.
6.3 Cleaning and Filling or the pipe
Once ail the machining had taken place, the heat pipe's components were thoroughly
cleaned to minimize any impurities in the system. The cleaning procedure for stainless steel
used was the one outlined in Chi6 and is as follows:
1. Clean in l, l , I-trichloroethane and periodically agitate and brush with bristle brush.
2. Rinse with cold trichloroethane and force dry with air.
3. Immerse in a passivating solution of sodium diehromate (7.5-30 kg/m3) and nitrie acid
(15-30% by volume) at room temperature for 30 minutes to 2 hours followed by a tap
water rinse.
4. Thoroughly dry with forced air.
5. Rinse with anhydrous isopropyl alcohol.
6. Insert wick, rinse with isopropyl alcohol, and dry as in slep 4.
39

Once cleaning was finished, the pipe was welded. In sorne situations where it is feasible.
welding should take place tirst. The pipe can then be cleaned as a sealed vessel, the only
aperatures remaining open being the sodium feed hales. The pipe can then be temporarily sealed
at the feeding locations and agitated with the c1eaning fluids inside the pipe, instead of
immersing the en tire pipe in a bath. In this way, no fluxes or soot resulting from welding find
their way into the pipe. It also makes the cleaning process easier and less wasteful since only
the inside of the pipe truly needs ta be cleaned.
The final stage before the pipe is sealed is the filling stage. Many difficuIties were
encountered when attempting ta feed sodium into the annulus of the heat pipe. Sodium is a very
reactive element which has a high affinity for oxygen. In Iiquid form. it will ignite when in
contact with oxygen and will explode if contacted by water. Great care was taken in handling
sodium. In solid form, it can be handled with gloves given one has an understanding of its
hazards. A number of methods for charging sodium into the heat pipe were contemplated.
Liquid filling was attempted in the past but met with problems. It was attempted again in this
work and once again was not met with great success. When charging the sodium in Iiquid form
great care must be taken in ensuring that an inert atmosphere prevails. This implies a fairly
sophisticated charging is required since uniform heating and the absence of bath oxygen and
water is necessary. It was found that the simplest and safest way ta charge sodium was in solid
form. It is much safer since the activity of the species greatly decreases when in the solid form.
The formation of an oxide layer protects the sodium from rapid oXldation and reduces ilS
reactivity. The solid form of sodium can be easily cut into pieces with a knife, as sodium is
soft, and then il can be handled with gloves.
The sodium used in the LSHPIL was commercial grade. Il was cut into pieces in an inert
atmosphere, Le. under a positive pressure of nitrogen, in a closed environ ment where it cou Id
be manipulated. In the same closed environ ment it was charged into the feed tube of the heat
pipe. Once the pipe was filled, it was closed using Swagelok fittings and valves. The heat pipe
was then evacuated to remove any air present in the annulus to prevent funher oxidation of
sodium. It is very difficult to avoid oxidation of the sodium. The oxide is relatively inert and
does not affect the operation of the heat pipe. However, it does react with water to form
hydroxide sa it should be kept at a minimum. The following plcture shows knife-cut sodium
40

( inside a sealed plastic Ziploc bag.
(,
( Figure 6.0 : Sodium Cut bya Knife
41

l
6.3 Experimental
Once the pipe had been closed and evacuated, it was ready to be heated. As was
mentioned earlier, a number of conditioning tests were run in an induction fumace to remove
impurities and prepare the LSHPIL for operation. The LSHPIL was then brought to the
Noranda Technology Center for simulation experiments in an electrical resistance fumace. The
following photograph shows the set up al the NTC:
Figure 6.1 : LSHPIL - Kidd Creek Simulation Experiments
42

l The set-up consisted of:
- 1 resistance fumace capable of temperatures exceeding 1300 oC
- 1 Lab Scale Heat Pipe Injection Lance (LSHPIL)
- 3 thermocouples, TIC #1, TIC #2, and TIC #3 were situated 35, 50
and 76 cm from the bottom tip of the lance, respectively
- 1 pressure transducer
- 1 industrial size fan
- 1 air hose capable of a 90 NlImin air injection
- assembly to hold LSHPIL in place
- 2 voltmeters
The independent parameters manipulated were the fumace temperature, the air flowrate
through the lance and the speed of the fan blowing air on the outside of the pipe. The dependent
parameters were the pressure, wall temperatures and condenser lengths. The evaporator section
was that which was submerged into the fumace atmosphere. Heat supplied by the fumace
served to vary the pressure inside the lance, the outer wall temperature of the lance and the
condenser length. The condenser section was that section which was outside the fumace and
was glowing "red hot". The inert gas section was near the top of the lance and had the same
appearance as it did at room temperature.
6.S Results and Discussion
The tables which follow summarize the tests that were run on July 3, 1991 at the NTC.
In both tables, the LSHPIL was 30.5 cm inside the electric-resistance fumace. The conditions
for both sets of experiments were the same with the exception of a cooling fan which was used
for experiments IO to 18.
43

Table 6.1: LSHPIL - Kidd Creek Simulation Experiments. No External Cooling Fan
Furnace Set Point 1150 1200 1250 Temperature COC)
Experiment Number 1 2 3 4 5 6 7 8 9 -Gas Flowrate 0 50 90 0 50 90 0 50 90
(Nil min)
Pressure 0.97 -- 0.54 1.30 0.97 0.74 1.56 1.30 1.03 (atm)
Wall Temp.(OC) TIC #1 788 747 725 805 780 766 832 824 790 TIC #2 775 732 716 795 767 764 810 802 780 TIC #3 296 193 248 48 460 377 687 610 677
Approx. Condenser 34 33 34 36 36 30 43 38 40 Length (cm)
Table 6.2 : LSHPIL - Kidd Creek Simulation Experiments. Extemal Cooling Fan
Furnace Set Point 1150 1200 1250 Temperature eC)
Experiment Number 10 Il 12 13 14 15 16 17 18
Gas Flowrate 0 50 90 0 50 90 0 50 90 (NI/min)
Pressure 0.37 --- --. 0.74 0.57 0.58 0.80 0.70 0.66 (atm)
Wall Temp. (OC) TIC #1 660 659 635 718 708 703 752 736 737 TIC #2 580 587 536 617 596 534 640 61t1 618 TIC #3 57 41 31 214 265 279 495 450 404
Approx. Condenser -- 34 20 29 25 20 34 30 30 Length (cm)
44
{
Severa! useful conclusions may be drawn from these results:
1. The condenser/evaporator length ratio varied between 0.6 and 1.4 with a value
of 1 for experiment 1, the standard.
2. The outer condenser region could be reduced by as much as 41 % wh en a
cooling fan was introduced.
3. The pressure inside the LSHPIL dropped to 42 % of its original value when
air was both injected through the middle and blown on the outside of the lance.
4. The inert gas/vapour interface is not flat as originally suspected.
5. There exists a sharp decrease in temperature towards the end of the condenser
regiun over a small distance.
The above conclusions are very important from a plant application point of view. The
discovery of a one to one ratio of evaporator to condenser for the standard test (experiment 1)
was essential in determining the pilot scale lance length requirements. By knowing the required
depth of insertion into the C-furnace for the pilot scale heat pipe lance (the evaporalor length),
the total required length of the lance could be determined. It can be seen that the ratio of the
condenser length to the evaporator length increases as the temperature of the furnace increases.
This results from the increasing heat flux into the evaporator causing a need for an increased
condenser area to dissipate the heat. This translates into an increase in length since the
circumferences of the evaporator and condenser are the same.
The ability to drop the external condenser by as much as 41 % with a cooling fan
(ex peri ment 12 vs 3), if required, is reassunng from an operations point of view. If during
operation the condenser rises to an undesirable or unsafe height, it could be lowered with an
external, air cooling device. Safety for the operators and the workers on the floor is always a
concern.
It was interestmg to learn that the pressure 10 the lance could drastically be reduced by
the simultaneous external and internai cooling of air. It was originally believed that the pipe
could be cooled down in tilÎs way, but not by such a significant amount. What led to this
discovery was the abnormal behaviour of the condenser. The noem being in a way that a
straight, fiat interface would behave, i.e. moving up and down in accordance with the pressure
45

changes in the LSHPIL. The condenser that was perceived on the outside did not always
fluctuate with the pressure changes. The injection air down the middle of the pipe would drop
the pressure but not the visible extemal condenser (experiments 1 and 3, 4 and 5, 17 and 18).
This implies that two condensers exist. one on the inside pipe and one on the outside pipe.
When air is blown on the outside pipe the condenser visually drops as the condenser cools down,
causing the red hot glow to disappear. When air is blown through the middle, the outer
condenser does not necessarily change but the inner one does. indicated by the pressure drop,
Le. less vapour pressure implies less condensation, which must be taking place on the inner wall
if no changes occur on the outside. Thus an annular thermosyphon (the LSHPIL) will not
necessarily have a fiat interface; it could be slanted under certain operating conditions.
The fact that the temperature rapidly decreases over a short distance above the visible
condenser results from the (inert gas)/{vapour) interface that exists in heat pipes. Any oon
condensible gases that have found their way into the LSHPIL (imperfec:t vacuum, impurities
from sodium) are pu shed to the top of the chamber by the rising vapour. A diffusion layer
exists as the interface between the rising vapour and the inert gas is not completely discrete, i.e.
mixed. The temperature drop which takes place over the short distance reflects this. In Figure
6.2, which follcws, the schematic illustrates how the flow of the rising vapour causes the non
condensible gases to be suspended at the top of the container. Only a diffusive layer exists
where the inert gas is driven downwards by diffUSIOn and buoyancy forces. Eventually, they
are forced back up by the rising vapour molecules. Note that the schematic does not show a
perfectly even distribution of molecules, as it should be.
More tests were run at NTC two days later 011 July 5, and similar resuIts were found.
Photographs were taken to illustrate the change in condenser with changes in conditions. The
five conclusions drawn previously are illustrated in Figures 6.3 through to 6.9, on the pages
which follow.
46
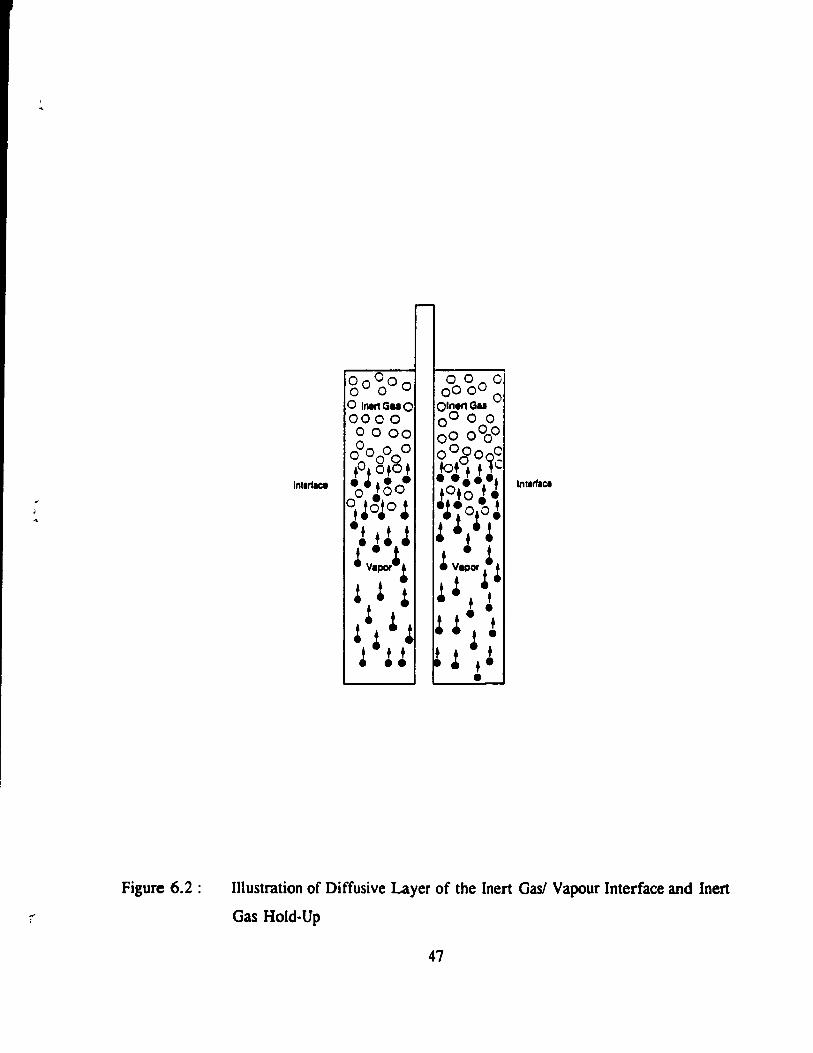
... 1
, ...
Figure 6.2 :
r-
Inllrlace
00°°0 a ° 0 0 o 0 0 0 0 0 o Inll1GuO Oln..,Gu 000 ° 0° 00 0000 0 0 0°0° °00 0 OOOO~C o 08 +0.0 + c .0. o. . ~. +~o· • .J ••.
tOto· • °tJ~Jo ~ ·~·o ~. •• + J :J+~:. • +. : v~or~~ !v:"b : ~ ~ : ~ t
• • ~ ~ ~ J : ~. ! • : • + ~ ! !,! • ••
InllrllCi
•
Illustration of Diffusive Layer of the Inert Gasl Vapour Interface and Inert
Gas Hold-Up
47

l j
Figure 6.3 : LSHPIL Tests al NTC: Furnace Temperature = 1150 "C, Gas Flowrate == 0
IImin No Fan, Pressure = 0.8 atm, Condenser length = 40 cm
48

(
c
(
Figure 6.4 : LSHPIL Te~ts at NTC: Fumace Temperature = 1200 oC, Gas Flowrate = 0
I/min, No Fan, Pressure = 0.97 atm, Condenser length = 48 cm
49
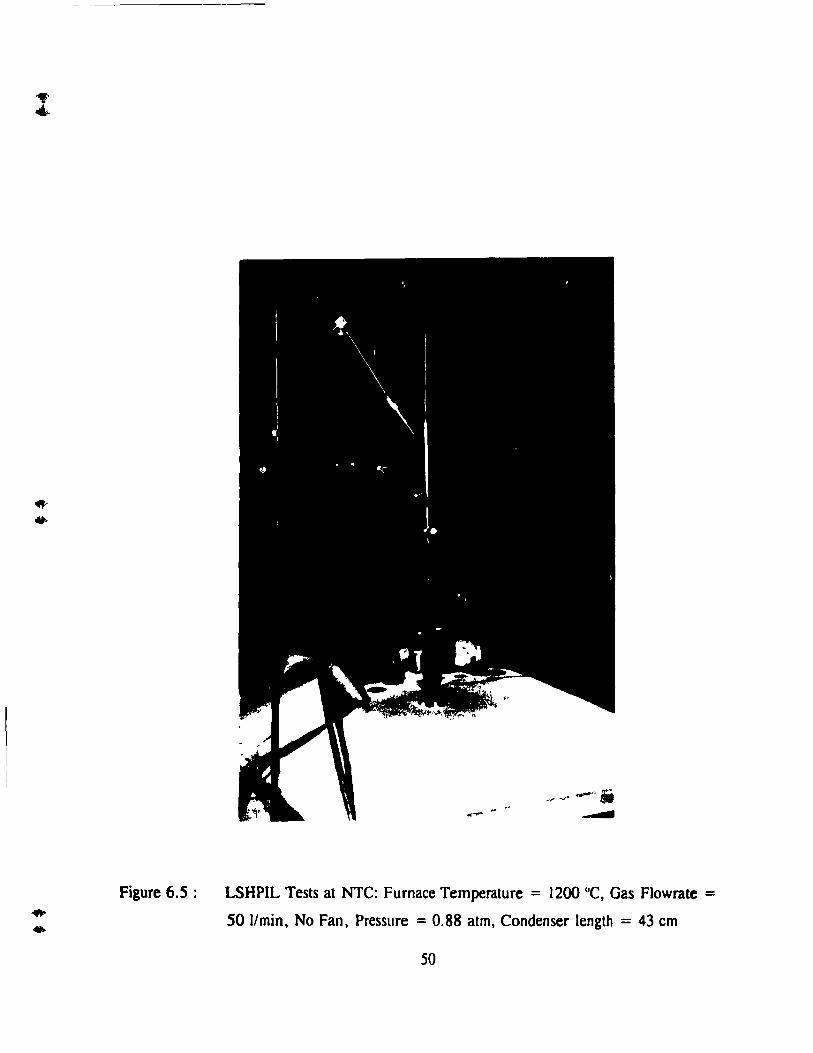
Figure 6.5 : LSHPIL Tests at NTC: Furnace Temperature = 1200 oC, Gas Flowrate =
50 IImin, No Fan, Pressure = 0.88 atm, Condenser length = 43 cm
50

(
(
(
Figure 6.6 : LSHPIL Tests at NTC: Fumace Temperature = 1200 oC, Gas Flowrate = 90 I/min, No Fan, Pressure = 0.73 atm, Condenser length = 41 cm
51

Figure 6.7 : LSHPIL Tests at NTC: Furnace Temperature = 1200 oC, Gas Flowrate = 90 IImin, Fan, Pressure = 0.62 atm, Condenser length = 23 cm
52

Figure 6.8 :
{
LSHPIL Tests al NTC: Fumac~ Temperature = 1200 oC, Gas Flowrate = 50 IImin, Fan, Pressure = 0.65 atm, Condenser length = 24 cm
53

Figure 6.9 : LSHPIL Tests at NTC: Furnace Temperature = 1200 oC, Gas Flowrate = 0
IImin, Fan, Pressure = 0.68 atm, Condenser length = 30 cm
S4

(
(
(
Figure 6. 10 :
... .:-.. 1\
LSHPIL Tests at NTe: Close-up of Condenser depicting
the Red Hot Glow of the Lance
55

By comparing Figures 6.3 and 6.4, we can see the effect of changing the fumace
temperature on the outer condenser. Wh en the temperature was raised by 50 oC and everything
else was left constant, the outer condenser rose by approximately 20 %. When the gas through
the middle was then tumed on to 50 l/min, Figure 6.5, the condenser dropped from 48 cm to
43 cm, a 10% change. The pressure also changed by 10%. When the gas was further increased
to 90 lImin, Figure 6.6, the condenser fell by only 5%, whereas the pressure in the lance t'ell
significantly; by 17%. This ilIustrates conclusion 4: the internai condenser of the annular pipe
was modified to account for the pressure drop while the outer condenser remained more or less
the same, resulting in a slanted inert gas/sodium vapour intertàce. When the fan is then tumed
on, Figure 6.7, the outer condenser falls drastically. 44%, but the pressure only changes by
15 %. Again illustrating the slanted interface concept. In Fig'Jres 6.8 and 6.9 the gas through
the middle is turned down to 50 l/min and then to 0 l/min, re"pectively, causing the condenser
to rise and the pressure to rise in each case.
Il is clear that the simulation provided valuable information regarding potential lance
behaviour in the industrial fumace. The evaporator/condenser ratio of 1 for the standard test
(experiment 1) provided the basis for choosing the length of the pilot scale heat pipe lance. The
calculations in Appendix C using the wall temperatures and pressure from a typical simulation
experiment enabled the approximation of the vapour and condensate velocities that could be
expected in a pilot scale lance. These calculations are shown at the end of Appendix C.
For an LSHPIL ex peri ment with an operating pressure of 1.43 atmospheres, the
following results were calculated;
qdill.palCd = 2.6 kW
vvipOUr = 3.68 mis
v CondellllllC = .091 mis
56

Chapter 7
The Mark 1 Heat Pipe Injection Lance
7.1 Intr('duction
With the success of the preliminary heat pipe lance work, the construction of a pilot scale
heat pipe lance could begin. The tests were to be carried out jr. the C-furnace (converting
furnace). at the Kidd Creek smelter in Timmins, Ontario, Canada. Discussions with the plant
metallurgical engineer in charge of the lancing operation, Dr. Mike Kozlowski, and Ernest Mast
of the Noranda Technology Centre (~ïC), were on-going during the construction of the first
pilot scale heat pipe lance, Mark 1. in an effort to understand the set-up of their fumace and the
conditions the lance would be subject to. The data obtained from the simulations wou Id serve
as the basis for the engineering of the lance. The materials would be provided by the NTC,
based on the design parameters established by McGill, taking into account the aforementioned
discussions.
The assembly, welding, cleaning, charging and sorne conditioning of the Mark 1 lance
took place at McGill. The lance was then shipped to Kidd Creek where Dr. Kozlowski had
prepared the experimental set-up. The tirst set of te~t~ began on August 13, 1991 and tinished
on August 16, three days later. In the following section the development of the Mark 1 lance
and the results of those tests will be d iscussed.
7.2 The Making of the Mark 1 Lance
The selection of materials for the Mark 1 lance was based on the work done with the
laboratory scale heat pipe injection lance and the procedures outlined in that section of this work.
The steel used for the lance, however, was not exactly the same. The laboratory simulations
which used a 316 stainless steel showed that such a material was a good candidate. The
comprehensive li st of criteria outlined in the LSHPIL section of this work also strongly
57

supported the use of stainless steel for the lance material. The stainless steel chosen for the
Mark 1 lance was type 310, containing approximately 20% Ni and 24% Cr. Such a steel was
decided upon primarHy for its high temperature corrosion resistance. lt was felt that it would
behave similarly to the 316 stainless steel used in the LSHPIL tests, but its beuer corrosion
properties could increasc its life as a heat pipe lance beyond that of 316 stainless steel. In the
end, both the inner and outer pipes of the lance were made of 310 SS, as weil as the end plates.
The following illustration shows a schematic of the Mark 1 injection lance with the inner
and outer pipe materials and dimensions labelled. The proposed insertion depth into the fumace
is also illustrated: Mark 1- 5.08 cm 5CH 80, 31055
2.54 cm 5CH 80, 310 55
Air + 50lids
'././ /./ /
I.G ~
I.G. ~ ~
rrl ~ c ~ ~ '/
Furnace
Rool 1
III Evaporator
1
~ ~ ~ '/
~ ~ ~ ~ 1.52m
Na ~ ri
V7/7:/
6.0m
1
Figure 7.0: Mark l, Pilot Scale Heat Pipe Injection Lance
58

!
The constructIon of the lance took place at McGill University. once both the inner and
outer pipes and the end plates were received from the manufacturers. The NTC dealt with the
shipment and payment of the 310 stainless steel pipes. The pipes were all seamless, containing
no welds. The end plates were then machined from 0.635 cm thick plates so that they could be
securely fit and welded between the two pipes. The machining of the pipes was done by the
staff of the McGill metallurgical machine shop. The welding was done by the Chemical
engineering machine shop staff, at McGill. Upon completion of the welding, the lance assembly
was checked for leaks. The same cleaning procedure was used as was for the LSHPIL. The
fittings and valves were the appropriately sized Swagelok type. Two feed tubes were attached
to the Mark 1 lance. The feed tubes were stainless steel, 0.635 cm in diameter, located near the
very top of the lance. Note that there exists a difference between "tube" designations and "pipe"
designations. Swagelok works on a tube system.
7.3 Charging of the Sodium
After the pipe was cleaned it was ready for charging. From the results of the LSHPIL
tests, based on the amount of material that was charged into the pipe and the amount that was
lost to oxidation, it was estimated that 50% of the evaporator volume was filled. Calculations
were made to determine the amount of sodium required fnr a 50% evaporator volume charge,
based on a submersion depth of approximately 6 ft or 1.82 m into the furnace. The annular
volume that the liquid sodium would fill wou Id amount to approximately 1.25 kg of sodium,
according to the following calculations:
Volume of evaporator = 11'(2.4642 - 1.0672)(.5 x 6(12)(2.54»
= 1417 cm3
At 300°C Psodlum = 880 g/l
:. Mass Na required = 1.4171 x 880 g/l
= 1.25 kg of sodium
To compensate for oxidation and other losses. 1.4 kg was weighed out and charged into
the Mark 1 lance. The sodium was cut int(' pieces, as illustrated in the LSHPIL section, using
59

1 the same apparatus. Once eut, the sodium was held temporarily in nitrogen tilled Ziploc bags
until the sodium could be charged. The following picture illustrates the sodium filled Ziploc
bags:
Figure 7.1 : Hand Cut Sodium in Nitrogen Filled Ziploc Bags
The charging operation was undertaken by E. Mast of NTC and myself. Il took place
outdoors, in the parking lot next to the metallurgical furnace laboratory. Il was feH that this was
the best way to ensure everyones' safety. If sodium did catch fire, it would be in the open
where it could bum freely and not damage any equipment or harm anyone. The lance was
maintained al an angle of approximately 30" during the charging process 50 that gravit y wou Id
.... cause the solid sodium pieces to fall to the bottom of the lance. The charging of sodium into
.a.
60

{
{
(
the lance took place at the two fred tubes located at the top of the lance, iIIustrated in Figure
7.2. These ports are later connected to the valves and pressure transducer by Swagelok fittings.
The chargmg process was long as periodic jamming of the sodium took place. In future great
care must be taken to ensure the sodium is cut to the pJOper size and that it is not fed too
quickly, Le. it is given the time to fall to the bottom of the lance and not plug up near the top.
Sodium is slightly sticky in solid form and did not easily slide to the bottom of the lance. More
lime and energy must be invested into the development of an efficient means of charging sodium
if large scale production of sodium filled heat pipe lances becomes a reality.
Figure 7.2 : Mark 1 Sodium Feed Tubes
61
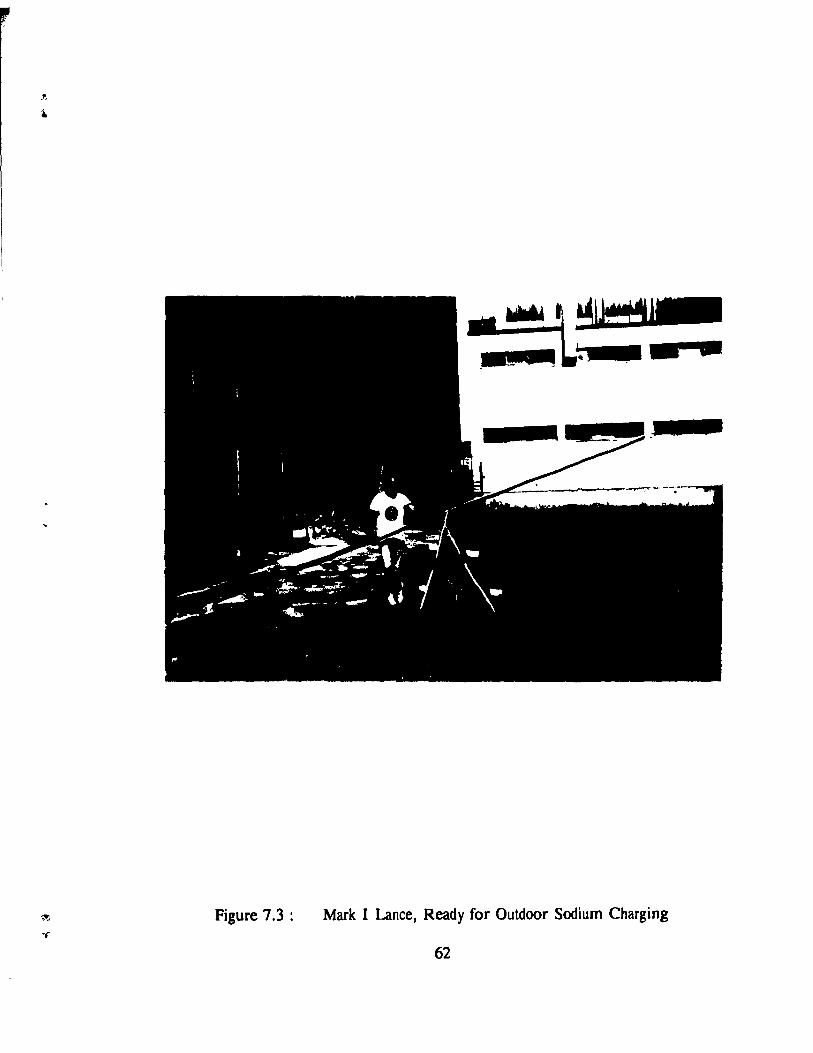
Figure 7.3 : Mark 1 Lance, Ready for Outdoor Sodium Charging
'. 62
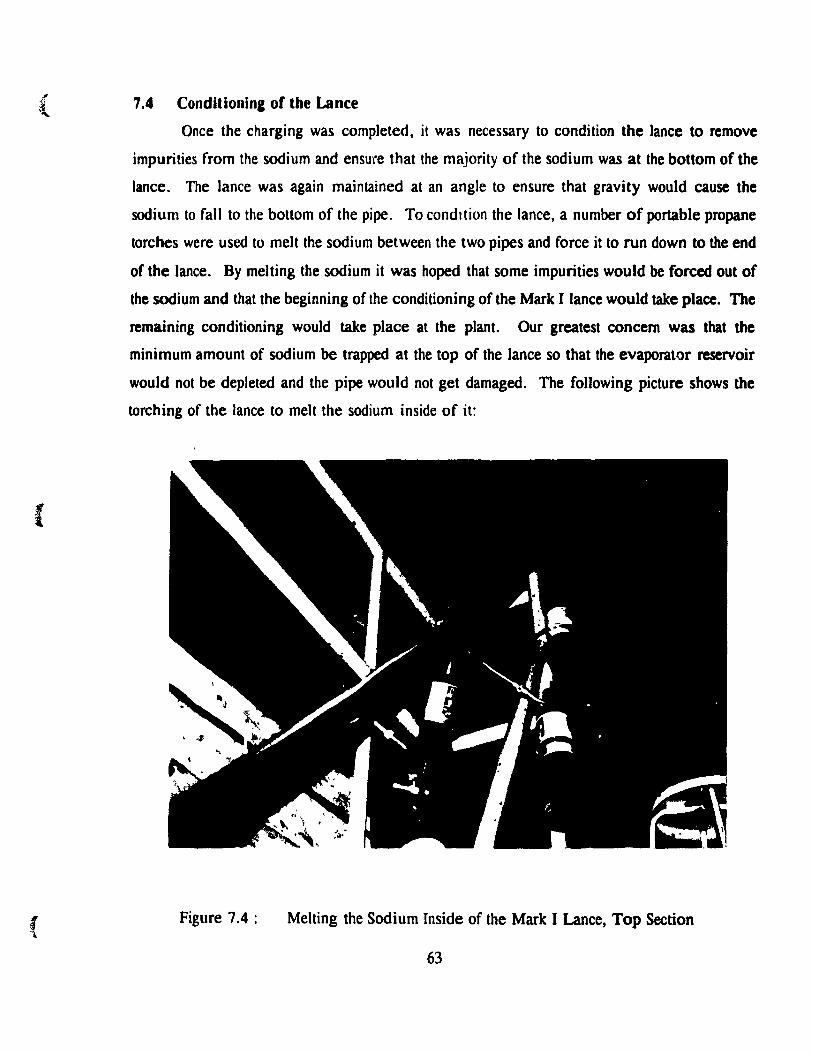
(
( ..
7.4 Conditionin& of the Lance
Once the charging was completed, it was necessary to condition the lance to remove
impurities from the sodium and ensUl'e that the majority of the sodium was at the bottom of the
lance. The lance was again maintained at an angle to ensure that gravit y would cause the
sodium to fall to the bottom of the pipe. To condItion the lance, a number of portable propane
torches were used to meIt the sodium between the two pipes and force it to run down to the end
of the lance. By melting the sodium it was hoped that sorne impurities would he forced out of
the sodium and that the beginning of the conditioning of the Mark 1 lance would take place. The
remaining conditioning would take place at the plant. Our greatest con cern was that the
minimum amount of sodium be trapped at the top of the lance so that the evaporator reservoir
would not be depleted and the pipe would not get damaged. The following picture shows the
torching of the lance to meIt the sodium inside of il:
Figure 7.4 : Melting the Sodium Inside of the Mark 1 Lance, Top Section
63

l
Figure 7.S : Melting the Sodium Inside of the Mark 1 Lance, Middle Section
Once the conditioning stage was completed the lance was evacuated and sealed with
Swagelok fittings. The pressure transducer was connected to the valve Tee-connection. A
protective aluminum cover was attached to the head of the lance to protect the fittings and the
pressure transducer during shipping.
7.5 Experimental
In its journey to the Kidd Creek smelter, the Mark 1 lance was mishandled. The
protective aluminum cover had been damaged and the top of the valve had either fallen off or
been removed. These two factors seemed to have no effect on the lance, however, since it was
still in good working condition. The lance was re-evacuated and checked for leaJr..\. Once it was
found to have no leaks, preparation of lance insertion into t~e fumace was begun. The following
.. photograph partially illustrates the set-up al Kidd Creek's C-fumace: .. 64

!
Figure 7.6 : Part of Experimental Set-up for Kidd Creek Pilot Scale Heat Pipe Injection
1 Lance Trials .. 65

The set-up consisted of:
- 1 6.1 m Pilot Scale Heat Pipe Lance (Mark 1 lance)
- Hole in the fumace roof large enough to fit a 6 em diameter lance
- 1.5 m of space between roof and grated working platform
- 1.5 m protective, rectangular, screened box surrounding Mark 1 lance
- 1 Omega power suppl Y
- 1 Omega pressure transducer and wiring
- 1 K-type thermocouple and wiring
- 1 voltmeter
- 1 Macintosh Computer to colleet data. situated in the "control room"
- 1 Edwards "Speedvac" vacuum pump
- l "air mover" to blow air over surface of lance
- air line and air hose
The lance was manipulated with a manually operated, 5-ton crane and a clamp attached
to the head of the Mark 1 lance. The lance was ralsed above the roof and slowly inserted into
the hole. It was lowered at an approximate rate of 1 centimetre every 10 seconds. The sodium
vapour pressure was monitored tirst by a voltmeter for qUlck reference and then by a computer
outside the plant in the control room, for long-term measurements. The Mark 1 lance was
initially lowered to a height of 0.61 m from the fumace roof; taking into account t~e roof
thickness. Approximately 0.37 m of the lance was subjected to the furnace atmosphere. After
a period of 10 minutes, the lance was lowered to a height of 0.91 m, measured from the fumace
roof. After a full day of operation at this height, the lance was lowered another 0.3 m. Thus,
the lance tip at its lowest point was approximately 1.5 m from the surface of the bath.
7.6 Results and Discussion
The data from the Mark 1 lance tests was compiled with a Macintosh computer and stored
onto a disk. It was then imported into a spreadsheet (Lotus 123), organized, and imported again
into the Lotus Freelance program. Data was collected every minute by the plant computer. The
following are graphs of the sodium vapour pressure and the outer wall temperature located 2.4
66

<1
.t
(
m from the tip of the lance, versus lime. The rncasuremcnts taken arc graphcd on an hourly
basis. Note that this tempcrature is ncar the upper end of the condenser section. The
thermocouple rcading thus iIlustrated when the condenser rose to this section of the Mark 1
lance. When the condenser did rise to this section, the thermocouple was essentially triggered
and read hot temperatures. Il served to make the operator aware of whether the condenser was
approaching the working platform area, above the furnace roof. Il did not, however, necessarily
read the condenser temperature; it did 50 only when the condenser had risen to the level of the
thermocouple.
Figure 7.7 :
250 700
Pressure 600 -200 T!mP' -....... 500 9, la
~150 400 ! ~
l! ë ::::1 • m 100 ' \ 300 G» , \ a. !
, \
200 ~ , , CI. 1 \
1 \
50 , \ , , , 100 \ •
0 0 0 1 2 3 4 5 6
Tlme (hours) Begins at 18:00
Na Vapour Pressure md Outer Wall Temperature Curves for Mark 1 Lance
Tests, August 13, 1991.
67

~ l
250 700
• Pressure 600 Il -200 " T!!!'p. - " -t-l , 500 U l , -· , 4U ~ 150 l , .. · , 400 ::1
! l , ... • , l! :::1 1 , ut 100 1 , 300 4U ut 1 , Co ! • ,
200 E • , Q. • ~ 50 1
100
0 0 0 4 8 12 16 20
Time (hours) Begins at 0:00
250,..---------------, 700
200 -~ ~ 150 ! ~ = 100 ! Q.
50
Pressure -
--_.----------- .. ,---------_ .. -
600 -500 ~ !
400 ::1 ... l!
300 4U a. 200 i ... 100
0'---...... - ...... --...... ---------0 o 4 8 12 16 20 Tlme (hours)
Begins at 0:00
Figure 7.8 : Na Vapeur Pressure and Outer Wall Temperature Curves for Mark 1 Lance
Test, J-\.ugust 14 (above), August 15 (below), 1991.
68

250
200
:: ~ 150 ! ::1 = 100 ! a.
50
i-
-
~
i-
--- .
Pre.sure - I-
T!!!'p. '-
-
------... --. _---- .. _-~_._-~~_.-------
700
600 ......
500 ~ !
400 ::1
! 300 a.
Co
200 ti 1-
100
1 1 1 1 1 1 .~ .J. o 0 0123456789
lime (hours) Begins at 0:00
Figure 7.9 : Na Vapour Pressure and Outer Wall Temperature Curves for Mark 1 Lance
Tests, August 16, 1991.
The Mark 1 lance test began at 18:00 ho urs on August 13, 1991. Once the lance was
inserted to its initial depth of 0.61 m, the pressure in the pipe rose to approximately 2
atmospheres. The initial pressure in the lance, before insertion read 0.04 atmospheres according
to the pressure transducer. The pressure reading of 2 atmospheres, Figure 7.7, reflected the
vapour pressure of the sodium, and the pressure of the initial non-condensable gases in addition
to the non-condensable gases generated from the vaporization of sodium (Le. oils and grease).
69

The lance was then re-evacuated to remove sorne of these inert gases. This is part of the
conditioning process that was discussed earlier in this work.
The pressure in the pipe dropped as illustrated in Figure 7.7, while the temperature
reading of the thermocouple increased. By evacuating the inert gases in the chamber. the
condenser was allowed to rise. As it approached the thermocouple located 2.4 m from the lance
tip, it caused an increase in temperature in the region, reflected by the peak in the temperature
curve illustrated in the graph. The pressure continued to drop even after the evacuation was
stopped.
The rise in the condenser accompanying the evacuation of inert gases and the subsequent
drop in pressure was caused by the reduction of inert gas molecules ln the system. The pressure
in the Mark 1 lance is the pressure of the inert gas/sodium vapour system. The pressure of the
two gases is the same, however, their volumes are not. ThiS IS due to the fact that a different
number of molecules of each gas exists within a tixed volume. The pressure' s dictated by the
amount of heat (Watts) which must be removed from the evaporatul, by the heat of
vapourization of the sodium molecules. By removmg inert gas molecules from the system, space
was made available for the sodium molecules to occuPY, hence the condenser rose. It rose to
a height fixed by the new pressure of the system. This pressure was lower, however, since a
larger portion of the total gas volume was occupied by ~odlUm rnolecules, whlle the heat
dissipated by the system remained unchanged. Thus, the pressure of the system dropped SIOCC
the same number of sodium molecules were needed to disslpate the heat over a larger volume.
Once the smaller number of inert gas molecules were compressed to the new equihbrium
pressure of the system, the condenser ceased to rise, and a new equilibriurn was established.
This equilibrium was maintained until the following day, with only subtle changes
reflecting variations in the heat tlux within the furnace. At 0:00 hours, on August 14, the lance
pressure began to drop from 50 kPa to 20 kPa over the next two hours. It is difficult to pinpoint
exactly what caused this change since visual inspection of the lances could be do ne only when
a view hole into the furnace was made by plant personnel. Such view holes require oxygen
lancing which involves burning a hole into a section of the fumace, allowing one to sec inside.
No such person was available to us at that time. The best explanation for the drop in pressure
was the building of accretions onto the lance. It is known from previous visual inspections that
70

(
(
(
accretions form on the standard lances. They form and then fall off, often damaging the lances
as they may take sections of pipe with them. If an accretion was formed on the Mark 1 lance,
th en as it grew larger, the heat flux entering the lance would be diminished. In Figure 7.8,
(August 14) the pressure in the lance drops over a period of two hours and then stabilizes, which
may reflect the formation of an accretion. Visual inspections of the Mark 1 lance at a later time
showed evidence of fairly large accretion build-up, supporting thjs hypothesis.
At around 10:00 o'clock, on August 14, tht: pressure in the lance jumped from 20 kPa
to 100 kPa, resulting from the lance being inserted another 30.5 cm into the fumace. No
evacuation of gases took place. It can be seen that the condenser immediately responded to the
increased heat which the Mark 1 lance must disslpate, indicated by the surge in the temperature
reading which is synchrunized wlth the pressure spike. The response of the lance to the
increased heat load is the vaporization of more sodium, hence an increased sodium vapour
pressure. The increased pressure compresses the inert gas to a point where the pressures are
equal and this is where the condenser remains. In this case, it was in close proximity to the
thermocouple.
ft should be noted that the lance requires fairly long periods of time to reach equilibrium
as the walls are relatively thick and stainless steel has poor conductivity. The lance responds
quickly to changes in external conditions but requires fairly long periods of time for the heat to
fully soak mto the pipe walls and equilibrate the system. Temperature and pressure peaks are
often followed by oscillations as the lance attempts to regain equilibrium. However, equilibrium
in an industrial furnace is almost impossible to achieve as the process is continually changing
and never steady. The drop in pressure after the pressure surge and the following oscillations
are indicative of the Mark 1 lance attemptmg to equilibrate itself.
On August 15, a small pressure peak appears followed bya more graduai peak. These
peaks retlect changes in furnace t~mperature. It illustrates an added benefit of using a heat pipe
lance versus a normal lance. Besides longevlty of life and improved control over the Mitsubishi
process, the heat pipe lance appears to be a good sensor of what is happening inside the furnace.
Perhaps good enough that correlations can be drawn between the pressure inside the pipe and
the operating conditions of the fumace. This is not investigated in this work but is something
that should be kept in mind for future study.
71

---------- ---------- ------------
The Mark 1 lance failed at approximately 1:00 o'clock in the moming, on August 16.
1991. The pressure reading in Figure 7.9 illustrates this. The pressure read 97 kPa for a seven
hour period following a peak ln the graph. Visual inspection of the condenser revealed that il
had fallen into the fumace. The reading of 97 rather than 101,3 kPa resulted l'rom the
calibration of the pressure transducer being slightly off. The Mark 1 lance was th us reading
atmospheric pressure without any condenser. This could only Mean that the lance had failed.
The tiny peak at the end of the graph resulted from the removal of the pipe.
The Mark 1 lance tests proved to be very successful as the lance had remained in the
fumace for 2 days and 15 hours. Type 304 stainless steel lances are consumed upon insertion
into the fumace at a rate in the order of centimeters per hour. The Mark 1 lance survlved for
2 days and 7 hours before a leak developed. Only then did any significant consumption begin.
7.6 Failure of the Mark 1 Lance
After failure, the lance remained in the furnace for 8 hours. During this time, it behaved
as a normal lance, since sodium cooling ceased and the heat pipe principles no longer applied.
Fortunately, the lance was retrieved, which was not planned at the beginning of the experiment.
This allowed sorne investigations into its operation and fallure.
Visual inspection of the lance revealed that fallure had occured at the tJp of the lance.
since approximately .3 m of the lance edge was destroyed. Figure 7.10. which follows, shows
the severely attacked tip section next to a segment of the condenser which was approximately
1.5 m above the furnace roof. During the welding of the lance, a small pin hole had developed.
When the !Iole was filled, it is unlikely that the steel weld material penetrated deeply mto the
tiny crevice, resulting in a superficial weld. Thus, the pipe wall at the pinhole location cou Id
be very thin rendering that point on the lance susceptible to a leak. It is obvious from the figure
that the greatest amount of damage took place at the tip. Il appears that deterioratlon of the
lance began at the tip and worked its way backward.
72

... l
{
{
Figure 7.10 : Chemical Attack of Mark 1 Lance Tip Versus Undamaged Condenser
Section
The remainder of the lance section inside the furnace was for the most part intact,
suffering only a mild attack, most likely occuring after the failure of the lance when it no longer
behaved as a heat pipe. The moderate attack can be seen in the following photograph which
compares the lance section inside the furnace with the condenser section outside the fumace.
The mild attack on the remainder of the section inside the fumace versus the severe attack of
the tip section also suggests that the tip of the lance was the origin of failure.
73

,.'
Figure 7.11 : Top View of a Lance Section Inside the Fumace next to a Condenser
Section
74

..
Chapter 8
Scanning Electron Microscope Analysis of Mark 1 Lance
8.1 Introduction
SEM analysis was conducted on the Mark 1 injection lance with two objectives in mind:
i) to determine the high temperature effects of sodium on stainless steel
ii) to evaluate the damage done by the environ ment of the C-furnace on the Mark
1 lance
The samples taken from the Mark 1 lance had the following dimensions:
OUTER PIPE SAMFlE DIMENS 10 NS
Cl '('- - .... , -c::r-1 1 NH ..-_, -f
lNNER PI FE SAMPl E DIMENS IONS
Figure 8.0 : Sample Dimensions of Mark 1 Lance
75

1 ...
The samples were taken from three sections of the pipe. The tirst set, section l, was
taken at a distance of 2.6 m from the bottom of the lance. This section is outside the furnace
but within the operating regime of the sodium in the heat pipe. The second set of samples,
section 2, was taken from a region just inside the fumace, 1.5 m from the bottom of the lance.
The: last section, section 3, was taken at a location on the pipe that was 0.76 m from the lance
bottom.
8.2 Sample Preparation and Analysis
The inner and outer pipe cross-sections were mounted in bakelite and fine-ground to
reveal the interfaces between the pipe and the working substance and the pipe and the
environ ment. The samples were ground using standard procedures.
The samples were ail examined using the secondary electron mode of the SEM. The
accelerating voltages used were 15 and 20 kV with a working distance of 39 mm. These settings
were thought to provide the best resolution. X-ray analysis was done on aIl three samples to
qualitatively determine what was present.
8.3 Results and Discussion
When comparing Micrographs 1 and 2, on the following page, the air interface with the
sodium interface, it can be seen that the wall is coarser on the sodium side. This is illustrated
by the slightly granular nature of the interface in Mic:ograph #2. Note that the dark background
is bakelite. This attack of the interface appears to be very even. This was the case when the
entire sample was examined. The morphologyof the interface could be a result of chemical
attack or a physical erosion of the interface due to the sodium. The latter would be preferred
from a heat pipe materials point of view and will be shown to be the case in the discussion
which follows.
The granulation of the sodium side becomes much more distinct when the images are
magnified (Micrographs 3 and 4). The depth of penetration of this attack is approximately 12.5
micrometers. This is over a period of nearly 65 hours.
Micrographs 5 and 6 illustrate the outer pipe section taken at the same location, 2.6 m
from the lance bottom. Similar results to those of the inner pipe can be seen .
76
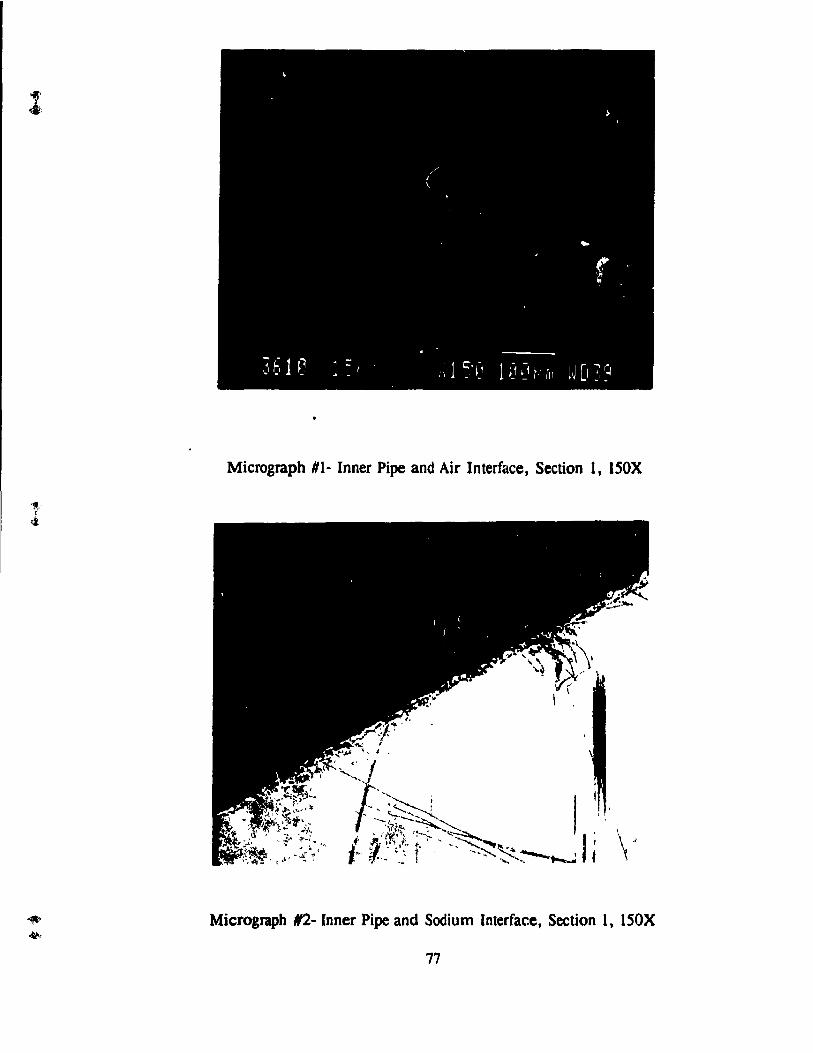
l
Micrograph #1- Inner Pipe and Air Interface, Section l, 150X
Micrograph #2- [nner Pipe and Sodium Interface, Section l, 150X
77
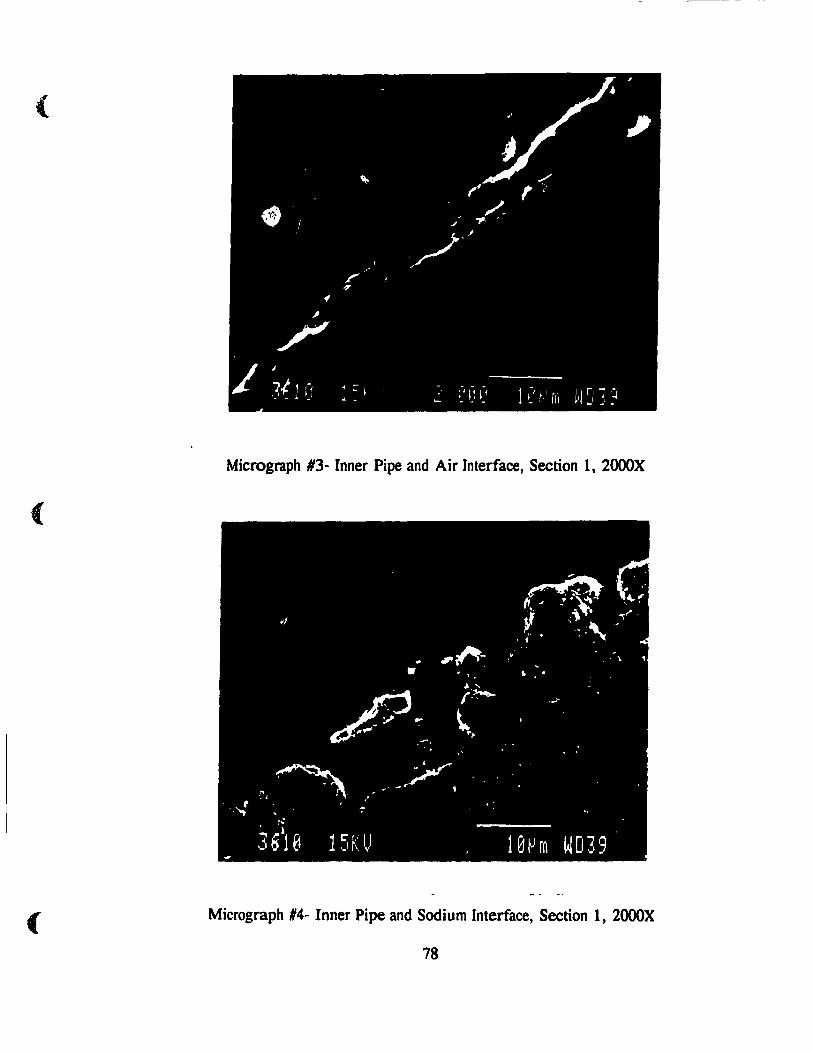
(
«
(
Micrograph #3- Inner Pipe and Air Interface, Section l, 2000X
Micrograph #4- loner Pipe and Sodium Interface, Section l, 2000X
78

Micrograph #5- Outer Pipe and Air Interface, Section l, 2S00X
Micrograph #6- Outer Pipe and Sodium Interface, Section l, 2S00X
79
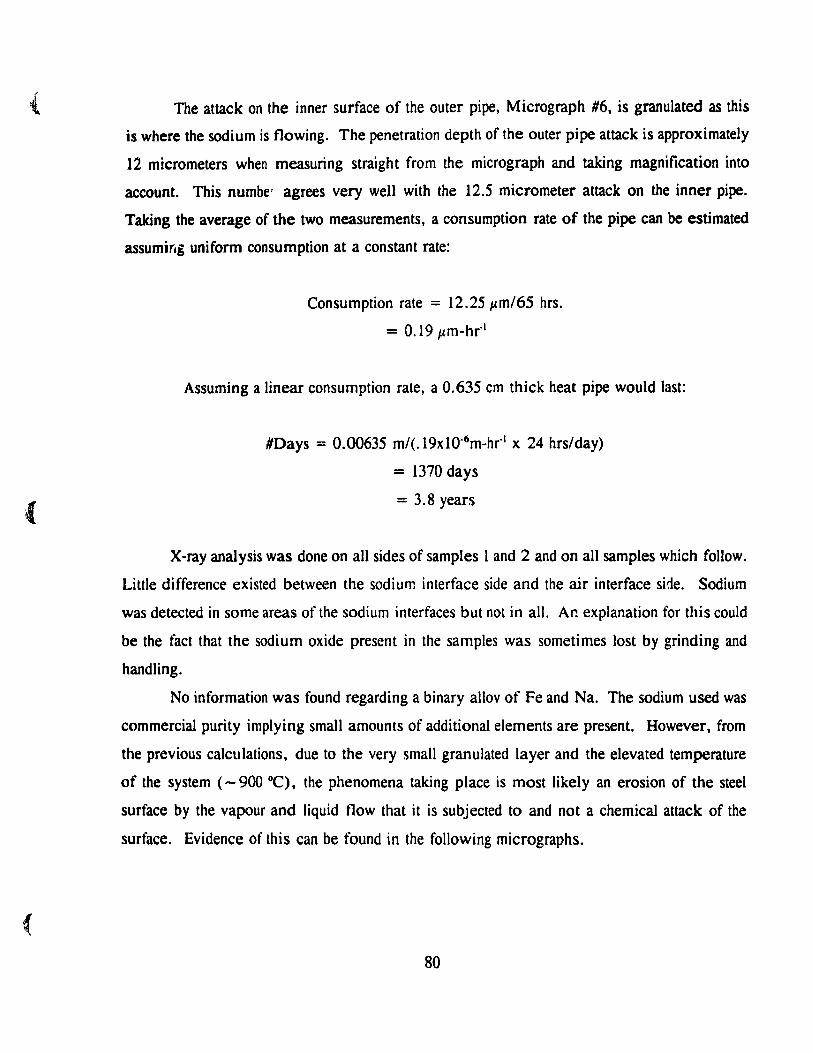
{ The attack on the inner surface of the outer pipe, Micrograph #6, is granulated as this
is where the sodium is flowing. The penetration depth of the outer pipe attack is approximately
12 micrometers wh en measuring straight from the micrograph and taking magnification into
account. This numbe' agrees very weIl with the 12.5 micrometer attack on the inner pipe.
Taking the average of the two measurements, a consumption rate of the pipe can be estimated
assumir,g uniform consumption at a constant rate:
Consurnption rate = 12.25 I-'m/65 hrs.
= 0.19 J,tm-hrol
Assuming a Iinear consumption rate, a 0.635 cm thick heat pipe would last:
#Days = 0.00635 m/{.19xlOo6m-hro' x 24 hrs/day)
= 1370 days
= 3.8 years
X-ray analysis was done on aIl sides of sampi es 1 and 2 and on aIl samples which follow.
Little difference existed between the sodium interface side and the air interface side. Sodium
was detected in sorne areas of the sodium interfaces but not in aIl. Ar. explanation for this could
be the fact that the sodium oxide present in the samples was sometimes lost by grinding and
handIing.
No information was found regarding a binary allov of Fe and Na. The sodium used was
commercial purity implying small amounts of additional elements are present. However, from
the previous calculations, due to the very small granulated layer and the elevated temperature
of the system (- 900 OC), the phenomena taking place is most likely an erosion of the steel
surface by the vapour and Iiquid tlow that it is subjected to and not a chemical attack of the
surface. Evidence of this can be found in the following micrographs.
80

1
Micrograph #7- Inner Pipe and Furnace Atmosphere Interface, Section 2,2000X
Micrograph #8- Inner Pipe and Sodium Interface, Section 2, 2000X
81
(
(
(
Unfortunately for the results of this work, after the Mark 1 lance had failed, it took
approximately 10 hours before it was removed from the furnace. Micrographs 7 and 8 are not
good representations of the effects of sodium on stainless steel. They do, however, illustrate
the effects of chemlcal attack. The ten hours the lance was exposed to the fumace atmosphere
caused the lower end of the lance to experience chemical attack by the fumace gases
(predominantly S02 an" enriched air).
At the higher section previously discussed, damage from the atmosphere was minimal
since the hot S02 gases could not easily reach the upper pan of the pipe. This is due to the fact
that the pipe failed when it was operating near one atmosphere, so there was only a small
pressure gradient at best to drive the S02 furnace gases into the top end of the pipe. As lhe
sodium was slowly consumed and the sodium vapour began to condense due to the temperature
drop in the upper portions of the pipe, more furnace gases could find their way into the pipe.
The sodium, however, preferentially oxidized so that the steel pipe could only be attacked once
all the sodium was consumed. Due to the relatively small annulus, this was a slow process.
Perhaps most importantly, the low temperatures at the upper portion of the pipe reduced the
corrosion rate of the pipe exponentially. As such, the micrographs presented from section one
are not as influenced by the failure of the pipe and do illustrate the effect of sodium on the pipe.
The micrographs from the lower end of the pipe Illustrate the fumace attack on the steel; the
lower the section, the greater the attack.
Comparisons of the micrographs t'rom the different sections support the previous
statements. The surface of Micrograph 8 is rough and uneven unlike its counterpan in section
one, Micrograph 4. The latter is granular and uniform, appearing to have undergone an erosion
process on the surface. The former is rougher and uneven, resembling a surface which has
experienced chemical reaction. The hot S02 and ~ir from the furnace atmosphere and the
temperature of the surroundings increased the reacdon rates noticeably in the lower sections of
the pipe.
Micrograph 9 which follows, taken from section 3, 0.76 m from the lance tip, further
supports chemical attack of the lower sections by the furnace gases versus erosion of the upper
portion by sodium. An even more severe attack can be seen on this surface.
82

!
•
r i
Micrograph #9- Inner Pipe and Sodium .Interface, Section 3, 2000X
When Micrograph 9 is compared with Micrograph 4 the different mechanism of attack
becomes obvious. The lower sections show how the furnace atmosphere of the C-furnace at
Kidd Creek reacted with the stainless steel pipe and began to consume il. The morphology of
the two micrographs are very different. Comparing Micrographs 8 and 9 we can see that the
lower down the lance, the greater the attack. Note that this section was located weil above the
bath surface where the attack on the stainless steells not nearly as severe as it is down by the
tip of the lance.
If we compare the x-ray graphs of the upper section to the lower section, evidence of
,. chemical attack at the bottom of the pipe is revealed.
83

(
(
(
F E
H-, C
C .F:
F E
.,\ L Î:::, R;
/
'."" f,j ,... 1 : fi J'o-' , I"~.,, .1 \, , Î 1.,,,.
'..t "
1 1 t
1
Figure 8.1 ' X-Ray Analysis of Outside Pipe and Sodium Interface,
Section l, 17000X
............. E. 1 '2:N' L ... , ....................................... ~ .... , ................................ , ........ ~ .... ! .. _ ........ ~ ...................................................................... ..
1 .!i l,. 1 1 1 1: ! /. i, ~! i 1 .,.. ..,. ~. , .... _". L .. -""l!.-.A ... , ....... ·_ .. ·· ......... , ..... : HA'- · ~ ................ ' .. ·N .. · .............. • .. · .... · ........ ·_ .... ·• .... · :.A':':::::::::: !"'·'IPV .. :~~t\ ni •• :: ::. . : : :
ri ; i i i i i i i i ~ ~ ~ ~ i ~ : i i i ~ ~ i f i i rtti :'T'r'i': 1 i i i . : j i . i ! i i ; Iii ! :! i ~ ~ 11 i 11 ! • : 1
~ i i : :: :: : i: i . :: ~ ; :
!!~!:!!!;!!~!!~!!!~~!~~~!:!!I!!!r!!~~;!!:'!!f !ii !~!~:!!!j!j!~~!~!!!!I! !!!!
Figure 8.2 X-Ray Analysis of Inside Pipe and Sodium Interface,
Section 2, 8000X
84

..
Figure 8.3 : X-Ray Analysis of Inside Pipe and Sodium Interface,
Section 3, 9000X
Figures 8.2 and 8.3 show the presence of oxygen in ihe interface. Figure 8.3 of section
1 reveals no oxygen in the interface. The oxygen must exist as metal oxide and in a large
enough amount to show up in x-ray analysis. Oxygen is often difficult to analyze for on the
SEM. This implies the presence of corrosion products such as iron-oxides on the surfaces of
sections 2 and 3. This can only re~ult from a chemical reaction taking place at the interface
between the furnace gases and the steel. As no oxides were detected on the surface of section
one we must assume that no corrosion has taken place. If we consider this and the other
evidence presented, the mechanism causing the granulation that was illustrated in Micrograph
4, is erosion.
85

, .
< 4 ,
(
Chapter 9
The Mark II Heat Pipe Injection Lance
9.1 Introduction
Motivated by the success of the Mark 1 lance tests, construction and testing of a second
lance was planned shortl y after. Discussions were held on how to i mprove the heat pipe lance
based on the knowledge acquired from the previous experiments. The major points of those
discussions were as follows:
i) From the results of the S.t.M. analysls and the Mark 1 lance tests, it was clear that
sodium should remain as the workmg tlUld since it proved to be compatible with
stamless steel and It served its purpose weIl as a coolant.
ii) From the visual inspection of the remains of the Mark 1 lance based on our
knowledge of the pinhole which developed during welding, it was clear that failure
had taken place at the tlp of the lance and that this problem must b! dealt with.
iii) Past expenence with lances operating at Kidd Creek showed that hO alloy lances
last longer than 310 stainless steel lances. Thus a sman change in materials
selection was decided upon.
These points were implemented into the engineering of the Mark II lance. The lances
were otherwise similar in aIl regards.
9.2 Construction of the Mark II Lance
Kidd Creek had a contract wuh Kuboto, a Japanese based company that manufactures the
HO alloy lances tested in Kidd Creek's C-furnace. They were contracted to do the bulk of the
86

Mark II lance construction. Their HO alloy lances are spun cast so that they are not available
in a large variety of sizes. The size required for the inner pipe of the Mark Il lance assembly
was not available in HD alloy material, so a 309 stainless steel was chosen instead. The HD
alloy lances were larger in diameter than the 310 stainless steel lances resuIting in a greater
overall weight of the lance. This also implieJ that the heat entering the lance would be greater
due ta the larger surface area. Calculations were made using the methodology in Appendix C,
revealing that the vapour velocity would be weil wlthin ail of the limits mentioned in the theory
section.
To solve the probIem of the lance tip failure, a much thicker plate was welded to the
bouom of the pipes, resulting in welds that were removed from the edge of the lance where il
is feIt the greatest amount of attack takes place. These welds were also tested non-destructively
(x-ray testing) to ensure their integrity. The thicker plate would ensure a longer life for the tip
assuming that is where the greatest problems occur.
The sodium working substance was not changed and came from the same suppl Y th~t was
used for the Mark 1 lance.
9.3 Experimental
The cleaning and feeding procedures are the same as those outlined in the Mark 1 lance
section. The pressure transducer and valving system was identical to the one used for the Mark
1 lance. The only difference in experimental set-up between the two tests was that the Mark Il
lance had an av·.;rage air flowrate through the middle of the lance of 90 NI/s, which was
maintained for the entire duration of the test. In the previous lance experiments, air was not
available at the beginning of the test so that the Mark 1 lance ended up plugging.
9.4 Results and Discussion
The Mark II lance test began on Oecember Il, 1991 and tinished on Oecember 19, J 991.
The data was compiled in the same manner as mentioned in the previous section. The folbwing
figures show the pressure and temperature curves for the Mark JI lance.
87
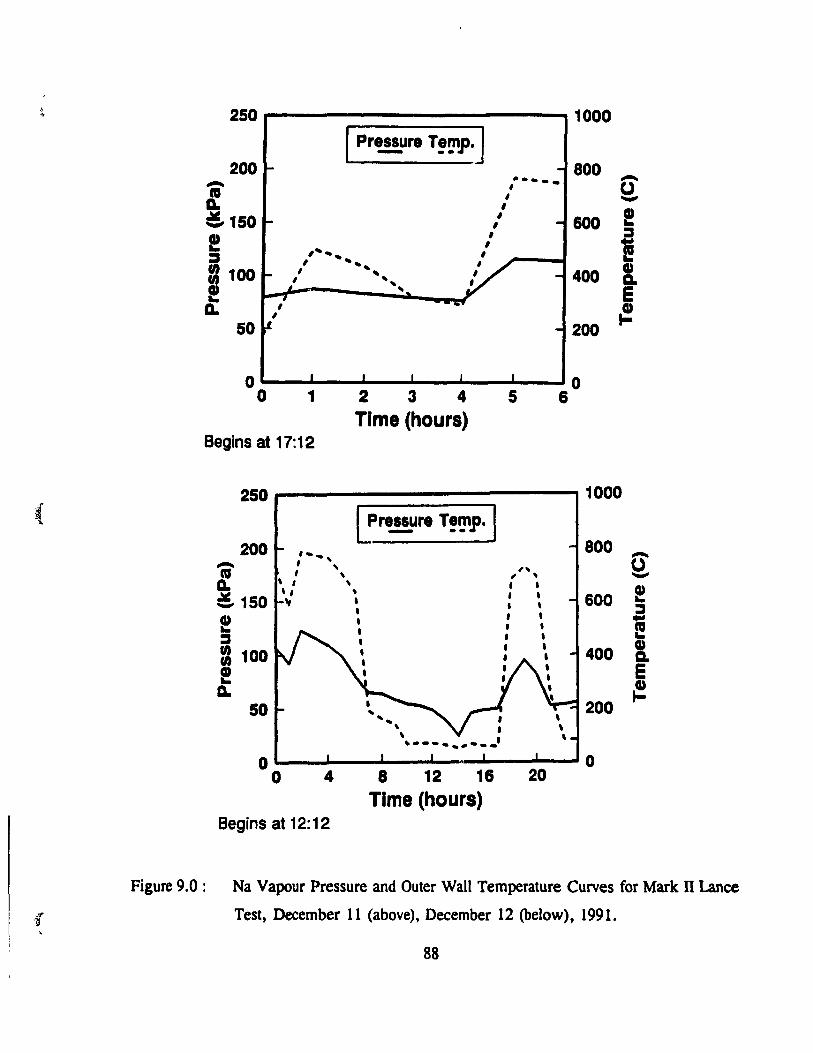
, ..
(
-f "'
250 1000 P,!!!.Ure T!~.
200 800 ,-. --- --. --. U " , G.
..... , ! ~150
, 600 ,
! , :1 , .. , ..... , l! :::1 , ..... ,
1100 ... , a. , .. , 400 1 , , a.
! ' ... E G. 1 ..
~ 1
50 200
0 0 0 1 2 3 4 5 6
Time (hours) Begins at 17: 12
250 1000
Pr4!!!.Ure T!!!Ip. 200 , ...... 800 --. --. 1 ... U ... ca 1 ... .....
D. ' , ... e ::!. 150 ' , ... 600 .. , , :1
! , .. • l! :1 ,
CI» CI) 100 • 400 CI) • a. ! • E G. ~
50 200 • \ • " . -...... --... '
0 0 0 4 8 12 16 20
Tlme (hours) Begins at 12: 12
Figure 9.0: Na Vapour Pressure and Outer Wall Temperature Curves for Mark II Lance
Test, December Il (above), December 12 (below), 1991.
88

" ,.
,.'
Figure 9.1 :
250 1000
Pressure -200 -. T!~p. 800 -:: • , U • \ , ....,
• \_tIfI-", ~150 1 ,
600 ! • • :s ! • ,
• , ! ~ 1 , ", 100 • , CD ut , 400 Co !
, E ,
Q. , ~ ,
50 200 ,
~-----.... _, 0 0
0 4 8 12 16 20 Time (hours)
Begins at 12: 12
250 1000
Pressure -200 T!!!1p. 800 .--.. -'" U Q. ...., , ~150 ,1 ! , 1 600 !
, 1 :s , .. , • 1 ..
~ ,
1 ! ut " , , . 1 100 ' \, , ,
1 400 CD ut , " CL
! 1 , • 1 E a. 1 1
~ ,
50 200 1 ..
' ... 0 0
0 4 8 12 16 20 Time (hours)
Begins at 12:12
Na Vapour Pressure and Outer Wall Temperature Curves for Mark Il Lance
Test, December 13 (above), December 14 (below), 1991.
89
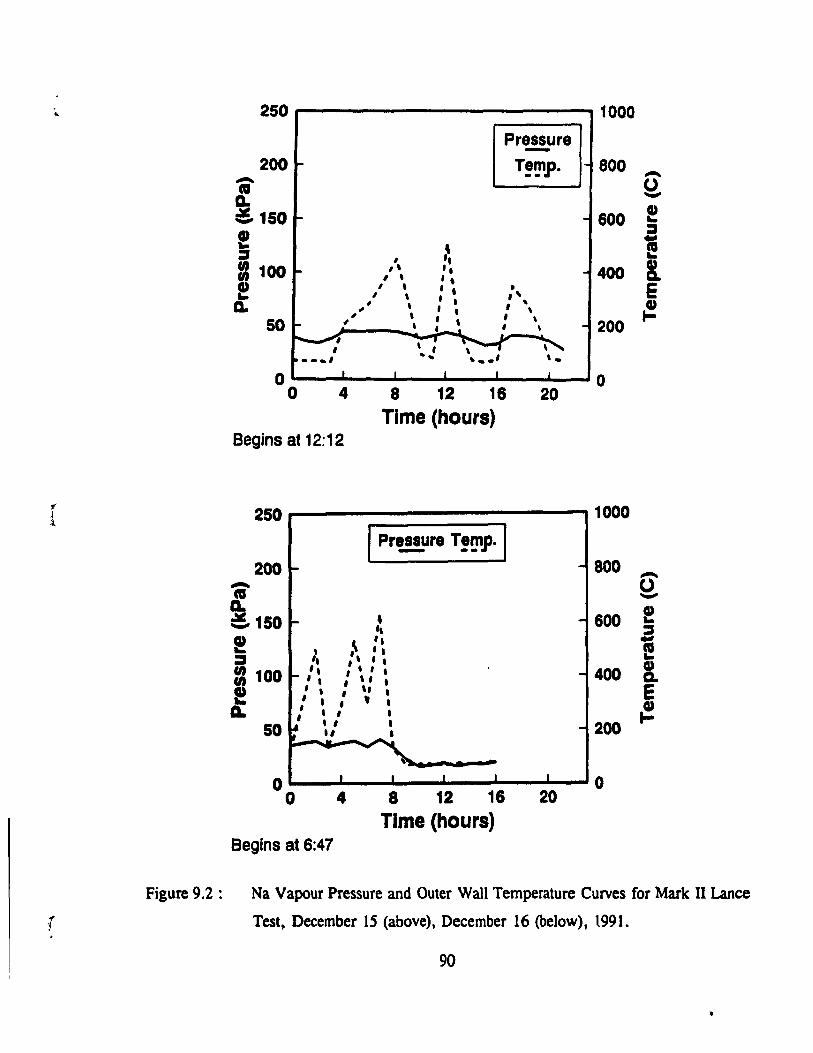
..
!l'
i
Figure 9.2 :
250 1000
Pressure 200 T!~p. 800 .-. ca a.
~150 600 ! , ~ 1 'I 1100 l' '. 400 1 • l ,
! 1 • , 1 1 • , . a. ~ , , 1 , , • ,
50 , 1 200 , , , 1 --_1
0 0 0 4 8 12 16 20
Time (hours) Begins at 12: 12
250,.....------------,1000
200 Ci Ga :!-150 ! ~
:1 100 l!
Ga 50
• " '. ~ '. " '. , ' , . , l' • , l, • , , . , , . , , .
., 1
800
600
400
200
o '---"---'---'--...... ------..... 0 o 4 8 12 16 20 Tlme (hours)
Begins at 6:47
..... CJ ..... ! ~ .. l! 8-E ~ ...
.-. ~ ! :s 10 .. 8-E ~
Na Vapour Pressure and Outer Wall Temperature Curves for Mark II Lance
Test, December IS (above), December 16 (below), \991.
90

250
1 Pr~re T!~j). 1 200 ~ -..
Q.
!..150 ~ -I! :::s :1100 - -I! Q.
50 - -- .., --.. -------.-_., --' ----- ~
0 1
0 4
Begins at 12:00
250
200
l ~150 ! ::1 = 100 ! Q.
~
-
- 1",
• , 1 ,. , ,
1 , -. , 50 , ,
o o 1
4
Begins at 12:00
,
1 1 1 1
8 12 16 20 lime (hours)
Pressure -T!~j).
-
-, '. 1 • 1 , , . " , · ,\ L , , , , '. , -- .-.--------. -
1 1 1 1
8 12 16 20 lime (hours)
1000
800 -~ ! 600 ~ ... l!
400 Q) Q.
E
200 ~
0
1000
800 -u -600 !!
~ .. t!
400 G) Q.
E
200 ~
o
Figure 9.3 : Na Vapour Pressure and Outer Wall Temperature Curves for Mark n Lance
Test, December 17 (above), December 18 (below), 1991.
91
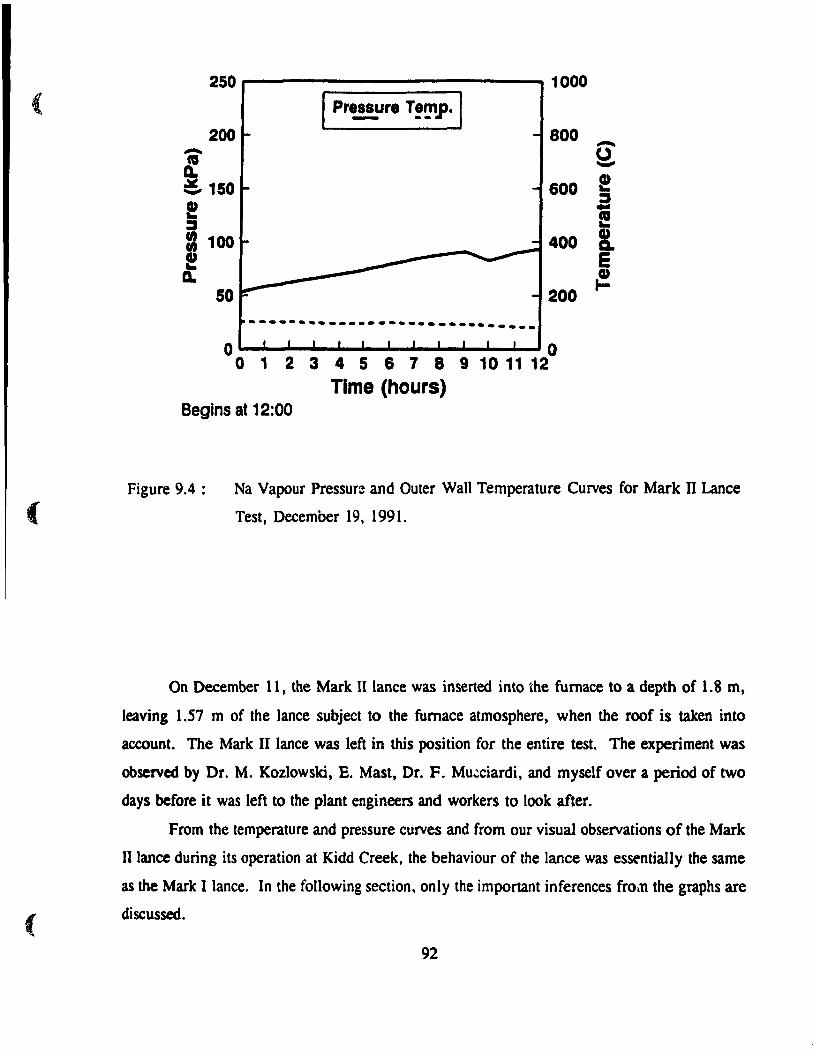
( 250~----------------------~1000
200 800 -~ l ~ 150 600 e .a e :::1 1100 e Q.
50
400
200
.~--------_._--.-. __ ._-------o 0 o 1 2 3 4 5 6 7 8 9 10 11 12
Tlme (hours) Begins at 12:00
l! 8-E ~
Figure 9.4 : Na Vapour Pressure and Outer Wall Temperature Curves for Mark II Lance
( Test, December 19, 1991.
(
On December 11, the Mark II lance was inserted into the fumace to a depth of 1.8 m,
leaving 1.57 m of the lance subject to the fumace atmosphere, when the roof is taken into
accouot. The Mark II lance was left in this position for the eotire test. The experiment was
observed by Dr. M. Kozlowski, E. Mast, Dr. F. Mu~ciardi, and myself over a period of two
days before it was left to the plant engioeers and workers to look after.
From the temperature and pressure curves and from our visual observations of the Mark
Il lance during its operation at Kidd Creek, the behaviour of the lance was essentially the same
as the Mark 1 lance. In the following section. ooly the important inferences froln the graphs are
discussed.
92

Upon insertion into the furnace, the response of the lance was smooth, without any large
fluctuations in the pressure readings. This is because the data that is graphed in Figure 9.0 was
taken after the conditioning process, wherein the lance was evacuated over 5 second intervals,
a number of times, to remove the impurites generated from the vaporization of sodium. Thus,
the Mark Il lance was weIl conditioned before the data was recorded. The jump in the pressure
after four hours resulted from a change in the fumace conditions and not from a deeper
insertion. On the days which followed the pressure and temperature curves seemed to fluctuate
more than in the previous lance experiment. Two factors contribute to this behaviour: firstly,
daily lance inspections are carried out to re-adjust the lance heights if required, which involve
tuming off the fumace, anrl secondly, a seemingly greater instability in furnace operations during
the Mark II lance test as compared with the Mark 1 lance test.
On December 15 and 16, Figure 9.2, there is a discontinuity in the data. This was a
result of improper storage of data in the computer and had nOlhing to do with the operation of
the Mark II lance. Up until December 18, Figure 9.3, the lance was left in place with liule
supervision; only the occasion al inspection to make sure everything was in order. The lance
operated smoothly, responding to the changes in furnace conditions as expected. On December
18, at approximately 9:00 pm, a leak developed in the Mark II lance causmg the pressure to
gradually rise to 1 atm over a period of 15 hours. At 9:00 am, there was a decrease in the
pressure for a 1 hour period before the curve returned to the gradually increasing slope it had
before. The dip in the pressure resulted from a lance inspection. When the furnace was down,
the temperature dropped inside the lance causing the gases to contract and the pressure reading
to fall. After an hour, the fumace was turned back O!l :4nd the pressure reading in the lance
began to climb again.
Upon completion of the test, we were satistied that the improvements in the engineering
of the Mark II lance served their purpose. The life of the lance was extended to 7 and 1/2 days
from the previous 2 and 1/3 days.
9.4 Failure of the Mark Il Lance
~ Once the Mark II lance failed, attempts were made to remove the lance from the fumace.
93

(
(
ln the end, the evaporator section of the Jance could not be retrieved. The lance tip was
therefore, not inspected. However, the condenser section was examined revealing valuable
information regarding the failure of the lance.
During the operation of the Mark Il Jance. a spiral shadow of darker material appeared
on the condenser sectIon. The following figure illustrates this point.
Figure 9.5 : Spiral Shadow of Darker Matena} on the Condenser Section of the Mark II
Lance
94

1. After the lance was retrieved and disassembled, it was discovered that the bottom portion
of the inner pipe had warped, illustrated in the following figure.
Figure 9.6 : Inner Pipe of the Mark Il Lance AfteT Kidd Creek Tests
95

.(
{
The y'arping of the inner pipe must have come about from a differential expansion of the
two pipes. This was a sensible explanation since not only were the materials different steels,
but their dimensions, i.e. waIJ thicknesses, were different. This caused a disparate degree of
expansion in each pipe. Since the pipes were welded at the ends, the inner pipe was not
permitted ta expand in length, causing it to warp.
Two cracks were ahe discovered on the inner pipe. Leak testing conducted at NTC
demonstrated that one of the leaks penetraled the full thickness of the pipe. The cracks were
longitudinal, as can be seen in Figure 9.7.
,.
Figure 9.7 : Longitudinal Crack on Inner Pipe of Mark n Lance
96
A metallographic study undertaken by NTC personnel was conducted on sections of the
pipe. The study revealed that a brittle intermetallic. known as sigma phase. was found in the
heated parts of the inner pipe. Details of the study are found in an internal report and art' not
available for referencing. The failure resulted from the combination of differential expansion
and sigma phase embrittlement of the inner pipe. The differential expansion caused stresses in
the inner pipe while the sigma phase provided a location of decreased ductility were the stresses
could concentrate and lead to a crack.
97

(
(
Chapter 10
Conclusions
A transparent heat pipe was constructed and studied. The two-phase, liquid and vapour,
flow was visualized and values for the heat flux, vapour velocity and fluid velocity were
determined mathematically. The mathematical value obtained for the condensate velocity
(Appendix B) agreed with visual measurements. The methodology used in the calculations
became the basis for the heat pipe injection lance calculations (Appendix C).
Simulations for the Kidd Creek process with a Laboratory Scale Heat Pipe Injection
Lance were carried out. Il was discovered that a 11 1 ratio of condenser to evaporator length
could be expected in the industrial size C-furnace at Kidd Creek. It was also learned that the
sodium vapour pressure and the visible condenser length could be reduced by as much as 40 %
of their original values when external air cooling was used on the condenser section of the
laboratory scale heat pipe injection lance.
Two pilot scale heat pipe injection lances were developed and tested based on the
preliminary work done 31"\d the results of the simulation experiments. The second heat pipe
injection lance, Mark II, lasted 7 and 1/2 days in Kidd Creek's C-furnace; orders of magnitude
longer th an the regular 304 stainless steel lances which were being used at that time. The results
of the simulation experiments proved to be accurate. The behaviour of the Mark 1 and Mark
II lances corresponded weil with the values obtained in the simulation trials. From our visual
inspection inside the furnace and from the fact that the lance was operating properly, it was clear
that the lance location with respect to the bath surtàce was unchanged from its original insertion
depth. Thus, its exact location was known unlike the standard lances.
A novel, self-cooling, heat pipe injection lance (patent pending) was developed and
successfully tested.
98
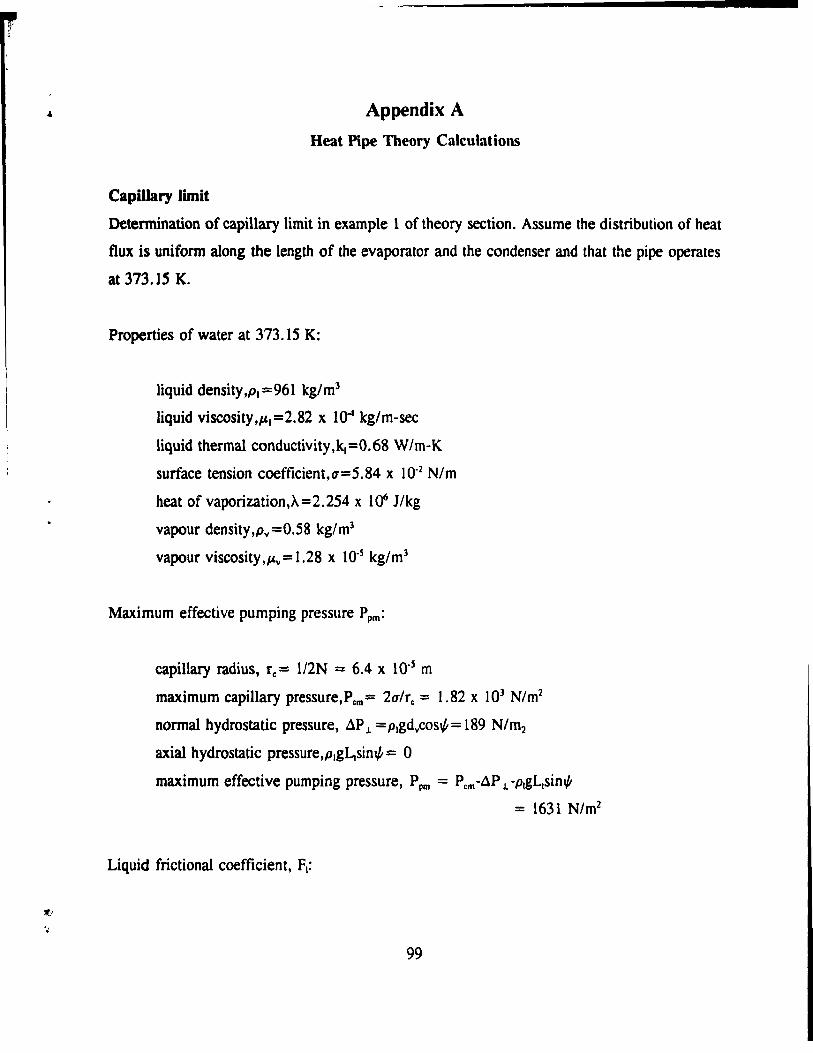
Appendix A
Heat Pipe Tbeory Calculations
Capillary limit
Determination of capillary limit in example 1 of theory section. Assume the distribution of heat
flux is uniform along the length of the evaporator and the condenser and that the pipe operates
at 373.15 K.
Properties of water at 373. 15 K:
liquid density,p.=961 kg/ml
liquid viscosity,#,.=2.82 x lO4 kg/rn-sec
liquid thermal conductivity,k.=O.68 W/m-K
surface tension coefficient,u=5.84 x 10⁻² N/m
heat of vaporization,À=2.254 x 1er J/kg
vapour density,pv=O.58 kg/m3
vapour viscosity ,#'v = 1.28 x 10⁻⁵ kg/ml
Maximum effective pumping pressure Ppm :
capillary radius, rc = 1/2N = 6.4 x 10⁻⁵ m
maximum capillary pressure,Pcm= 2u/rc = 1.82 x 10³ N/m2
normal hydrostatic pressure, AP.l. =p,gdvcos~= 189 N/m2
axial hydrostatic pressure,Plg4sin~ = 0
maximum effective pumping pressure, Ppm = Pcm-AP.l -p~Ltsin1P
= 1631 N/m2
Liquid friction al coefficient, FI:
99

wick cross-sectional area, Aw=1r(d,2-dy2)/A=6.63 x lOosm2
wick crimping factor, S = 1.05
wick porosity,E= 1-1rSNd/4=0.594
wick permeability,K=d2E3/122(l-E)2=4.07 x 1O-lIm2
Iiquid frictional coefficient,FI=~/KAwp.À=48.2 (N/m2)/(W-m)
Vapour frictional coefficient,Fy:
vapour core cross-sectional area, Ay=1rd/14=3.17 x 104 m2
vapour core hydraulic radius,rb.v = 1.005 x 1002m
Drag coefficient,(fyRev) = 16
vapour friction al coefficient,
Fy = (fyRev),,)(2Ayrb/pyÀ) =2.45 x 1002 (N/m~/(W-m)
CapiIJary heat transport factor,(QL)c.max:
CapiIJary heat transport limit,Qc.max:
Q = (QL)c.rnu =84.5W c,mu O.SL, +La +O.SL~
Sonie Limit
Determination of sonic limit for example 1. Same assumptions as those of capillary limit
calculations.
100

!
vapour core cross-seetional area, a.. = 3. 17 x 104 m2
vapour density,pv=O.S8 kg/m3
latent heat of vaporization, À=2.254 x 10⁶J/kg
vapour molecular weight, M= 18
vapour specifie heat ratio , 'Yv= 1.33
universal gas eonstant,R=8.314 x 1Q3J/kg-mol-k
vapour constant,Ry =8.314 x 10³/18 = 462J/kg-k
vapour temperature, Ty =373.1SK
sonie limit,
= (3. 17x 104 )(O.58)(2.254xH)i)[1. 33(462)(373. 15)/[2(1 + 1.33)]]"2
= 9.19 x 1()4 w
Entrainment Limit
Determination of entrain ment limit for example 1. Same assumptions hold as in eapillary
limit section.
vapour core eross-seetional area, Ci.y = 3. 17 x 104 m2
heat of vaporization,À=2.254 x 10⁶ J/kg
surface tension coefficient,0'=5.84 x 10⁻² N/m
vapour density ,py =0.58 kg/m3
rh .• =2A.lC. = 1/2N-d/2=3.225 x lü-sm,
note that for screen wicks the hydraulic radius is equal to half of the wire spacing
101

f ,
Q =A À( OP") .,mu y 2r
h.r
=(3.17x 1(t4)(2. 254x 10-6)[(5. 84xl0-2)(O.58)/[2(3.225x 10-5)]]1/2
=1.64 X 10' w
Doiling Limit
Determination of boiling limit for example 1_ Same assumptions hold as in capillary limit
section.
critical nucleation radius,rn = 10-5 in. = 2.54 x 10⁻⁷ m
effective thermal conductivity of wick (see Chi p. 76),ke= 1.61 W/m-K
surface tension coefficient,CT=5.84 x 10⁻² N/m
vapour temperature, Ty =373.15K
heat of vaporization,À =2.254 x 1<J6 J/kg
vapour density,pv=O.58 kg/ml
Radius ratio,r/ry =2.21/2.01 = 1.1
critical pressure for nucleation,2o'/rn =2x5.84xlO-2/2.54xl07
=4.6 x lOS N/m2•
This is much larger that the maximum possible capillary pressure in the capi1lary limit
calculations (Pc = 1.82 x 10³ N/m2), therefore Pc can be neglected and the equation becomes:
substituting into the above equation,
102

Q"mu=211'(.I)(1.61)(373.15)(4.6xlOS)/[(2.254xl05)(O.58)ln 1.1]
= 1394 W
103

Appendix B
Transparent Heat Pipe Calculations
Ail the following equalions and data can be found in "Heat Transfertt by l.P Holman and
"FundamentaIs of Heat and Mass Transfer" by Incropera and De Witt :
Calculations derived from a typical transparent heal pipe experiment where:
Lcoadcnlcr = 0.775 m
roulaicle = 0.0145 m
rlll•1de = 0.013 m
kpy,ex = 1.13 W/m-K
T 1Inb_1 = 295 K
Reat Losses Due to Natural Convection from the Pipe to the Environment
.., Convective Heal Transfer Equation: 1.
... J 1
To find h for natural convection we must tirst determine the Grashof number:
here T,.= 295 K
g = 9.81 rn/s2
Vall = 15 .252x 1 0-6 m/~
evaluating the film temperature we get:
104
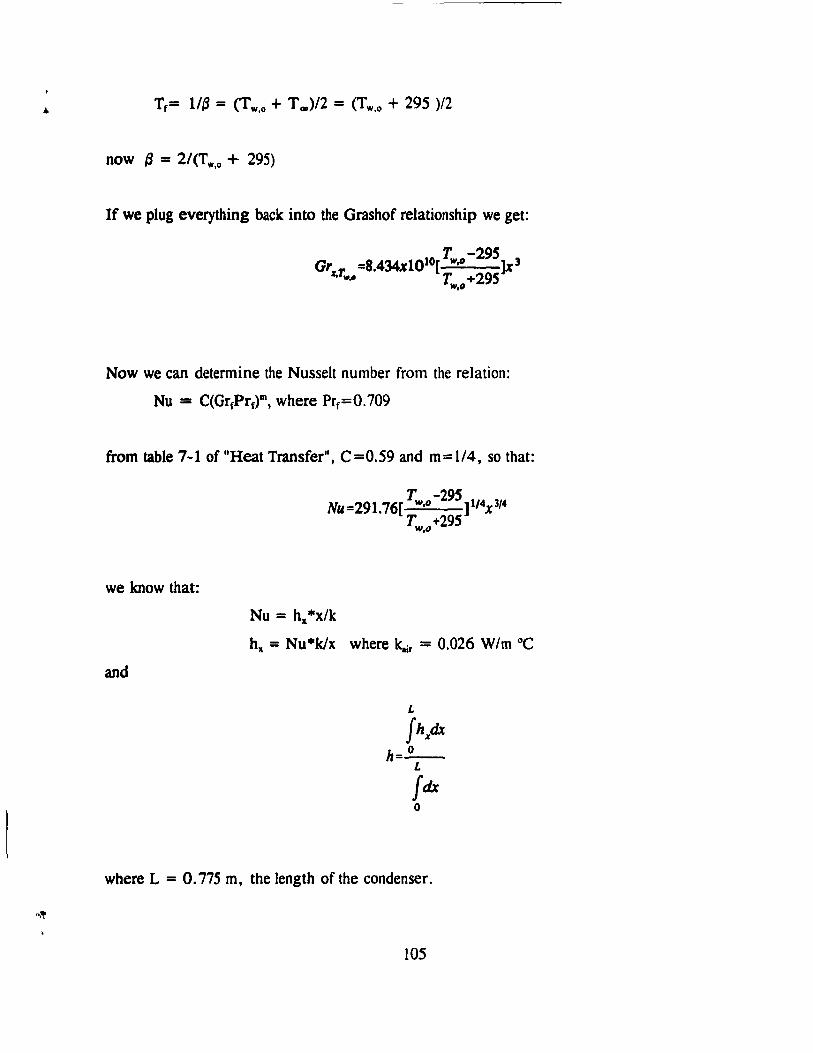
Tf= 1/{3 = {Tw.o + T 0»/2 = (Tw•o + 295 )/2
now {3 = 2/ (Tw•o + 295)
If we plug everything back into the Grashof relationship we get:
T -295 Gr =8.434.d010[ IlI,O ]x3
z,Tw.. T +295 IlI.O
Now we can determine the Nusselt number from the relation:
Nu = C(GrrPrf)m, where Prf =O.709
from table 7-1 of "Heat Transfer", C=0.59 and m=l/4, so that:
we know that:
and
T -295 Nu=291.76[ "'.0 ] 1/4x 3/4
T.r4I,o +295
Nu = hx*x/k
hx = Nu*k/x where k.ir = 0.026 W/m oC
L
fhxdx h=_o-
L
fdx °
where L = 0.775 m, the length of the condenser.
105

( Here h is hll,.lvl' for the condenser section. Making the appropriate substitutions and integrating
we get:
T -295 h =lO.71[ W,D ]1/4
Gi,.a'II T +295 W,D
Reat Lossess Due to Radiation
The equation describing radiation from a body onto a large open surrounding is:
Assuming an emissivity of one and calculating the area as:
A=211TI=211'(O.0145m)(O.775m)= O.0706m2
( substituting into the previous equation gives us:
Total Heat Losses from the Transparent Thermosyphon
[T -295]5/4 qr=O.756 W,D +4.00xl0-4[7:!,o -2954]
[TW,D +295] 1/4
Conduction Through the Walls of the Pipe
(
106

i ; t
~ ~,
where k(pyrex)= 1.13 W/m-K
L = 0.775m
rJrj= 0.0145/0.013 = 1.1154
qcOlld = -50.38(Tw.i-Tw.J
Laminar Film Condensation on the Inside Surface of the Pipe
After having observed the flow in the transparent thermosyphon, the convection inside
the pipe may be best approximated by laminar film condensation on a vertical plate.
The average heat transfer coefficient for the entire plate is:
where the physical properties of Refrigerant II are:
P. @25°C = 1467 kg/ml
Pv @ B.P. = 5.86 kg/ml
hr, @ B.P. = 180 689 J/kg
k. @25°C = 8.65 x 10⁻² W/m-K
#J.. @25°C = 0.42 x 10⁻² kg/m-s
cp,' @25°C = 871.52 J/kg
now hr.' = hr• + 0.68 cp,.(Tsal-Ts) = 180 689 + 0.68(871.52)(2)
= 181 874 J/kg
107
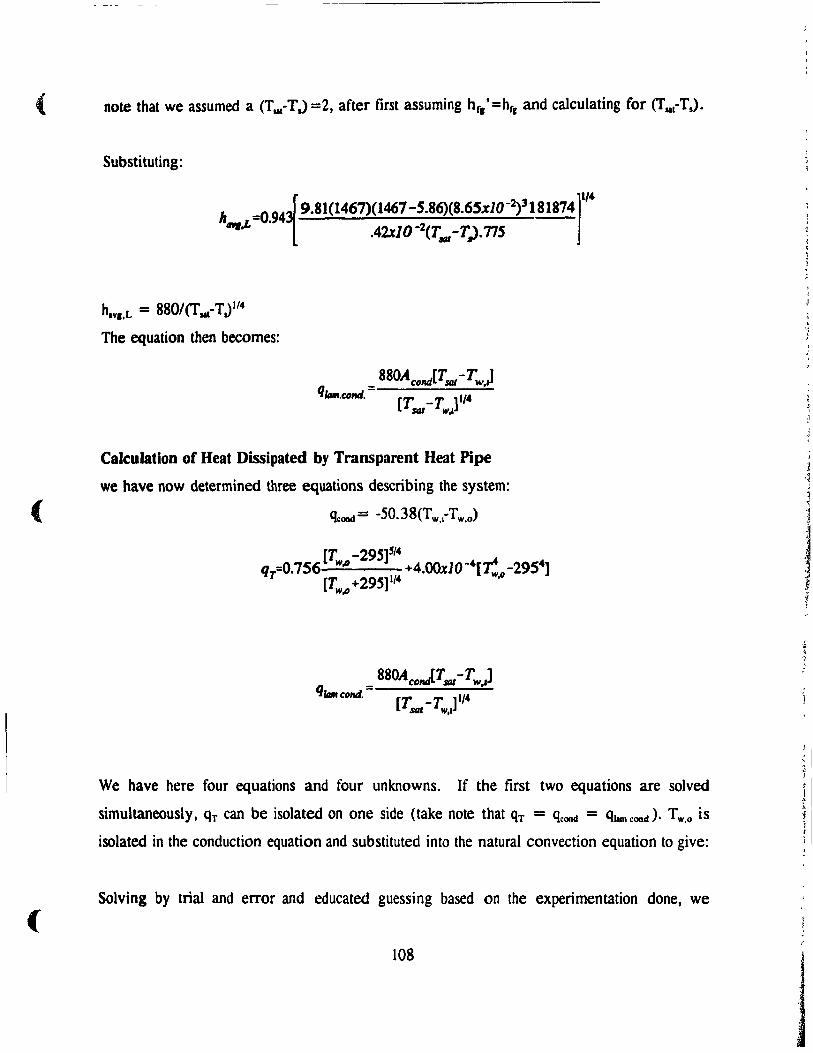
( note that we assumed a (Tut-T.) =2, after tirst assuming hr.'=hre and calculating for (TII,T.).
(
(
Substituting:
h =0.94 9.81(1467)(1467-5.86)(8.6S.%1O-2)3181874 i l~
.,,1. .42%10 -2(T.., -T). 775
h.VI •L = 8801 CT 111-T J 1/4
The equation then becomes:
880ACO/ld[T SQI-T~ ,] q = •
Iturt.COM. [T -T ]1/4 $tU .... 1
Calculation of Heat Dissipated by Transparent Reat Pipe
we have now determined three equations describing the system:
qcond= -50.38(Tw • .-Tw•o)
[T -T ]1/4 $QI "'.1
We have here four equations and four unknowns. If the tirst two equations are solved
simultaneously, QT can be isolated on one side (take note that qT = qcond = Qlamcond)' Tw•o is
isolated in the conduction equation and substituted into the natural convection equation to give:
Solving by trial and error and educated guessing based on the experimentation done, we
108
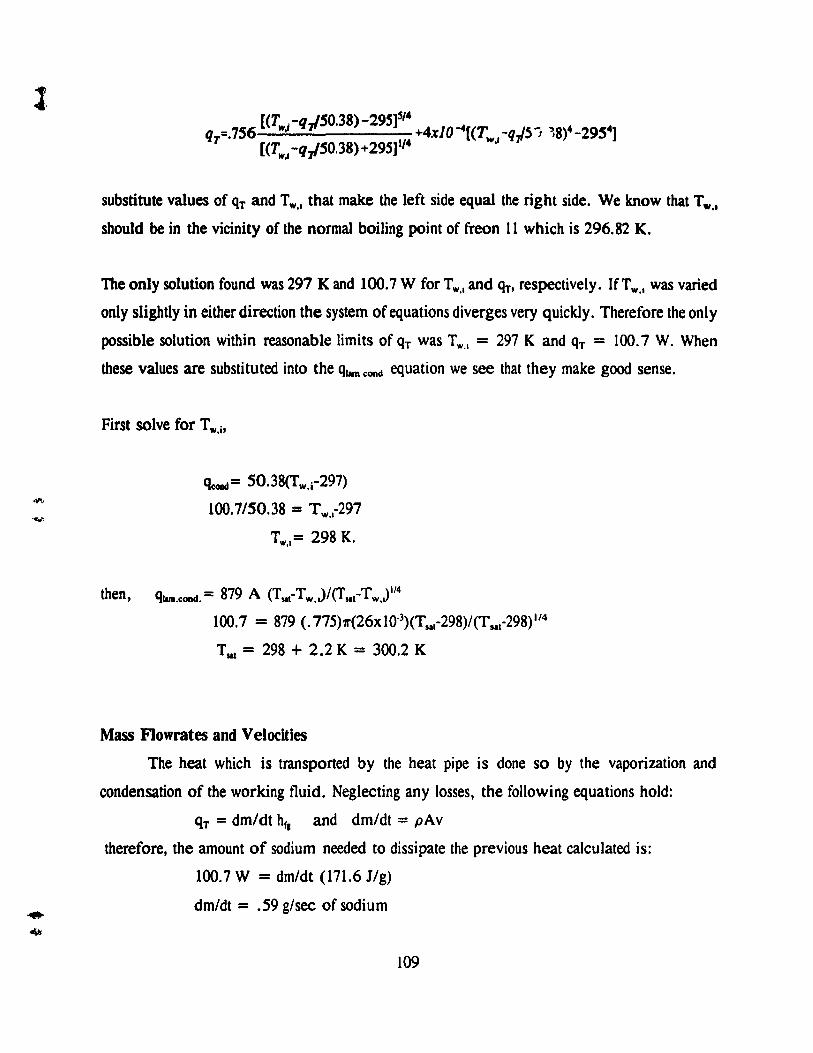
1. [(1 -q '50 38)-29S]5/4
q =.7S6 w" 7' • +4xlO"[(T -q,l5118)4_29S4] T [(Tw,l -qJSO.38) +29S] 1/4 w./
substitute values of qT and T W.I that make the left side equal the right side. We know that T _.1 should be in the vicinity of the normal boiling point of freon Il which is 296.82 K.
The only solution found was 297 K and 100.7 W for T'N.I and qT, respectively. IfTw•1 was varied
only slightly in either direction the system of equations diverges very quickly. Therefore the only
possible solution within reasonable limits of qT was T'N.' = 297 K and qT = 100.7 W. When
these values are substituted into the qlam cond equation we see that they make good sense.
First solve for T w,i'
qcoad= SO.38(Tw.i-297)
100.7/50.38 = T w . .-297
T'N.'= 298 K.
then, qllm.cond.= 879 A (Tsa,-Tw.J/(TslcTw)1/4
100.7 = 879 (.775)'II'(26xlO·3)(Tsa,-298)/(Tsa(298)J/4
Til' = 298 + 2.2 K = 300.2 K
Mass Flowrates and Velocities
The heat which is transported by the heat pipe is done so by the vaporization and
condensation of the working fluid. Neglecting any losses, the following equations hold:
qT = dm/dt hr, and dm/dt = pAv
therefore, the amount of sodium needed to dissipate the previous heat calculated is:
100.7 W = dm/dt (171.6 l/g)
dm/dt = .59 g/sec of sodium
109

l. The maximum vapour velocity of this sodium is:
vYlpOUr = dm/dt(ll pA)
vYlpOUr = .59/(6320'7l'(l3xl0-3)2)
= 0.176 mIs
To estirnate the condensate velocity we must first calculate a film thickness. RosIer et
a1. I, provide an equation which follows Nusselt's theory. Assuming constant fluid properties
and neglecting interfacial shear stress, the film thickness in a t" "rmosyphon device of uniform
cross section can be determined from the following equation:
6 - , ,-, (
3q Il 1 )1/3 o p,(p,-p)gh"
( 3(lOO.7/L,)(.42xl0-2)(L,) )1/3
60 = 1467(1467-5.86)9.8(180689)
Ôo = .07 mm
Now we must calculate the cross sectional area of the film,
Axa = 11'[.0132 - (.013 - .07x10-3)2]
= 5.7 X 10⁻⁶ m2
Now, the condensate velocity can be calculated
Vcondenute = .59 X 10-3 1 (1467 x 5.7 x 10-6)
= 0.07 mIs
110

.. '. Appendix C
Laboratory Scale Heat Pipe Injection Lance Calculations
This section refers to the schematic of the Laboratory Scale Heat Pipe Injection Lance,
Figure 6.0. The results of a test not indicated in the Table 6.1 and 6.2. are used in the
following calculations. The parameters of the test were as follows:
P = 1.43 atm From F*A*C*T (a thermodynamic computation program).
TI = 866 oC at this pressure. T NI.vlpour = 1188 K or 915 oC
T2 = 847 oC Condenser length = 0.275 m
T 3 = 140 oC
T4 = 50 oC
Condenser, Section II
T unblcnl = 25 oc Evaporator length = 0.305 m
roullHlc , ro = 0.0165 m
rm•lde• ri = 0.0125 m
Talee the average temperature of the condenser as Tcond.IVII = (866 + 847)/2 = 857 oC
Area of condenser: Acond = 211'rolcond
= 211'(0.0165)(0.275)
= 0.0285 m2
Heat dissipated through radiation (mostly) and convection:
Radiation: surface radiation to a large enclosure, from Holman42:
q = (1 Acond Es. ( T w'1I4 - T unb 4
)
from C.R.C. handbook EII =.9 for oxidized stainless steel
q = 5.669 x 1008(.0285)(.9)(1130" - 2984)
qu,rad = 2.36 kW
Convection (Free): From vertical cylinders. from Holman:
NUf.avl = C (GrfPrf)m
where Tf = (Tamb + Tw)/2 = (298 + 1130)/2 = 714 K
111

"700K.1ir = 66 x 10~ m2/s (j = lITf = 1/714
9.8(.-L )(1130-298)x1
Gr = 714 1. (66.tl 0 -6)2
take xava = 0.1375 (middle of section)
therefore, Grf.av. = ( 2.6215 x 10') xay•3
Grr.avl = 6.815 x 1()6
{ From Table 7-1 of Holman: Prf = 0.684
using Grroav.Prr = 4.66 x 10⁶
we get C = 0.59 and m = 1/4
therefore, NUr.x = 0.59 ( 1. 793 X 109 X3)1/4
NUr.x = 121.4 X3/4
we know that, hx = Nuxklx
and k.1I'.700t = 0.05 W/moC
to find haYI we must integrate as follows:
1 6
J25 Nu" (.05)dx
h - -_.-4n'f L .35 X
integrating gives haVI = 7.3 W/m2°C
using Newton 1 s law of cooling we get,
qu.cOllY = 7.3 Acond ( Tw - Tamb )
112

= 7.3 (.0285) (1130 - 298)
qu,cOllv = 173 W
It is clear that convection is very small compared to radiation.
Inert Gas, Section 1
The heat losses in this section have been calculated only for radiation, since convectiol'l losses
for this section are negligible compared to the rest of the losses. Using the same procedure for
radiation as in the previous section:
qU,rad = 65 W
Total Heat Dissipated by the LSHPIL
qT = ql,rad + ql,conv(negligible) + 'l!I,r14 + qn,conv
= 0.065 + = 2.60 kW
Evaporator, Section m
o + 0.173 + 2.36 kW
Ta calculate Radiation and Convection in the evaporator. first we must caIculate the other
temperature of the outside pipe,
Conduction: As a first estimate, let us assume the inside wall temperature to be that of the
sodium vapour. The heat conducted through the walls of the cylinder and the bottom, in the
evaporator section equals the heat dissipated by sections 1 and II.
21CkL(T -T} VA =2600= W i +_AJ'l_(T -T)
qT m(r Jr.} ~x w •
kss(20%cr, 15%NI) = 15 W/moC
25.1 = Tw - 915
113

r
2x(lS)(.3)(Tw -915) lS(7.86xlO-4)(Tw -915) 2~ +----------------
In(.0165/.0125) .00625
T = 940°C w
This value is lower than what it should be as a gradient must exist between the inner wall and
the sodium for the heat to be transported away by the sodium. A 10 oC gradient assumption will
be made. Therefore, Tw = 25.1 + (915 + 10) = 950 oC
Radiation:
We must calculate the radiation leaving the furnace walls, then calculate the fraction of this
absorbed by the lance.
The walls are fireclay brick with EF= 0.75 (Holman)
:. qFum.."lpe = O'EFAFFF-.p,pc(TF4 - Tp,pc4)
we know that, AFFF-.p,pe = Ap,peFp,pe-f
Ap,pe(l) = AFFp,<op,pc
<lF-.pIPC = O'EFAp,pc(14734 - 12234)
= 5.667 X 1O.8(.75)(2?r(.0165)(.3»(l4734 - 12234
)
= 1.322 X 10.9 (2.47 X 10¹²)
= 3265.8 Watts
According to Kirchoff's law, the absorptivity of a surface equals its emissivity which equals 0.8
for the stainless steel pipe.
then qllllOPIPC = 3265.8 (.9)
= 2939.2 W
This value is subject to the accuracy of the emmisivity of the fireclay brick. Emissivities for
brick material vary immensely From one type to another. Changing the emissivity value from
.75 to .7 results in a incident heat tlux of 3048 W. This changes the 'lmloPlpe to 2743, which
agrees better with the 2600 W of heat dissipated by the lance, calculated in the previous section.
If the gradient of lO oC is raised to 20 oC, this further improves the agreement as the QmIO pipe
becomes 2661 W. A 20 oC gradient from the inner wall of the pipe to the sodium vapor gives
us a T w.II.OUI of 9600C in a 12000C environ ment. This implies that the heat pipe injection lance
114

is able to main tain a temperature 240 oC below the radiative temperature it is subject to.
Calculation of the Working Substance Flowrates
Once at steady state, the heat is removed from the evaporator, through the heat of vaporization
of the sodium, where:
q = dm/dt hr• where dm/dt = pA~,vnutd hr• = 4636437.26 - 180.817 T J/kg (C.R.C)
@ 915 oc hr• = 4422 J/g
dmldt = 2.6 kIls (1/4.422 g/kJ)
dm/dt = 0.59 gis
Now, dm/dt = pA~svnuld
and Vnuld = dm/dt(l/(PN.A~J)
where, Axa = annulus cross section of the lance
= fi. 2 _ r 2 I.Op 0.1 p.
= '7f'(.0127)2 - '11'(.003175)2
= 4.75 X 10"" m2
PVlpour = PV/RT mol/ml
Pvapour = 1.43 x 101.3 x 103/(8.314 x 1188)
= 14.66 mol/m3
VVIp{"AJr = .59/(23 x 14.66 x 4.75 x 11106)
= 368 cmls
VVIPI*r = 3.68 mIs
To estimate the condensate velocity we must first calculate a film thickness. Using the same
equation as in Appendix B:
115
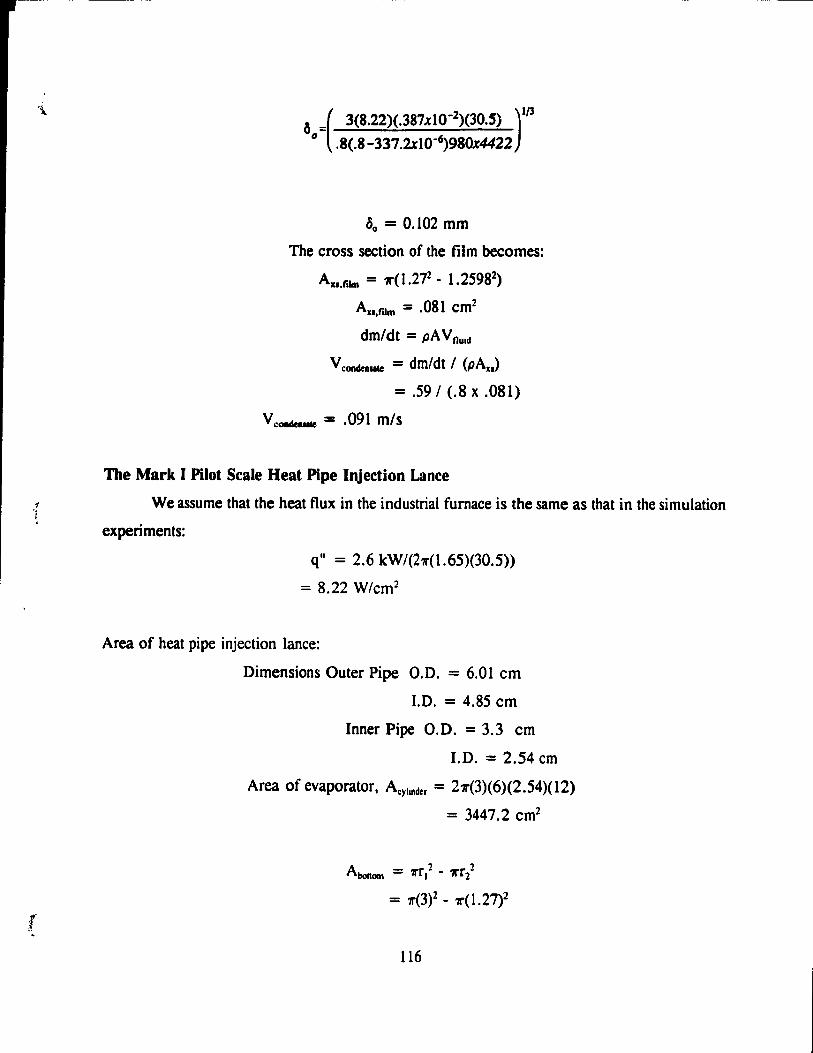
6 =( 3(8.22)(.387xl0-2)(30.5) )1/3 o .8(.8 -337 . 2.% 1O-6)980x4422
Ôo = 0.102 mm
The cross section of the film becomes:
Au.film = 11'(1.272 - 1.25982
)
AX1•fibn = .081 cm2
dm/dt = pA V nUld
Vconden .. 1e = dm/dt / (pAu)
= .591 (.8 x .081)
VCoadcmale = .091 mis
The Mark 1 Pilot Scale Heat Pipe Injection Lance
We assume that the heat flux in the industrial furnace is the same as that in the simulation
experiments:
q" = 2.6 kW/(211'(1.65)(30.5»
= 8.22 W/cm 2
Area of heat pipe injection lance:
Dimensions Outer Pipe O.D. = 6.01 cm
LD. = 4.85 cm
Inner Pipe 0.0. = 3.3 cm
LD. = 2.54 cm
Area of evaporator, Acyhnder = 271'(3)(6)(2.54)(12)
= 3447.2 cm2
116
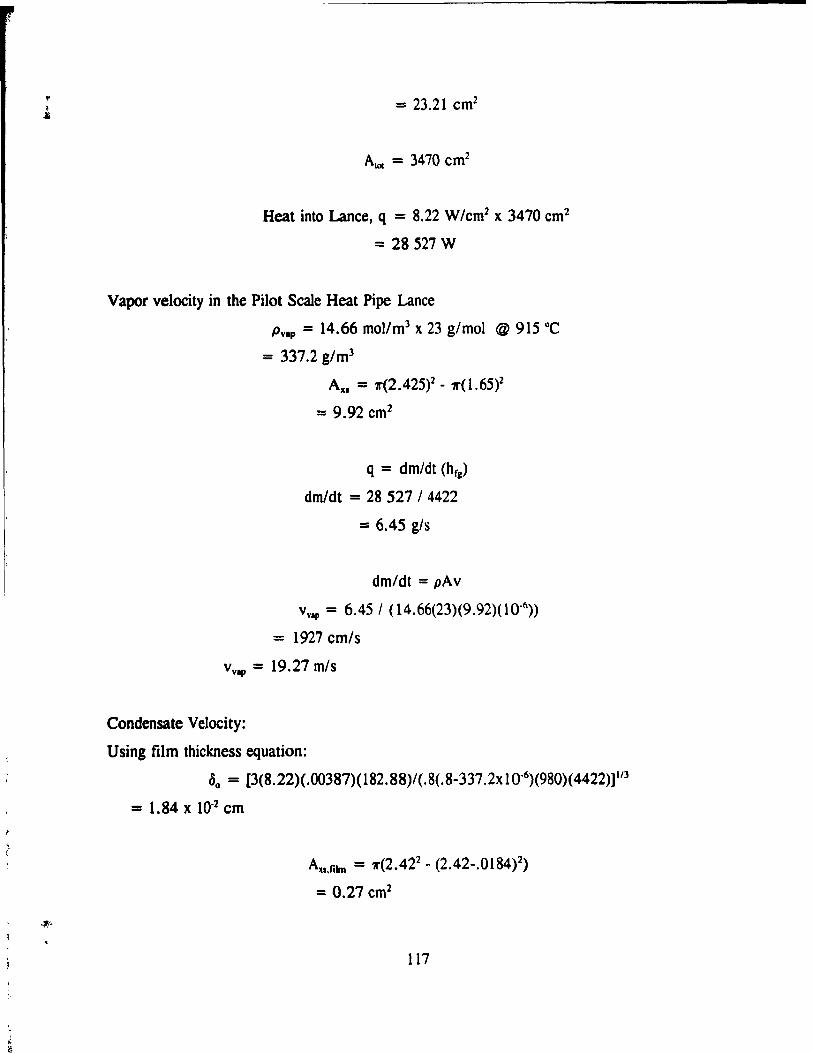
= 23.21 cm2
Reat into Lance, q = 8.22 W/cm2 x 3470 cm2
= 28527 W
Vapor velocity in the Pilot Scale Reat Pipe Lance
Pvap = 14.66 mol/mJ x 23 g/mol @ 915 oC
= 337.2 g/mJ
Ax, = '/1'(2.425)2 - 1r(1.65)2
= 9.92 cm2
q = dm/dt (hr,)
dm/dt = 28 527 / 4422
= 6.45 gis
dm/dt = pAv
vyap = 6.45 1 (14.66(23)(9.92)(10-6»
= 1927 cm/s
vy1p = 19.27 mis
Condensate Velocity:
Using film thickness equation:
50 = [3(8.22)(.OO387)(l82.88)/(.8(.8-337.2xlO-6)(980)(4422)]"J
= 1.84 X 10⁻² cm
A ... libn = '/1'(2.422 - (2.42-.0184)2)
= 0.27 cm2
117

(
(
dm/dt = pAv
VCondenule = dm/dt/(pAx •. fimJ
= 6.45 / [(.8)(.27)]
Vc--..c = 29.86 cm/s
118

References
1. Gaugler, R.S. Beat TransCer Deviee. US Patent 2350348, Published 6 June, 1944.
2. Grover,G.M. Evaporation-Condensation heat transfer device. US Patent 3229759. Published 18 January, 1966.
3. Feldman, K.T., and Whiting, G.H. The Beat Pipe and its Application. Engrs. Dig., London, vo1.28, No.3, pp 86-96, 1967.
4. Eastman, G.Y. The Heat Pipe. Scientific American, vol. 218, No.5, pp38-46, 1968.
S. Feldman, K.T., and Whiting, G.H. Application of the Heat Pipe. Mech. Engng., Nov., Vo1.90, pp 48-53, 1963
6. Chi, S. W., Beat Pipe Theory and Practice: A Sourcebook. Hemisphere Publishing Corporation, U.S.A., 1976.
7. Feros Patenter Aktiebolaget FR-PS 2,507,290 .
.jO 8. Ying Manufacturing Corp. US-PS 4,184,477.
9. Levenspiel, 0, and Chan, R. T. US-PS 4,408,656.
10. Daimler-Benz AG DE-PS 2,839,365.
Il. Institut de Recherches de la Siderurgie Francaise (IRSID) FR .. ps 2,520,101.
12. Elderfield, R. US PS 4,398,703 UK PS 8,013,470
13. Nagano,T. Progress of Copper Sulfide Continuous Smelting, Phys. Chem. Of Ext. Met., Met. Soc. AIME. Warrendale, P.A., 1985 pp 311-326.
14. Shibasaki, T., and Hayashi, H. Top-Blown Injection Smelting and Converting: The Mitsubishi Process. JOM, September 1991, pp 20-26.
15. Sweetin, R.M., Newman, C.I., and Storey, A.G. Start-Up of the Kidd Smelter: Early Operating Results. JOM, October 1983, pp36-41.
16. Kimura, E. Fundamental Research of Lancing Mechanism in Mitsubishi Continuous Smelting Furnace, Trans.
119

17. Moto Goto, The Mitsubishi Continuous Process: Operation and Design, Mitsubishi Metal Corporation, Tokyo, Japan, February 1988.
18. Incropera, F.P., and De Witt, D. P. Fundamentals of Heat and Mass Transfer, Third Edition, John Wileyand Sons, U.S.A., 1990.
19. Griffith, P., and Wallis, J.D. The Role of Surface Conditions in Nucleate BoiJing. ASMEAIChE Heat Transfer Conference, August 1959.
20. Negishi, K., and Sawada, T. Heat Transfer Perfonnanee of an Inclined Two-Phase Closed Thennosyphon. Int. J. Heat Mass Transfer. Vol 26 No 8, 1983, pp 1207-1213.
21. Neda, T., Miyashita, P. Heat Transport Characteristics of a Closed Two-Phase Thennosyphon. JSME, Series II, Vol 32, No.2, 1989.
22. Basiulus, A., Prager, R.C., Lamp, T.R. Compatibility and Reliability of Heat r'ipe Materials. Hughes Aircraft Company. Electron Dynamics Division, Torrance Califomia, USA.
23. Fukano, T., Kadoguchi, K., Tien, C. Oscillation Phenomena and Operating Limits ofthe closed Two-Phase Thennosyphon. Proceedings of the Eigth International Heat Transfer Conference. California, USA., 1986, pp 2325-2330.
24. Faghri, A., Parvani, S. Numerical Analysis of Laminar Flow in a Double-Walled Annular Heat Pipe. J. Thermophysics. Vol 2, No 2, April 1988. pp 165-171.
25. Faghri, A., Chen, M. A numerieal Analysis of the Effcets of Conjugate Heat Transfer, Vapour Compressibility and Viscous Dissipation in Heat Pipes. Numerical Heat Transfer, Part A, Vol. 16, 1989, pp 389-405.
26. Faghri, A., Thomas, S. Performance Characteristics Of a Concentric Annular Heat Pipe: Part I-Experimental Prediction and Analysis of the Capillary Limit. Transactions of the ASME, Vol Ill, November 1989, pp 844-850.
27. Faghri, A. Perfonnance Characteristics of a Concentric Annular Heat Pipe: Part 11-Vapour Flow Analysis. Journal of Heat Transfer, November 1989, Vol Ill, pp 851-857.
28. Faghri, A., Chen, M.M., Morgan, M. Heat Transfer Characteristies in Two-Phase Closed Conventional and Concentric Annular Thennosyphons. Journal ofHeat Transfer, Vol. 111, August 1989, pp 611-6]8.
29. Faghri, A., et al. Mathematical Modeling and Analysis of Heat Pipe Start-Up from the Frozen State. Transactions of the ASME, Vol 112, August 1990, pp 586-594.
30. Ivanovsky, M.N., Subbotin, V.L, et al. Investigation of Heat Transfer Capillary Limit in Sodium Heat Pipes. International Heat Pipe Conference. Bologna, 1976, pp 733-739.
120

1l" _.' 31. Fukano, T., Chen, S.J., and Tien, C.L. Oscillation Phenomena and Operating Limits of the Closed Two-Phase Thermosyphon. Proc. ASME/JSME Thermal Engineering Conference, Vol. 1, 1983, pp. 95-101.
32. Dobran, F. Steady-State Characteristics and Stability Thresholds of a Closed Two-Phase Thermosyphon. Int. J. Heat Mass Transfer., Vol 28, No.5., 1985, pp 949-957.
33. Dobran, F. Suppression of the Sonic Heat Transfer Limit in High-Temperature Heat Pipes. Journal of Heat Transfer, Vol 111, August 1989, pp 605-610.
34. Negishi, K., and Sawada, T. Heat Transfer Performance of an Inclined Two-Phase Closed Thermosyphon. Int. J. Heat and Mass Transfer, Vol. 26, No. 8, 1983, pp. 1207-1213.
35. Bahadori, M.N. Control of Solidification Rate by Application of Heat Pipe Principle. Cast Metals Research Journal, Vo1.6, No.l, March 1970, p. 38.
36. Zuzanak, A. Control of Solidification Rate by Application of Heat Pipe. AFS Transactions 89-69, pp 1035-1037.
37. Zuzak et al. Heat Pipe: An Active Chili in the Thermal Steel Casting Sand Mold System. AFS Transactions 90-20, pp 559-563.
38. Wells, K.J., Berry, J. T. Two Dimensional Numerical Simulation of Casting Solidification With Heat Pipe Controlled Boundary Conditions. AFS Transactions, 84-95. pp 429-434.
39. Choi, H.C. Techniques for the Continuous Measurement of Melt Temperature Ph.D. thesis, McGill University, Montreal, Canada. 1991.
40. Buontempo, S., et al. The Heat Pipe. Undergraduate Report for Mech Laboratory Il, McGill University, 1991.
41. Dunn, P.D., Reay, D.A. Heat Pipes. Pergamon Press, 1982.
42. Holman, J .P. Heat Transfer (Firth Edition). McGraw-Hill, New York, 1981.
121


