The Harsh Realities of Phone Distraction
50
The Harsh Realities of Phone Distraction The U.S. is ill-equipped to address this slow-moving disaster and needs smarter solutions. A DATA-DRIVEN ANALYSIS FROM CAMBRIDGE MOBILE TELEMATICS
Transcript of The Harsh Realities of Phone Distraction

Executive Summary
1
The Harsh Realities of Phone Distraction
The U.S. is ill-equipped to address this slow-moving disaster and needs smarter solutions.
A DATA-DRIVEN ANALYSIS FROM CAMBRIDGE MOBILE TELEMATICS

Table of Contents
4 Preface
5 Authors
6 Executive Summary
47 Conclusion & Recommendations
49 References
Road Deaths in the US and Official Explanations1. NUMBER OF ROAD DEATHS PER YEAR
2. PEDESTRIAN AND CYCLIST DEATHS ON THE RISE
3. WHAT IS DISTRACTION?
4. THE SECONDARY IMPACTS OF DISTRACTION
Distraction in the US: Official Measurements1. HOW PHONE USAGE WHILE DRIVING IS MEASURED TODAY
2. HOW CRASH CAUSALITY IS COMMUNICATED TODAY
Distraction in the US: Telematics Measurements1. METHODOLOGY TO MEASURE DISTRACTION
2. CMT’S RESPONSE TO OFFICIAL MEASUREMENTS
1010
12
14
15
1717
18
1919
21
PART I Introduction to a Slow-Moving Disaster
Traditional Methods of Curbing Phone Distractionhave been Ineffective
1. PREVIOUS PUBLIC MESSAGING AND AWARENESS CAMPAIGNS
2. HANDS-FREE LAWS HAVE FOUND MIXED SUCCESS
3. LAWS ARE LESS IMPACTFUL WITHOUT ADDITIONAL INCENTIVES
Telematics Provides Incentives for Improvement Public-Private Telematics Technology Partnerships
2324
25
28
2830
PART II Curbing Distraction Effectively by Creating the Right Incentives
Changing Distracted Driving Behavior1. APPROACHING INDIVIDUAL DISTRACTION
2. FINDING THE RIGHT MOTIVATION
3. REWARDS VS. MOTIVATION
Creating Long-Term Behavior ChangeForecasting the Impact of Distraction
1. IDENTIFYING CRASHES LINKED TO DISTRACTION
2. FORECASTING MONETARY LOSSES
3434
35
39
404243
45
PART III Wide-Scale Behavior Change Requires Individual Solutions
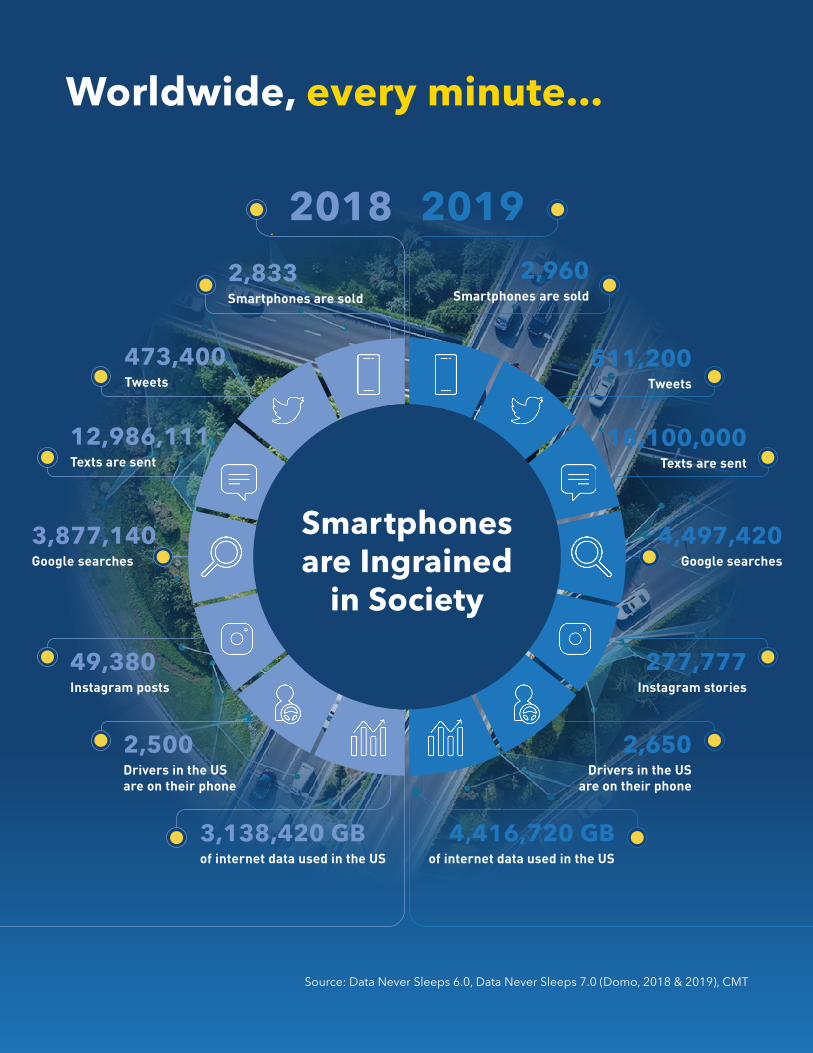
Worldwide, every minute...
2018 20192,833Smartphones are sold
2,960Smartphones are sold
3,138,420 GBof internet data used in the US
2,500Drivers in the US are on their phone
511,200Tweets
473,400Tweets
12,986,111Texts are sent
18,100,000Texts are sent
277,777Instagram stories
2,650Drivers in the US
are on their phone
4,416,720 GBof internet data used in the US
49,380Instagram posts
3,877,140Google searches
4,497,420Google searches
Smartphones are Ingrained
in Society
Source: Data Never Sleeps 6.0, Data Never Sleeps 7.0 (Domo, 2018 & 2019), CMT
4
Preface
Ryan McMahonVP, Insurance & Government AffairsCambridge Mobile Telematics [email protected] +1 (617) 751-4141
Mobile phones are ubiquitous in modern society. Previous studies have noted both positive and negative effects of this phenomenon, including an increase in independence and entrepreneurship, but also an increased isolation and reduction in attention spans.
This report studies an impact that has not received the attention it requires: the significant effect that phone use while operating a motor vehicle has on road safety, known as distracted driving.
There are several sources of statistical data on phone distraction and its impact on crashes in the United States. In this report we show that sources are vastly underreporting the prevalence and scope of phone-based distracted driving due in large part to data collection limitations.
In the last five years, Cambridge Mobile Telematics (CMT) has gathered anonymized data on hundreds of billions of miles driven throughout the U.S. using our smartphone-based telematics program. This data shows that the level of phone distraction that is being widely reported fails to accurately present the scope of the problem and therefore may be preventing decisive action on the issue.
This concerning trend has been made even more clear during the COVID-19 pandemic. While millions of people were home and traveling far less, our data shows phone distraction per mile of driving became even more frequent during the lockdown.
Distracted driving is a modern problem that needs a modern solution, and that begins with the methodology used to identify and report on the issue. In this report, CMT will:
• Reveal the discrepancy between prior statistics and ground- truth measurements provided through modern technological solutions
• Compare past successes in changing road behavior to current efforts and define the opportunities to generate sustained improvements
• Suggest long-term solutions that outperform state-wide law changes and nationwide communication campaigns
We hope this report will serve as a reference point to stakeholders involved in road safety. We look forward to working together with them to take on the problem.

Authors
5
Sam is a professor of computer science at MIT and the Director of the MIT Systems That Learn Initiative. He is known for contributions to the field of database systems, including widely-cited papers on managing sensor
data, column-oriented databases, and databases-as-a-service. He was a co-founder of Vertica (acquired by HP). Sam Madden Founder & Chief [email protected]
Ian Murphy Director of Marketing & Communication
Rachel Villari Marketing & Communications Manager
Thomas Hallauer Director of Research & Marketing
Cambridge Mobile Telematics (CMT) was founded in 2010 in Cambridge, MA based on a project from MIT that developed a mobile sensing system to collect and draw inferences from sensor data on mobile devices called CarTel. Since then, the company has continued to innovate with phone distraction measurements, mobile-based connected insurance, novel hardware solutions, and real time crash and roadside assistance alerts. It is currently the largest mobile telematics provider and operates in more than 25 countries with over 6.5 million users.
A key to CMT’s success is that it brings together experts from the insurance and telematics worlds, with leaders from the fields of claims handling, actuarial science, IoT engineering, and data science. This report was built by those teams under the guidance of Sam Madden, Co-Founder and Chief Scientist, and published by the Marketing and Communications groups under the guidance of Ryan McMahon, Vice President of Insurance and Government Affairs.
Ryan’s background has taken him to the heart of road safety issues. He volunteered as an EMT while a student at the State University of New York at Potsdam, and after graduating he entered the insurance industry where his first position was helping people recover after a crash as a claims adjuster. Within the industry, Ryan worked in multiple positions including helping to introduce the first telematics-based system in the U.S. that rewarded drivers for safe behaviors. At CMT, Ryan’s focus is on delivering on the company’s mission to make the world’s roads and
drivers safer, supporting the company’s partners and stakeholders around the globe. Ryan holds an MBA from Worcester Polytechnic University. Ryan McMahon Vice President of Insurance & Government Affairs [email protected] | +1 (617) 751-4141
Executive Summary
6
Our society has been slow to respond because of the lack of reliable data• Today’s crash reports are generally on target but are inadequate
and incomplete due to their inability to accurately record distraction. States in the U.S. use different definitions to report on crash causation and many do not include distraction as a possible cause.
• The National Highway and Transportation Safety Agency (NHTSA) is the only source of data available to most states and industry associations. Currently, its distraction data collection methodology is based on manual recording and therefore incomplete, as well as biased towards low-speed phone distraction.
• American laws are inconsistent on which behaviors are prohibited and who they affect.
• NHTSA data is often misquoted, blurring the lines between non- phone-based distraction (e.g., eating or looking at a passenger) and phone-based distraction.
As a result, today’s response is inadequate• No U.S. state has a full ban on cell phone use while driving. The
laws are new, they differ from state to state, and they are difficult to implement because the offense can be difficult to observe. Tickets are rare, averaging only 700 fines per year per 100,000 licensed drivers in 2018.
• The funding and tools necessary to combat distracted driving rely heavily on data. The data available is limited due to current collection methods; with more complete and accurate data, authorities may be able to generate a more effective response.
• Interventions such as education and enforcement have only produced temporary improvements in driver behavior.
• However, a significant subset of drivers that frequently use telematics change their behavior for the long term after stricter laws go into effect.

7EXECUTIVE SUMMARY
Distracted driving needs to be redefined• The impact of phone distraction on crash risk continues after
the distraction event ends. CMT calls it “the distraction hangover.” In some cases it can be more dangerous than the distraction period itself, but it is always more dangerous than phone distraction free driving
• Drivers are 70% more at risk 10 seconds after phone distraction has ended than during normal, distraction free driving.
Telematics refines the statistics by focusing on the mobile phone-specific distraction• In 2019, 37% of car trips involved at least 20 seconds of cumulative
phone distraction. During daytime hours, that number rose to 41%.
• When looking at the average number of distractions per 100 miles, distraction has increased by 15% in three years across the U.S.
CMT’s data highlights limitations of traditional data gathering• NHTSA estimates that 9.7% of drivers are distracted at any given
time between 7 a.m. and 7 p.m. (NHTSA 2019). That figure, based on a technologically- constrained methodology, doesn’t accurately highlight the scope of the problem. The differences in the readings of the problem illustrate how new technology can help our understanding of phone distraction.
• A Virginia Tech Traffic Institute study of 3,500 drivers showed that 68.3% of car crashes involved some type of observable distraction, but was not limited to phone distraction.
• CMT’s analysis of crashes from claims data shows at least 19% were attributable to phone-based distraction.
Reducing phone distraction can save thousands of lives• Smartphone ownership and use in the U.S. are at a record high.
As a result CMT expects that by 2025, 4,000 people per year will lose their life from smartphone distraction-related crashes.
• By that time, 500,000 crashes will be associated directly with smartphone distraction.

8
In 2009 Webster selected “distracted driving” as its Word of the Year, reflecting the reality that our compulsion for using our phones, even when driving, came at a terrible cost. Millions of us have been injured and tens of thousands of us have been killed since then, according to NHTSA data. That data has long struggled to reveal the true level of danger this represents on our roads;that is where CMT’s “Harsh Realities of Phone Distraction” report begins.
CMT provides telematics data and analytics to insurance companies, mobile carriers and OEMs across the U.S. through its DriveWell platform. CMT states that its analysis of 54 million trips recorded in 2019 indicated that “37% of all trips involved significant driver phone distraction,” and that based on insurance claims data “19% of crashes were attributable to phone-based distraction.” These numbers are far greater than those offered by state and national traffic safety organizations. In this report CMT argues that we do not yet fully understand the extent of the distracted driving problem, which is far worse than generally believed.
There is probably not much disagreement that despite well-funded private and governmental efforts, we have not significantly decreased distracted driving crashes since 2009. Following the death of my daughter, Casey, by a distracted driver in 2009, many of EndDD.org’s (End Distracted Driving) educational efforts did not seem to be effective. As a result, we’ve shifted our efforts to focus on new ways to connect with drivers, to cause self-reflection about driving behaviors, and ultimately to compel drivers to choose to drive without phone distraction.
CMT believes that telematics, and specifically its approach of integrating behavioral science into the DriveWell app to incentivize drivers to put their phones down while driving, is a vast improvement over existing approaches to reduce distracted driving. The data provided is encouraging and should be analyzed by others so that its approach, once verified, can be more widely used.
“The Harsh Realities of Phone Distraction” is a comprehensive 46-page report that is a welcome addition to the discussion about distracted driving and should be read and scrutinized by all who are interested in reducing deaths, injuries, and crashes caused by distracted driving.
EndDD.org works to raise awareness of the dangers of distracted driving through educating teens, college students, and adults through interactive and science-based presentations developed with the help of the Children’s Hospital in Philadelphia.
Support from Road Safety Advocates
Joel Feldman Founder of EndDD.org (End Distracted Driving)

9
Distracted driving has changed my life forever. In 2011, ‘distracted driving’ was a new term to me and my family, when I got the call in the middle of the night to tell me that my dad had been killed. A driver made the choice to program her GPS while driving, and my dad, who was pulled over on the side of the road, was killed instantly. Next April, it will be 10 years since my dad was killed, just as we roll out Distracted Driving Awareness Month. My children were never able to meet their grandpa, and it’s painful every day to recognize what was taken from them, as well as all the joys, hugs, and precious moments that were stolen from my dad.
As I and hundreds of other advocates work to educate drivers about distracted driving and how looking away from the road for just one second can change so many lives instantly, we understand how enormous the problem is, and that we can’t do it alone. We need enforcement, we need community engagement, and we need more data to show how commonplace this behavior is. We are clearly addicted to our smart phones, and too many drivers are not making the right choice to put the phone away and on silent when they get in the car.
Cambridge Mobile Telematics has been doing the essential research that we need to demonstrate how enormous this problem is, and to show how we can effectively and creatively go about influencing drivers to hang up and focus on the road.
Distracted driving is a significant contributor to the annual worldwide toll of 1.35 million road fatalities. Daily news reports are replete with stories of distracted drivers striking children exiting school buses, pedestrians strolling on sidewalks, cyclists sharing the road, occupants of oncoming cars, police officers at road stops, and road crews in work zones.
Thanks to numerous efforts, public awareness of the threat posed by distracted driving is now widespread. However, distracted driving behavior has remained largely resistant to change, for several reasons:
• In today’s digital culture, there’s tremendous psychological resistance to disengaging from one’s social and business worlds while driving. Audible notifications--of incoming calls, texts, emails, and social media posts—exert a powerful “pull”, and few drivers take the step of silencing notifications while driving despite the ready availability of technology to do so.
• Many drivers have highly inflated beliefs about their skills at multitasking. They worry a lot about other drivers, but “I’m not the problem. I can handle it.”
• In contrast to drunk driving, the dominant social norm around distracted driving remains largely permissive. There is no stigma or sense of shame associated with it.
For these reasons, and others, laws prohibiting distracted driving have had limited success in changing driver behavior, and new approaches are urgently needed. Looking ahead, I see two promising avenues to pursue: creation of new kinds of incentives to strengthen compliance with laws against distracted driving; and development of large-scale campaigns to change the prevailing social norm around distracted driving. On the first, companies like Cambridge Mobile Telematics are creating innovative data-based solutions. On the second, the Harvard T.H. Chan School of Public Health is developing a large-scale campaign to change social norms, comparable to Harvard’s previous designated driver campaign that contributed to a 25% decline in U.S. drunk driving fatalities. The present study from Cambridge Mobile Telematics, highlighting the extent of smartphone involvement in the overall toll from distracted driving, provides an important corrective to previous understanding of the problem’s dimensions. It’s well worth a careful read.
Emily Stein President of the Safe Roads Alliance
Jay A. Winsten, Ph.D. Director, Strategic Media Initiatives, Harvard T.H. Chan School of Public Health

10PART I
Introduction to a Slow-Moving Disaster
10
Road Deaths in the US and Official Explanations1. NUMBER OF ROAD DEATHS PER YEAR
The most up-to-date data for distracted driving from the National Highway Traffic Safety Administration (NHTSA) is from 2018: it shows 36,560 lost their lives in road crashes that year. While this represents a 2.4% decrease compared to 2017, this is a short dip in the continuous increase in road deaths in the U.S. since 2011.
A 2019 report published by the International Transport Forum (ITF), part of the Organisation for Economic Co-operation and Development (OECD), helps put this into context. The ITF examines 41 countries to compile the International Road Traffic and Accident Database (IRTAD) to provide global road crash data and analyses. Most recently it found that road safety has improved in 33 countries between 2010 and 2017. In contrast, during the same period, road deaths in the U.S. have increased by 12.5%.
Of the countries evaluated, the U.S. is one of three in which road fatalities per 100,000 inhabitants is over 10. The worst is Argentina (12), followed by the U.S. (11.4) and Chile (10.4). Additionally, the number of car occupants killed in crashes has decreased in all countries since 2010, except in the U.S. where that number has increased by 7%. Pedestrian fatalities have skyrocketed by 38.9% (ITF: USA, 2019). Fig. 1: Percentage Change in the Number of Pedestrians Killed 2010-2017 (IRTAD, 2019)
PART I
Introduction to a Slow-Moving Disaster

11PART I – INTRODUCTION TO A SLOW-MOVING DISASTER
The IRTAD report shows other countries have adopted serious road safety analysis and improvement measures, and the US is lagging behind. CMT believes that the integration of new telematics-based technology can help the U.S. get caught up, and help many European countries better address the growing issue of phone distraction, reducing the number of preventable crashes globally.
Dangerous roads are costing Americans millions of dollars. In a 2015 report, NHTSA estimated the economic cost of traffic crashes totaled $242 billion USD in 2010. Since then, annual road fatalities have risen by 14%.
The cost of human life is also staggering: 36,560 PEOPLE LOST THEIR LIFE IN TRAFFIC CRASHES IN 2018. With respect to causality, NHTSA reported:
NHTSA’s definition of driver distraction goes way beyond mobile phone use. It includes – as illustration – day-dreaming, moving pets or insects, sneezing, adjusting climate controls, as well as “carelessness.”
NHTSA records that only 1% of fatal vehicle crashes were affected by phone-based distraction. It notes that distracted driving as a whole may be significantly underestimated as a contributing crash factor since verifying that kind of distraction is challenging for on-scene law enforcement officers completing crash reports (NHTSA, 2020).
CMT believes this attribution of deaths to phone-based distraction is vastly underreporting the problem. As demonstrated in this report, the methods used by NHTSA are not sufficient to judge the amount of distraction happening on the roads; data from driver surveys, the Virginia Tech Transportation Institute (VTTI), and telematics data gathered by CMT show that significantly more distracted driving via phone use is happening on our roads.
One symptom of this underreporting is the fact that pedestrian and cyclist deaths have begun to rise sharply over the last several years, even as the total number of road fatalities have dipped.
An estimated 400,000 people were injured in crashes involving distracted driving.
2,841 people were killed in crashes involving distracted drivers
9,148 people were killed in speed-related crashes
10,511 people were killed in crashes involving alcohol impairment
Out of that only 385 were attributed to phone use and of those 2,841 people, 400 of the victims were pedestrians
12PART I – INTRODUCTION TO A SLOW-MOVING DISASTER
2. PEDESTRIAN AND CYCLIST DEATHS ON THE RISE
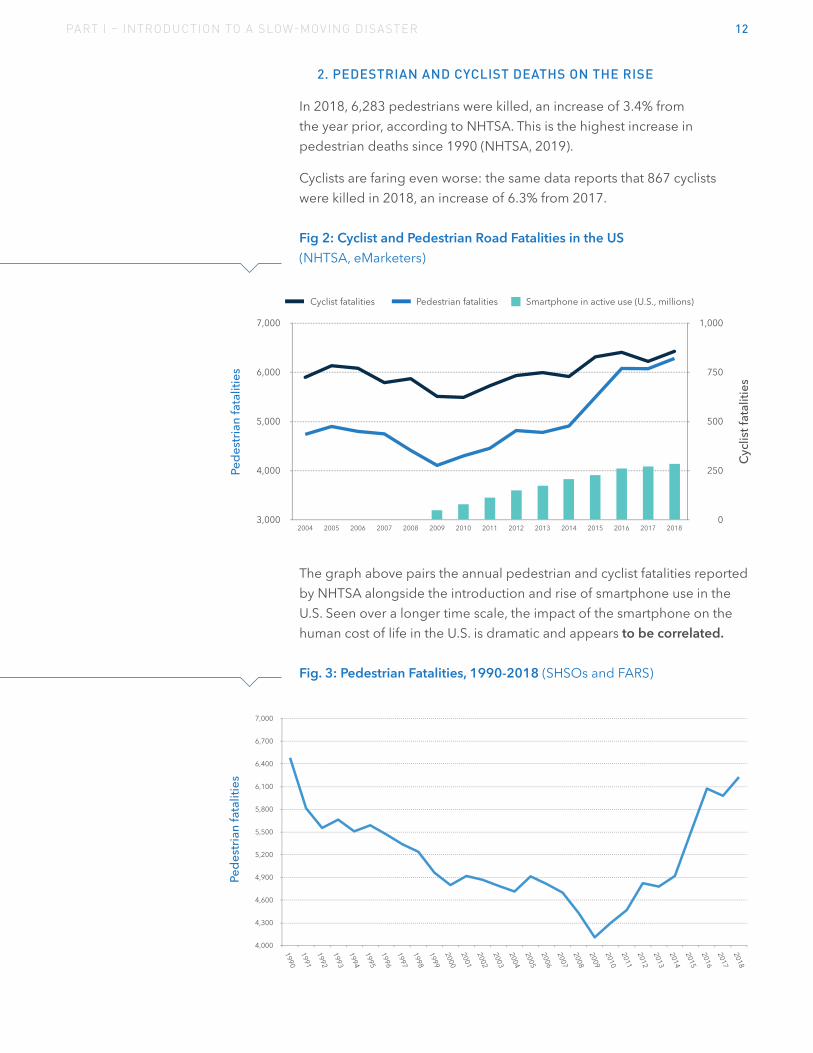
In 2018, 6,283 pedestrians were killed, an increase of 3.4% from the year prior, according to NHTSA. This is the highest increase in pedestrian deaths since 1990 (NHTSA, 2019).
Cyclists are faring even worse: the same data reports that 867 cyclists were killed in 2018, an increase of 6.3% from 2017. Fig 2: Cyclist and Pedestrian Road Fatalities in the US (NHTSA, eMarketers)
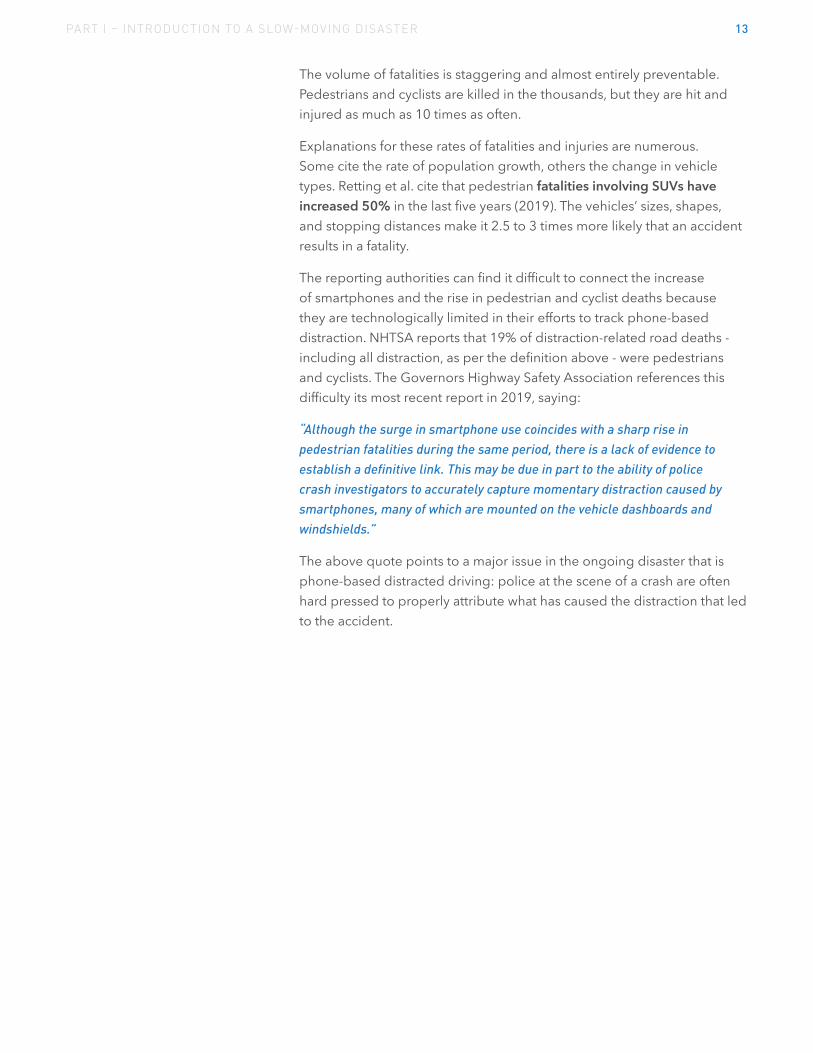
The graph above pairs the annual pedestrian and cyclist fatalities reported by NHTSA alongside the introduction and rise of smartphone use in the U.S. Seen over a longer time scale, the impact of the smartphone on the human cost of life in the U.S. is dramatic and appears to be correlated. Fig. 3: Pedestrian Fatalities, 1990-2018 (SHSOs and FARS)
13PART I – INTRODUCTION TO A SLOW-MOVING DISASTER
The volume of fatalities is staggering and almost entirely preventable. Pedestrians and cyclists are killed in the thousands, but they are hit and injured as much as 10 times as often.
Explanations for these rates of fatalities and injuries are numerous. Some cite the rate of population growth, others the change in vehicle types. Retting et al. cite that pedestrian fatalities involving SUVs have increased 50% in the last five years (2019). The vehicles’ sizes, shapes, and stopping distances make it 2.5 to 3 times more likely that an accident results in a fatality.
The reporting authorities can find it difficult to connect the increase of smartphones and the rise in pedestrian and cyclist deaths because they are technologically limited in their efforts to track phone-based distraction. NHTSA reports that 19% of distraction-related road deaths - including all distraction, as per the definition above - were pedestrians and cyclists. The Governors Highway Safety Association references this difficulty its most recent report in 2019, saying:
“Although the surge in smartphone use coincides with a sharp rise in pedestrian fatalities during the same period, there is a lack of evidence to establish a definitive link. This may be due in part to the ability of police crash investigators to accurately capture momentary distraction caused by smartphones, many of which are mounted on the vehicle dashboards and windshields.”
The above quote points to a major issue in the ongoing disaster that is phone-based distracted driving: police at the scene of a crash are often hard pressed to properly attribute what has caused the distraction that led to the accident.
14PART I – INTRODUCTION TO A SLOW-MOVING DISASTER
3. WHAT IS DISTRACTION?
The definition of distraction is a debate in itself. What should be included as distraction and are there different levels of risk attached to each activity?
For the U.S. authorities, distraction is a specific type of inattention that occurs when drivers divert their attention from the task of driving to focus on another activity instead. NHTSA includes an array of actions deemed to be distracting in its definition, as noted above.
VTTI published a study in 2015 based on a three-year monitoring period of 3,542 participants with mounted dashboard cameras (dash-cams) which lead to the capture of 905 injurious and property damages crashes.
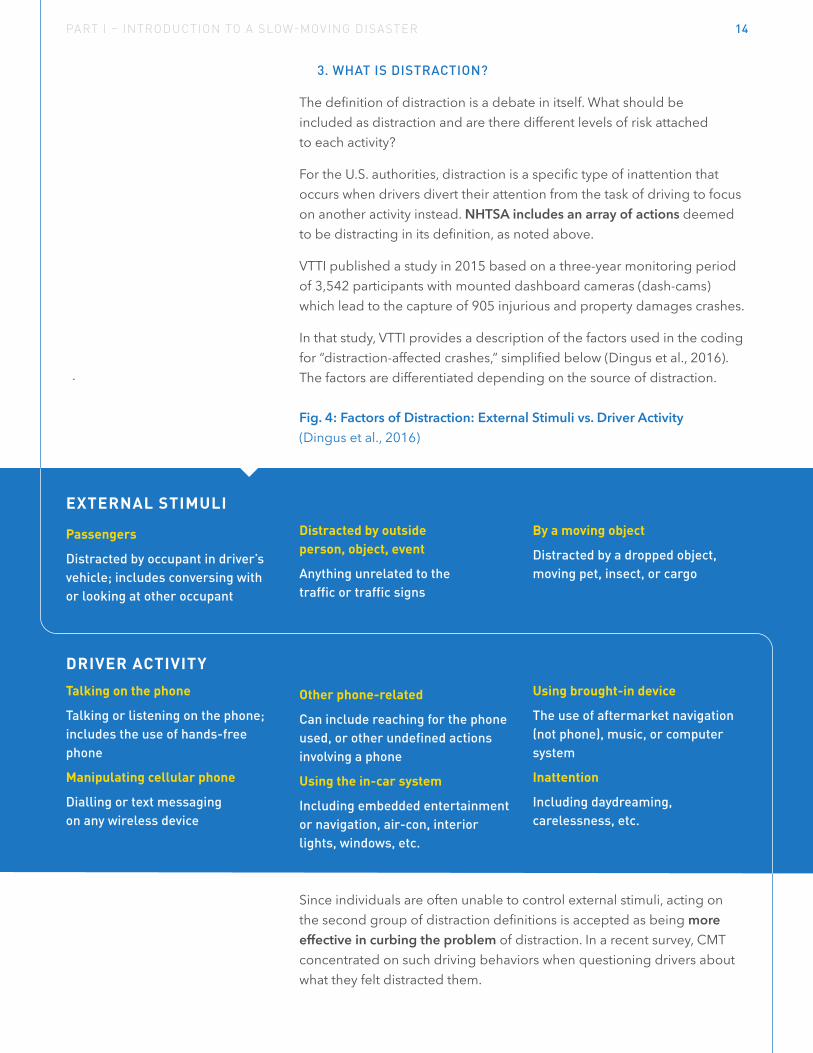
In that study, VTTI provides a description of the factors used in the coding for “distraction-affected crashes,” simplified below (Dingus et al., 2016). The factors are differentiated depending on the source of distraction. Fig. 4: Factors of Distraction: External Stimuli vs. Driver Activity (Dingus et al., 2016)
Since individuals are often unable to control external stimuli, acting on the second group of distraction definitions is accepted as being more effective in curbing the problem of distraction. In a recent survey, CMT concentrated on such driving behaviors when questioning drivers about what they felt distracted them.
Passengers
Distracted by occupant in driver’s vehicle; includes conversing with or looking at other occupant
Distracted by outside person, object, event
Anything unrelated to the traffic or traffic signs
By a moving object
Distracted by a dropped object, moving pet, insect, or cargo
Talking on the phone
Talking or listening on the phone; includes the use of hands-free phone
Manipulating cellular phone
Dialling or text messaging on any wireless device
Other phone-related
Can include reaching for the phone used, or other undefined actions involving a phone
Using the in-car system
Including embedded entertainment or navigation, air-con, interior lights, windows, etc.
Using brought-in device
The use of aftermarket navigation (not phone), music, or computer system
Inattention
Including daydreaming, carelessness, etc.
EXTERNAL STIMULI
DRIVER ACTIVITY
15PART I – INTRODUCTION TO A SLOW-MOVING DISASTER
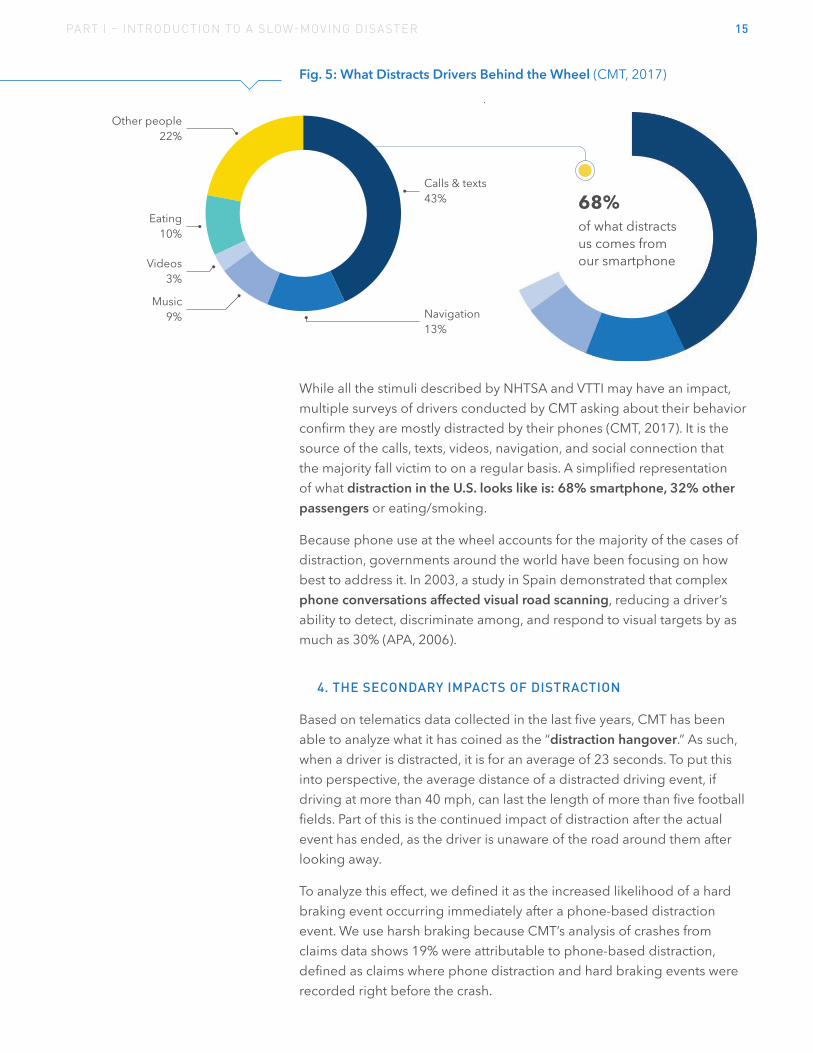
While all the stimuli described by NHTSA and VTTI may have an impact, multiple surveys of drivers conducted by CMT asking about their behavior confirm they are mostly distracted by their phones (CMT, 2017). It is the source of the calls, texts, videos, navigation, and social connection that the majority fall victim to on a regular basis. A simplified representation of what distraction in the U.S. looks like is: 68% smartphone, 32% other passengers or eating/smoking.
Because phone use at the wheel accounts for the majority of the cases of distraction, governments around the world have been focusing on how best to address it. In 2003, a study in Spain demonstrated that complex phone conversations affected visual road scanning, reducing a driver’s ability to detect, discriminate among, and respond to visual targets by as much as 30% (APA, 2006).
4. THE SECONDARY IMPACTS OF DISTRACTION
Based on telematics data collected in the last five years, CMT has been able to analyze what it has coined as the “distraction hangover.” As such, when a driver is distracted, it is for an average of 23 seconds. To put this into perspective, the average distance of a distracted driving event, if driving at more than 40 mph, can last the length of more than five football fields. Part of this is the continued impact of distraction after the actual event has ended, as the driver is unaware of the road around them after looking away.
To analyze this effect, we defined it as the increased likelihood of a hard braking event occurring immediately after a phone-based distraction event. We use harsh braking because CMT’s analysis of crashes from claims data shows 19% were attributable to phone-based distraction, defined as claims where phone distraction and hard braking events were recorded right before the crash.
Fig. 5: What Distracts Drivers Behind the Wheel (CMT, 2017)
16PART I – INTRODUCTION TO A SLOW-MOVING DISASTER
CMT measures four types of phone-based distraction events:
• Screen Interaction, such as texting, scrolling, or swiping• Phone Motion, any kind of manipulating or reading of the phone• Phone Calls (not including hands-free), or • A combination of any type of phone distraction
(multiple types of distraction can occur within the drive)
The analysis of millions of trips and the patterns of distractions revealed suggest that the duration of the hangover period and the severity of its impact varies depending on the type of distraction.
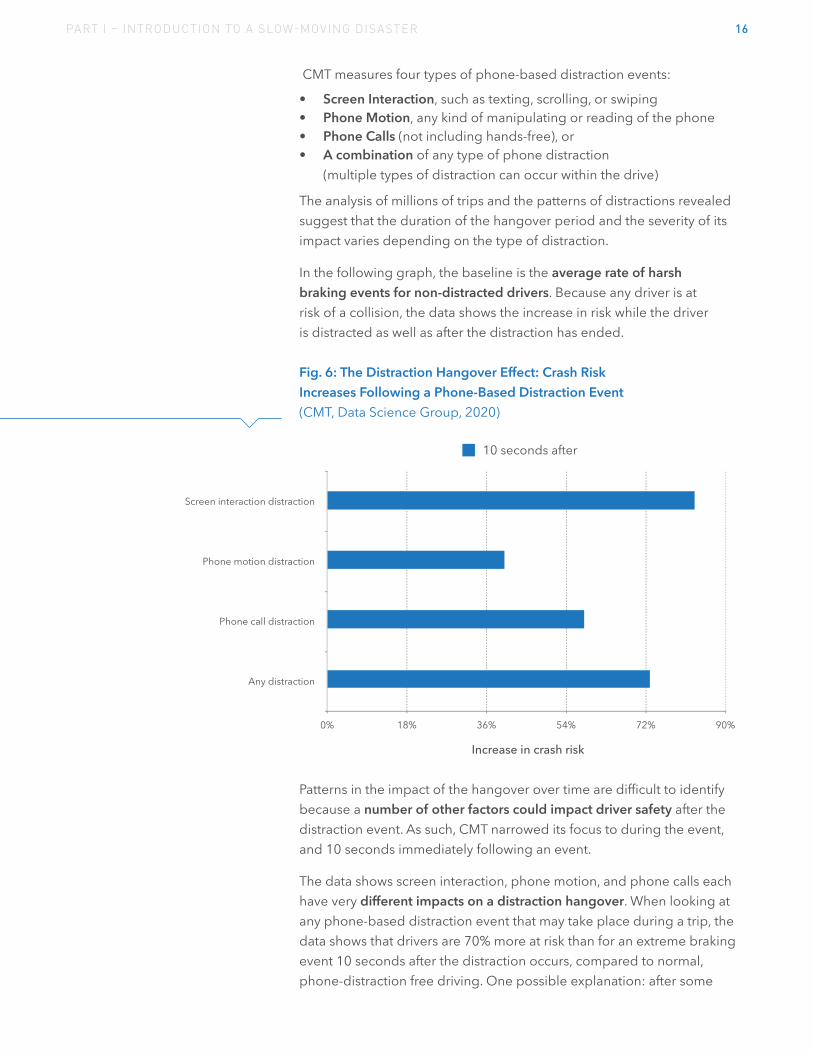
In the following graph, the baseline is the average rate of harsh braking events for non-distracted drivers. Because any driver is at risk of a collision, the data shows the increase in risk while the driver is distracted as well as after the distraction has ended. Fig. 6: The Distraction Hangover Effect: Crash Risk Increases Following a Phone-Based Distraction Event (CMT, Data Science Group, 2020)
Patterns in the impact of the hangover over time are difficult to identify because a number of other factors could impact driver safety after the distraction event. As such, CMT narrowed its focus to during the event, and 10 seconds immediately following an event.
The data shows screen interaction, phone motion, and phone calls each have very different impacts on a distraction hangover. When looking at any phone-based distraction event that may take place during a trip, the data shows that drivers are 70% more at risk than for an extreme braking event 10 seconds after the distraction occurs, compared to normal, phone-distraction free driving. One possible explanation: after some
17PART I – INTRODUCTION TO A SLOW-MOVING DISASTER
distraction events, like phone calls, drivers look away from the road to set down the phone or end the call.
Screen interactions such as texting generate a very intense distraction hangover, increasing the risk of a hard braking event by 82% ten seconds after the screen interaction ends.
The last type of distraction is calling. Phone calls result in the most burdensome cognitive load: risk of a hard braking event grows by up to 60% ten seconds after the call.
Distraction in the US: Official Measurements1. HOW PHONE USAGE WHILE DRIVING IS MEASURED TODAY
The National Occupant Protection Use Survey (NOPUS), which is conducted in part by NHTSA, provides statistics on drivers nationwide during daylight hours in the U.S. It reports that in 2018, 3.2% of drivers were seen talking on handheld phones, 0.35% were making hands-free calls, and 2.1% were manipulating their phones while driving. This statistic doubled (4.2%) when members of Gen Z were isolated from the average (2019).
This data is collected by NOPUS analysts standing at intersections observing drivers of passenger vehicles. The data was gathered between 7 a.m. and 7 p.m., but only stopped vehicles were observed as the collectors needed time to process the information manually. The latest survey states 1,612 sites were observed and notes were taken on 51,414 vehicles (2019).
NOPUS is the only nationwide probability-based observational survey of driver electronic device use in the U.S. There are other surveys conducted at the state level, such as the California Office of Traffic’s report, but it employs the same methodology: people standing on the side of the road at intersections holding clipboards. This data, which is clearly gathered in a flawed and outdated manner, is how NHTSA, the Insurance Information Institute (III), and other government agencies understand the issue of phone distraction.
This methodology shows four shortcomings that cannot be overlooked:
• The sample represents a very small fraction of U.S. traffic and does not consider different types of behavior based on road types.
• The manual recording is unreliable and depends entirely on whether distraction is evident when seen from the curb.
• It neglects to take into consideration the length of time that each driver stays on the phone.
• It only considers distraction events at low speed or stopped in traffic which makes them less consequential on collision risk.
18PART I – INTRODUCTION TO A SLOW-MOVING DISASTER
2. HOW CRASH CAUSALITY IS COMMUNICATED TODAY
NHTSA reports yearly on the cause of deadly crashes. Analyzing the result brings numerous issues to light.
From 2013 to 2017, recorded road fatalities have increased by 13% (III, 2017). In that same period, road fatalities in accidents where phone distraction was recorded as the main cause have decreased by four percent (NHTSA, 2019).
In NHTSA’s 2019 report, the measurement from the Fatality Analysis Reporting System (FARS) denotes 9% of fatal crashes were affected by distraction – defined by an array of factors. Only 1% (385) of them were identified as directly linked to smartphone distraction (2019).
In its 2019 report, NHTSA recognizes the limitations in the FARS data as it is based on police records (PCR). It recommends “broad-sweeping changes to the PCR to incorporate new technologies and features of technologies,” highlighting that it is difficult to capture data that involves interaction with cellphones.
Police records tend to vary across jurisdiction as the attributes used to define an incidents probable cause are not universal. Specifically, distraction is not a distinct variable in all states; this report dives deeper into this issue in Part II.
The VTTI dash-cam study concluded that 68.3% of crashes involved some type of observable distraction. This is much more aligned with CMT’s findings but includes a wide array of distraction types (Dingus et al., 2016). Furthermore, VTTI stated that more than 50% of the time, some type of distraction was preventing the drivers from engaging in the primary task of driving (2016).
The study extrapolates that based on the total driving population of the country, potentially 36% of accidents – four million of the nearly 11 million annually – were deemed avoidable “if no distraction was present” (Dingus et al., 2016). On the whole, VTTI observed distractions in 51.93% of the trips, and distraction events were seen to double the crash risk with strong variation between the types of distraction.

19PART I – INTRODUCTION TO A SLOW-MOVING DISASTER
Distraction in the US: Telematics Measurements1. METHODOLOGY TO MEASURE DISTRACTION
CMT holds the world’s largest driver behavior database, combined with actuarial analysis. Data is compiled from more than 6.5 million drivers in more than 50 programs in over 25 countries around the world. On average the database grows by 1 billion miles every week.
In 2012, the company realized that distracted driving was on the rise, and updated its safe driving app, called DriveWell, in response. Years of deployment of the app in the U.S. and abroad have allowed CMT to clearly define best practices in affecting long-term behavior change.
DriveWell is a complete telematics and analytics platform that uses an app running in the background on the driver’s smartphone and an optional IoT Tag on the windshield to measure and score driving performance. Today, it is used by insurers, mobility companies, OEMS, and fleets.
DriveWell processes raw data from acceleration, gyroscope, position, and magnetometer sensors in the smartphone, and a high-frequency acceleration sensor in the Tag. As a result, any type of smartphone and vehicle can use DriveWell and participate in building a precise picture of road safety in the U.S. and across the globe. It can also identify the length of the distraction event and the context of the dangerous behavior including road type, time of day, etc.
Using data from millions of phones paired with its Tag device, CMT is able to detect and correct for the variations and anomalies that occur in the sensor data produced by the many different models and manufacturers of smartphones.
Beyond measurement, the technology behind DriveWell is used to understand the crash risk associated with specific behaviors. Today, CMT’s actuarial score provides insurers with a greater understanding of their drivers’ risk, enabling more accurate pricing and improved loss prediction. Verified risk factors include: hard braking and other inertial events, excessive speeding, phone motion, screen interaction, as well as driving time on different road types.
DriveWell not only detects distraction events, it also quantifies them. CMT considers three types of distraction: phone calls, phone motion, and screen interaction. When drivers dock their phones either on their windshields or dashboards, the risk may seem lower because they might not necessarily be preoccupied with handling the device. This is why it is important to include the screen interaction feature, which categorically sorts distraction in terms of risk points in a different way than phone motion.
20PART I – INTRODUCTION TO A SLOW-MOVING DISASTER
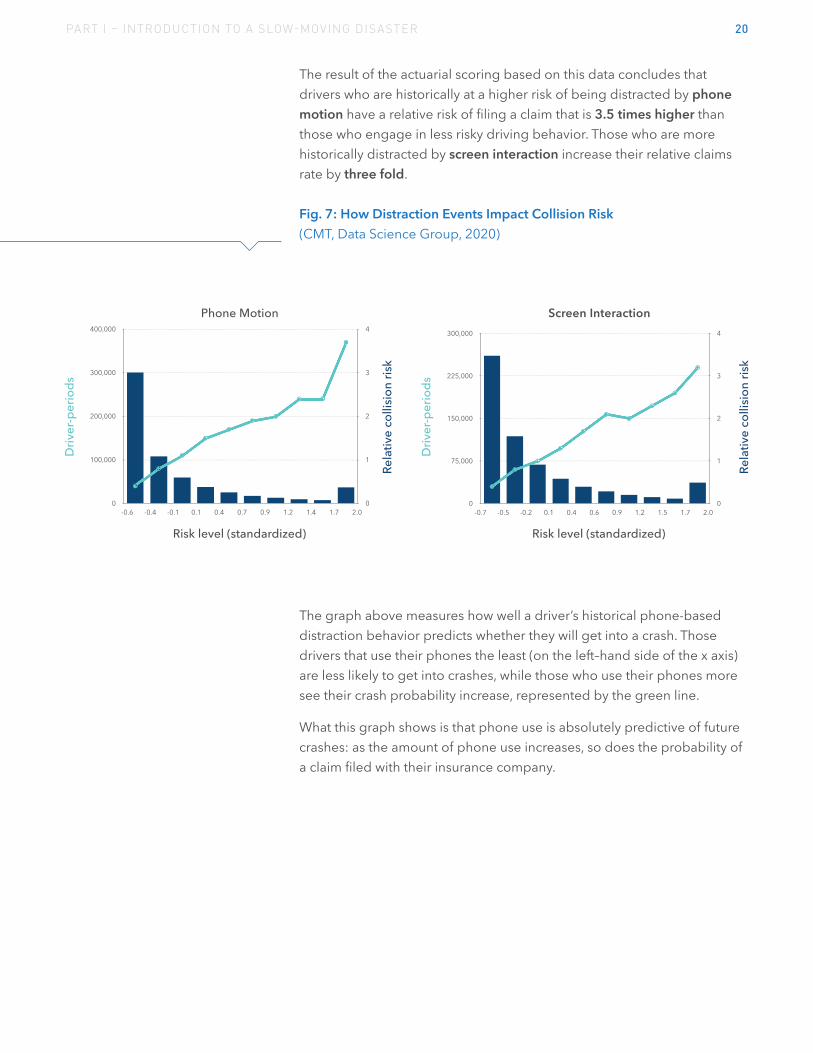
The result of the actuarial scoring based on this data concludes that drivers who are historically at a higher risk of being distracted by phone motion have a relative risk of filing a claim that is 3.5 times higher than those who engage in less risky driving behavior. Those who are more historically distracted by screen interaction increase their relative claims rate by three fold. Fig. 7: How Distraction Events Impact Collision Risk (CMT, Data Science Group, 2020)
The graph above measures how well a driver’s historical phone-based distraction behavior predicts whether they will get into a crash. Those drivers that use their phones the least (on the left–hand side of the x axis) are less likely to get into crashes, while those who use their phones more see their crash probability increase, represented by the green line.
What this graph shows is that phone use is absolutely predictive of future crashes: as the amount of phone use increases, so does the probability of a claim filed with their insurance company.

21PART I – INTRODUCTION TO A SLOW-MOVING DISASTER
The maps above show a constant increase in the number of distraction events per mile in the last three years. On average, there are 15% more distractions per 100 miles in 2019 than the previous year. The growth is pervasive nationwide, and there are few signs that this trend will right itself.
Across the U.S., the lowest share of trips including distraction is 30% (Oregon), with the highest above 50% (Mississippi, 53%). CMT’s reports are not skewed by speed, road type, or location, as telematics devices and smartphones measure from within vehicles driving across the country, in all variable driving conditions. As such, CMT’s data also revealed that distraction occurs at all speeds including high speeds where it is most dangerous. In fact in the worst offending states such as South Dakota or Kansas, a quarter of the mobile distraction takes place at over 30 mph. The problem is not isolated to a few states, either. Throughout much of the Midwest, the average distraction speed is 20 mph.
2. CMT’S RESPONSE TO OFFICIAL MEASUREMENTS
Given some of the shortcomings of the data and analysis from NHTSA and the NOPUS survey, CMT knows that telematics can tell a more complete story concerning phone distraction.
Starting in January 2017, CMT has analyzed 54 million trips recorded over three years across the U.S. In 2019, that data shows 37% of all trips involve significant driver phone distraction: at least 20 seconds of cumulative phone use while driving. That number is trending upwards: in 2018, the national average was 35%. From state to state the numbers vary significantly, with some states showing more than 50% of trips involving phone distraction. Fig. 8: The Average Distraction per 100 Miles is Accelerating Rapidly (CMT, Data Science Group, 2020)
Note: States with less than 2 million trips recorded in the year have not been considered.
Average number of distraction events per 100 miles
22PART I – INTRODUCTION TO A SLOW-MOVING DISASTER
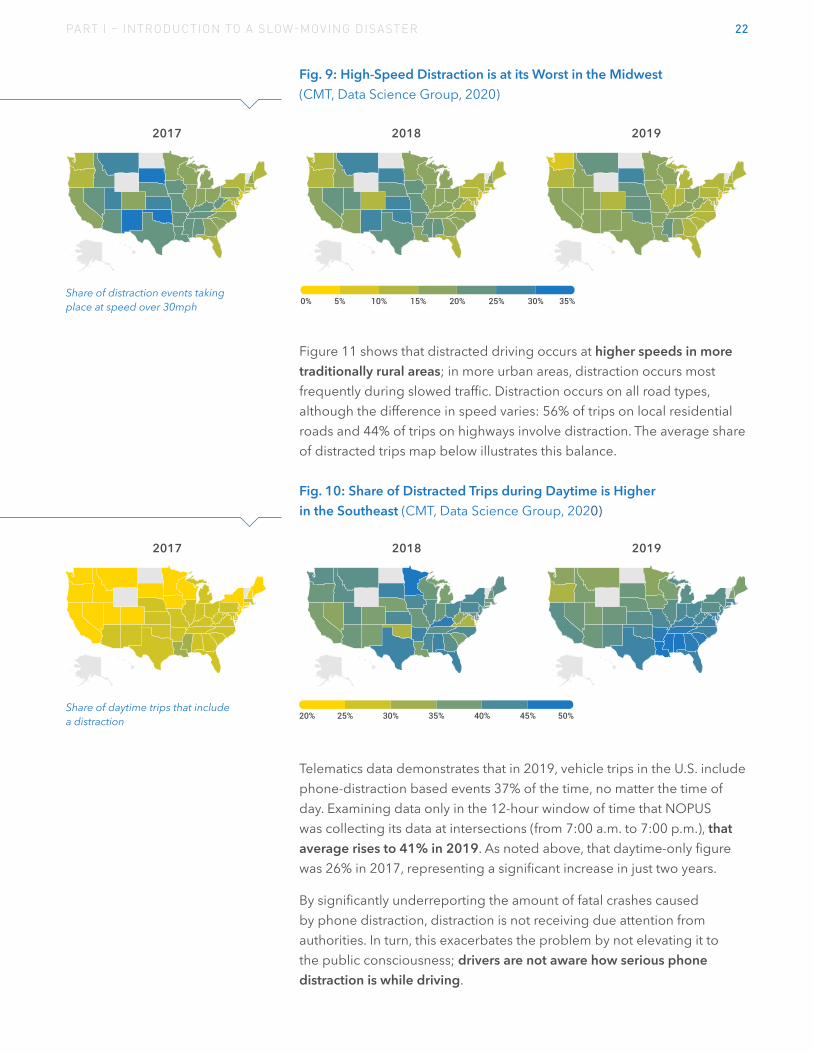
Fig. 9: High-Speed Distraction is at its Worst in the Midwest (CMT, Data Science Group, 2020)
Figure 11 shows that distracted driving occurs at higher speeds in more traditionally rural areas; in more urban areas, distraction occurs most frequently during slowed traffic. Distraction occurs on all road types, although the difference in speed varies: 56% of trips on local residential roads and 44% of trips on highways involve distraction. The average share of distracted trips map below illustrates this balance. Fig. 10: Share of Distracted Trips during Daytime is Higher in the Southeast (CMT, Data Science Group, 2020)
Telematics data demonstrates that in 2019, vehicle trips in the U.S. include phone-distraction based events 37% of the time, no matter the time of day. Examining data only in the 12-hour window of time that NOPUS was collecting its data at intersections (from 7:00 a.m. to 7:00 p.m.), that average rises to 41% in 2019. As noted above, that daytime-only figure was 26% in 2017, representing a significant increase in just two years.
By significantly underreporting the amount of fatal crashes caused by phone distraction, distraction is not receiving due attention from authorities. In turn, this exacerbates the problem by not elevating it to the public consciousness; drivers are not aware how serious phone distraction is while driving.
0% 5% 10% 15% 20% 25% 30% 35%Share of distraction events taking place at speed over 30mph
20% 25% 30% 35% 40% 45% 50%Share of daytime trips that include a distraction

23PART II
Curbing Distraction Effectively by Creating the Right Incentives
Traditional Methods of Curbing Phone Distraction have been Ineffective
Over the last four decades, the U.S. federal government, state governments, academia, private companies, and advocacy groups have successfully influenced a major road safety hazard that draws the closest comparison to distracted driving: drunk driving.
With an eye to reducing road fatalities and billions of dollars in damages from avoidable accidents, grassroots organizations and local, state, and federal governments have seen success using a multifaceted strategy made out of four policies: 1. Coordinated public education campaigns2. Enacting strong laws3. Active and highly visible law enforcement, and4. Public-private partnerships
For phone distraction, many of these previously successful approaches have not been enacted with the same level of enthusiasm as drunk driving; society is at the very beginning of understanding the scope and severity of this slow-moving disaster.
To date, states have enacted laws, prescribed penalties to offenses, and launched public and private campaigns such as the National Safety Council’s Distracted Driving Awareness Month in April, and AT&T’s It Can Wait national ad campaign. As seen in Part 1, these have failed to change behavior significantly.
Phone distraction while driving is a modern problem that requires a modern solution. In Part 1 of this report, CMT used its abundance of driving data to identify a gap in the measuring of distracted driving taking place nationwide. Now, we present a solution: use the very device that sits in 81% of the country’s pockets and is the source of the problem, the smartphone.
24PART I I – CURBING DISTRACTION EFFECTIVELY BY CREATING THE RIGHT INCENTIVES
1. PREVIOUS PUBLIC MESSAGING AND AWARENESS CAMPAIGNS
Experts point to successful public awareness campaigns as major contributors in reducing fatalities tied to drunk driving. In the early 1980s, the first phase of combating drunk driving included a public perception campaign that driving while intoxicated wasn’t a mistake, but an actual crime. The educational awareness campaign, spearheaded by Mothers Against Drunk Driving, widely referred to as MADD, was aimed at drivers themselves, but also at state legislators (encouraging them to pass stricter laws), and at law enforcement (encouraging them to enforce laws and to prosecute offenders to the furthest possible extent). In this instance, coordinated public education campaigns were an invaluable part of challenging the local, state, and federal authorities necessary to enact positive behavior change.
In a 2005 article entitled, “Don’t drink and drive: the successful message of Mothers Against Drunk Driving (MADD),” published in the Journal of World Psychiatry, Dr. Nady el-Guebaly of the University of Calgary wrote “widespread youth and community programs have resulted in a modification of social norms, arguably the ultimate success in prevention. Drunk-driving ‘accidents’ become ‘crashes caused by criminal negligence,’ altering a collective moral mentality” (2005).
A similar modification of social norms is the U.S. Designated Driver campaign, created in 1988 by the Harvard School of Public Health’s Center for Human Communication. Researchers at Harvard partnered with Hollywood’s top TV networks and the Writers Guild of America to add storylines involving designated drivers to popular television shows. According to Jay A. Winsten, associate dean for Health Communication at Harvard and a primary contributor to the effort, the campaign received more than $100 million in donated airtime each year, and subplots involving designated drivers appeared in more than 160 episodes of prime-time television (2010).
The change of perceptions and social norms in drunk driving resulted in a marked reduction in fatalities from drunk driving. Fatalities involving alcohol impairment dropped 30% between 1988, when the initiative started, and 1994, though Winsten points out his effort was only one of many pieces that contributed to the positive behavior change.
In a recent radio panel about distracted driving reduction, Winsten said this kind of bad behavior is a difficult habit to break, as cell phones have become a central part of our culture, and change will require a “multifaceted effort,” not unlike the four-pronged approach mentioned above in this section (2010).
25PART I I – CURBING DISTRACTION EFFECTIVELY BY CREATING THE RIGHT INCENTIVES
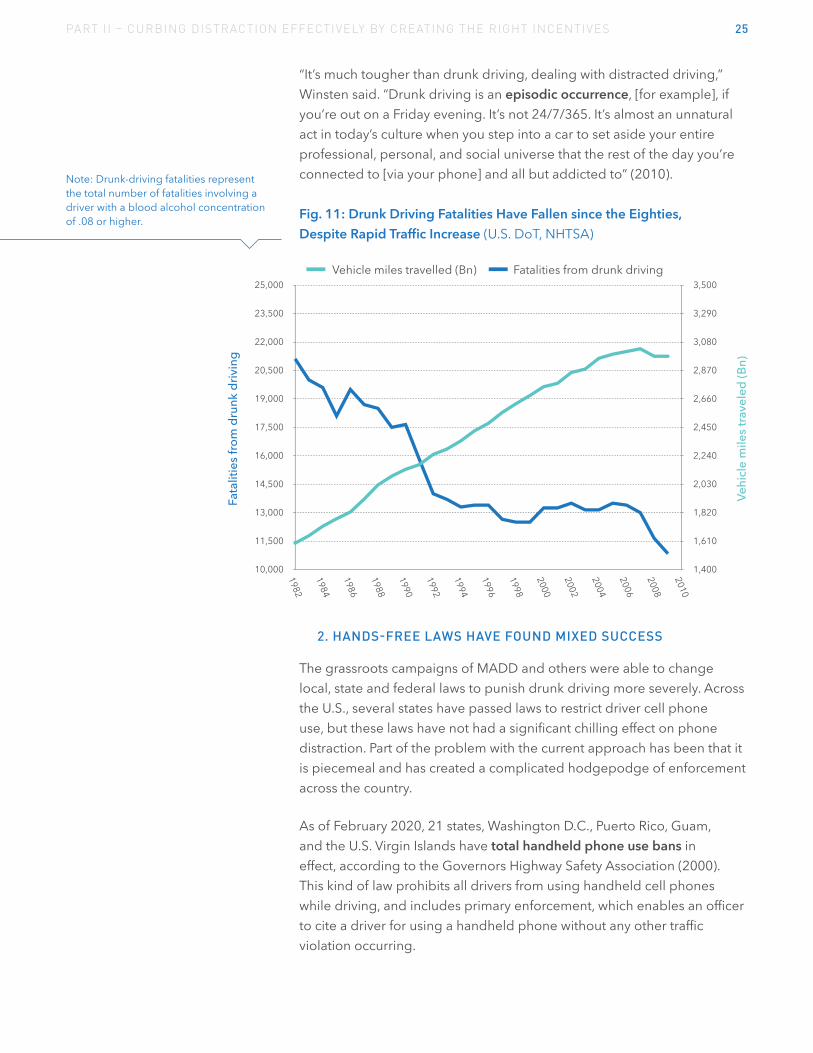
“It’s much tougher than drunk driving, dealing with distracted driving,” Winsten said. “Drunk driving is an episodic occurrence, [for example], if you’re out on a Friday evening. It’s not 24/7/365. It’s almost an unnatural act in today’s culture when you step into a car to set aside your entire professional, personal, and social universe that the rest of the day you’re connected to [via your phone] and all but addicted to” (2010). Fig. 11: Drunk Driving Fatalities Have Fallen since the Eighties, Despite Rapid Traffic Increase (U.S. DoT, NHTSA)
2. HANDS-FREE LAWS HAVE FOUND MIXED SUCCESS
The grassroots campaigns of MADD and others were able to change local, state and federal laws to punish drunk driving more severely. Across the U.S., several states have passed laws to restrict driver cell phone use, but these laws have not had a significant chilling effect on phone distraction. Part of the problem with the current approach has been that it is piecemeal and has created a complicated hodgepodge of enforcement across the country.
As of February 2020, 21 states, Washington D.C., Puerto Rico, Guam, and the U.S. Virgin Islands have total handheld phone use bans in effect, according to the Governors Highway Safety Association (2000). This kind of law prohibits all drivers from using handheld cell phones while driving, and includes primary enforcement, which enables an officer to cite a driver for using a handheld phone without any other traffic violation occurring.
Note: Drunk-driving fatalities represent the total number of fatalities involving a driver with a blood alcohol concentration of .08 or higher.

26PART I I – CURBING DISTRACTION EFFECTIVELY BY CREATING THE RIGHT INCENTIVES
No state bans all phone use for all drivers, meaning phones in holders are also prohibited, but 39 states do so for novice drivers, and 20 states prohibit bus drivers from using them. Drivers are banned from text messaging in 48 states, and 45 of those have primary enforcement for texting.
Enforcement is naturally difficult. With the present mix of regulations, there are 231 different possible options to look at in order to answer the question: ”Is this driver using a phone while driving infringing the law?” depending on state, age, status, phone activity, etc.
Finally, each state has a different penalty structure, with fines as low as $25 and as high as $1,000 with the possibility of jail time. Fig. 12: Toughest Laws on Distraction in the US, on a scale from 1-4 (Siegfried & Jensen, 2019. CMT, updated July 2020)
The map above is based on an index of 1 to 4 whereby the index 4 is showing states where the environment and the laws have produced significant barriers to distraction (Siegfried and Jensen).
The criteria used in the building of the index include:• Fatality rates per 100,000 drivers• Presence of an hand held ban, phone ban and or texting ban• Presence of restrictions on the above bans • Enforcement and fines levels
No Law Soft Mixed Serious

27PART I I – CURBING DISTRACTION EFFECTIVELY BY CREATING THE RIGHT INCENTIVES
Legislators can only affect behavior so much: historically, efforts to curb drunk driving have shown that stricter laws don’t necessarily lead to a reduction in bad behavior. According to a 2015 study by WalletHub, Arizona has the strictest drunk driving law, but is in the median range nationwide in fatalities caused by DUI (DriversEd, 2015). West Virginia has the fourth-strictest laws, but is also the fourth highest in the number of fatalities from DUIs.
Some scholars posit that the greatest reduction in bad behavior comes not from the harshest penalty, but instead from the greatest certainty in being caught. In a 2011 article in the University of Illinois law review, Prof. Adam M. Gershowitz wrote, referring to studies on effective DWI reduction dating back to the early 1970s, that “over the last few decades, social scientists have demonstrated that perceived certainty of punishment – that is, the likelihood of being caught and held responsible for criminal behavior – is the single most important variable in deterring misconduct” (2011).
Unfortunately, many phone distraction laws have proven difficult to enforce. Some prohibit texting specifically but not other activities like web browsing or using the GPS. Some prohibit holding the phone in hand but permit the driver to rest the device on their laps. Even in states that require phones to be secured into a mount or holder, language in the laws often allow drivers to tap the screens while driving for GPS and other functions. With time, behaviors have changed and drivers are now more expert at hiding smartphone use from law enforcement by moving it “under the dash” or mounting it below the windshield, making enforcement even harder.
The inconsistency of laws state to state is just one of the multiple problems authorities encounter while enforcing laws against cell phone use while driving. A 2018 study at University of West Virginia (Rudisill et al.) showed that law enforcement officers from five different agencies in that state were flummoxed by issues including inconsistent laws across states, a perceived lack of support from judges and the courts, phones having multiple functions, concerns with wanting to maintain a positive relationship with the public, and being unable to see into moving vehicles, especially at night.
Part I of this report focused on distracted driving as a slow-moving disaster that is underreported and, as such, is underserved by public and private authorities. While 48 out of 50 states have taken the necessary first steps outlined above – enacting strong laws as well as active and highly-visible law enforcement – the differing methodologies employed by both federal and state institutions have neither painted a clear picture of distracted driving, nor proven effective in influencing long-term sustained behavior change.

28PART I I – CURBING DISTRACTION EFFECTIVELY BY CREATING THE RIGHT INCENTIVES
3. LAWS ARE LESS IMPACTFUL WITHOUT ADDITIONAL INCENTIVES
The smartphone is so ingrained in society that drivers are distracted behind the wheel in unprecedented numbers – in 41% of all daytime drives, as noted above. The laws passed by states to combat distracted driving are not effective: analysis using telematics devices shows many laws do not create sustained changes in driver behavior.
CMT analyzed tens of millions of trips in four states that recently introduced handheld use bans. Drivers were studied in each state across a six-month span, 90 days before and 90 days after the law went into effect, to determine how effective each law was in changing distracted driving.
To determine the average number of distracted minutes per hour, CMT looked at independent phone motion during car trips – that is, phone motion contrary to the movement of the vehicle caused by being manually manipulated – as a proxy for distraction.
Four states were analyzed: Rhode Island where a hands-free law went into effect on June 1, 2018, Georgia (July 1, 2018), Tennessee (July 1, 2019), and Minnesota (August 1, 2019). This data represents telematics users, not every driver on the road. The results show a clear pattern and the difficulty of addressing distracted driving through legislation and enforcement. All four states saw an immediate drop in distracted minutes per hour on the day the law went into effect. This shows the effect of public awareness campaigns, and the fear of being punished for bad behavior. Fig. 13: Driver Behavior Before and After Hands-Free Driving Law Introduction (CMT, Data Science Group, 2020)

29PART I I – CURBING DISTRACTION EFFECTIVELY BY CREATING THE RIGHT INCENTIVES
However, most drivers only put down their phones for a few weeks: all states but Minnesota saw a quick subsequent regression towards previous levels of distracted driving, with gains eroding quickly after the initial bump.
Rhode Island showed the most drastic regression: it saw an 11.8% reduction in distracted driving in the first two weeks of the law, but by the end of the three-month review, average distracted minutes per hour essentially returned to pre-law averages, showing a negligible 0.1% decrease.
That same regression, while less drastic, played out in Georgia and Tennessee, as well. Georgia went from 23.7% reduction after two weeks to 17.9% at the end of the third month, while Tennessee saw 16.2% reduction directly after the law, and a 13.5% reduction at the end of that third month.
Only Minnesota showed a sustained reduction in distracted driving after its hands-free law was enacted; drivers reduced their distracted driving by 25.1% in the first two weeks, and by the end of the third month drivers improved to a 27% reduction.
Telematics Provides Incentives for Improvement
The research conducted in the four states revealed a second result: while most states saw most gains from the enactment of new laws erode quickly, there were populations who saw sustained behavior change. A large portion of frequent drivers showed significant improvement and sustained it for the 90 days after the law went into effect. A “frequent” driver is someone who drove at least once in 20 of the 24 weeks reviewed in that state.
This set of drivers is where one can see the clearest effect of the law and change of behavior over time. However, it is key to remember what the data actually represents: not frequent drivers, but frequent telematics users. They have a tangible and ongoing incentive to drive distraction-free.
This distinction is important because of the exciting implication it highlights: in the group of users that interacts with their telematics app frequently (at least once in 20 out of 24 weeks), as many as 48.5% still see overall improvement 90 days after a handheld use ban goes into effect in their state. Specifically in the states considered, we saw 48.5% in Minnesota, 45.1% in Tennessee, 44.5% in Georgia, and 38% in Rhode Island.

30PART I I – CURBING DISTRACTION EFFECTIVELY BY CREATING THE RIGHT INCENTIVES
Perhaps even more crucially, that same group of drivers improved the most over those 90 days, comparing pre-law averages to post-law driving behavior. This shows that the incentives provided by a hands-free law alone do not provide sustained change in three out of the four states analyzed – but the combination of laws and engagement with a telematics program do show sustainable improvement in all four states. Fig. 14: Telematics Users Show Sustained Improvement (CMT, Data Science Group, 2020)
The above graph shows the percent change in distracted minutes per hour of driving for the subset of drivers that continuously improved after a hands-free law when into effect vs. other frequent drivers that did not successfully maintain the change in their behavior.
Public-Private Telematics Technology Partnerships
The U.S. has tried to combat distracted driving at the national level with publicity campaigns aired around the country, like “U Drive. U Text. U Pay,” sponsored by the United States Department of Transportation (2016). States are enacting and enforcing new laws, with varied success as discussed above.
At the municipal level, cities have partnered with CMT and private insurers to educate citizens about their risky driving behavior and incentivize them to drive safer. These public-private partnerships promote habitual driving behavior changes through Safest Driver Contests with cash prizes. Contest participants downloaded a free app that monitors and scores their driving behaviors and allowed them to compete in categories like best overall driver, least distracted, and least speedy driver.
Note: These drivers are highlighted because they showed continuous improvement, thus there is some small amount of selection bias inherent when they are highlighted as the drivers that also have the greatest reduction in phone distraction.

31PART I I – CURBING DISTRACTION EFFECTIVELY BY CREATING THE RIGHT INCENTIVES
Years of CMT data show that providing drivers immediate feedback about their poor driving behavior encourages improvement. This effect is amplified when you can provide incentives, such as discounts on car insurance rates or tangible rewards provided on a regular basis. This modern technology – which does not have an analog in the fight against drunk driving – can provide a modern solution that helps curb phone distraction while driving.
As noted in Part I, the International Transport Forum (ITF) ranked the U.S. 33rd out of 40 countries in overall road safety. It is one of three countries where there are more than 10 road fatalities per 100,000 inhabitants (ITF: USA, 2019). The U.S.’s efforts in curbing fatal accidents have paled in comparison to the greater First World at large.
In contrast, the European Union has what is widely considered the safest road system in the world. Its success in reducing road fatalities can be attributed to its widespread adoption of the “Vision Zero” and “Safe System” approaches. Both aim to eliminate accidents by separately addressing each causal factor: infrastructure design, vehicle safety, driver behavior, emergency response, legislation, enforcement, and public education.
Part of the E.U.’s success is in one of its latest initiatives: the 2019 Road Safety Exchange (MOVE Newsroom, 2019). Funded by the European Parliament, the project links 12 European countries to share best practices, failures, and results with member countries to help address the gaps in performance (ITF, 2019). In this way, countries within the E.U. can collaborate to create, enforce, and distribute proven methods of improving driving behavior.
In the U.S., states alone cannot seem to agree on how to begin the process of long-term behavior change. Laws vary state to state, as well as levels of enforcement and punishment. While the U.S. also has a Vision Zero initiative, it has demonstrably fallen short in uniting the states into any kind of apparent consensus on how to improve.
CMT partnered with Vision Zero cities Boston, Seattle, San Antonio, and Los Angeles. The international Vision Zero Network is a collaborative campaign that strives to fundamentally change the way society views traffic deaths from unintended accidents to entirely preventable crashes (Vision Zero, 2013).

32PART I I – CURBING DISTRACTION EFFECTIVELY BY CREATING THE RIGHT INCENTIVES
BOSTON’S SAFEST DRIVER 2016
47% reduction in distraction 37% reduction in hard braking 35% reduction in speeding
SEATTLE'S SAFEST DRIVER 2017
35% reduction in distraction 30% reduction in hard braking 28% reduction in speeding
SAN ANTONIO'S SAFEST DRIVER 2018
29% reduction in distraction 17% reduction in hard braking 45% reduction in speeding
LA'S SAFEST DRIVER 2019
25% overall reduction 35% reduction in speeding 30% reduction in distraction
BOSTON’S SAFEST DRIVER 2019
48% reduction in distraction 57% reduction in hard braking 38% reduction in speeding
Fig. 15: Behavior Change Results from Safest Driver Contests
33PART I I – CURBING DISTRACTION EFFECTIVELY BY CREATING THE RIGHT INCENTIVES
In 2020, the Safest Driver contests were nationally recognized as a success story by the Federal Highway Administration. They are a perfect marriage between public and private entities, united in the face of distracted driving – the fourth piece of the multifaceted approach. The results of these partnerships showed significant reductions in risky driving behavior.
In the spring of 2015, Boston mayor Martin Walsh pledged his city’s commitment to eliminating road traffic fatalities and serious injuries by 2030 through a Vision Zero initiative. In 2016, the City of Boston launched the first Safest Driver contest and, based on positive results, partnered with CMT again in 2019 to continue its efforts to reduce distraction.
In the 2019 report, Mayor Walsh stated that:
“While a lot can be done through street design, increased enforcement, and traditional public information campaigns, much of the initiative’s success rests on the ability of Bostonians to change the way they behave when they are behind the wheel of a car. Traffic safety is personal and we need to hold ourselves accountable for results.”
Kris Carter, Co-Chair of the Mayor’s Office of New Urban Mechanics, worked with CMT to implement the contest. In an interview, he stated that the Safest Driver contest was “a perfect blend of human behavior and technology” that enabled the city to empower its residents to become less distracted drivers.
While five driving behaviors were monitored and feedback was provided to each enlisted driver daily, Carter was most interested in curbing distraction. “We can lower speed limits, we can set up enforcement… but we didn’t have a good way to nudge people towards better behaviors other than promoting not touching your phone while you’re driving,” (CMT, 2019). Safest Driver introduced a competition element that Carter believed would be particularly influential in the city. “We’re very competitive here in Boston. We like to win and [this contest allowed us to] bring the public into that conversation on hands-free driving” (2019). Through the Safest Driver partnerships with Boston and other cities, CMT was able to provide the technology necessary for the cities to combat distracted driving by incentivizing drivers to change their behavior.
34PART III
Wide-Scale Behavior Change Requires Individual Solutions
Changing Distracted Driving Behavior
Changing behavior through actions at the federal or state level has proven difficult. In this section, CMT shows how individual behavior change can be targeted and positively influenced in a matter of weeks by technology-based solutions.
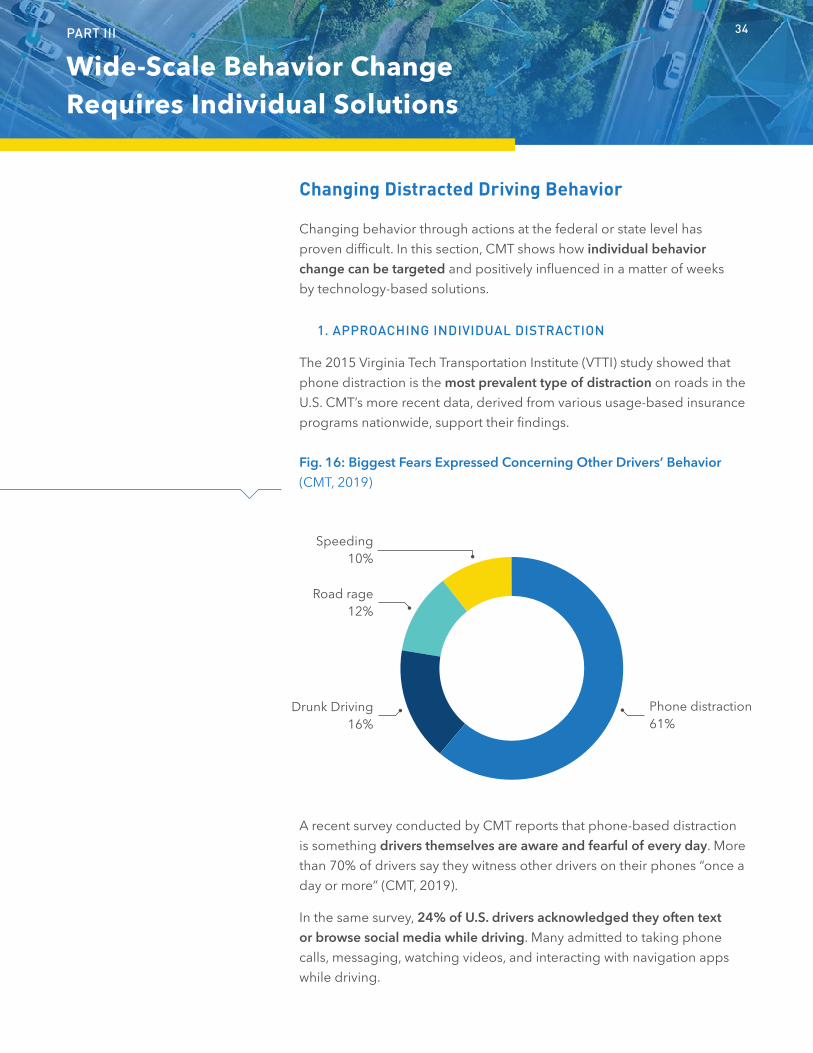
1. APPROACHING INDIVIDUAL DISTRACTION
The 2015 Virginia Tech Transportation Institute (VTTI) study showed that phone distraction is the most prevalent type of distraction on roads in the U.S. CMT’s more recent data, derived from various usage-based insurance programs nationwide, support their findings. Fig. 16: Biggest Fears Expressed Concerning Other Drivers’ Behavior (CMT, 2019)
A recent survey conducted by CMT reports that phone-based distraction is something drivers themselves are aware and fearful of every day. More than 70% of drivers say they witness other drivers on their phones “once a day or more” (CMT, 2019).
In the same survey, 24% of U.S. drivers acknowledged they often text or browse social media while driving. Many admitted to taking phone calls, messaging, watching videos, and interacting with navigation apps while driving.
35PART I I I – WIDE-SCALE BEHAVIOR CHANGE REQUIRES INDIVIDUAL SOLUTIONS
2. FINDING THE RIGHT MOTIVATION
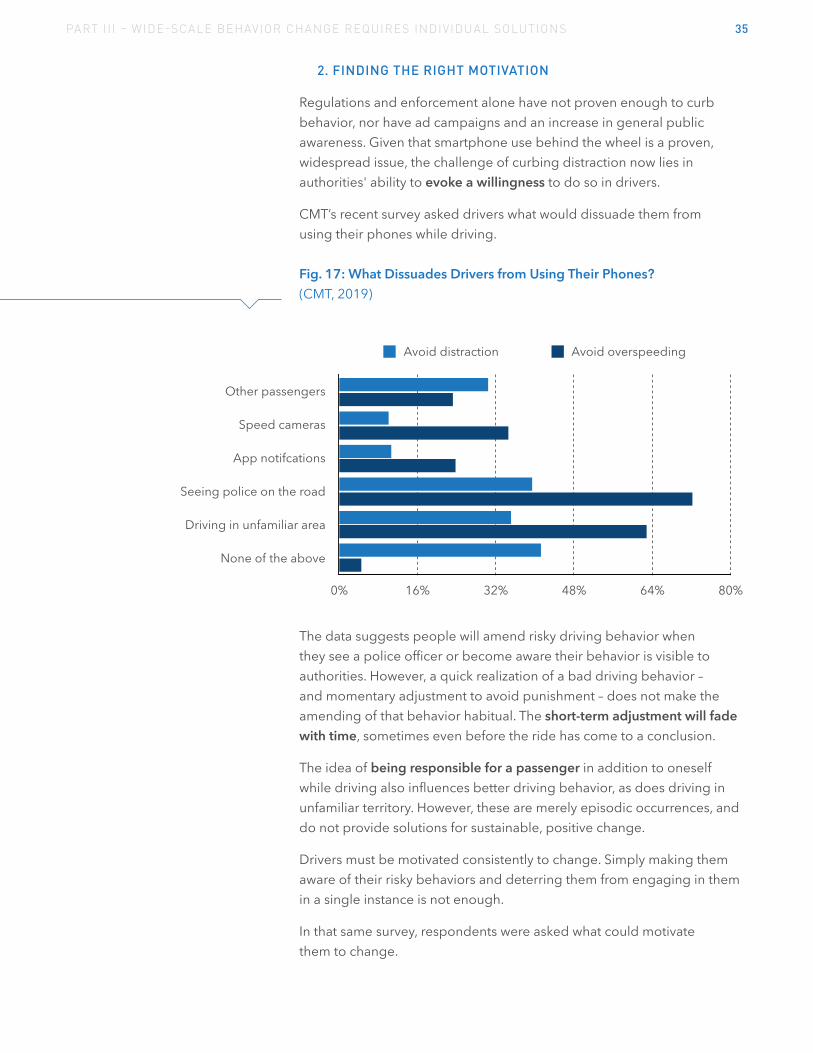
Regulations and enforcement alone have not proven enough to curb behavior, nor have ad campaigns and an increase in general public awareness. Given that smartphone use behind the wheel is a proven, widespread issue, the challenge of curbing distraction now lies in authorities' ability to evoke a willingness to do so in drivers.
CMT’s recent survey asked drivers what would dissuade them from using their phones while driving. Fig. 17: What Dissuades Drivers from Using Their Phones? (CMT, 2019)
The data suggests people will amend risky driving behavior when they see a police officer or become aware their behavior is visible to authorities. However, a quick realization of a bad driving behavior – and momentary adjustment to avoid punishment – does not make the amending of that behavior habitual. The short-term adjustment will fade with time, sometimes even before the ride has come to a conclusion.
The idea of being responsible for a passenger in addition to oneself while driving also influences better driving behavior, as does driving in unfamiliar territory. However, these are merely episodic occurrences, and do not provide solutions for sustainable, positive change.
Drivers must be motivated consistently to change. Simply making them aware of their risky behaviors and deterring them from engaging in them in a single instance is not enough.
In that same survey, respondents were asked what could motivate them to change.

36PART I I I – WIDE-SCALE BEHAVIOR CHANGE REQUIRES INDIVIDUAL SOLUTIONS
The results show that drivers in the U.S. are more inclined to change for financial gain, such as earning discounts or rewards. Additional factors were competitive in nature, in which the driver receives feedback in the form of a score and can therein track their improvement, or compare themselves to others. However there is a crucial component: for any of the above motivators to actually motivate behavior change, they must engage the driver in such a way that (1) the driver is aware of their driving behavior, and (2) they are empowered to change it.
Telematics-based insurance programs built on discounted rates can also enable drivers to change their behavior, but they could fall short of encouraging continuous improvement if the feedback on driving behavior is too staggered. In all UBI models where drivers agree to have their driving assessed during a certain period of time and then receive a discount based on their accumulated score, insurers have seen improvements in road safety.
Driver engagement does however play a big role in changing behaviors such as phone distraction. If no incentives are given to the driver to check their driving score during the six months or one year between the initial monitoring period and renewal, only those naturally motivated by long-term savings will benefit fully from the program.
During the six months or one year between the initial monitoring period and renewal, there are typically no incentives for the driver to check their driving score. While substantial savings can be achieved at the end of the six-month or one-year period, only those motivated by long-term savings will benefit.
Fig. 18: What Motivates Drivers to Change? (CMT, Distracted Driving Survey, 2017)
*i.e. how many drives in a row without mobile phone distraction, how many drives in a row without speeding, etc.
37PART I I I – WIDE-SCALE BEHAVIOR CHANGE REQUIRES INDIVIDUAL SOLUTIONS
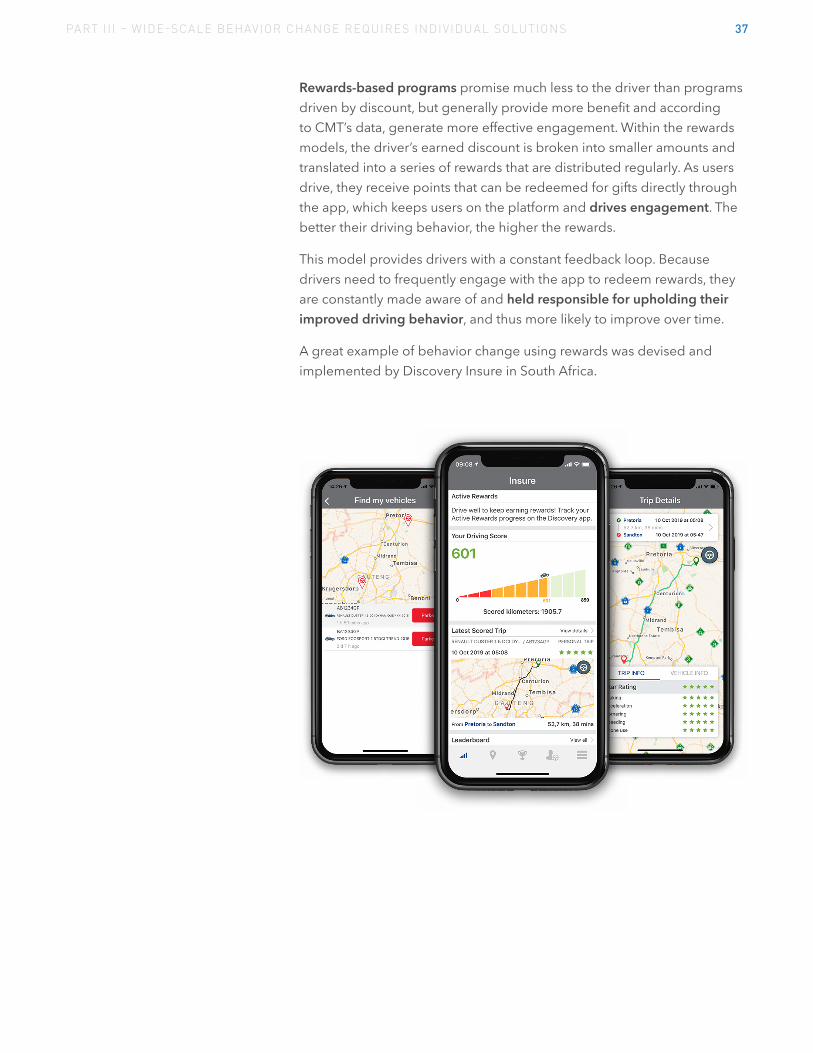
Rewards-based programs promise much less to the driver than programs driven by discount, but generally provide more benefit and according to CMT’s data, generate more effective engagement. Within the rewards models, the driver’s earned discount is broken into smaller amounts and translated into a series of rewards that are distributed regularly. As users drive, they receive points that can be redeemed for gifts directly through the app, which keeps users on the platform and drives engagement. The better their driving behavior, the higher the rewards.
This model provides drivers with a constant feedback loop. Because drivers need to frequently engage with the app to redeem rewards, they are constantly made aware of and held responsible for upholding their improved driving behavior, and thus more likely to improve over time.
A great example of behavior change using rewards was devised and implemented by Discovery Insure in South Africa.

38
Case Study: Discovery InsureCombine cashback and rewards to change driver behavior like Discovery Insure Vitality Drive by Discovery Insure is a driving behavior program that rewards users for safe driving behaviors and achieving goals. Rewards can go toward fuel credits, ride sharing, or car maintenance services. The more engaged the driver, the higher their Vitality status and the better their rewards. Additionally, instead of fuel rewards, drivers can choose an upfront vehicle premium discount based on their Vitality status. To participate in the program, drivers must pay a $5 monthly fee.
Discovery built a network of partners to finance and promote their rewards model. Big brands such as Uber, BP, and Shell, but also local maintenance networks such as Tiger Wheels & Tyre or child chair vendors such as Babies R Us.
Today, more than 70% of the Discovery customers have chosen to enroll in the program.
Vitality Drive users pose less crash risk than non-Vitality Drive users:
• Customers joining Vitality Drive achieve an average of 17% improvement in driving behavior within one month
• Vitality Drive customers that remain in the program result in a 25% lower absolute loss ratio compared with customers who leave
• Vitality Drive has a 17% lower loss ratio on matured book compared with top four personal lines competitors
When asked about the key benefit of the program, Discovery responded they now could make a direct correlation between driver status and their loss ratio.
THE REWARD PROGRAM OFFERS:
9 up to 20% off car maintenance
9 up to 25% off ride sharing services
9 25% off child car seats
ACCORDING TO DISCOVERY INSURE’S 2018 INTEGRATED ANNUAL REPORT, THEIR REWARD PROGRAM GENERATED:
9 $29.4 million in fuel cash-back over seven years
9 500,000 Active Rewards claimed over three years
9 514,496 miles of free Uber rewards over four years, equivalent to 40 trips around the world

39PART I I I – WIDE-SCALE BEHAVIOR CHANGE REQUIRES INDIVIDUAL SOLUTIONS
3. REWARDS VS. MOTIVATION
Motivation is the driving factor behind any human behavior or activity. Rewards are the result of actions successfully completed, and serve to reinforce the continuation of that behavior. Both motivation and rewards can be further divided into intrinsic and extrinsic variables.
9 Extrinsic motivation describes an action motivated by external factors. The driver chooses to do something, not because they enjoy it or find it rewarding, but because they will earn something in return or avoid something unpleasant. An example might look like: I drive slow so I don’t get speeding tickets.
9 Intrinsic motivation describes an action that is taken for the sake of that action. The driver is invested in the process, rather than the external reward. The behavior itself provides the actor with a reward. For example: I read because I enjoy reading (not because it is an assignment I will receive praise for completing).
This is where gamification features can be complementary to an initiative seeking consistent behavior change. According to a study by Richter et al., “games use incentives as motivational hooks that maintain interest and help to stretch engagement and repeat usage” (2015). Making a game out of personalized, measured driving behavior allows for the delivery of rewards, which serves as the reason, or “hook,” that motivates the act of driving safer.
Rewards vary; they speak to certain human needs and serve different purposes to different people. Research in gamification has suggested “it is better to attract people into an experience using extrinsic rewards (gift cards, money, merchandise, discounts), then transition their interest through intrinsic rewards (recognition, status, access)” (Miles, 2017).
EXTRINSIC REWARDS
Originated externally, tangible, or namely given to the driver. These are important to deliver early and often, particularly during the starting phase of the program. Examples:
INTRINSIC REWARDS
Intangible rewards help to reinforce positive feelings. They need development through structure, messaging, and delivery within the program. Examples:
9 Trophies 9 Medals 9 Points
9 Merchandise 9 Gift cards
9 Congratulations messages 9 Leaderboards 9 Status upgrades
40PART I I I – WIDE-SCALE BEHAVIOR CHANGE REQUIRES INDIVIDUAL SOLUTIONS
All humans are unique, sensitive, and habitual. Behaviors are created based on a feedback loop that includes a cue and a reward, which forms a routine that with enough practice, becomes a habit.
Here, safe driving is the routine that needs to be modified – modern drivers’ ability to drive while unconsciously handling their phone – is a pattern of behavior that needs broken and readjusted. Short-term adjustments have shown to be ineffective at rectifying behavior change, with no better luck in programs that are not engaging or fail to provide timely feedback and incentives. As demonstrated in the previous section, the rewards component is demonstrably one of the most powerful factors of change.
Creating Long-Term Behavior Change
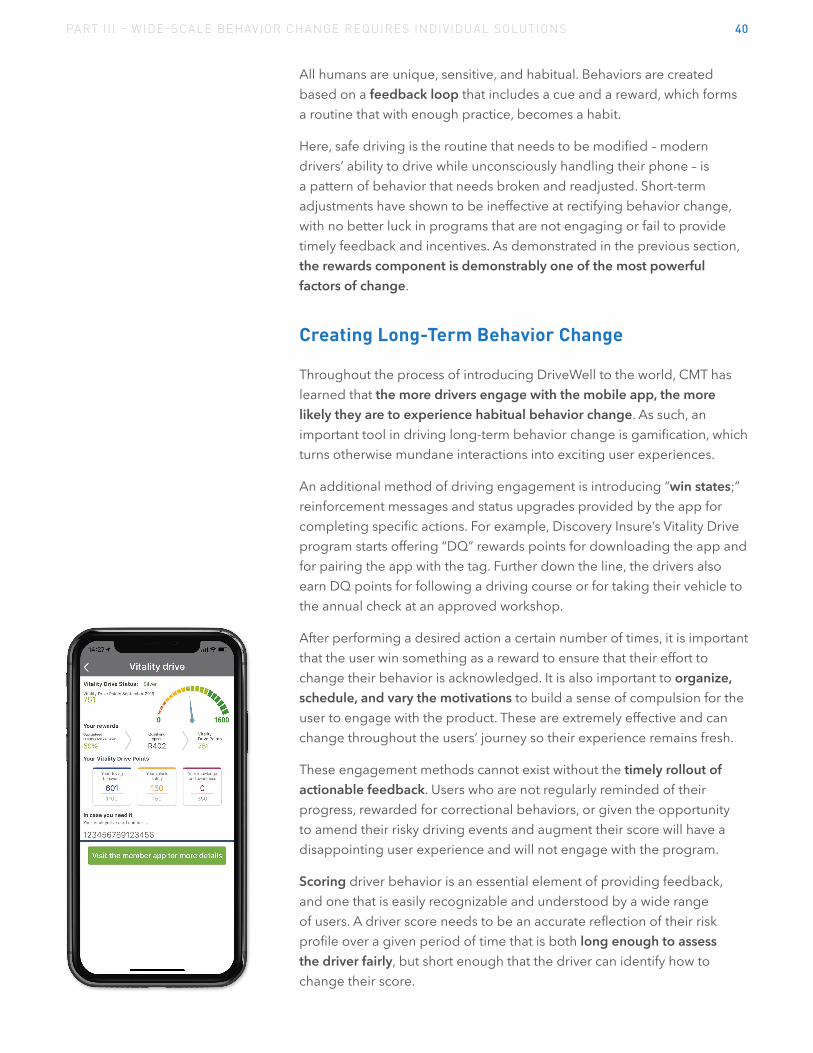
Throughout the process of introducing DriveWell to the world, CMT has learned that the more drivers engage with the mobile app, the more likely they are to experience habitual behavior change. As such, an important tool in driving long-term behavior change is gamification, which turns otherwise mundane interactions into exciting user experiences.
An additional method of driving engagement is introducing “win states;” reinforcement messages and status upgrades provided by the app for completing specific actions. For example, Discovery Insure’s Vitality Drive program starts offering “DQ” rewards points for downloading the app and for pairing the app with the tag. Further down the line, the drivers also earn DQ points for following a driving course or for taking their vehicle to the annual check at an approved workshop.
After performing a desired action a certain number of times, it is important that the user win something as a reward to ensure that their effort to change their behavior is acknowledged. It is also important to organize, schedule, and vary the motivations to build a sense of compulsion for the user to engage with the product. These are extremely effective and can change throughout the users’ journey so their experience remains fresh.
These engagement methods cannot exist without the timely rollout of actionable feedback. Users who are not regularly reminded of their progress, rewarded for correctional behaviors, or given the opportunity to amend their risky driving events and augment their score will have a disappointing user experience and will not engage with the program.
Scoring driver behavior is an essential element of providing feedback, and one that is easily recognizable and understood by a wide range of users. A driver score needs to be an accurate reflection of their risk profile over a given period of time that is both long enough to assess the driver fairly, but short enough that the driver can identify how to change their score.

41PART I I I – WIDE-SCALE BEHAVIOR CHANGE REQUIRES INDIVIDUAL SOLUTIONS
Apps that have an impact on behavior change use the innate inclination in every human to solve problems. The desire is piqued when they are presented with driving feedback like being shown a map of their route, and highlighting areas where risky driving events occurred. Equipping drivers with relevant, immediate feedback, gives them the tools to resolve their own driving behavior, optimize their score, and therein become safer drivers over time.
In CMT’s DriveWell app, the window of time in which this score is calculated has been researched by actuaries. On the one hand, the score needs to surface dangerous events that the driver acknowledges so they can avoid them in the future. This requires a trip-by-trip assessment and clear, short-term feedback to the driver. On the other hand, the score is required to represent a more generic safety profile in order for the driver to see improvement in driving behavior over time. CMT has set the industry best practice for this feedback window at two weeks.
Whether providing feedback or rewards, the longer the feedback loop between action and reaction is the more human behavior deviates from the desired action. A long feedback loop such as an annually adjusted premium, doesn’t yield the most impactful change in driving behavior.
This trend is evident in other industries, including nutrition and exercise. To optimize the impact of the behavior change program, the authority in charge of the app needs to ensure the feedback loop between behavior and score is at the same time visible, immediate, and fair.
42PART I I I – WIDE-SCALE BEHAVIOR CHANGE REQUIRES INDIVIDUAL SOLUTIONS
Forecasting the Impact of Distraction
To show the outsized impact that phone distraction has, CMT built a model using data from several sources to forecast the potential growth of property damage and fatal crashes linked to phone distraction.
Several growth factors were considered, included:• The rise in smartphone penetration • The analysis and forecast of Vehicle Miles Traveled (VMT)
per state and nationwide• The evolution of the average share of distracted trips
per state and nationwide between 2017 and 2019 from CMT
Two scenarios are considered in the forecast using different types of source data.
Scenario A – Official Estimates: NHTSA’s estimate of the share of crashes directly linked to phone distraction
Scenario B – Telematics Data: CMT’s recorded data on the real rates for different locations and trip speeds using the share of trips with distraction events and other indicators such as the share of crashes that included phone use in the two minutes before a crash
For the purposes of this report, CMT analyzed data from 1,346,948,265 trips across the 50 U.S. states from January 2017 to December 2019. For some of the analysis, such as distraction rates, only the states with a minimum of 2.5 million trips/years were included. From the recorded trips, we extracted data such as number of distraction events, length of the distraction events, speed of the vehicle during the event, by date, hour of day and location.
Assumptions: With respect to the claims volumes forecast, this study assumes distraction is the only cause of the crash in question. In effect, the model assumes all crashes where distraction played a role are the same as crashes directly caused by distraction.
Additionally, we estimated the dollar amount of the crashes linked to distraction based on average claims severity of the different types of crash.
Finally, the average cost of claims for a fatal crash in this study is based on figures from a NSC report: $4.6 million per claim (NSC, 2015).
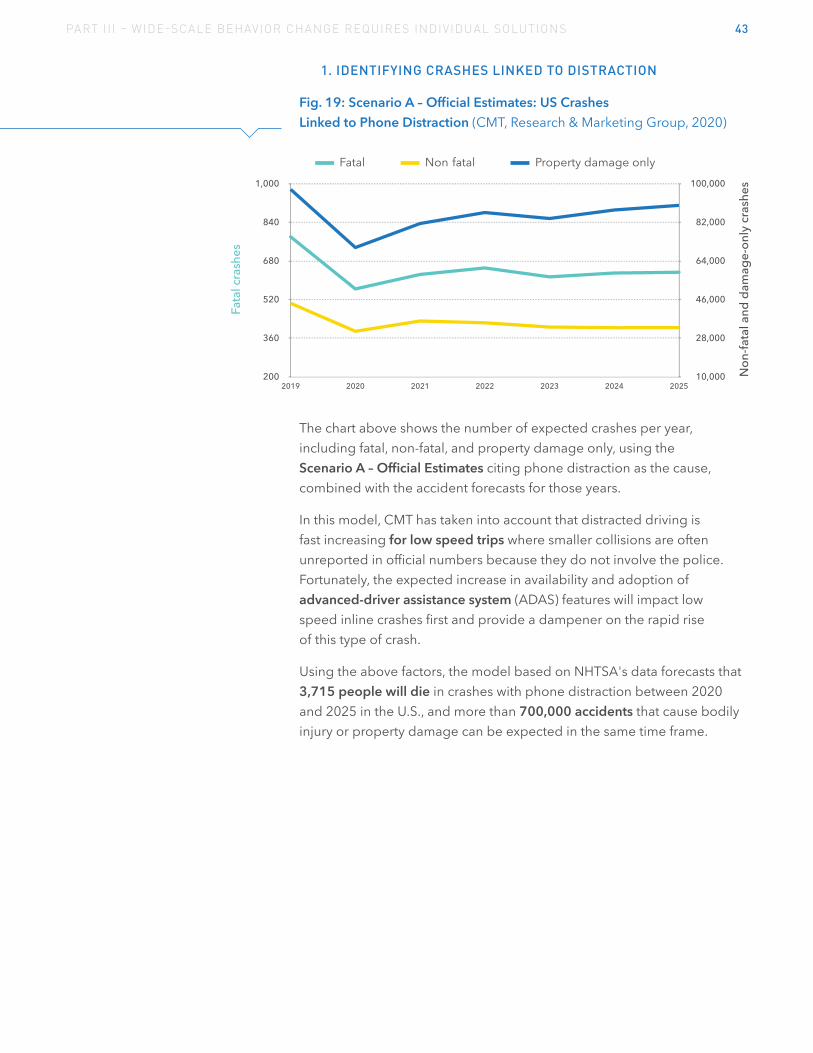
43PART I I I – WIDE-SCALE BEHAVIOR CHANGE REQUIRES INDIVIDUAL SOLUTIONS
1. IDENTIFYING CRASHES LINKED TO DISTRACTION
Fig. 19: Scenario A – Official Estimates: US Crashes Linked to Phone Distraction (CMT, Research & Marketing Group, 2020)
The chart above shows the number of expected crashes per year, including fatal, non-fatal, and property damage only, using the Scenario A – Official Estimates citing phone distraction as the cause, combined with the accident forecasts for those years.
In this model, CMT has taken into account that distracted driving is fast increasing for low speed trips where smaller collisions are often unreported in official numbers because they do not involve the police. Fortunately, the expected increase in availability and adoption of advanced-driver assistance system (ADAS) features will impact low speed inline crashes first and provide a dampener on the rapid rise of this type of crash.
Using the above factors, the model based on NHTSA's data forecasts that 3,715 people will die in crashes with phone distraction between 2020 and 2025 in the U.S., and more than 700,000 accidents that cause bodily injury or property damage can be expected in the same time frame.

44PART I I I – WIDE-SCALE BEHAVIOR CHANGE REQUIRES INDIVIDUAL SOLUTIONS
Fig. 20: Scenario B – Telematics Data: US Crashes Linked to Phone Distraction (CMT, Research & Marketing Group, 2020)
This second graph shows the projected distraction-related crashes according to Scenario B, CMT’s Telematics Data, where the rate of distraction from the data collected is used to forecast crashes over time. CMT’s model based on telematics data of phone distraction forecasts that 21,799 fatal crashes will occur between 2020 and 2025, and 4.7 million accidents that cause bodily injury or property damage.
This represents a nearly 600% increase over what the Official Estimates project. Overall, this is how the two models compare.
Fig. 21: Telematics Data vs. Official Estimates of Crashes Linked to Distraction (CMT, Research & Marketing Group, 2020)
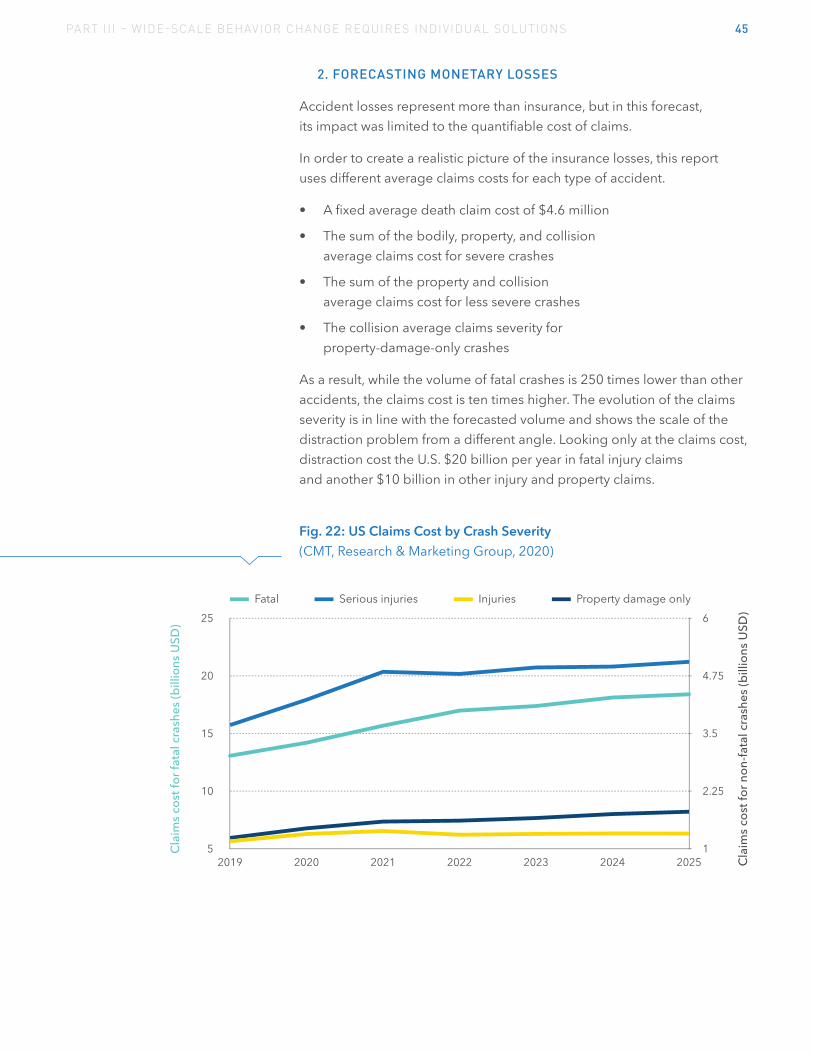
45PART I I I – WIDE-SCALE BEHAVIOR CHANGE REQUIRES INDIVIDUAL SOLUTIONS
2. FORECASTING MONETARY LOSSES
Accident losses represent more than insurance, but in this forecast, its impact was limited to the quantifiable cost of claims.
In order to create a realistic picture of the insurance losses, this report uses different average claims costs for each type of accident.
• A fixed average death claim cost of $4.6 million
• The sum of the bodily, property, and collision average claims cost for severe crashes
• The sum of the property and collision average claims cost for less severe crashes
• The collision average claims severity for property-damage-only crashes
As a result, while the volume of fatal crashes is 250 times lower than other accidents, the claims cost is ten times higher. The evolution of the claims severity is in line with the forecasted volume and shows the scale of the distraction problem from a different angle. Looking only at the claims cost, distraction cost the U.S. $20 billion per year in fatal injury claims and another $10 billion in other injury and property claims.
Fig. 22: US Claims Cost by Crash Severity (CMT, Research & Marketing Group, 2020)

46PART I I I – WIDE-SCALE BEHAVIOR CHANGE REQUIRES INDIVIDUAL SOLUTIONS
To estimate the impact of an app such as DriveWell on the cost of claims, CMT built a model following a few simple assumptions:
CMT forecast the volume of crashes where distraction was a determinant factor during the trip. From there, it is assumed that the only cause of the crash is phone distraction, therefore a reduction in distraction will directly impact crashes.
The data resulting from the city Safest Driver contests described above was then considered to determine the variation of that impact depending on states.
Regarding the rollout of the app, the model assumes 25% of the drivers would install it in 2019, and then new drivers were factored in as well as a share of drivers stopping to use the app after a year.
The resulting illustrative forecast shows that using DriveWell to reduce distraction could save over a billion dollars initially in fatal injury claims and continue steadily with each life saved (2020). The savings in injury and property claims could approach $1 billion by 2025.
Fig. 23: Potential Cost Savings in Claims Cost from DriveWell (CMT, Research & Marketing Group, 2020)
Crashes linked to phone distraction only

47
Conclusion & Recomendations
The National Highway and Transportation Safety Administration does what it can to track road safety in general, and phone related distracted driving in specific. There are 4 million miles of public road across the United States, and given the limitations inherent to tracking road safety statistics across 51 different jurisdictions, NHTSA and each state’s traffic safety office does a great job with the data it has access to.
It is much easier to quantify other factors in crashes such as alcohol involvement or speeding. Through no fault of its own, NHTSA is not able to properly report on a fatal disaster occurring across the country. It is also first to concede its own underestimation. The NOPUS survey estimates that in 2019, 9.7% of drivers were distracted by phones at any given time between 7:00 a.m. and 7:00 p.m. CMT believes that analysis is flawed and doesn’t illustrate the depth and breadth of the current crisis. CMT’s analysis – based on the most accurate and highest volume of telematics data in the United States – shows that during that same period in 2019, 41% of all trips had significant levels of phone distraction.
This more accurate calculation better reveals a very serious threat for the loss of life and significant property damage over the next five years, as smartphones become even more pervasive in our society. This is a threat that must be addressed immediately and effectively to save tens of thousands of lives and billions of dollars.
Looking at how the country fought to reduce drunk driving fatalities and crashes, there are four main pieces to a successful strategy to change behavior: public information campaigns, tough laws, active and visible enforcement, and public/private partnerships. These four pillars saw crashes and deaths attributed to drunk driving fall significantly over a decade, even while more and more cars were on the roads.
A similar approach must be taken to tackle phone distraction; it will be an even more difficult effort, as drunk driving is largely episodic, while using a smartphone is habitual. In Europe, an effort built with these four factors has led to real success: countries across the European Union share data, enforce a consistent slate of laws, and have made a priority out of changing behavior.

48CONCLUSION & RECCOMENDATIONS
To date in the United States curbing that habitual phone distraction while driving has been left to state governments. The result is a confusing patchwork of laws spread across the country that have shown few results in consistent behavior change. In CMT’s analysis, three out of the four states that recently enacted hands-free laws showed significant regression in phone distracted driving improvement just 90 days after the law was enacted.
There is significant data to show that sustained behavior change is possible. In each of the past city-wide Safest Driver contests, drivers who were engaged with a telematics program showed consistent and sustained improvement in reducing phone distraction. This technological solution, created by telematics providers like CMT and administered through auto insurers, is proven to combat the rapid rise of distracted driving through machine learning, IoT devices and smartphones, and behavioral science using incentives and rewards.The stakes are high: on the current trajectory in the U.S., by 2025 more than 20,000 lives and $150 billion will be lost due to phone distraction while driving. The best solution to reducing phone distraction while driving is ready to be adopted now: insurers are building telematics programs with attractive incentives, and driver demand for those programs has never been higher. The best way to combat phone distraction behind the wheel right now is telematics-based insurance programs. Drivers save money and become safer drivers, insurers reduce their losses by curbing avoidable crashes and deaths, and the roads become safer for all those who travel on them, a clear public good.
49
References
American Psychological Association. (2006, February). Driven to Distraction. Apa.org. https://www.apa.org/research/action/drive
Cambridge Mobile Telematics. (2019, October). Worldwide Attitudes Toward Connected Insurance. Cambridge, MA; CMT.
Cambridge Mobile Telematics. (2017). Connected Insurance Market Survey 2017: U.S. Cambridge, MA.
Cambridge Mobile Telematics. (2109). Connected Insurance Market Survey 2019: U.S. Cambridge, MA.
City of Boston. (2019). Boston’s Safest Driver, 2019 Competition Overview and Results. Boston.gov; The Mayor’s Office of New Urban Mechanics.
Dingus, T. A., Guo, F., Lee, S., Antin, J. F., Perez, M., Buchanan-King, M., & Hankey, J. (2016).
Driver crash risk factors and prevalence evaluation using naturalistic driving data. Proceedings of the National Academy of Sciences of the United States of America, 113(10), 2636-2641. https://doi.org/10.1073/pnas.1513271113
Discovery. (2018). Discovery Integrated Annual Report, 2018. South Africa; Discovery. https://www.discovery.co.za/assets/discoverycoza/corporate/investor-relations/integrated-annual-report-2018.pdf
Distracted driving, Governors Highway Safety Association. (2000). GHSA.org. https://www.ghsa.org/state-laws/issues/distracted%20driving
Domo. (2019) Data Never Sleeps on Learn Center. [Online]. Available: domo.com/learn/data-never-sleeps-7
DriversEd.com. (2015, December). Driving Under the Influence: Do Strict DUI Laws Really Work? https://driversed.com/trending/driving-under-the-influence-do-strict-dui-laws-really-work/
El-Guebaly N. (2005). Don't drink and drive: the successful message of Mothers Against Drunk Driving (MADD). World psychiatry: Official Journal of the World Psychiatric Association (WPA), 4(1), 35–36.
Federal Highway Administration. (April 2020). VISION ZERO SUCCESS STORY — BEHAVIORAL - Safest Driver Contest — Boston, Massachusetts https://safety.fhwa.dot.gov/zerodeaths/docs/Boston_Safest_Driver_Final_508.pdf
Gershowitz, A. M. (2011). “12 Unnecessary Men: The Case for Eliminating Jury Trials in Drunk Driving Cases.” Faculty Publications. 1256. https://scholarship.law.wm.edu/facpubs/1256
Insurance Information Institute. (2017). “Fatal Crashes Involving Distracted Drivers, 2017”. https://iii.org/table-archive/23890
International Transport Forum. (2019, October). Road Safety Annual Report, 2019. International Road Traffic and Accident Database. Paris, France: Organisation for Economic Co-operation and Development.
International Transport Forum. (2019, October). Road Safety Annual Report, 2019: USA. International Road Traffic and Accident Database. Paris, France: Organisation for Economic Co-operation and Development.
City of Boston. (2019). Boston’s Safest Driver, 2019 Competition Overview and Results. Boston.gov; The Mayor’s Office of New Urban Mechanics.
Miles, J. (2017, December). “The right app rewards to boost motivation.” Medium. https://medium.com/googleplaydev/the-right-app-to-boost-motivation-c1ec86390450
The Nation’s Distracted Driving Laws Ranked by State. (n.d.). https://www.siegfriedandjensen.com/studies/distracted-driving-laws-by-state/
National Highway Traffic Safety Administration. (2018, April). Distracted driving, 2016. Traffic Safety Facts Research Note. Report No. DOT HS 812 517. Washington, DC: National Center for Statistics and Analysis.
National Highway Traffic Safety Administration. (2019, April). Distracted driving in fatal crashes, 2017. Traffic Safety Facts Research Note. Report No. DOT HS 812 700. Washington, DC: National Center for Statistics and Analysis.
National Highway Traffic Safety Administration. (2019, October). 2018 fatal motor vehicle crashes: Overview. Traffic Safety Facts Research Note. Report No. DOT HS 812 826. Washington, DC: National Center for Statistics and Analysis.
National Highway Traffic Safety Administration. (2019, October). Driver Electronic Device Use in 2018. Summary of Statistical Findings. Report No. DOT HS 812 818. Washington, DC: National Center for Statistics and Analysis.
National Safety Council. (March 2017). Estimating the Costs of Unintentional Injuries, 2015. https://www.nsc.org/Portals/0/Documents/NSCDocuments_Corporate/estimating-costs.pdf
Retting, R., and Sam Schwartz Consulting. (2019, February). Pedestrian Traffic Fatalities by State: 2018 Preliminary Data. Governors Highway Safety Administration.
Richter, Ganit & Raban, Daphne & Rafaeli, Sheizaf. (2015). Studying Gamification: The Effect of Rewards and Incentives on Motivation.
Road safety twinning project links 12 countries. (2019, November). https://ec.europa.eu/newsroom/move/item-detail.ctm?item_id=663001
Total fatalities in drunk driving crashes. (n.d.). SlideServe; US Department of Transportation, National Highway Traffic Safety Association, Federal Highway Administration. slideserve.com/griffin-mayer/total-fatalities-in-drunk-driving-crashes
United States Department of Transportation. (2016, June). U Drive. U Text. U Pay., Traffic Safety Marketing. Trafficsafetymarketing.gov. https://www.trafficsafetymarketing.gov/get-materials/distracted-driving/u-drive-u-text-u-pay

50
Since its first product launch in 2012 that pioneered mobile usage-based insurance, CMT has become the world’s leading telematics and analytics provider for insurers, rideshares, and fleets. CMT’s DriveWell platform uses mobile sensing and behavioral science to measure driving risk and incentivize safer driving, while its Claims Studio reduces the claims cycle time with real-time crash detection, crash reconstruction, and damage assessment using telematics and artificial intelligence.
CMT has more than 50 active programs with insurers and other partners, improving safety for millions of drivers every day around the world. Started based on research at MIT and backed by the SoftBank Vision Fund to fuel its rapid growth, CMT is headquartered in Cambridge, MA.
© 2020 Cambridge Mobile Telematics
CMT’s mission is to make the world’s roads and drivers safer.