The Growth Impact of Language Standardization
39
The Growth Impact of Language Standardization: Metcalfe’s Law and the Industrial Revolution Leonard Dudley (Université de Montréal) and Christopher Rauh (University of Cambridge) January 13, 2020 During the Industrial Revolution, did population growth stimulate innovation, or did causality run primarily from innovation to growth? Previous research fails to explain why between 1700 and 1850: (i) most innovation originated in three clusters of cities in Britain, northern France, and the USA; (ii) the rate of urbanization in these innovating regions was greater than it was elsewhere; (iii) the most important innovations involved cooperation between co-inventors with different areas of specialization. The key, we suggest, was the existence, for the first time in history, of rapidly expanding networks of people able to write and speak standardized languages. Metcalfe’s (2013) Law states that the value of a network grows as the square of the number of its users. We find that the presence in 1700 of a monolingual dictionary describing a language which considerable numbers of people were able to read and speak was significant in determining a city’s subsequent innovation. In turn, innovation – especially cooperative innovation – was significant in explaining a city’s population growth. 1. The Question Does economic growth stimulate innovation or does causality run rather from innovation to growth? Between 1700 and 1850, as mean temperatures in Western Europe rose, its population of doubled. 1 Simultaneously, there was a virtual explosion of innovation in the West: historians of technology have identified over one hundred important new techniques during this period (see Appendix I). Did these technologies suddenly allow given resources to support a much larger population? Or did more rapid demographic growth provide a greater opportunity for improvements to existing techniques? 1 Estimate based on Maddison (2007, 376).
Transcript of The Growth Impact of Language Standardization

The Growth Impact of Language Standardization:
Metcalfe’s Law and the Industrial Revolution
Leonard Dudley (Université de Montréal)
and Christopher Rauh (University of Cambridge)
January 13, 2020
During the Industrial Revolution, did population growth stimulate innovation, or did
causality run primarily from innovation to growth? Previous research fails to explain why
between 1700 and 1850: (i) most innovation originated in three clusters of cities in
Britain, northern France, and the USA; (ii) the rate of urbanization in these innovating
regions was greater than it was elsewhere; (iii) the most important innovations involved
cooperation between co-inventors with different areas of specialization. The key, we
suggest, was the existence, for the first time in history, of rapidly expanding networks of
people able to write and speak standardized languages. Metcalfe’s (2013) Law states that
the value of a network grows as the square of the number of its users. We find that the
presence in 1700 of a monolingual dictionary describing a language which considerable
numbers of people were able to read and speak was significant in determining a city’s
subsequent innovation. In turn, innovation – especially cooperative innovation – was
significant in explaining a city’s population growth.
1. The Question
Does economic growth stimulate innovation or does causality run rather from innovation to growth?
Between 1700 and 1850, as mean temperatures in Western Europe rose, its population of doubled.1
Simultaneously, there was a virtual explosion of innovation in the West: historians of technology
have identified over one hundred important new techniques during this period (see Appendix I). Did
these technologies suddenly allow given resources to support a much larger population? Or did more
rapid demographic growth provide a greater opportunity for improvements to existing techniques?
1 Estimate based on Maddison (2007, 376).

2
Previous explanations of economic growth in the West between 1700 and 1850 have generally fallen
into one of two groups. A first set of studies has emphasized the impact of innovation on growth;
namely, through cultural and institutional forces that encouraged entrepreneurship. North (1981,
1990) stressed the importance of institutions that reinforced the rights of property owners and
assured the enforcement of contracts. Similarly, Acemoglu and Robinson (2012, 82) pointed to the
emergence of “inclusive” political institutions as the keys to Britain’s economic success. Whereas
Weber (1905/1992) had emphasized religion, Landes (1998, 219) widened the definition of
contributing institutions to include Britain's individualistic culture. For Mokyr (2002, 34; 2017,
121), to innovate a society had to have an ideology that favored new ways of practical thinking.
McCloskey (2010) asserted that a cultural change leading to the social approval of markets and
business explained modern economic growth, while Clark (2009) emphasized the long-term impact
of a society’s cultural evolution and genetic heritage on economic behavior.
A second group of authors has pointed to the impact of economic growth on the incentive to
innovate. In Britain and America, Allen (2009, 105, 173-175) suggested, a unique constellation of
factor prices created a demand for the mechanization of manufacturing. With the expansion of
Britain’s foreign trade, the relative cost of skilled labor rose. Because of the country’s abundant
energy resources in the form of coal and falling water, it became profitable to develop new
technologies that replaced labor with powered machinery. However, in Asia, Pomeranz (2000, 62-
63) argued, abundant labor and scarce alternative power sources, precluded the application of such
energy-using technologies. More recently, Desmet, Greif and Parente (2019) asserted that not factor
prices but the degree of intercity competition capable of offsetting guild monopolies determined the
rate of innovation. Such spatial competition was more intense in England than in China after 1700
because of more rapid English urban growth.
However, some additional factor would seem necessary to explain why the first Industrial
Revolution was so tightly constrained geographically, so sudden, and to date at least, permanent. A
detailed examination of more than 100 of the key innovations between 1700 and 1850 reveals three
characteristics that have not been adequately explored previously. First, as we show in the next
section, roughly 90 percent of these new technologies were developed in three clusters of cities in
Britain, its American offshoot and northern France – regions that had contributed few innovations
over the previous two centuries (Daumas, 1980). Second, the cities and towns of these regions grew
considerably more rapidly than their counterparts elsewhere in the West, despite the fact that other

3
than London and Paris, neither Britain nor France had previously experienced very large urban
centers. Third, the most important of these new technologies involved prolonged cooperation
between two or more individuals – a trend that has continued well beyond 1850 (see, for example,
Vuola and Hameri, 2006) – although there had been very few previous documented examples of
successful joint innovation in the West2.
One is tempted to ask what might have changed in Britain, its American colonies and northern
France – but not elsewhere – during the decades prior to 1700. One learns that in 1658, Edward
Phillips authored the first privately published monolingual dictionary of the English language. Over
the following four decades, The New World of English Words would be published in four further
editions (Jackson, 2002, 36). Some two decades after Phillips, in 1680, Pierre Richelet published an
analogous document for the French language that was smuggled into France from Geneva. These
two dictionaries constituted in effect descriptions of how educated people talked and wrote in
London and Paris, respectively, at that time. It would take another century or more before equivalent
dictionaries were published in most other European languages (see Appendix II).
How might standardizing a language facilitate innovation? In addition to allowing people in general
better to understand one another, a standard tongue may have played two other critical roles. First,
unlike regional dialects, a standard language tends to be reshaped by what Kloss (1967, 29) has
called “ausbau”; that is, reshaping for specific purposes, such as education, science, and technology.
When two technicians discussed their work, for example, they would generally need to use a
standard language because their local dialects lacked the necessary vocabulary (Joseph, 1987, 79).
Second, imagine two strangers meeting. Empirical studies have shown that the crucial issue for each
person is whether the other can be trusted (Wojciszke et al., 1998; Fiske et al., 2007). Experiments
by Lev-Ari and Keysar (2010) indicate that one of the measures people use to evaluate
trustworthiness is accent: the stronger one’s accent, the less credible one sounds. Moreover, this
conclusion applies not only to those using a second language but also to those speaking variants of
the same language (Sumner and Samuel, 2009; Sumner, 2015).
These arguments are consistent with recent studies suggesting that the emergence of standardized
languages – defined as the accepted use of a variety of speech with a codified written form – may
2 The most famous prior example of joint innovation -- the partnership between Gutenberg and Fust -- had ended up in
court, with the latter suing the former for misuse of funds (Rees, 2006, 11).

4
have played an important role in economic change over the modern period. Dittmar (2011) showed
that the diffusion of the printing press was significant in explaining European urban population
growth between 1500 and 1800. Sasaki (2017) found that the timing of the acquisition of the printing
press explains the great dispersion in the dates of language standardization across the regions of
Western Europe. Dudley (2017) provided evidence that the date of publication of a country’s first
monolingual dictionary helps explain the timing of innovation in cities of the West. Might language
standardization, as indicated by the presence of a monolingual dictionary, have been a “mediator”
that transmitted the effects of Gutenberg’s invention to the industries whose rapid growth
characterized the Industrial Revolution?
There is one strong objection that might be raised to a possible causal link between the early English
and French dictionaries mentioned above and subsequent economic growth in Britain and France.
The data set for Dudley’s (2017) study excluded regions of the West in which there were no
important innovations; notably, Spain and most of Italy. However, as the next section will show,
there had been somewhat earlier monolingual dictionaries published in both of these present-day
countries. If standardization was important for innovation, why did the early monolingual Italian
and Spanish dictionaries not trigger rapid growth?
The goal of the present exercise is to extend Dudley’s (2017) study of language standardization and
innovation to cover their impact on economic growth. In the next section, we begin by outlining the
main features of innovation and urban growth in the West during the Industrial Revolution. We
show that the most important innovations identified by economic historians were concentrated in
three clusters of rapidly growing cities. Rates of urban population growth across countries were in
turn strongly correlated with innovation rates. To explore why some early monolingual dictionaries
failed to trigger rapid innovation and growth, we refer to Metcalfe’s (2013) Law, which states that
the value of a network increases with the square of the number of its users.
Section 3 then specifies a two-part estimation procedure to explain urban growth. The first part
proposes a means of predicting the location of innovation while taking account of the large number
of localities with zero contributions. The second part then proposes a means of testing whether the
number of innovations so explained can account for observed differences in population growth
between cities.

5
In Section 4, we estimate the innovation equation, distinguishing between non-cooperative
innovations (those with a single inventor) and cooperative innovations (those having two or more
inventors). As in Dudley (2017), the data set consists of 117 important innovations and the
populations of 251 European and North American cities, at intervals of 50 years between 1700 and
1850. The results of these estimates confirm that language standardization was important as a
possible explanation for both types of innovation, but particularly critical for cooperative
innovation. This cooperative innovation in turn was one of the principal sources of urban growth
during the Industrial Revolution.
It is reasonable to suppose that the ability to speak in a standard tongue facilitated the technical
communication and trust that were necessary for successful cooperation. Accordingly, in Section 5,
we use the presence of a monolingual usage dictionary in 1700 as an instrument to test the direction
of causality between innovation and growth.
6
2. The Geography of Innovation, Urbanization and Language Standardization
In this section, we begin by describing a set of innovations that historians of technology have
identified as being important and identifying the regions in which they were developed. We then
compare innovation rates and annual rates of urbanization across the innovating regions. Finally,
we note that the key innovations involved cooperation between individuals with different
specializations in the states which had standardized languages.
(a) The Innovation Space
An important dimension of the Industrial Revolution was a series of technological improvements
that raised worker productivity. Moser (2005) used patent data from the middle decades of the
nineteenth century to measure innovative activity. However, if we are interested in earlier periods,
we must recognize that patent data provide neither a reliable measure of innovative efforts nor an
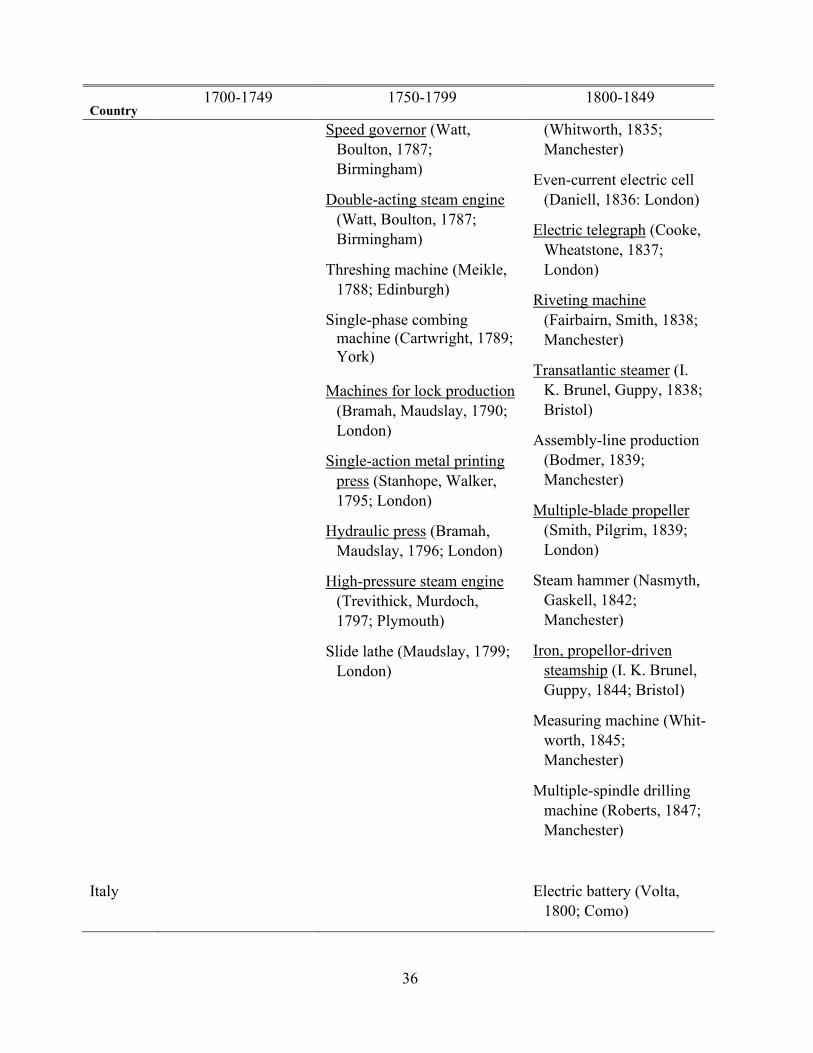
indication of their economic impact (MacLeod and Nuvolari, 2016, 82-83). Following Dudley
(2017), we have therefore selected a set of innovations between 1700 and 1850, each of which was
mentioned by at least two prominent historians of technology. By this criterion, using studies by
Donald Cardwell (1991), Maurice Daumas (1979) and his associates, Joel Mokyr (1990) and Akos
Paulinyi (1989) and the contributors to the Encyclopedia Britannica, we identify the 117 innovations
listed in Appendix I that were particularly significant. The regions in which these innovations were
developed constituted what might be called an “innovation space” – an area that accounted for
virtually all the world’s important innovations over a century and a half.3
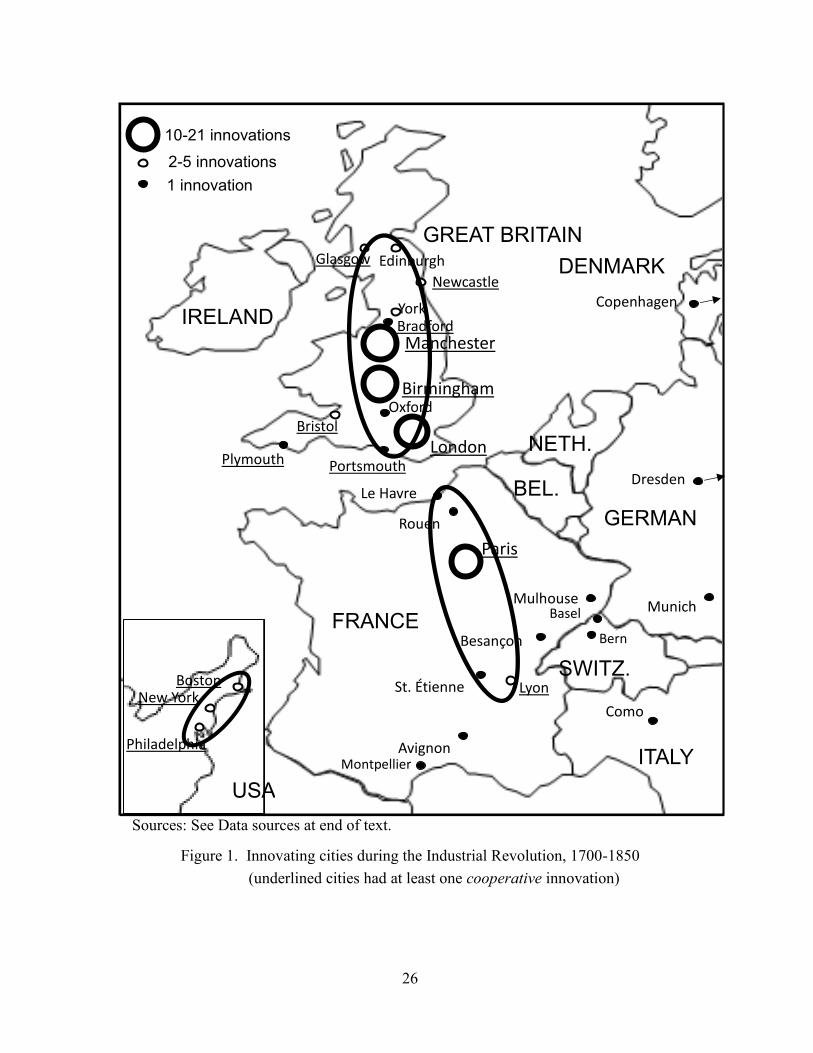
Let us examine the regions in which these innovations originated. The innovation space contained
251 urban centers with populations over 5,000 in 1700. Yet all the selected innovations were
concentrated in the areas surrounding only 30 of these cities, as Figure 1 indicates. It is perhaps not
surprising that the two largest cities by far, the national capitals of England and France, with
populations of one-half million or more in 1700, each had ten or more innovations over the
following century and a half. However, Birmingham and Manchester, small towns with populations
3 In addition to Great Britain, France, Belgium, the Netherlands, German, Switzerland and Denmark, the European
portion of this space is defined to include northern Italy and western Austria. Each innovation was assigned to the closest
city that had over 5,000 residents in 1700.

7
of well under 10,000 in 1700, together had more innovations than the two national capitals over the
same period.
A closer look at the geography of the North Atlantic as displayed in Figure 1 reveals a remarkable
fact. Over 90 percent of the European innovations were generated within two clusters, each roughly
100 miles (160 km) wide and 400 miles (640 km) long in Great Britain and France. One of these
regions stretched from the Portsmouth to southern Scotland, while the other extended from Le Havre
through Paris to Lyon. A similar oval along the northeast coast of the United States, from Boston to
Philadelphia, accounted for all the significant innovations outside Europe.
Evidently, during the century and a half after 1700, something was occurring within these clusters
of cities that had not yet touched the rest of the world.
(b) Innovation and Urban Growth
How was this innovation activity related to urban growth? Figure 2 presents the relationship between
innovation and urbanization between 1700 and 1850 for the nine present-day European states within
our innovation space. As the horizontal axis shows, rates of innovation per capita were highest in
Great Britain and the United States. Note also that the innovation rate of France was much higher
than that of Germany. Two other countries – Switzerland and Denmark – also had appreciable rates
of innovation. However, Austria, Italy, Belgium and the Netherlands had negligible innovation.
A convenient measure of urban growth is the difference between the average annual rate of
population growth in cities of more than 5,000 inhabitants and the population growth rate for the
present-day country as a whole. We see that this rate of urbanization, measured along the vertical
axis in Figure 2, was positive for the three countries with significant numbers of innovations –
Britain, the USA and France. Switzerland and Germany also had positive rates of urbanization.
However, in the remainder of innovation space – Austria, Belgium, Denmark, Italy and the
Netherlands – the population of the cities increased less rapidly than that of the countryside and the
smaller towns, indicating disurbanization.
The trend line in Figure 2 suggests the presence of a strong positive relationship between innovation
and urbanization. In the three countries with clusters of innovating cities the rate of urbanization
was positive. However, in the four countries with negligible rates of innovation – Austria, Italy,

8
Belgium and the Netherlands – the urban regions increased their population less rapidly than the
rural regions. What might the latter states have lacked that was present in Britain, the USA and
France?
(c) Cooperation and Language Networks
The data on innovation and urbanization in Figure 2 suggest the presence of some additional factor
that may have been overlooked in previous studies of the Industrial Revolution. It is helpful to
disaggregate our sample of 117 notable innovations into two categories, as summarized in Appendix
III. A first group comprises 54 technologies that may be termed cooperative innovations (CIs). In
each case, the available biographical information permits identification of both a principal and at
least one unrelated collaborator who made a significant contribution. From the biographies, one may
suggest that had the other individual(s) not participated in the development of these innovations, the
technologies would not have been successful. These cooperative innovations tended to be relatively
complex, requiring the integration of distinct areas of specialization. The names of the cities in
which these cooperative innovations were developed are underlined in Figure 1. All were in Britain,
northern France, and the USA.
The second category consists of non-cooperative innovations (NCIs) – those for which only a single
inventor may be identified. These inventions tended to be conceptually simpler than the CIs; for
example, John Kay’s flying shuttle, James Hargreaves’s spinning jenny and Edmund Cartwright’s
wooden power loom. Like the cooperative innovators, however, these independent inventors
depended on the trust of their suppliers, employees, and customers. It might be noted that Britain,
France, and the United States accounted for 90 percent of these NCIs.
Might this evidence of the clustering of innovative behavior, particularly cooperative innovation,
suggest that people within the urban groupings centered in London and Paris had a means of
communicating that was missing, at least temporarily, in the rest of the West? The strong demand
for the monolingual dictionaries of Edward Phillips (1658) and Pierre Richelet (1680) prior to 1700
indicates the presence in Britain and France of networks of people sharing a common tongue. Note
that these were usage dictionaries that reflected the way educated people wrote and spoke in London
and Paris, respectively.

9
As mentioned in the introduction, there were two monolingual dictionaries published even earlier,
but outside what we defined above as the innovation space. The latter were prescriptive dictionaries,
providing guidelines for writers in Castilian and Tuscan dialects. One was Sebastián de Covarrubias’
El Tesoro de la lengua castellana o Española. Published in 1611, the Tesoro was an etymological
dictionary devoted to the origin of words in the Castilian dialect. Intended primarily for specialists
who spoke Latin rather than the general reader, it excluded many common words, while even those
words included were sometimes spelled differently at different places in the text (Carriazo Ruiz and
Mancho Duque, 2003, 222-223). The initial print run was for only 1,000 copies and it was not
reprinted for over half a century (Alvar Ezquerra, 2011, 73).
A second early monolingual dictionary was the Accademia della Crusca’s Vocabolario of the
Florentine dialect. Published in 1612, this document was intended to provide a prescriptive norm to
which Italian writers were advised to conform. It was based primarily on the style of the fourteenth-
century Florentine writers, Dante, Petrarch and Boccaccio (Vincent, 1990, 280). From its first
appearance, this dictionary was criticized for its archaisms and for its exclusion of common words
and technical vocabulary (Polimeni, 2019, 118-119). Not until more than a decade after Italian
unification in 1861 was a true “usage” dictionary reflecting the speech of contemporary Florentine
residents published (Ibid., 120).
Why might the publication of a monolingual dictionary have stimulated innovation and urban
growth in some societies but not in others? Drawing on the contributions of earlier linguists, John
Earl Joseph has identified four criteria that help determine the norms of a standardized language:
namely, geographic, literary, aristocratic, and democratic. The “tool of standardization” of these
norms, he suggests is the dictionary, which codifies of “an ideal, devoid of real existence” (Joseph,
1987, 161). In the cases of interest, it is generally recognized that all four of the dictionaries
mentioned in this section satisfy the first three of these criteria: they embody the form of the
language considered to be the purest (geographic); they contain the variant used by the best authors
(literary), and the dialect used by the highest social classes (aristocratic)4.
Consider however, the fourth, democratic, criterion; that is, the demand for standardization. To be
conservative, let us assume that in 1700 the literacy rates in London, Paris, Madrid, and Florence
4 Baugh and Cable, 1993, 18.

10
were identical to those of the regions comprising the corresponding present-day countries in that
year. Furthermore, assume that the literate and only the literate in those cities spoke the dialect of
the first monolingual dictionaries. In a network of n people, each person can communicate with n-
1 others. The total number of possible unidirectional transmissions is therefore n(n-1). Accordingly,
it may be seen that the potential value of such a network increases with the square of n, a formulation
which has become known as Metcalfe’s Law. Metcalfe (2013) showed that this relationship
accurately predicted the revenue growth of Facebook as the number of its users rose.
The challenges for the Castilian and Tuscan languages in 1700 were twofold. First, the small size
of each language’s population base, shown in column (2) of Table 1, limited the possible interaction
between native speakers and those visiting from other regions. Second, the low literacy rates
displayed in column (3) indicate that the education system could play only a limited role in language
standardization. As a result, we see in column (5) that the potential values of the language networks
of Britain and France in 1700 were at least 150 times greater than those of Italy and Spain. Of course,
not all such links would have been be activated, but these results provide a first approximation to
the possibility that two people with complementary abilities could come into contact with each other
in these societies5.
Table 1. Monolingual dictionaries in 1700 as measures of language standardization
Country
City where
dictionary
published
Population of
city in 1700
Country
literacy rate
in 1700 (%)
Estimated
number of
literate
Square of
number of
literate
(1) (2) (3) (4) (5)
Great Britain London 575,000 33 189,750 36.0 x 10⁹
France Paris 500,000 25 125,000 15.0 x 10⁹
Italy Florence 72,000 13 9,360 0.087 x 10⁹
Spain Madrid 140,000 7 9,800 0.096 x 10⁹ Sources: See “Data Sources” at the end of the text.
Might the early lead of Britain and France in language standardization help explain their precocity
in experiencing rapid urban economic growth, as shown in Figure 2? Support for this possibility is
suggested by the correlation coefficients displayed in Table 2. Over the three half-centuries between
1700 and 1850, the number of innovations that a society developed was correlated significantly with
language standardization, as measured by whether its residents had a monolingual usage dictionary
5 This networking hypothesis would help to explain the results of Squicciarini and Voigtländer (2015) showing that
the density of subscriptions to the mid-18th century Encyclopédie is a strong predictor of city growth after the beginning of French industrialization.
11
in 1700. The number of innovations was in turn highly correlated with the increase in the city’s
population in the same period.
Was the standardization of national languages really a necessary condition for potential innovators
to be able to communicate with one other? As Mokyr (2019, 170) pointed out, by 1600 the
widespread use of Latin in Western Europe had permitted a “Republic of Letters” among
intellectuals, in which ideas circulated freely across state borders. He asserted that attitudes toward
transforming the material environment developed in the seventeenth century were instrumental in
preparing the “Industrial Enlightenment” that followed (Ibid., 221). Yet it should be noted that like
most of their fellow innovators, neither of the two most prolific partners in the list of Appendix I –
Matthew Boulton and James Watt – had benefited from a post-secondary education6. Few of the
other inventors in the table would have been able to communicate fluently in Latin.
It could nevertheless be argued that language standardization was simply one facet of the
harmonization of institutions that was possible within a large, centralized organization. In 1600,
England and France were both large states ruled by strong governments that had centralized power
in their capital cities: London and Paris, with populations of 200,000 and 300,000 respectively, were
the megacities of Western Europe7. At that time, other cultural regions of Western Europe were
divided into small political units characterized by considerable local autonomy. Accordingly, we
should include a measure of the degree of centralization prior to the publication of dictionaries in
our specifications as a possible confounding factor.
In short, there are three key features of the first Industrial Revolution that the early creation of
vernacular language networks in Britain and France could help to explain: first, the clustering of
innovation in regions centered in London, Paris, and New York; second, the rapid growth of cities
in these regions; and third, the appearance of cooperative innovation almost exclusively in these
areas. In the next section, we specify a two-step procedure to test this hypothesis.
6 In grammar school, Greek and Latin had failed to interest Watt (Tann, 2014, 2), while Boulton had left school by age
fifteen (Uglow, 2002, 24). Their local dialects, Scots and Midland English, were mutually incomprehensible. However,
both men had been educated in standard English thanks to the decision in 1604 of James I, after becoming king of
England, to impose the London dialect for a new translation of the Bible to be used by the churches of each of his
kingdoms (Nicholson, 2003, 59).6 7 The next largest cities in the innovating area of Western Europe were Milan with 120,000 and Rouen with 70,000
residents in that year.

12
3. Modeling Innovation and Economic Growth
To test the hypothesis that language standardization helps explain the location of innovation and
urban growth during the Industrial Revolution, we specify two equations: one for the innovation
process and a second for the urban-growth process.
(a) The Innovation Process
Consider the innovations developed in city i. Assume that innovation occurs when an individual
from that city combines his or her knowledge with the expertise of someone from another city who
speaks the same standardized language. In a given period, let the number of innovations in the city
then be expressed as a function of the exponents of its population, ni, and whether or not its residents
have adopted a standardized language that allows them to communicate with strangers, si.
𝑦𝑖 = exp[𝐶 + 𝛽1𝑛𝑖 + 𝛽2𝑠𝑖].
This equation expresses the expected number of innovations produced in a given period after the
introduction of a standardized language in a form that may be inserted into a Poisson distribution.
The next step is to integrate this approach into a specification that incorporates the institutional-
cultural and factor-price approaches used in previous studies. Define the dependent variable as the
number of innovations of a given type that occurred in the region surrounding a given city during
each half-century between 1700 and 1849. Since such innovations may be considered rare events,
we should use an estimation method appropriate for count data. The variance of this variable in our
sample (0.182) is considerably greater than the mean (0.065). To allow for this over-dispersion (a
greater frequency of zero observations than the Poisson distribution assumes), a negative-binomial
specification is appropriate, since it has an extra parameter to adjust the variance separately from
the mean.
There is another characteristic of the data to consider. Of the 753 observations, there are only 22
with positive values for the number of cooperative innovations. For non-cooperative innovations,
the corresponding figure is 34. The zero-inflated negative binomial model provides a way of
modeling such excess zeros, in addition to allowing for over-dispersion.8 For each observation, there
8 The standard deviation of the number of innovations was six times the size of the mean. A simple tobit specification
was not able to handle this over-dispersion. Although there were 30 cities that actually innovated, tobit estimates were

13
are two possible data-generating processes. For observation i, the first process is chosen with
probability φi and the second with probability 1- φi. The first process generates only zeros using a
logit model. A possible determinant of this selection is the number of innovations in the preceding
period, an indication of dynamic learning effects. The second process generates counts from a
negative binomial model.
In general:
Iijt = 0 with probability φi
(1)
= exp (Xijtβ + 𝜀𝑖𝑗𝑡 + uijt) with probability 1-φi ,
where Iijt is the expected number of innovations in city i of type j (cooperative or non-cooperative)
in period t, Xijt is a vector of explanatory variables, β is a vector of parameters, 𝜀𝑖𝑗𝑡 is a random
variable and exp (𝑢𝑖𝑗𝑡) follows a gamma distribution.
(b) The Urban-Growth Process
We now turn to the process of urban population growth. Let us assume that the change in population
in city i during period t is a function of its initial population, the number of innovations in that city
during the period, and the number of innovations in other cities of the same country, the latter
weighted by the distance from the city in question, an approximate measure of non-linguistic
transaction costs.
∆𝑃𝑖𝑡 = 𝛼1𝑃𝑖0 + 𝛼2𝐼𝑖𝑡 + 𝛾 ∑ 𝑑𝑖𝑗𝐼𝑗𝑡𝑗≠𝑖 + 𝒁𝑖𝑡𝜹 + 𝑣𝑖𝑡 (2)
where Pi0 = population of city i in period 0,
Iit = number of innovations in city i in period t,
dij = distance between cities i and j,
𝒁𝑖𝑡 = vector of other explanatory variables,
𝒗𝑖𝑡 = error term.
positive only for Paris and London, whereas a zero-inflated negative binomial specification predicted that 20 cities
would have more than 0.5 innovations in at least one half-century between 1700 and 1850.
14
Of particular interest are the parameters α2, a measure of the impact of innovation on economic
growth and γ, which captures the externalities whereby all cities in a network benefit from the
innovations in other cities in the same country.
In summary, this section has specified two equations to be estimated empirically. The first equation
uses a zero-inflated negative binomial format to estimate the number of innovations in a given city
during the three half centuries between 1700 and 1850. The second equation, to be estimated by
ordinary least squares with an adjustment for robust clustered standard errors, assesses the effect of
these innovations on the city’s population growth.

15
4. Explaining Innovation
The analysis of the preceding section suggested two steps to explain the appearance of rapid growth
in clusters of innovating cities during the Industrial Revolution. The present section presents the
estimates for the first step, explaining the development of new technologies in 251 urban areas of
Western Europe and North America.
In Table 3, we see the results when the zero-inflated negative binomial specification of equation (1)
in the preceding section is applied to our data set. Since city population is available only at 50-year
intervals, observed innovations are grouped into the three half-centuries between 1700 and 1850.9
In column (1) are estimates for the 54 cooperative innovations (CIs); that is, those with two or more
principals. In column (2) are separate estimates for the 63 non-cooperative innovations (NCIs); that
is, those having a single inventor. Column (3) presents the results for all 117 innovations together.
Note that among the confounding factors we have include a proxy for the initial degree of
centralization; namely, whether the society had a city with a population of 200,000 or more in 1600.
As may be seen in Table 2, language standardization and this centralization variable are significantly
correlated.
The upper section of Table 3 explains the number of new technologies developed in those cities that
had a significant probability of innovating. We see that the impact of language standardization was
important for CIs, indeed, significantly more important than institutional centralization. Since
independent inventors too needed some minimal degree of support from suppliers and clients it is
not surprising that the impact of language was statistically significant, though lower, for NCIs. As
one would expect, larger cities tended to have a significantly greater number of innovations than
smaller ones. Having nearby coal deposits (within 50 km or 31 miles) was also an important factor
favouring innovation for both classes of innovations.
Consider now the lower part of the table which explains why a city or town failed to innovate. The
dummy variables for Britain and France may perhaps be interpreted as a rough measure of cultural
or institutional factors other than language or the degree of centralization; for example, differences
9 Further disaggregation of the observations by date of innovation would unnecessarily complicate the test of causality.
16
in religion as mentioned by Weber (1905)10, patent laws and levels of taxation as emphasized by
North (1981, 28, 164), or attitudes toward “useful knowledge” as suggested by Mokyr (2002, 2017).
The significant positive signs for France suggest that once its national institutions had become
centralized and its language standardized, other cultural and institutional factors had a negative
effect on successful innovation.
In the case of Britain, the country dummy-variable coefficients for CIs and NCIs are both significant
but with opposite signs. The positive sign in column (1) indicates that these other cultural and
institutional factors had a negative effect on the number of joint innovations, though less so than in
the case of France. At the same time, the significant negative Britain dummy variable for NCIs in
column (2) indicates that the country’s culture and institutions had a significant positive impact on
the number of individual inventions. A possible explanation suggested by a comparison of the
inventions in Appendix I is that many cooperative inventions, such as those of Boulton and Watt,
involved high fixed costs that could be recuperated only if patent protection was obtainable to block
competitors, whereas non-cooperative innovation had fixed costs sufficiently low that patent
protection was not necessary to motivate those desiring to improve existing techniques.11 Finally,
the negative coefficients for the two half-centuries beginning in 1750 and 1800 suggest that there
was a significant improvement over time after 1750 in the capacity of many cities to innovate and
therefore less need to inflate the probability of innovation.12
In summary, the results presented in Table 3 are compatible with the simple correlation coefficients
of Table 2. Having taken account of institutional centralization, culture and factor supplies, we find
a significant link running from language standardization prior to 1700 to subsequent innovation.
10 Since between 1700 and 1850, Britain was predominantly Protestant and France was mostly Catholic, while Germany,
Switzerland, the Low Countries, the United States,ion and Ireland had populations of mixed religions, the two country
dummy variables and the constant capture religious differences quite well. 11 In a recent survey, MacLeod and Nuvolari (2016, 82-83) pointed out that at least until the end of the eighteenth
century, the British patent system tended to block innovation in capital-intensive sectors. In other word, culture and
institutions had a negative effect on the number of innovations. However, in other sectors, much of British invention
occurred without patent coverage (MacLeod, 1988, ch. 6); i.e., culture and institutions were favorable to innovation. 12 Note that with the non-linear estimation method used, there is no equivalent of the F test for goodness of fit; however,
the p-values together indicate that the probability that all coefficients are zero is negligible in each column of Table 3.

17
5. Explaining Urban Population Growth
In this part, we turn to the second relationship presented in Section 3; namely, the link between the
number of innovations in a city and its population growth. We begin by evaluating the relative
importance of possible factors explaining urban growth. We then correct for possible feedback from
growth to innovation using the prior presence of a descriptive monolingual dictionary as an
instrumental variable. Finally, we examine the sensitivity of our results to minor changes in
specification.
(a) The Explanatory Equation
Consider first a specification for equation (2) above. The dependent variable is the population
increase in thousands in a given city within a given 50-year period. Column (1) of Table 4 presents
least-squares robust cluster estimates that distinguish the growth impact of the 54 cooperative
innovations (CIs) from those of the 63 non-cooperative innovations (NCIs), but neglect the
possibility of feedback from growth to innovation. We see that CIs in a city had a statistically
significant relationship to population growth while NCIs did not. Moreover, CIs in the country as a
whole, lagged one period, were also statistically significant. The latter result may be interpreted as
an indication of important network externalities from previous major innovations within the same
language area. As for the lagged impact of NCIs, there was no significant effect.
Most of the other explanatory variables in column (1) were not significant; for example, the literacy
rate, whether the city was a capital or an Atlantic port, or whether the city was a printing center in
1500. Nor were distance from the capital, the period dummies, or the France country dummy
variable significant. However, a dummy variable for Paris during the half-century from 1750 to
1799 was negative and highly significant. The city had grown rapidly until 1789, but emigration of
the nobility and the economic hardships due to the Revolution led to an absolute fall in the city’s
population over the following decade (Fierro, 1996, 218-283). It is interesting to note that coal
deposits did not have a direct impact on urban growth. Their influence, as shown in Table 3, seems
to have been indirect – through the incentive to innovate. As for the results in column (2) lumping
all 117 innovations together, they are consistent with the preceding analysis.
18
(b) Instrumental-variable Estimates
However, correlation need not imply causality. Accordingly, in columns (3) and (4) of Table 4 we
use an instrumental-variable (IV) procedure to test for possible feedback from population growth to
innovation. If, as explained in Section 1, having a standard language facilitated the communication
and trust necessary for successful innovation, then the presence of a monolingual usage dictionary
in 1700 may serve as an instrument for the number of subsequent innovations in a city. There are
two necessary conditions for using instrumental variables. First, the instrument must be significantly
strong as measured by its correlation with the endogenous variable it replaces. The correlation
coefficients of the instrument, “Standard language”, with “All innovations”, “Cooperative
innovations” and “Non-cooperative innovations” are 0.19, 0.16 and 0.17 respectively, all significant
at the 0.01 level. Second, the instrument must satisfy the exclusion restriction; that is, it must not be
correlated with the error term in the explanatory equation. The correlation coefficients of “Standard
language” with the residuals of equations (1) and (2) of Table 4, are 0.008 and 0.018 respectively,
neither of which is significant at the 0.01 level. Accordingly, language standardization as measured
by the existence of a monolingual dictionary, satisfies the preconditions for IV estimation.
Compare, then, the IV estimates in column (3) of Table 4 with those of the explanatory equation in
column (1). In the former, the observed values of cooperative and non-cooperative innovations
have been replaced by estimates calculated from columns (1) and (2) of Table 3, in effect using the
presence of a monolingual dictionary in 1700 as instrument. Not only are the IV estimates for the
impact of cooperative and non-cooperative innovations (CIs and NCIs respectively) in a given city
positive, but also, they are significantly greater than those of the evaluation-equation estimates in
column (1). Other things being equal, a CI in a city was accompanied by a population increase of
almost 44,000 during the same half century, while a non-cooperative innovation caused population
to grow by some 32,000. A comparison of columns (4) and (2) of Table 4 leads to a similar
conclusion for all innovations. We see that there was apparently negative feedback from growth to
innovation. An increase in the number of residents in a city would appear to have reduced the
number of innovations, other things being equal!
Why might feedback from population growth have reduced the number of innovations in a city? A
comparison of simple averages of innovations by city size for the 30 centers that generated positive
innovations between 1700 and 1750 suggests a possible explanation. The first two lines of Table 5
19
show that over the century and a half in question, the 25 smaller innovating cities with populations
under 50,000 generated on average 36 innovations per 100,000 inhabitants. Well over half of these
innovations were cooperative. Meanwhile, the five larger innovating cities generated on average
only 3 innovations per 100,000 of population, over two-thirds of which were non-cooperative.
Not only did having a large population considerably reduce a city’s rate of innovation, but also large
size discouraged cooperative innovation considerably more than non-cooperative innovation. A
possible explanation is that under the transportation and communications technologies of the period,
larger cities implied higher transactions costs than their smaller neighbors. These higher costs of
interacting within the largest centers appear to have been especially costly for groups of individuals
who needed to combine their individual skills in order to generate novelty. Note, however, that
almost all these cooperative innovations were in the standardized-language clusters of Figure 1.
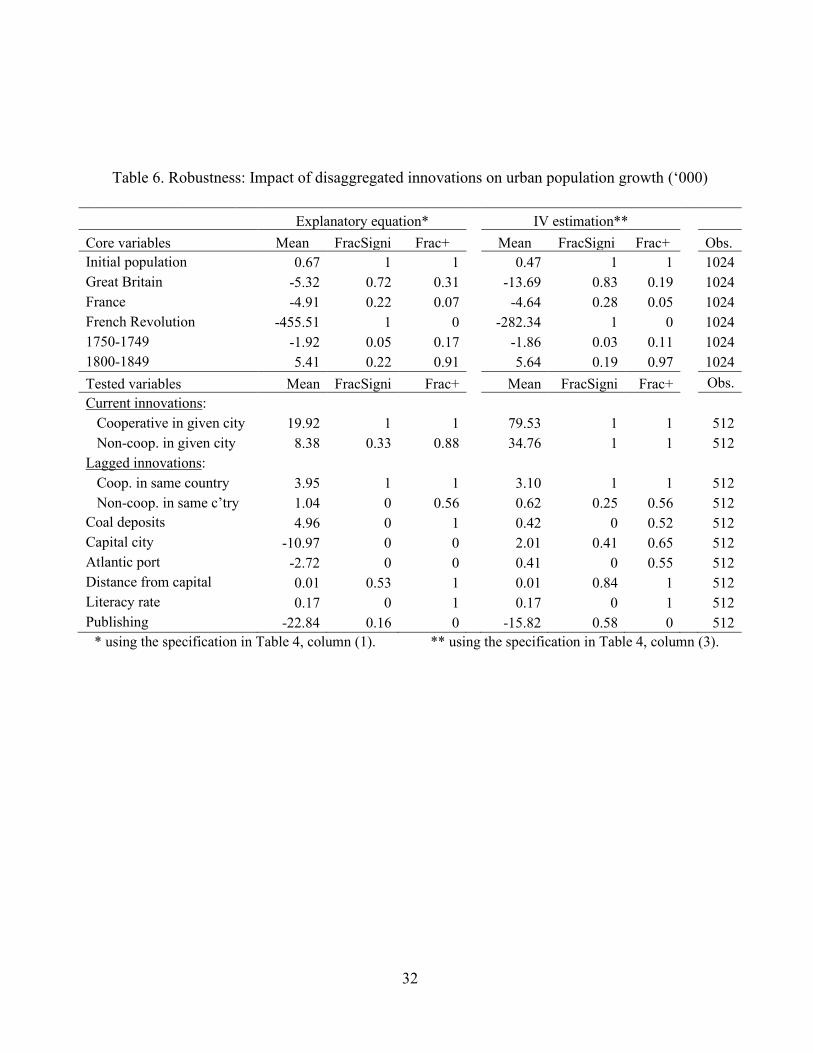
(c) Robustness
How sensitive are the results of the disaggregated specifications in columns (1) and (3) of Table 4
to the inclusion of certain explanatory variables rather than others? In the robustness tests reported
in Table 6, the six core variables appear in all of the specifications. Each of the remaining tested
explanatory variables appears in one specification for every possible combination of all but one of
the other tested variables. The results for the IV estimates indicate that the coefficients of
cooperative and non-cooperative innovations in a given city remain consistently positive and
significant. In both cases, the differences in the means of the coefficients suggest negative feedback
from population change to innovation. As for lagged innovations, the IV estimates indicate that the
impact of cooperative innovations from the preceding half-century was consistently positive and
significant. The remaining results show that the positive effect of initial population and the negative
effect of the French Revolution are also quite robust. However, the effects of all of the other
explanatory variables are fragile, depending on the specification.
In summary, the initial explanatory-equation estimates support the hypothesis of a significant
positive relationship between innovation in a given city, particularly cooperative innovation, and its
population growth. An examination of the question of causation reinforces these findings. There is
no evidence of positive contemporaneous feedback by which a city’s population growth might have
stimulated its rate of innovation. Moreover, cooperative innovations within the boundaries of the
present-day country also promoted a city’s growth in later periods. It may be suggested that the

20
concentration of innovation and rapid population growth in clusters of cities in Britain, France and
the United States between 1700 and 1850 may be explained, at least in part, by the network effects
of language standardization.
21
6. Conclusion
The results of this research are compatible with those of earlier studies, providing support for the
importance of culture, social institutions, and geography in determining economic growth in the
West between 1700 and 1850. However, our estimates also suggest that explicit consideration of
the standardization of the English and French languages helps explain three often-overlooked facts
about innovation and urbanization during this period.
First, the standardization by 1700 of the dialects spoken by educated residents of Western Europe’s
largest cities was significantly related to subsequent innovation in three urban clusters in Britain,
northern France and the USA. Once standardized in written form through the printing press, these
dialects subsequently spread to smaller urban centers. We found the positive effect of language
standardization on innovation to be distinct from the influence of institutional centralization,
changes in relative factor prices and other aspects of national cultures.
Second, the relatively large number of innovations in these three regions between 1700 and 1850 in
turn played a significant role in determining their rapid urbanization. In other regions of the West
with little innovation, cities generally grew less rapidly than rural areas. Moreover, using publication
dates of the first monolingual dictionaries as an instrument for innovation, we found no evidence of
positive contemporaneous feedback from urban population growth to innovation.
Third, a major factor explaining a causal link from innovation to urban growth would appear to have
been the ability of a standard language to facilitate communication between potential innovators
who had different areas of specialization and came from different cities. The contributions of the
resulting “cooperative innovations” – such as the steam engine, industrial chemicals, or production
with standardized parts – to urban growth were significantly greater than those of “non-cooperative”
innovations; that is, those involving a single inventor. Nevertheless, independent inventors too seem
to have benefited from language standardization – possibly because even market-determined
contracts require good faith on the part of all parties.
Our results suggest that Metcalfe’s (2013) Law applies not only to internet networks but also to
language standardization. Squaring the number of users is as helpful in understanding urban growth
during the Industrial Revolution as in explaining the rise in the revenues of Facebook.

22
Data sources
Atlantic port. Hammond Ambassador World Atlas. Union, N.J.: Hammond World Atlas Corp.,
1992.
City population. The sample consisted of cities with populations over 5,000 in 1700 in the
innovation space defined in Section 2(a) of text. Population estimates for European cities were
from Bairoch et al. (1988) as revised by Voigtländer and Voth (2013). Estimates for New York,
Philadelphia and Boston were from Longman Publishing (2019).
Coal. The identification of cities with coal deposits within 30 miles (48 km) was obtained from
Barraclough (1984: 201, 210-211).
Country population. Maddison (2007, 376).
Distances. The driving distance in kilometres to each city from the respective national capital were
obtained from Google Maps, https://maps.google.com/.
GDP. Maddison (2007, 379).
Innovations. See Section 2(a) of text.
Language standardization. Cities in Belgium and Switzerland were assigned the dates of French,
Dutch or German dictionaries, depending on their main languages. As for Scotland, by the year
1700, educated Scots were growing accustomed to using English rather than the Scottish dialect
for formal communication (Herman, 2001, p. 116). A similar argument applies to Ireland only a
century later. In the case of the United States, at least as early as 1666, Phillips’s New World was
being sold in Boston (Considine, 2015, 218).
Literacy. For signature rates at marriage by country, the sources were England: Cressy (1980,
177); Scotland: Stone (1969, 121); France: Houdaille (1977, 68); Germany: Hofmeister et al.
(1998); Italy: Reis (2005, 202); Netherlands: van der Woude (1980, 257-264); Spain: Roser
(2016); United States: Graff (1991, 249).
Printing centers in 1700: Febvre and Martin (1976) and Sasaki (2017).
23
References
Acemoglu, Daron, and James A. Robinson, Why Nations Fail: The Origins of Power, Prosperity
and Poverty. London: Profile Books, 2012.
Allen, Robert C., The British Industrial Revolution in Global Perspective. Cambridge: Cambridge
University Press, 2009.
Alvar Ezquerra, Manuel, “El Tesoro de Sebastián de Covarrubias, primer diccionario monolingüe
del Español,” Académica, 6 (2011), 31-82.
Bairoch, Paul, J. Batou, and P. Chèvre, The Population of European Cities, 800-1850. Geneva:
Librairie Droz, 1988.
Barraclough, Geoffrey, editor, The Times Atlas of World History. Maplewood, N.J.: Hammond,
1984.
Baugh, Albert C. and Thomas Cable, A History of the English Language, fourth edition. London:
Routledge, 1993.
Bell, David A., “Culture and Religion,” Chapter 3 in Old Regime France: 1648-1788, William
Doyle (ed.), 78-104. Oxford: Oxford University Press, 2001.
Cardwell, D. S. L., Turning Points in Western Technology. Canton, MA: Science History
Publications/USA, 1991.
Carriazo Ruiz, J. R. and J. Mancho Duque, “Los comienzos de la lexicografía monolingüe,” en
Antonia M. Medina Guerra (ed.), Lexicografía española. Barcelona: Ariel, 2003, pp. 222-223.
Ciccarelli, Carlo and Jacob Weisdorf, “Pioneering into the Past: Regional Literacy Developments
in Italy before Italy,” European Review of Economic History, 23 (2019), 329-364.
Clark, Gregory, A Farewell to Alms: A Brief Economic History of the World. Princeton: Princeton
University Press, 2009.
Considine, John, “In Praise of Edward Phillips,” Studia Linguistica Universitatis Iagellonicae
Cracoviensis, 132 (2015): 211–228.
Cressy, David, Literacy and the Social Order: Reading and Writing in Tudor and Stuart England.
Cambridge: Cambridge University Press, 1980.
Crystal, David, The Cambridge Encyclopedia of the English Language, Second Edition,
Cambridge, Cambridge University Press, 2003.
Daumas, Maurice, A History of Technology and Invention, Volume III, The Expansion of
Mechanization, 1725-1860. New York: Crown Publishers, 1979.
Daumas, Maurice, A History of Technology and Invention, Volume II, The First Stages of
Mechanization, 1450-1725. London: John Murray, 1980.
Desmet, Klaus, Avner Greif and Stephen L. Parente, “Spatial Competition, Innovation and
Institutions: The Industrial Revolution and the Great Divergence.” Journal of Economic
Growth, 2019, pp 1–35, https://doi.org/10.1007/s10887-019-09173-3
Dittmar, Jeremiah E., “Information Technology and Economic Change: The Impact of the Printing
Press,” Quarterly Journal of Economics (2011) 126, 1133–1172.
Dudley, Leonard, “Language Standardization and the Industrial Revolution”, Oxford Economic
Papers, 69:4 (2017), 1138–1161.
Febvre, Lucien and Henri-Jean Martin, The Coming of the Book. London: Verso, 1976.
Fierro, Alfred, Histoire et dictionnaire de Paris. Paris: Bouquins, 1996.

24
Fiske, S. T., Cuddy, A. J. and Glick, P., “Universal Dimensions of Social Cognition: Warmth and
Competence”, Trends in Cognitive Sciences, 11 (2007), 77-83.
Graff, Harvey J., The Legacies of Literacy. Bloomington, Indiana, USA: Indiana University Press,
1991.
Herman, Arthur, How the Scots Invented the Modern World. New York: Three Rivers Press, 2001.
Hofmeister, Andrea, Reiner Prass and Norbert Winnige, “Elementary Education, Schools and the
Demands of Everyday Life: North West Germany in 1800,” Central European History, 31
(1998), 329-384.
Houdaille, Jacques, “Les signatures au mariage de 1740 à 1829,” Population, 32 (1977), 65-90.
Jackson, Howard, Lexicography: An Introduction. New York: Routledge, 2002.
Joseph, John Earl, Eloquence and Power: The Rise of Language Standards and Standard
Languages. Oxford: Basil Blackwell, 1988.
Kloss, Heinz, "'Abstand Languages' and 'Ausbau Languages'”, Anthropological Linguistics, 9
(1967), 29-41.
Landes, David S., The Wealth and Poverty of Nations: Why Some Are So Rich and Some Are So
Poor. New York, Norton, 1998.
Lev-Ari, S. and Keysar, B., “Why Don't We Believe Non-Native Speakers? The Influence of Accent
on Credibility”, Journal of Experimental Social Psychology, 11 (2010), 77-83.
Longman Publishing, “Ten Largest Cities by Population, 1700–2000,” 2019,
http://wps.ablongman.com/wps/media/objects/244/250688/Appendix/12.pdf.
MacLeod, Christine, Inventing the Industrial Revolution: The English Patent System, 1660-1800.
Cambridge: Cambridge University Press, 1988.
MacLeod, Christine, and Alessandro Nuvolari, “Inventive Activities, Patents and Early
Industrialisation: A Synthesis of Research Issues,” Rivista di storia economica, 32:1, April
2016, 77-108.
Maddison, Angus, Contours of the World Economy, 1-2030 AD: Essays in Macro-Economic
History. Oxford: Oxford University Press, 2007.
McCloskey, Dierdre, Bourgeois Dignity: Why Economics Can't Explain the Modern World.
Chicago: University of Chicago Press, 2010.
Metcalfe, Bob, “Metcalfe's Law after 40 Years of Ethernet,” Computer, 46 (2013), 26 - 31.
Mokyr, Joel, The Lever of Riches: Technological Creativity and Economic Progress. Oxford:
Oxford University Press, 1990.
Mokyr, Joel, The Gifts of Athena : Historical Origins of the Knowledge Economy. Princeton, NJ:
Princeton University Press, 2002.
Mokyr, Joel, A Culture of Growth: The Origins of the Modern Economy. Princeton: Princeton
University Press, 2017.
Moser, Petra, How Do Patent Laws Influence Innovation? Evidence from Nineteenth-Century
World’s Fairs, American Economic Review, 95 (2005), 1214-1236.
Nicholson, Adam, God's Secretaries: The Making of the King James Bible. New York:
HarperCollins, 2003.
North, Douglass C., Structure and Change in Economic History. New York: Norton, 1981.
North, Douglass C., Institutions, Institutional Change, and Economic Performance. Cambridge:
Cambridge University Press, 1990.

25
Paulinyi, Akos, Industrielle Revolution: Vom Ursprung der modernen Technik. Reinbek bei
Hamburg, Germany: Rowohlt, 1989.
Polimeni, Giuseppe, “Usage in the Lexicography of Italian: Two Viewpoints and a Few Basic
Reflections,” Dictionaries: Journal of the Dictionary Society of North America, 40 (2019),
117-132.
Pomeranz, Kenneth, (2000). The Great Divergence: China, Europe, and the Making of the
Modern World Economy. Princeton, NJ: Princeton University Press.
Rees, Fran, Johannes Gutenberg: Inventor of the Printing Press, Minneapolis: Compass Point
Books, 2006.
Reis, Jaime, “Economic Growth, Human Capital Formation, and Consumption in Western Europe
before 1800,” in Living Standards in the Past: New Perspectives on Well-being in Asia and
Europe, by Robert C. Allen, Tommy Bengtsson and Martin Dribe. Oxford: Oxford University
Press, 2005, 195-225.
Roser, Max and Esteban Ortiz-Ospina, “Literacy,” (2016). Published online at
OurWorldInData.org. Retrieved from: 'https://ourworldindata.org/literacy'.
Sasaki, Yu, “Publishing Nations: Technology Acquisition and Language Standardization for
European Ethnic Groups,” Journal of Economic History, 77 (2017), 1007-1047.
Squicciarini, Mara P., and Nico Voigtländer, “Human Capital and Industrialization: Evidence
from the Age of Enlightenment,” Quarterly Journal of Economics, 130 (2015), 1825-1883.
Stone, Lawrence, “Literacy and Education in England 1640-1900,” Past & Present, 42 (1969), 69-
139.
Sumner, M. and Samuel, A. G. “The Role of Experience in the Processing of Cross-Dialectal
Variation”, Journal of Memory and Language, 60 (2009), 487-501.
Sumner, M., “The Social Weight of Spoken Words, Trends in Cognitive Sciences”, 19 (2015), 238-
239.
Tann, Jennifer, “Watt, James,” Oxford Dictionary of National Biography, 2014. Online version:
https://doi.org/10.1093/ref:odnb/28880
Uglow, Jenny, The Lunar Men: Five Friends Whose Curiosity Changed the World. New York:
Farrar, Strauss and Giroux, 2002.
van der Woude, A. M., “De alfabetisering,” Algemene Geschiednis der Nederlanden, 7 (1980): 257-
264.
Vincent, Nigel, “Italian,” in Bernard Comrie, ed., The World’s Major Languages. Oxford: Oxford
University Press, 1990, 279-302.
Voigtländer, Nico, and Hans-Joachim Voth, “The Three Horsemen of Riches: Plague, War, and
Urbanization in Early Modern Europe,” Review of Economic Studies, 80, (2013), 774–811.
Vuola, Olli and Ari-Pekka Hameric, “Mutually Benefiting Joint Innovation Process between
Industry and Big-Science,” Technovation, 26 (2006), 3–12.
Weber, Max, The Protestant Ethic and the Spirit of Capitalism. London: Routledge, [1905] 1992.
Wojciszke, B., Bazinska, R. and Jaworski, M. “On the Dominance of Moral Categories in
Impression Formation”, Personality and Social Psychology Bulletin, 24 (1998), 1245–1257.
26
Sources: See Data sources at end of text.
Figure 1. Innovating cities during the Industrial Revolution, 1700-1850
(underlined cities had at least one cooperative innovation)
USA
SWITZ.
ITALY
IRELAND
GREAT BRITAIN
BEL.
NETH.
GERMANY
DENMARK
FRANCE
Lyon
Paris
London
Birmingham
Manchester
Edinburgh Glasgow
Bristol
New York Boston
Philadelphia
Newcastle
York
Bern
Basel
Montpellier
Munich
Plymouth
Le Havre
Rouen
Como
Dresden
St. Étienne
Bradford
Oxford
Mulhouse
Besançon
Avignon
10-21 innovations
2-5 innovations
1 innovation
Portsmouth
Copenhagen

27
Sources: See Data sources at end of text.
Figure 2. Annual innovation and urbanization growth rates, 1700-1850
Austria
Belgium
Denmark
France
Germany
N. Italy
Netherlands
Switzerland
GBR
USA
-0.20
-0.10
0.00
0.10
0.20
0.30
0.40
0.50
0 2 4 6 8 10 12
Annu
al urb
aniz
ation r
ate
(%
)
Innovations per million inhabitants

28
Table 2. Correlation coefficients between dependent and explanatory variables
Population
increasea
No. of
innovationsb
Great
Britainc
Coal
depositsd
Printing
centere
Standard-
izationf
No. of innovations 0.55 --
Great Britain 0.21 0.26 --
Coal deposits 0.06 0.12 0.27 --
Printing center 0.22 0.18 0.02 -0.04 --
Standardization 0.13 0.19 0.50 0.13 -0.02 --
Centralizationg 0.06 0.13 0.24 -0.02 -0.09 0.66
a Increase in population of city over a half century between 1700 and 1850, in thousands b Number of innovations in region of city over a half century between 1700 and 1850 c Dummy variable equal to 1 for city in England, Wales or Scotland; otherwise, zero d Dummy variable equal to 1 for city having coal deposits within 50 km; otherwise, zero e Dummy variable equal to 1 for city considered printing center in 1700 (see data sources at end of text); otherwise,
zero f Dummy variable equal to 1for city having a monolingual usage dictionary in 1700 (see section 2c of text); otherwise,
zero g Dummy variable equal to 1 if population of largest city in present-day country in 1600 was 200,000 or more;
otherwise, zero

29
Table 3. Factors influencing innovation rates, 1700-1849
Cooperative Non-cooperative All innovations
(1) (2) (3)
Number of innovations:
Standardization 18.14*** 1.278** 1.958***
(0.6452) (0.4393) (0.5780)
Centralization 1.702*** 0.874* 1.284***
(0.0387) (0.3840) (0.3607)
Initial population 0.00285*** 0.00585*** 0.00456***
(0.0004) (0.0011) (0.0013)
Coal deposits 1.649*** 1.271* 1.341***
(0.2294) (0.5146) (0.3287)
Constant -20.59*** -4.198*** -4.174***
(0.6753) (0.8594) (0.7998)
Inflation of zeros:
Great Britain 1.757*** -33.68*** 0.435
(0.2217) (1.2889) (1.4694)
France 4.619*** 2.550* 3.461***
(0.1202) (1.1274) (0.9102)
1750-1799 -1.298*** -1.598* -1.347**
(0.2556) (0.7267) (0.4639)
1800-1849 -2.928*** -3.436*** -3.227***
(0.0629) (0.7687) (0.5621)
Constant 0.368** -0.0364 -0.199
(0.1384) (1.5937) (1.2242)
lnalpha -0.798** 0.817*** 0.386*
(0.3042) (0.0606) (0.1918)
N 753 753 753
Log likelihood -83.38 -142.2 -183.0
Zero inflated negative binomial regressions with robust clustered standard errors
Dependent variable: number of innovations in city during 50-year period.
Standard errors in parentheses Number of observations: 753 * p < 0.05, ** p < 0.01, *** p < 0.001

30
Table 4. Factors influencing urban population growth, in thousands, 1700-1849
Explanatory equation Instrumental-variable estimates
(1) (2) (3) (4)
Current innovations:
All innovations in given city 16.36** 34.32***
(3.0053) (2.9952)
Coop. innovations in given city 25.14* 43.70**
(8.1114) (5.4688)
Non-coop. innovations in given city 5.301 31.95***
(3.5415) (2.9903)
Lagged innovations:
All innovations in same country 1.719* 1.298*
(0.4929) (0.4113)
Coop. innovations in same country 3.764*** 3.002***
(0.1223) (0.1471)
Non-coop. innov. in same country -0.222 -0.482*
(0.1730) (0.1496)
Initial population 0.647* 0.660** 0.284* 0.283
(0.1431) (0.1319) (0.1024) (0.1080)
Coal deposits 2.925 2.558 -0.697 0.849
(2.6002) (2.3996) (2.4356) (2.8522)
Capital city -5.090 -7.909 13.42* 13.01*
(15.0937) (14.4535) (2.9618) (3.3420)
Atlantic port -3.153 -3.022 2.169 2.515
(3.8839) (3.9934) (6.0402) (6.1868)
Distance from capital 0.0149* 0.0112 0.0130* 0.0102*
(0.0050) (0.0056) (0.0034) (0.0032)
Literacy rate 0.143 0.159 0.136 0.142
(0.1040) (0.0921) (0.1022) (0.0935)
Printing center -20.17 -21.32 -10.70* -11.15*
(10.0058) (10.1161) (3.3246) (3.4222)
French Revolution -455.9*** -511.1*** -195.9* -193.5*
(50.7246) (16.6646) (58.3318) (62.9946)
Great Britain -18.23** -16.45 -24.68** -21.51
(3.8016) (10.2374) (3.0208) (9.5426)
France -3.685 -9.760 -2.385 -7.800*
(2.4457) (4.2991) (1.2817) (2.5382)
1750-1799 -3.002 -5.898 -2.275 -4.739
(4.6969) (5.5383) (3.4341) (4.3214)
1800-1849 2.849 -3.840 5.348 -0.235
(5.4411) (8.0398) (4.0888) (7.3277)
Constant -14.84** -12.48** -9.833** -7.569*
(2.7601) (2.0661) (1.9863) (2.3219)
Number of observations 753 753 753 753
adj. R2 0.696 0.681 0.825 0.817
Ordinary least squares regressions with robust clustered standard errors
Dependent variable: change in population of city during 50-year period, in thousands.
Standard errors in parentheses Number of observations: 753
* p < 0.05, ** p < 0.01, *** p < 0.001

31
Table 5. Innovations per hundred thousand inhabitants in innovating cities, 1700-1850
Population of city in 1700
Under 50,000 Over 50,000 All cities
Innovations per 100,000
inhabitants:
Cooperative 19.2 0.08 16.1
Non-cooperative 16.8 0.21 14.4
All innovations 36.0 0.29 30.5
Number of innovations 77 40 117
Number of innovating cities 25 5 30
Total number of cities 229 22 251
Total population (thousands):
Innovating cities 356 1,287 1,643
All cities 3,116 2,232 5,348
32
Table 6. Robustness: Impact of disaggregated innovations on urban population growth (‘000)
Explanatory equation* IV estimation**
Core variables Mean FracSigni Frac+ Mean FracSigni Frac+ Obs.
Initial population 0.67 1 1 0.47 1 1 1024
Great Britain -5.32 0.72 0.31 -13.69 0.83 0.19 1024
France -4.91 0.22 0.07 -4.64 0.28 0.05 1024
French Revolution -455.51 1 0 -282.34 1 0 1024
1750-1749 -1.92 0.05 0.17 -1.86 0.03 0.11 1024
1800-1849 5.41 0.22 0.91 5.64 0.19 0.97 1024
Tested variables Mean FracSigni Frac+ Mean FracSigni Frac+ Obs.
Current innovations:
Cooperative in given city 19.92 1 1 79.53 1 1 512
Non-coop. in given city 8.38 0.33 0.88 34.76 1 1 512
Lagged innovations:
Coop. in same country 3.95 1 1 3.10 1 1 512
Non-coop. in same c’try 1.04 0 0.56 0.62 0.25 0.56 512
Coal deposits 4.96 0 1 0.42 0 0.52 512
Capital city -10.97 0 0 2.01 0.41 0.65 512
Atlantic port -2.72 0 0 0.41 0 0.55 512
Distance from capital 0.01 0.53 1 0.01 0.84 1 512
Literacy rate 0.17 0 1 0.17 0 1 512
Publishing -22.84 0.16 0 -15.82 0.58 0 512
* using the specification in Table 4, column (1). ** using the specification in Table 4, column (3).

33
Appendix I. 117 important innovations, 1700-1849
Country 1700-1749 1750-1799 1800-1849
Denmark Galvanometer (Oersted,
1819; Copenhagen)
France Loom coded with
perforated paper
(Bouchon, 1725;
Lyon)
Loom coded with
punched cards
(Falcon, 1728; Lyon)
Steam-powered wagon
(Cugnot, 1770; Paris)
Automatic loom (Vaucanson,
1775; Paris)
Single-action press (Didot,
Prudon,1781; Paris)
Two-engine steamboat
(Jouffroy d'Abbans, 1783;
Lyon)
Hot-air balloon (Montgolfier,
1783; Paris)
Parachute (Lenormand, 1783;
Montpellier)
Press for the blind (Haüy,
1784; Paris)
Chlorine as bleaching agent
(Berthollet, 1785; Paris)
Sodium carbonate from salt
(Leblanc, d’Arcet, 1790;
Paris)
Visual telegraph (Chappe,
1793; Paris)
Vacuum sealing (Appert,
1795; Paris)
Paper-making machine
(Robert, Didot, 1798; Paris)
Illuminating gas from wood
(Lebon, 1799; Paris)
Automatic loom with
perforated cards
(Jacquard, Breton, 1805;
Lyon)
Wet spinning for flax (de
Girard, 1815; Avignon)
Electromagnet (Arago,
Ampère, 1820; Paris)
Water turbine (Burdin,
1824; Saint-Étienne)
Single-helix propeller
(Sauvage, 1832; Le
Havre)
Three-color textile printing
machine (Perrot, 1832;
Rouen)
Water turbine with
adjustable vanes
(Fourneyron, 1837;
Besançon)
Photography (Daguerre,
Niepce, 1838; Paris)
Multiple-phase combing
machine (Heilmann,
1845; Mulhouse)

34
Country 1700-1749 1750-1799 1800-1849
Germany Porcelain
(Tschirnhaus, 1707;
Dresden)
Lithography (Senefelder,
1796; Munich)
Great
Britain
Seed drill (Tull, 1701;
Oxford)
Iron smelting with
coke (Darby, Thomas,
1709; Birmingham)
Atmospheric engine
(Newcomen,
Calley,1712;
Birmingham)
Pottery made with
flint (Astbury, 1720;
Birmingham)
Quadrant (Hadley,
1731; London)
Flying shuttle (Kay,
1733; Manchester)
Glass-chamber
process for sulfuric
acid (Ward, White,
D’Osterman, 1736;
London)
Spinning machine
with rollers (Wyatt,
Paul, 1738;
Birmingham)
Stereotyping (Ged,
1739; Edingurgh)
Lead-chamber process
for sulfuric acid
Crucible steel (Huntsman,
1750; York)
Rib knitting attachment
(Strutt, Roper, 1755;
Birmingham)
Achromatic refracting
telescope (Dollond, 1757;
London)
Breast wheel (Smeaton, 1759;
York)
Bimetallic strip chronometer
(Harrison, 1760; London)
Spinning jenny (Hargreaves,
1764; Manchester)
Creamware pottery
(Wedgewood, Wieldon,
1765; Birmingham)
Cast-iron railroad (Reynolds,
1768; Birmingham)
Engine using expansive steam
operation (Watt, Roebuck,
1769; Glasgow)
Water frame (Arkwright,
Kay, 1769; Birmingham)
Efficient atmospheric steam
engine (Smeaton, 1772;
Newcastle)
Dividing machine (Ramsden,
1773; London)
Machines for tackle block
production (M. I. Brunel,
Maudslay, 1800;
London)
Illuminating gas from coal
(Murdock, Boaze, 1802;
Birmingham)
Steam locomotive
(Trevithick, Homfray,
1804; Plymouth)
Compound steam engine
(Woolf, Edwards, 1805;
London)
Winding mechanism for
loom (Radcliffe, 1805;
Manchester)
Arc lamp (Davy, 1808;
London)
Food canning (Durand,
Girard, 1810; London)
Rack locomotive
(Blenkinsop, Murray,
1811; Bradford)
Mechanical printing press
(Koenig, Bauer, Bensley,
1811; London)
Steam locomotive on
flanged rails (G.
Stephenson, Wood,
1814; Newcastle)

35
Country 1700-1749 1750-1799 1800-1849
(Roebuck, 1746;
Birmingham)
Cylinder boring machine
(Wilkinson, 1775;
Birmingham)
Carding machine (Arkwright,
Kay, 1775; Birmingham)
Condensing chamber for
steam engine (Watt,
Boulton, 1776;
Birmingham)
Steam jacket for steam engine
(Watt, Boulton, 1776;
Birmingham)
Spinning mule (Crompton,
1779; Manchester)
Reciprocating compound
steam engine (Hornblower,
1781; Plymouth)
Sun and planet gear (Watt,
Boulton, 1781;
Birmingham)
Indicator of steam engine
power (Watt, Southern,
1782; Birmingham)
Rolling mill (Cort, Jellicoe,
1783; London)
Cylinder printing press for calicoes
(Bell, 1783; Glasgow)
Jointed levers for parallel
motion (Watt, Boulton,
1784; Birmingham)
Puddling (Cort, Jellicoe,
1784; London)
Power loom (Cartwright,
1785; York)
Safety lamp (Davy, 1816;
London)
Circular knitting machine
(M. I. Brunel, 1816;
London)
Planing machine (Roberts,
1817; Manchester)
Large metal lathe
(Roberts, 1817;
Manchester)
Gas meter (Clegg, Malam,
1819; London)
Metal power loom
(Roberts, Sharp, 1822;
Manchester)
Rubber fabric (Hancock,
Macintosh, 1823;
London)
Locomotive with fire-tube
boiler (R. Stephenson,
Booth, 1829;
Manchester)
Hot blast furnace (Nielson,
Macintosh, 1829;
Glasgow)
Self-acting mule (Roberts,
Sharp, 1830;
Manchester)
Lathe with automatic
cross-feed tool
(Whitworth, 1835;
Manchester; Manchester)
Planing machine with
pivoting tool-rest
36
Country 1700-1749 1750-1799 1800-1849
Speed governor (Watt,
Boulton, 1787;
Birmingham)
Double-acting steam engine
(Watt, Boulton, 1787;
Birmingham)
Threshing machine (Meikle,
1788; Edinburgh)
Single-phase combing
machine (Cartwright, 1789;
York)
Machines for lock production
(Bramah, Maudslay, 1790;
London)
Single-action metal printing
press (Stanhope, Walker,
1795; London)
Hydraulic press (Bramah,
Maudslay, 1796; London)
High-pressure steam engine
(Trevithick, Murdoch,
1797; Plymouth)
Slide lathe (Maudslay, 1799;
London)
(Whitworth, 1835;
Manchester)
Even-current electric cell
(Daniell, 1836: London)
Electric telegraph (Cooke,
Wheatstone, 1837;
London)
Riveting machine
(Fairbairn, Smith, 1838;
Manchester)
Transatlantic steamer (I.
K. Brunel, Guppy, 1838;
Bristol)
Assembly-line production
(Bodmer, 1839;
Manchester)
Multiple-blade propeller
(Smith, Pilgrim, 1839;
London)
Steam hammer (Nasmyth,
Gaskell, 1842;
Manchester)
Iron, propellor-driven
steamship (I. K. Brunel,
Guppy, 1844; Bristol)
Measuring machine (Whit-
worth, 1845;
Manchester)
Multiple-spindle drilling
machine (Roberts, 1847;
Manchester)
Italy Electric battery (Volta,
1800; Como)
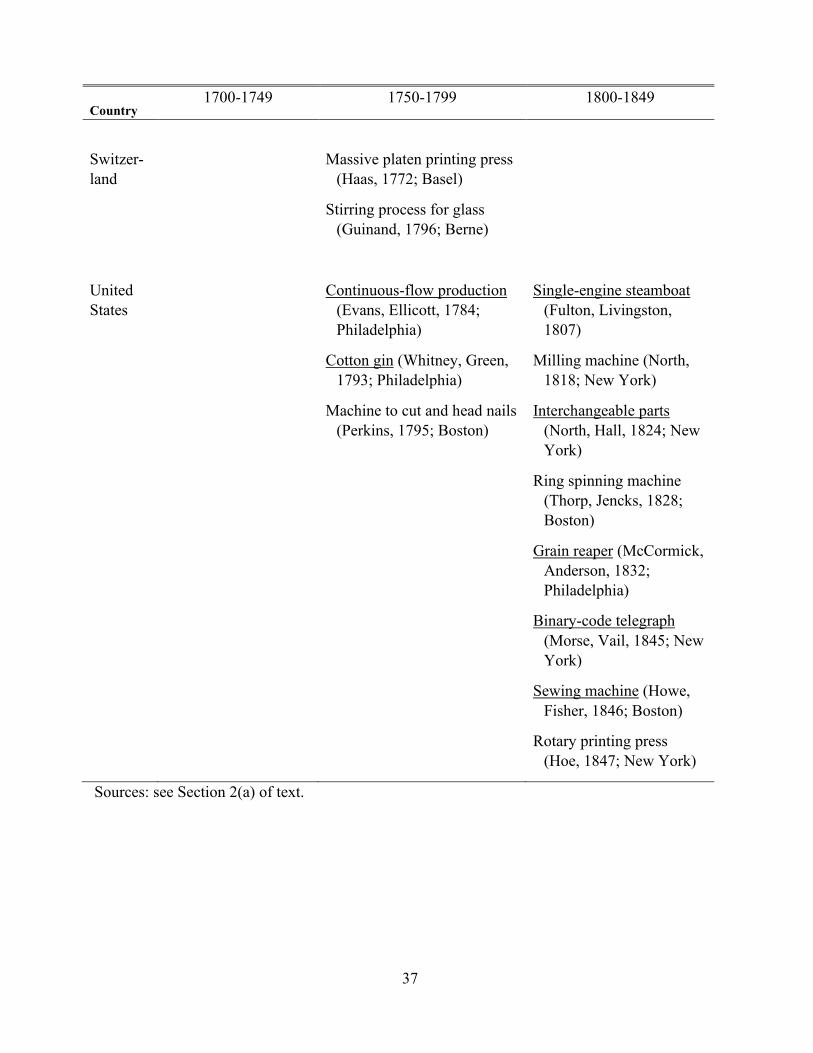
37
Country 1700-1749 1750-1799 1800-1849
Switzer-
land
Massive platen printing press
(Haas, 1772; Basel)
Stirring process for glass
(Guinand, 1796; Berne)
United
States
Continuous-flow production
(Evans, Ellicott, 1784;
Philadelphia)
Cotton gin (Whitney, Green,
1793; Philadelphia)
Machine to cut and head nails
(Perkins, 1795; Boston)
Single-engine steamboat
(Fulton, Livingston,
1807)
Milling machine (North,
1818; New York)
Interchangeable parts
(North, Hall, 1824; New
York)
Ring spinning machine
(Thorp, Jencks, 1828;
Boston)
Grain reaper (McCormick,
Anderson, 1832;
Philadelphia)
Binary-code telegraph
(Morse, Vail, 1845; New
York)
Sewing machine (Howe,
Fisher, 1846; Boston)
Rotary printing press
(Hoe, 1847; New York)
Sources: see Section 2(a) of text.

38
Appendix II. Year of first monolingual dictionary
Country Year Author(s) Publication
Austria 1868 Otto Back et. al. Österreichisches Wörterbuch
Belgium (French) 1680 Same as France (north)
Belgium (Flem.) 1864 Same as Netherlands
Denmark 1833 Christian Molbech Dansk Ordbog
England 1658 Edward Phillips The New World of English
Words
France (north) 1680 Pierre Richelet Dictionnaire français
France (south) 1815 Standardization delayeda
Germany
1786
Johann Christoph
Adelung
Grammatich-kritisches
Wörterbuch der hochdeutschen
Mundart
Ireland 1658 Same as England
Italy
1897
Emilio Broglio &
Giovan Battista
Giorgini
Nòvo vocabolario della lingua
italiana secondo l'uso di
Firenze
Netherlands
1864
Marcus and Nathan
Solomon Calisch
Nieuw Woordenboek der
Nederlandsche Taal
Scotland 1658 Same as Englandb
Switzerland (Fr.) 1680 Same as France (north)
Switzerland
(German)
1786 Same as Germany
United States 1658 Same as England aSouth of a line from St. Malo to Geneva, standardization occurred through the
integrating effects of the revolutionary and Napoleonic Wars (Graff, 1991, 193). bIn 1611, King James I sponsored a new English translation of the Bible and ordered
that this “Authorized Version” be used throughout his Scottish Kingdom (Crystal, 2003,
p. 53).
Note: Other early dictionaries fail to reflect the existence of a standardized written
vernacular. Robert Cawdrey’s Table Alphabeticall (1604) was a list of hard words to
spell. Josua Maaler’s, Die Teütsch Spraach (1561) was devoted to Swiss and Upper
German vocabulary. Kornelius Kiliaan’s (1599) Etymologicum used Latin to explain
Dutch words, as did Jean Nicot’s (1606) Trésor de la langue françoise for the French
language. As for Italy, the Accademia della Crusca’s Vocabolario of the Florentine
vulgar tongue (1612) and Sebastián de Covarrubias’ El Tesoro de la lengua castellana
o Española and had only a slight effect on spoken Italian and Spanish respectively; see
section 2(c) in the text.
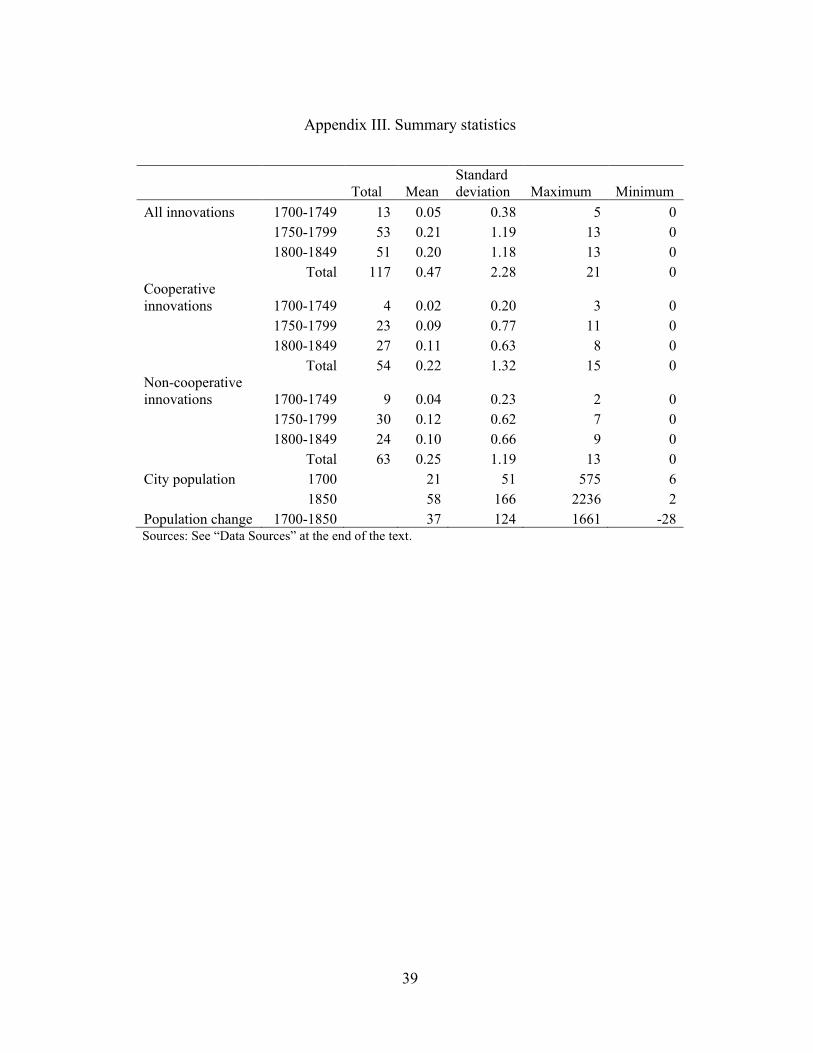
39
Appendix III. Summary statistics
Total Mean
Standard
deviation Maximum Minimum
All innovations 1700-1749 13 0.05 0.38 5 0
1750-1799 53 0.21 1.19 13 0
1800-1849 51 0.20 1.18 13 0
Total 117 0.47 2.28 21 0
Cooperative
innovations 1700-1749 4 0.02 0.20 3 0
1750-1799 23 0.09 0.77 11 0
1800-1849 27 0.11 0.63 8 0
Total 54 0.22 1.32 15 0
Non-cooperative
innovations 1700-1749 9 0.04 0.23 2 0
1750-1799 30 0.12 0.62 7 0
1800-1849 24 0.10 0.66 9 0
Total 63 0.25 1.19 13 0
City population 1700 21 51 575 6
1850 58 166 2236 2
Population change 1700-1850 37 124 1661 -28 Sources: See “Data Sources” at the end of the text.