The Greening of Oregon’s Workforce. Jobs, Wages, and Training.
59
The Greening of Oregon’s Workforce . Jobs, Wages, and Training
-
Upload
stephen-anthony -
Category
Documents
-
view
217 -
download
2
Transcript of The Greening of Oregon’s Workforce. Jobs, Wages, and Training.

The Greening of Oregon’s Workforce
.
Jobs, Wages, and Training

We defined “Green Job”…
• In Oregon, a green job is one that provides a service or produces a product in any of the following categories:1. Increasing energy efficiency2. Producing renewable energy3. Preventing, reducing, or mitigating environmental
degradation4. Cleaning up and restoring the natural environment5. Providing education, consulting, policy promotion,
accreditation, trading and offsets, or similar services supporting any of the other categories
Note: we wanted one or more of these things to be an “essential function” of the job.

Key Finding: Oregon has roughly 51,000 green jobs.
• 51,402 green jobs in 2008, spread across... • 5,025 employers• all major industry groups• 226 different occupations
• Represents about 3 percent of the employment in the private sector and state and local government
• To give perspective … this is roughly the same as the number of employees working in Oregon’s private hospitals.
-
50,000
100,000
150,000
200,000
250,000
Wood productmanufacturing
Computer &electronic
manufacturing
Green Jobs Construction Health care &social assistance
Oregon's Green Jobs Relative to Other Industries, 2008
Source: Oregon Employment Department, Quarterly Census of Employment and Wages (QCEW)

Construction, wholesale and retail trade, and administrative and waste services account for about half of Oregon’s green jobs.
IndustryGreen Jobs
Portion of All Green Jobs
Construction 8,676 17%Wholesale and Retail Trade 8,315 16%Administrative and Waste Services 7,074 14%Natural Resources and Mining 5,762 11%Professional and Technical Services 5,411 11%State and Local Government 5,063 10%Manufacturing 4,228 8%Leisure and Hospitality 2,260 4%Other Services 1,555 3%Educational and Health Services 1,353 3%Transportation and Warehousing 573 1%Utilities 403 Less Than 1%Information 354 Less Than 1%Management of Companies and Enterprises 252 Less Than 1%Financial Activities 123 Less Than 1% Total 51,402 100%
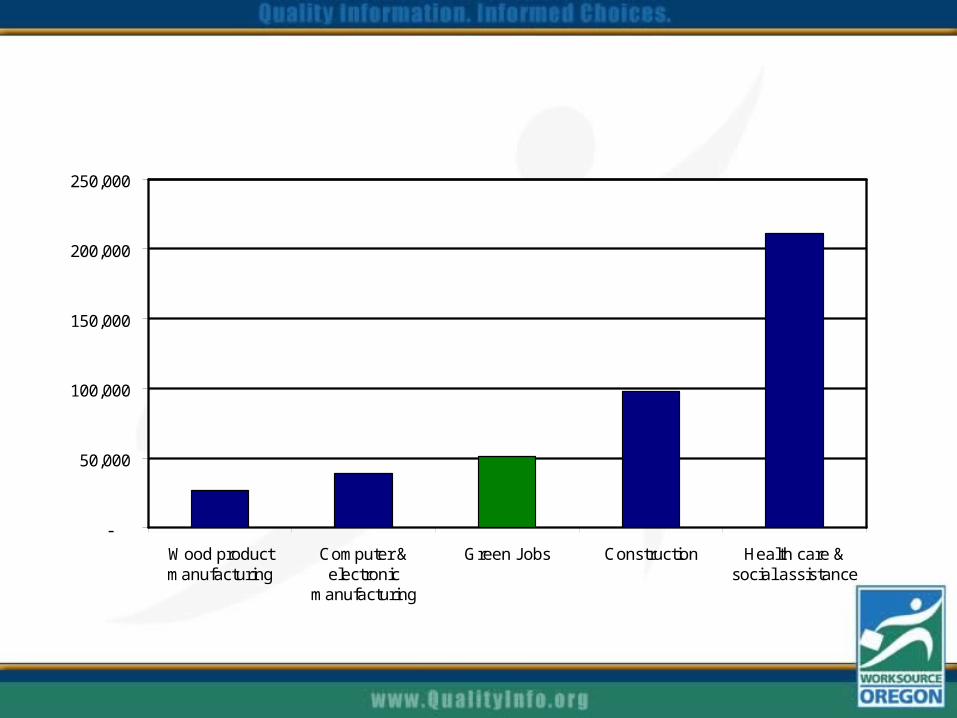
Key Finding: Many green jobs are in blue collar occupations.
Occupational GroupGreen Jobs
Portion of All Green Jobs
Construction and Extraction 10,381 20%Production 6,512 13%Farming, Fishing, and Forestry 5,838 11%Transportation and Material Moving 5,255 10%Architecture and Engineering 4,360 8%Life, Physical, and Social Science 4,135 8%Building and Grounds Cleaning and Maintenance
2,877 6%
Sales and Related 2,437 5%Installation, Maintenance, and Repair 2,233 4%Management 1,639 3%Office and Administrative Support 1,570 3%Protective Service 1,032 2%Education, Training, and Library 790 2%Business and Financial Operations 683 1%Food Preparation and Serving Related 513 1%Arts, Design, Entertainment, Sports, and Media
480 1%
Other 667 1% Total 51,402 100%
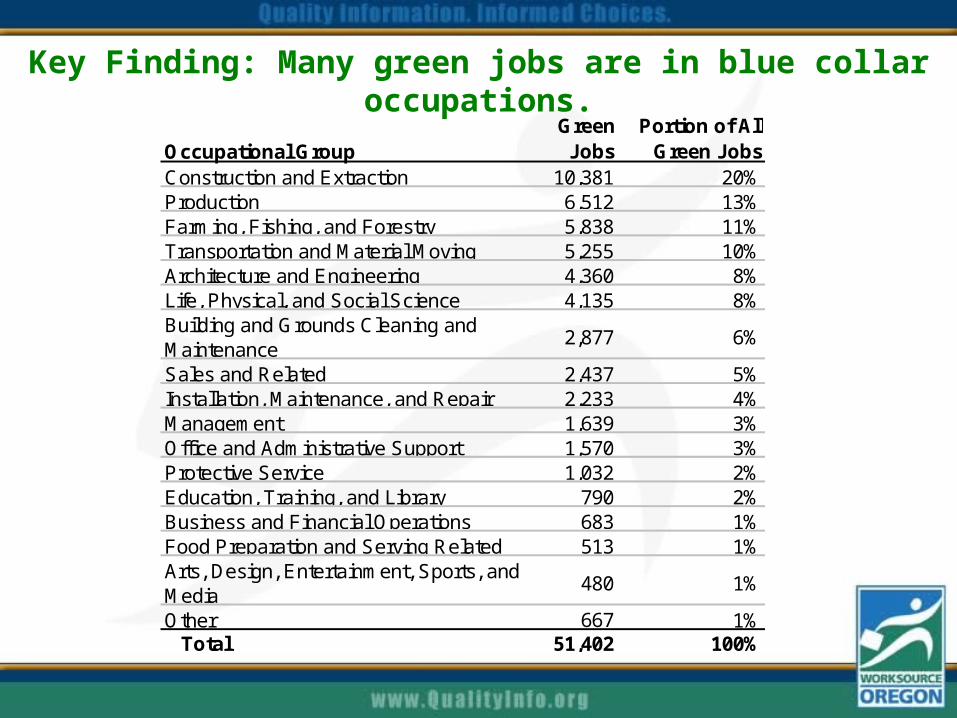
Eleven occupations had at least 1,000 green jobs.
Occupation Selected Green Job Description and EmployerCarpenters(4,025 jobs)
"home weatherization" - local community action center"energy efficiency construction" - temp agency
Farmworkers and Laborers(3,189 jobs)
"herbsman" - 100% organic dairy"Assistant grower" - organic nursery
Truck Drivers(2,337 jobs)
"compost truck driver" - waste management company"truck drivers" - biomass company
Hazardous Materials Removal Workers(2,123 jobs)
"asbestos abatement worker" - remediation business"special waste technician" - at county waste center
Landscaping and Groundskeeping Workers(2,044 jobs)
"riparian crew leader" - local watershed restoration"restoration of native plants" - forestry consulting firm
Civil Engineers(1,889 jobs)
"civil inspector" - wind energy firm"LEED AP Project Engineer" - construction company
Production Workers(1,728 jobs)
"paper machine tender" - mill making 100% recycled paper"processing recycling" - oil recycler
Freight, Stock, and Material Movers(1,628 jobs)
"sorter" - recycling company"auto parts dismantler" - auto salvage yard
Retail Salespersons(1,149 jobs)
"sells systems, customer care" - solar panel retailer"retail manager" - organic nursery
Biological Technicians(1,115 jobs)
"Coho life cycle monitoring" - local watershed"fisheries technician" - tribal government
Fire Fighters(1,021 jobs)
"rehab after fires, forest hazard fuel reduction" - environmental consulting firm
Examples of Green Work From the Oregon Green Jobs SurveyTop 11 Occupations with More Than 1,000 Green Jobs

You haven’t mentioned solar panel installers or wind turbine technicians!
• In 2009 there was no standard occupation code for solar panel installers or wind turbine technicians, thus…
• Solar panel installers• Electricians if working with photovoltaic panels• Plumbers if installing solar thermal units• Otherwise construction laborers or related workers
• Wind turbine technicians• Usually coded as installation, maintenance, and
repair workers…• But could be electricians or engineers

Green wage levels are spread across a wide spectrum, just like wages of all jobs.
Percent of Green Jobs by Wage Group
0%
5%
10%
15%
20%
25%
30%
Under$10.00
$10.00 -$14.99
$15.00 -$19.99
$20.00 -$24.99
$25.00 -$29.99
$30.00 -$49.99
$50.00 ormore
Hourly Wage

But very few green jobs pay very low wages …
Percent of Green Jobs and All Jobs by Wage Group
0%
5%
10%
15%
20%
25%
30%
Under$10.00
$10.00 -$14.99
$15.00 -$19.99
$20.00 -$29.99
$30.00 -$49.00
$50.00 ormore
Average Hourly Wage
All Jobs Green Jobs
Source: Oregon Employment Department

Key Finding: “On average, green jobs tended toward slightly higher wages than jobs across the entire economy.”
• Average wage for all jobs: $19.92 per hour• Average wage for green jobs: $22.61 per hour
• Half of all jobs pay $15.22 or more per hour• About 2/3 of all green jobs pay $15.00 or more per
hour
• Occupation mix explains some of the difference, but not all

Green wage levels depend on the occupation
Top 11 Green Occupations by Hourly Wage
0 500 1,000 1,500 2,000 2,500 3,000 3,500
Fire Fighters
Biological Technicians
Retail Salespersons
Laborers & Freight, Stock,& Material Movers, Hand
Production Workers, All Other
Civil Engineers
Landscaping & Groundskeeping Workers
Hazardous Materials Removal Workers
Carpenters
Truck Drivers, Heavy and Tractor-Trailer
Farmworkers & Laborers, Crop, Nursery, & Greenhouse
Number of Green Jobs
Less Than $15 $15 to $24.99 $25 to $49.99 $50 or More
Where the Wage Level was specified

Key Finding: Two-thirds of green jobs require no education beyond high school.
No Requirement32%
High School Graduate
32%
Associate Degree7%
Some College7%
Bachelor's or Graduate
18%
Other4%
Where the Minimum Education Level was specified
Green Jobs by Minimum Education Level Oregon, 2008

Education requirements vary widely by occupation.Top 11 Green Occupations by Minimum Education
0 500 1,000 1,500 2,000 2,500 3,000 3,500 4,000
Retail Salespersons
Fire Fighters
Biological Technicians
Laborers & Freight, Stock, & Material Movers, Hand
Farmworkers & Laborers, Crop, Nursery, & Greenhouse
Production Workers, All Other
Civil Engineers
Landscaping and GroundskeepingWorkers
Hazardous Materials RemovalWorkers
Truck Drivers, Heavy and Tractor-Trailer
Carpenters
None High School Some College, 2-Year Degree & Other Bachelor's or Higher
Number of Green Jobs
Where the Minimum Education Level was specified

Key Finding: About one-third of green jobs require some kind of special license / certificate.
Green Jobs by Required License or Certificate
0 1,000 2,000 3,000 4,000 5,000 6,000 7,000 8,000
Computer Proficiency orTraining
LEED Accreditation
Prior Experience or SignificantOJT
Equipment Operator Licenseor CDL
Cleanup or AbatementCertification
Occupation Specific Licenseor Certificate
Some jobs have more than one special requirement.

As is true with the whole economy … jobs requiring more education usually pay higher wages.
Green Jobs Requiring Education Pay Higher Wages
0 4,000 8,000 12,000 16,000
No educationrequirement
High school diploma orGED required
Some college, Associatedegree, or Other
Bachelor's or graduatedegree
Number of Green Jobs
Less Than $15 $15 - $24.99 $25 to $49.99 $50 or More
Where the Minimum Education Level was specified

Key Finding: Almost two-thirds (32,746) of Oregon’s green jobs meet the state’s criteria for “high wage”.
Occupation Title
GreenJobs
AverageHourly Wage
Some College,2-year Degree,
or Other
Bachelor's Degree or
Higher
Some Jobs Have Special
Requirements
Carpenters 4,025 $22.64 1% 4% Truck Drivers, Heavy and Tractor-Trailer 2,338 $34.08 16% 0% Hazardous Materials Removal Workers 2,123 $15.50 0% 0% Civil Engineers 1,889 $32.70 3% 97% Production Workers, All Other 1,728 $38.46 0% 0%Biological Technicians 1,115 $16.59 59% 2%General and Operations Managers 913 $40.85 48% 32% Architects, Except Landscape and Naval 882 $33.85 0% 100% Water and Liquid Waste Treatment Plant and System Operators
712 $25.61 2% 0%
Wholesale and Manufacturing Sales Representatives; Technical and Scientific
690 $23.34 0% 0%
Top 10 High Wage Green OccupationsOccupations Where At Least Half of the Green Jobs Earned $15.00 per Hour or More

There are 190 high-wage green occupations.
• In these, at least half of the green jobs paid $15.00 or more per hour
• These occupations accounted for 94 percent of the green jobs requiring education beyond high school
• 23 percent of the jobs in high-wage green occupations required a bachelor’s degree or higher (compared to 2 percent of the jobs in low-wage green occupations)

Key Finding: Employers project a 14% increase in green jobs between 2008 and 2010.
Occupational Group
Total Workers
2008
Projected Workers
2010 ChangePercent Change
Farming, Fishing, and Forestry 5,838 7,960 2,122 36%Transportation and Material Moving 5,255 7,025 1,770 34%Production 6,512 7,625 1,113 17%Architecture and Engineering 4,360 5,243 883 20%Construction and Extraction 10,381 11,077 696 7%Protective Service 1,032 1,543 511 50%Life, Physical, and Social Science 4,135 4,338 203 5%Installation, Maintenance, and Repair 2,233 2,402 169 8%Education, Training, and Library 790 952 162 21%Management 1,639 1,791 152 9%Building and Grounds Cleaning and Maintenance 2,877 3,026 149 5%Business and Financial Operations 683 797 114 17%Community and Social Services 157 263 106 68%Computer and Mathematical 244 301 57 23%Healthcare Practitioners and Technical 165 178 13 8%Personal Care and Service 20 27 7 35%Food Preparation and Serving Related 513 514 1 0%Legal 81 81 0 0%Arts, Design, Entertainment, Sports, and Media 480 465 -15 -3%Office and Administrative Support 1,570 1,376 -194 -12%Sales and Related 2,437 1,827 -610 -25% Total 51,402 58,811 7,409 14%
Employer Projections of Green Jobs by Occupation
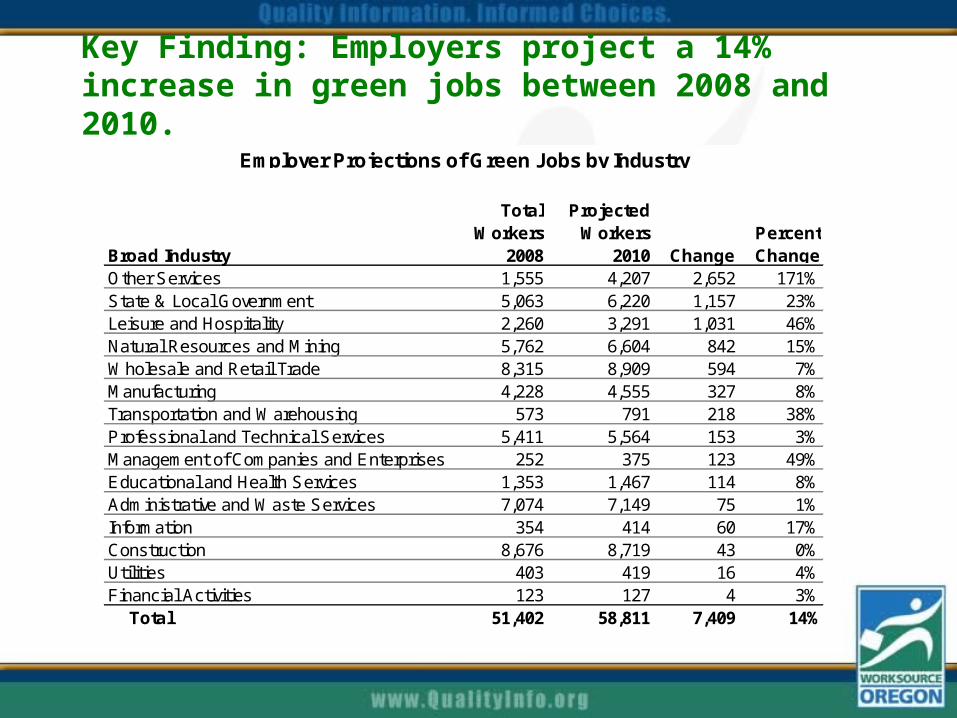
Key Finding: Employers project a 14% increase in green jobs between 2008 and 2010.
Broad Industry
Total Workers
2008
Projected Workers
2010 ChangePercent Change
Other Services 1,555 4,207 2,652 171%State & Local Government 5,063 6,220 1,157 23%Leisure and Hospitality 2,260 3,291 1,031 46%Natural Resources and Mining 5,762 6,604 842 15%Wholesale and Retail Trade 8,315 8,909 594 7%Manufacturing 4,228 4,555 327 8%Transportation and Warehousing 573 791 218 38%Professional and Technical Services 5,411 5,564 153 3%Management of Companies and Enterprises 252 375 123 49%Educational and Health Services 1,353 1,467 114 8%Administrative and Waste Services 7,074 7,149 75 1%Information 354 414 60 17%Construction 8,676 8,719 43 0%Utilities 403 419 16 4%Financial Activities 123 127 4 3% Total 51,402 58,811 7,409 14%
Employer Projections of Green Jobs by Industry

Oregon’s Green LMI Improvement Grant
• December 2009 – May 2011 (18 months)• $1.25 million• Provided by national Employment and Training
Administration (ETA)• Working with many partners
• Oregon Workforce Investment Board (OWIB)• Department of Community Colleges and Workforce
Development (DCCWD)• Oregon Career Information System (CIS)• Other workforce, education, and training entities
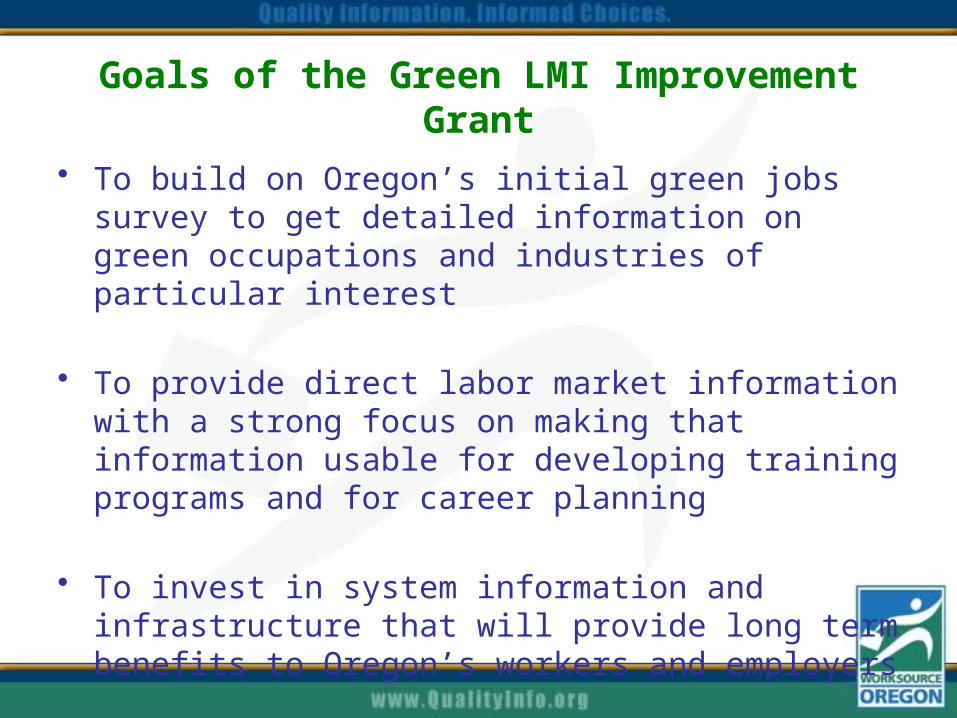
Goals of the Green LMI Improvement Grant
• To build on Oregon’s initial green jobs survey to get detailed information on green occupations and industries of particular interest
• To provide direct labor market information with a strong focus on making that information usable for developing training programs and for career planning
• To invest in system information and infrastructure that will provide long term benefits to Oregon’s workers and employers

The Green LMI Grant has Five Major Components
1. In-depth Study of Green Occupations
2. Employment Analysis of Companies in Specific Green Sectors
3. Analysis of Green Jobs in Agriculture
4. Special Reports and Publications
5. AutoCoder and Green Jobs Extractor for WorkSource Oregon Management Information System (WOMIS)
• DCCWD & CIS will also complete other major components

In-depth Study of Occupations
• Developed criteria for selecting occupations to studyBuild on findings from The Greening of Oregon’s
WorkforceFocus on occupations with green jobs that require
some education beyond high schoolFocus on occupations where green jobs may have a
need for new or additional skillsFocus on occupations that are “high-demand” –
projected to have at least 254 openings over the next 10 years
2010SOC Code Occupation Title
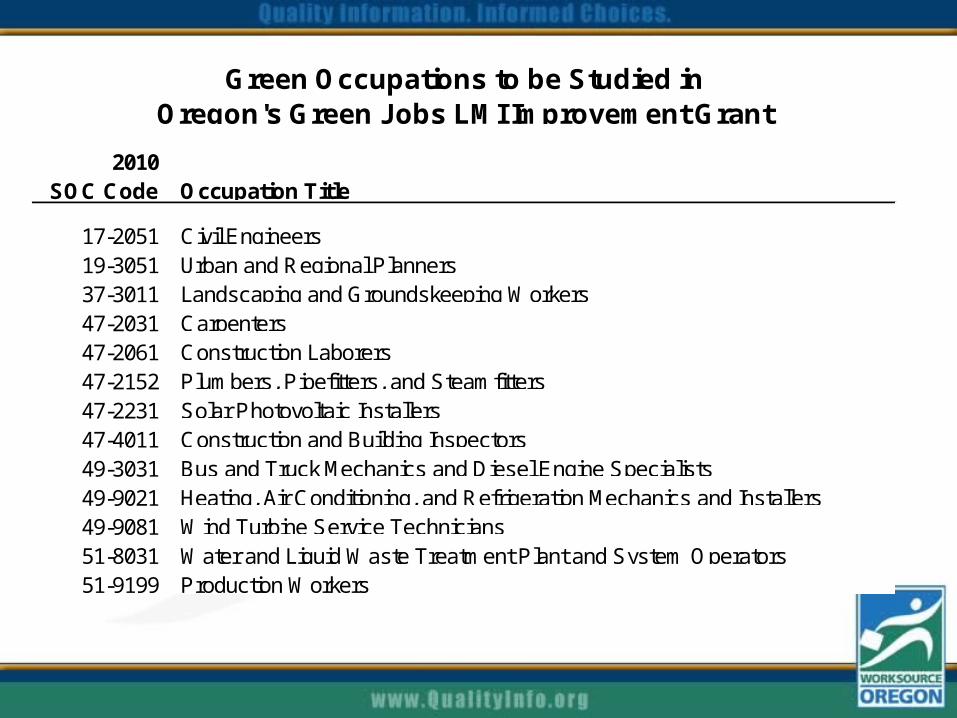
17-2051 Civil Engineers19-3051 Urban and Regional Planners37-3011 Landscaping and Groundskeeping Workers47-2031 Carpenters47-2061 Construction Laborers47-2152 Plumbers, Pipefitters, and Steamfitters47-2231 Solar Photovoltaic Installers47-4011 Construction and Building Inspectors49-3031 Bus and Truck Mechanics and Diesel Engine Specialists49-9021 Heating, Air Conditioning, and Refrigeration Mechanics and Installers49-9081 Wind Turbine Service Technicians51-8031 Water and Liquid Waste Treatment Plant and System Operators51-9199 Production Workers
Green Occupations to be Studied inOregon's Green Jobs LMI Improvement Grant
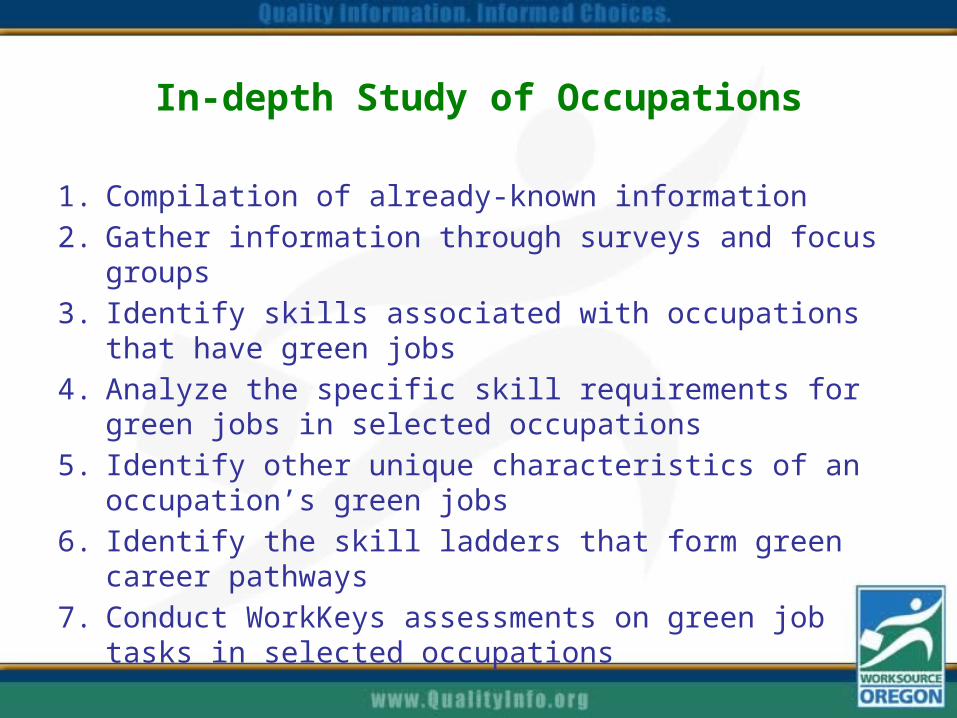
In-depth Study of Occupations
1. Compilation of already-known information
2. Gather information through surveys and focus groups
3. Identify skills associated with occupations that have green jobs
4. Analyze the specific skill requirements for green jobs in selected occupations
5. Identify other unique characteristics of an occupation’s green jobs
6. Identify the skill ladders that form green career pathways
7. Conduct WorkKeys assessments on green job tasks in selected occupations
Next Steps for In-Depth Study of Occupations
• DCCWD – conduct 30 WorkKeys assessments in 10 occupations• OED will conduct assessments of the other three
• Skills will be compiled for green jobs within the selected occupations
• Skills will be incorporated into iMatchSkills system• DCCWD – incorporate occupational information into new
statewide green career pathways for five occupations

WorkKeys for Green Jobs
1. Develop a “Final Task List”
2. Identify required skill level for:• Applied mathematics• Locating information• Reading for information• Teamwork
3. Identify which tasks, if any, are related to the definition of a green job
4. Identify which tasks, if any, require a higher skill level because of their “greenness”

Example WorkKeys for Green Jobs
Solar Photovoltaic Installer• All tasks have a green component, mostly related
to “producing renewable energy”
Plumber• 10 out of 25 tasks have a green component,
mostly related to “preventing, reducing, or mitigating environmental degradation”
Building Inspector• 9 out of 19 tasks have a green component, mostly
related to “increasing energy efficiency”

Example WorkKeys for Green Jobs
Solar Photovoltaic Installer• Install photovoltaic systems in accordance with
codes and standards…
Plumber• Ensures work is done to standard by reading and
interpreting plumbing codes…
Building Inspector• Assesses energy efficiency and safety of
residential buildings by performing building air leak tests, lead paint evaluation, etc…

Employment Analyses of Companies in Green Sectors
Select green sectors for analysis (overlap with recommendations of Green Jobs Council)
Identify firms working in each sector Conduct analyses of Unemployment Insurance wage
records for those firms• Which industries did workers come from?• How have workers’ wages and hours changed over
time?• What are the employment trends of green
companies?
Renewable Energy Production & Generation
• 13 firms that produce renewable energy (electricity) for the “grid”
• Total employment 2009Q3: 11,040• Private jobs down 1,241 from 2004Q3 to 2009Q3 (-12%)
• -4% for all firms in the same industries• -2% for all private firms
• Trends dominated by wood & paper product manufacturing• 2009Q3 median wage was $30.01
• $26.14 for all firms in the same industries• $15.25 for all private firms
• $171 million in total wages

Green Manufacturing
• 40+ firms that manufacture a “green product”• Total employment 2009Q4: 1,921• Jobs up 685 from 2004Q4 to 2009Q4 (55%)
• -8% for all firms in the same industries• -3% for all private firms
• Jobs concentrated in larger firms (50+ employees)• 2009Q4 median wage was $20.87
• $22.72 for all firms in the same industries• $15.70 for all private firms
• $32 million in total wages

Energy Efficiency
• 750 firms involved in weatherization and retrofits• Total employment 2009Q4: 12,136• Jobs up 114 from 2004Q4 to 2009Q4 (1%)
• -3% for all firms in the same industries• -3% for all private firms
• 960 jobs at new firms during the period, while 850 jobs were lost at firms that were open the full 5 years
• 2009Q4 median wage was $24.65• $16.74 for all firms in the same industries• $15.70 for all private firms
• $168 million in total wages

Energy Transmission
• 40+ firms & local utilities involved in transmission• Total employment 2009Q4: 9,975• Jobs up 166 from 2004Q4 to 2009Q4 (2%)
• 4% for all firms in the same industries• -2% for the whole economy
• Jobs concentrated in local government• 2009Q4 median wage was $38.81
• $25.91 for all firms in the same industries• $15.70 for all private firms
• $211 million in total wages
Green Transportation
• 60+ entities involved in transit, EVs, and batteries• Total employment 2009Q4: 12,776• Jobs up 406 from 2004Q4 to 2009Q4 (3%)
• 6% for all entities in the same industries• 9% for private firms in the same industries
• 95% of jobs in local government• 2009Q4 median wage was $26.51
• $18.41 for all entities in the same industries• $14.09 for private firms in the same industries
• $154 million in total wages

Green Building and Forest Products
• 85+ entities involved in design and construction, or in growth and supply
• Total employment 2009Q4: 1,988• Jobs up 462 from 2004Q4 to 2009Q4 (30%)
• -9% for private firms in the same industries• 2009Q4 median wage was $30.46
• $21.40 for private firms in the same industries• $44 million in total wages• Large losses in 2009
• Jobs: -14%• Wages: -20%
Other Green Sectors to be Analyzed
• Environmental Technologies and Services: operation, service and maintenance

Sector Firms2009
Employment5-year
Change5-year
GrowthMedian
WageTotal
WagesRenewable Energy 13 11,040 (1,241) -11% $30.01 $171Green Manufacturing 40 1,921 685 36% $20.87 $32Energy Efficiency 750 12,136 114 1% $24.65 $168Energy Transmission 40 9,975 166 2% $38.81 $211Green Trasportation 60 12,776 406 3% $26.51 $154Green Building & Forest Products 85 1,988 462 23% $30.46 $44Enviornmental Tech. & Services ? ? ? ? ? ?Total 988 49,836 592 1% ? $780
Oregon 128,380 1,603,520 (21,078) -1% $16.16 $17,286
Green Sector Summary

Green Jobs in Natural Resources
• Surveyed 3,000+ employers• Surveyed both “covered” and “non-covered”
establishments• First survey-based estimates in 10 years
• U.S. Department of Agriculture National Agricultural Statistics Service, Oregon Field Office• Provided “non-covered” universe• Conducted ½ of survey
• Results combined for a complete picture

122,730 Jobs spread across 5 sectors…
Count Percent Count Percent
Crop production 20,377 55% 58,061 68%Animal production 5,249 14% 4,145 5%Forestry and logging 4,935 13% 1,401 2%Fishing, hunting and trapping 365 1% 495 1%Agriculture and forestry support activities 6,241 17% 21,461 25%
Total 37,167 100% 85,563 100%
SectorYear-round Seasonal
Distribution of Jobs by Sector

… most of which are seasonal jobs
Year-round Seasonal
Crop production 26% 74%Animal production 56% 44%Forestry and logging 78% 22%Fishing, hunting and trapping 42% 58%Agriculture and forestry support activities 23% 77%
Total 30% 70%
Distribution of Sector Jobs by Seasonality
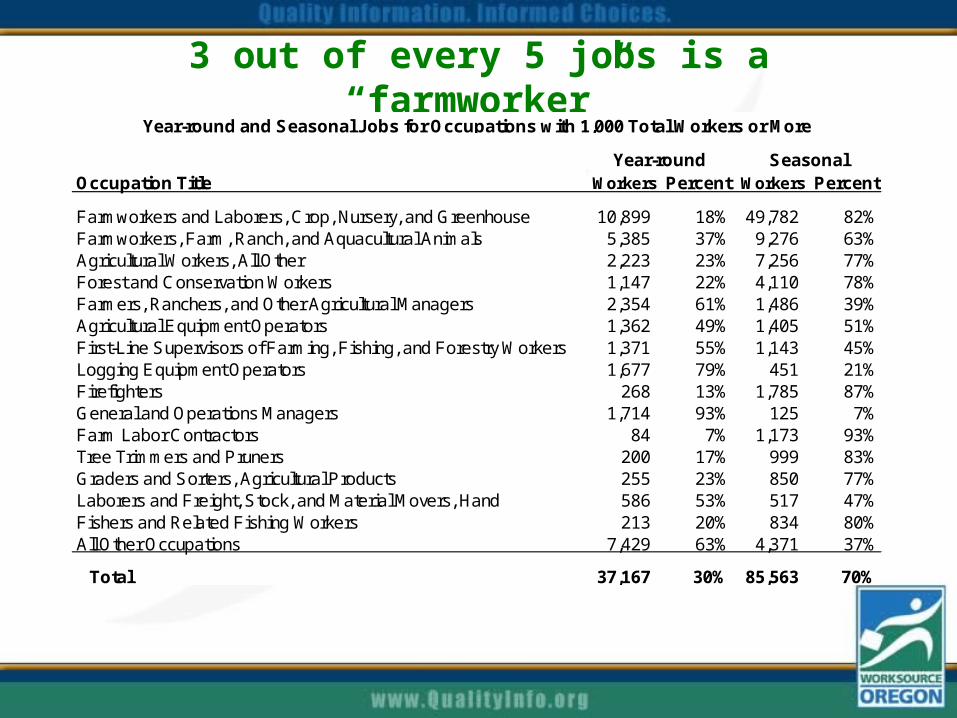
3 out of every 5 jobs is a “farmworker”
Occupation Title Workers Percent Workers Percent
Farmworkers and Laborers, Crop, Nursery, and Greenhouse 10,899 18% 49,782 82%Farmworkers, Farm, Ranch, and Aquacultural Animals 5,385 37% 9,276 63%Agricultural Workers, All Other 2,223 23% 7,256 77%Forest and Conservation Workers 1,147 22% 4,110 78%Farmers, Ranchers, and Other Agricultural Managers 2,354 61% 1,486 39%Agricultural Equipment Operators 1,362 49% 1,405 51%First-Line Supervisors of Farming, Fishing, and Forestry Workers 1,371 55% 1,143 45%Logging Equipment Operators 1,677 79% 451 21%Firefighters 268 13% 1,785 87%General and Operations Managers 1,714 93% 125 7%Farm Labor Contractors 84 7% 1,173 93%Tree Trimmers and Pruners 200 17% 999 83%Graders and Sorters, Agricultural Products 255 23% 850 77%Laborers and Freight, Stock, and Material Movers, Hand 586 53% 517 47%Fishers and Related Fishing Workers 213 20% 834 80%All Other Occupations 7,429 63% 4,371 37%
Total 37,167 30% 85,563 70%
Year-round and Seasonal Jobs for Occupations with 1,000 Total Workers or More
Year-round Seasonal

Green Jobs are also seasonal…
Crop production 4,048 8,700 Animal production 1,126 428 Forestry and logging 1,009 374 Fishing, hunting and trapping 48 32 Agriculture and forestry support activities 747 2,047
Total 6,978 11,581
SectorGreen
year-roundGreen
seasonal
Count of Green Jobs by Sector
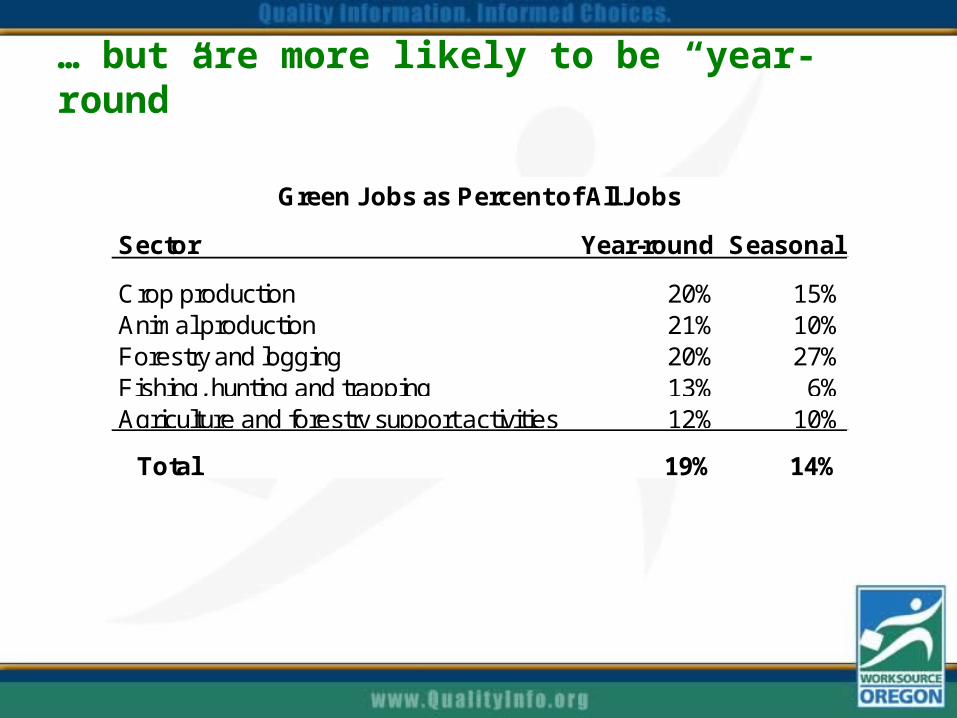
… but are more likely to be “year-round”
Sector Year-round Seasonal
Crop production 20% 15%Animal production 21% 10%Forestry and logging 20% 27%Fishing, hunting and trapping 13% 6%Agriculture and forestry support activities 12% 10%
Total 19% 14%
Green Jobs as Percent of All Jobs

Few employers acknowledge any significant difference between co-workers
Knowledge/Skill Frequency Percent
Personal Interest in Sustainability 88 25%Technical Skills & Knowledge 64 18%Work Ethic & Attitude 48 14%Education & Formal Training 33 10%Management & Leadership KSAs 24 7%Experience Level 22 6%Other & Unkown 68 20%
Total 347 100%
Key Knowledge & Skills Differences of Green Jobs

Green Jobs in Natural Resources
QuestionCrop
productionAnimal
productionForestry
and loggingFishing, hunting
and trappingAgriculture and forestry
support activities
Estimated count of employers 6,070 4,122 655 140 635 Special licenses, certificates, or training are prefered or required for some workers…
23% 5% 26% 26% 33%
Some workers use special tools and technologies…
25% 14% 9% 7% 16%
Some workers have green-related job activities…
36% 24% 36% 29% 33%
It is difficult to find workers with necessary knowledge and skills…
12% 8% 29% 33% 22%
Percent of Employers Responding Affirmative, by Sector 2009

Green Jobs in Natural Resources
Question 1-4 5-9 10-49 50-99 100+
Estimated count of employers 7,388 1,919 1,870 251 194 Special licenses, certificates, or training are prefered or required for some workers…
10% 15% 42% 45% 44%
Some workers use special tools and technologies…
13% 21% 38% 45% 48%
Some workers have green-related job activities…
24% 34% 53% 61% 57%
It is difficult to find workers with necessary knowledge and skills…
9% 19% 18% 21% 18%
Percent of Employers Responding Affirmative, by Size Class, 2009

Special Reports and Publications
• 10 stand-alone reports focused on green occupations• Occupational brochures• 2 educational posters
1 compete 12 green jobs-related articles Survey report
New dedicated page: www.QualityInfo.org/Green Also posted to our blog and twitter accounts

New software will bring long-term benefits…
• Will allow for iMatchSkills to identify green jobs based on selected skills• Employers will be able to post green jobs• Job-seekers will be able to search for green jobs
• Allows for continued research of jobs postings coded as green jobs
• Allows for estimate of current green job openings throughout Oregon
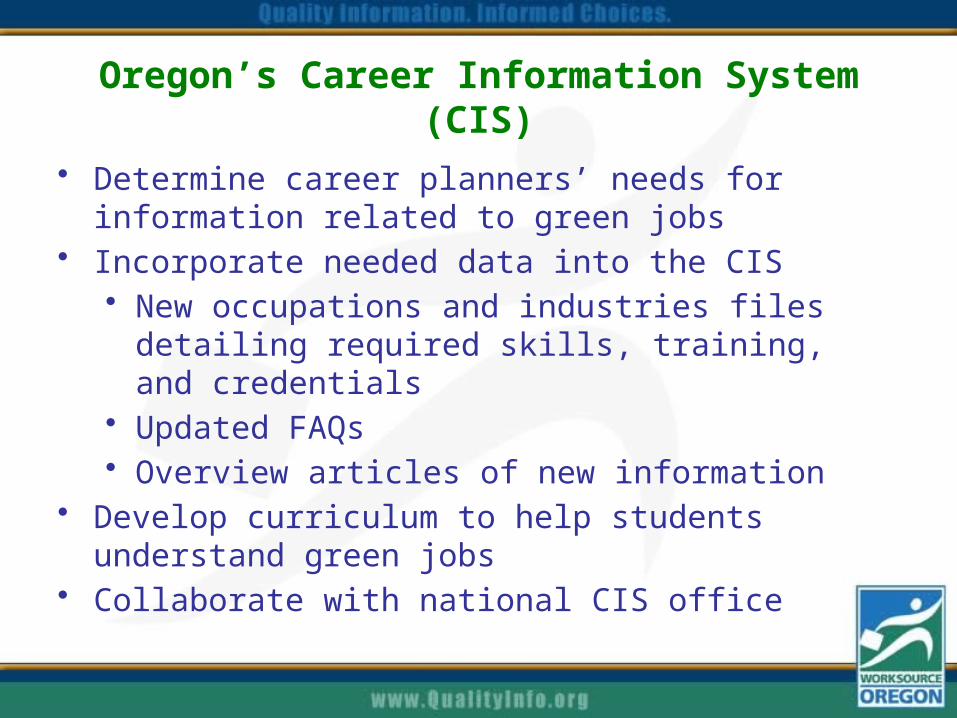
Oregon’s Career Information System (CIS)
• Determine career planners’ needs for information related to green jobs
• Incorporate needed data into the CIS • New occupations and industries files detailing
required skills, training, and credentials• Updated FAQs• Overview articles of new information
• Develop curriculum to help students understand green jobs
• Collaborate with national CIS office

DCCWD – Career Pathways
• Identify and map career paths and skill progressions that lead to green jobs Identify industry and occupation-specific technical
competencies Design career roadmaps (and certificates if appropriate) for
entry-level positions and progressive job advancement
• This project will use a new, statewide approach which links available occupational training at multiple community colleges throughout Oregon
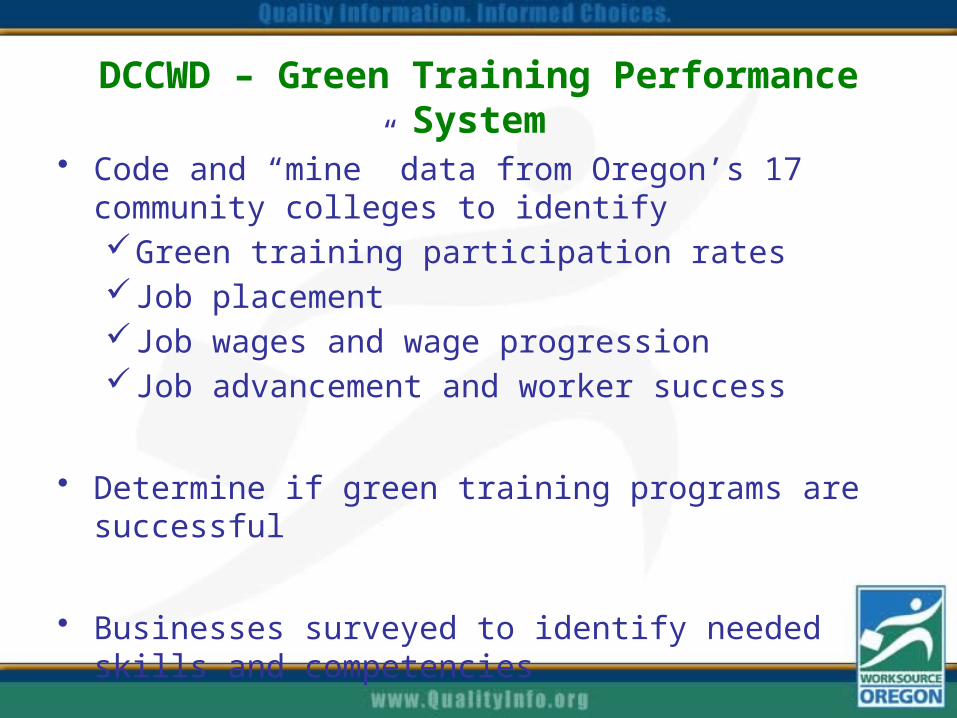
DCCWD – Green Training Performance System
• Code and “mine” data from Oregon’s 17 community colleges to identifyGreen training participation ratesJob placementJob wages and wage progressionJob advancement and worker success
• Determine if green training programs are successful
• Businesses surveyed to identify needed skills and competencies

Recent On-line Job Ads
0%
20%
40%
60%
80%
100%
120%
140%
160%
180%
200%
7/30/2006 7/30/2007 7/30/2008 7/30/2009 7/30/2010
Pe
rce
nta
ge
of F
ou
r-Y
ea
r Ave
rag
e
Active On-Line Ads for All Jobs and Green Jobs, 14-Week Moving Average
Green Jobs
All Jobs
Source: The Conference Board Help Wanted OnLine

Recent On-line Job Ads
Count Distribution Count Distribution
Portland 19,930 53% 370 52% 1.9%
Salem 2,780 7% 80 11% 2.7%
Eugene 2,540 7% 40 6% 1.6%
Bend 1,810 5% 30 5% 1.8%
Medford 1,530 4% 30 4% 2.0%
Corvallis 1,220 3% 20 3% 1.9%
Non-MSA 7,970 21% 140 19% 1.7%
Total 37,790 100% 710 100% 1.9%
Source: The Conference Board Help Wanted OnLine
All Job Ads Green Job Ads Concentration of Green Ads
Geographical Distribution of Oregon On-Line Job Ads for All Jobs and Green Jobs, August 2010

Recent On-line Job Ads
Jun Jul Aug
SolarWorld 58 92 41
U.S. Forest Service 23 30 28
Intel 27 25 23
GE Energy 23 25 26
HDR, Inc. 21 19 15
Oregon Employers With Active On-line Green Job Ads, Summer 2010
Source: The Conference Board Help Wanted OnLine

The Green LMI Grant has been extended…
• New end date is September 31, 2011• No new funds were awarded
• Will ensure completion of the WorkKeys profiles, and their incorporation in to other products
• Will ensure completion of the AutoCoder project• Will allow us to conduct a final analysis combining all
green sectors into one study• Will allow us to complete a 2nd statewide green
jobs survey, with results out in late fall

Charlie JohnsonSenior Economic Analyst
www.QualityInfo.org/Green
Disclaimer
• This workforce solution was funded by a grant by the U.S. Department of Labor’s Employment and Training Administration. The solution was created by the grantee and does not necessarily reflect the official position of the U.S. Department of Labor. The Department of Labor makes no guarantees, warranties, or assurances of any kind, express or implied, with respect to such information, including any information on linked sites and including, but not limited to, accuracy of the information or its completeness, timeliness, usefulness, adequacy, continued availability, or ownership. This solution is copyrighted by the institution that created it. Internal use by an organization and/or personal use by an individual for non-commercial purposes is permissible. All other uses require the prior authorization of the copyright owner.
•