
HOME BUYERS GUIDE - Reno Nevada Real Estate -Reno Realty- Kelly

May, 2020 May, 2020 May, 2020 Issue
A FREE monthly report by
© 2006-2019 CalNeva Realty 800-305-3015 www.CalNevaRealty.com
The Greater Reno-Tahoe
Reno, Sparks, Carson City, Carson Valley, Lake Tahoe, Dayton, and Fernley
Real Estate Report
Housing Market Trends for:

Page
Introduction 3
Quick Snapshot 4
Annual Housing Trends - Overview of Charts 5
Median Home Price 6
Number of Homes Sold 7
Sold Price to List Price Ratio (%) 8
Recent "Peak to Trough" Median Price Summary 9
Reno-Sparks Historical "Bubble Chart" 10
Monthly Housing Trends - Overview of Charts 11
Median Price by City 13
Months Supply of Inventory (MSI) by City 14
Reno 16
Sparks 18
Carson City 20
Carson Valley 22
Dayton 24
Fernley 26
Lake Tahoe 28
Data Sources & Definitions 29
Table of Contents

Report Overview
CalNeva Realty Overview
For Further Information
This report is prepared and published monthly by Mitch Argon, Broker/Owner of CalNeva Realty.
This report is published and distributed for free to benefit anyone wth an interest in our local real
estate trends.
You are free to use and/or share this report. Modifying this report in any way is a violation
of copyright law. If you (or someone you know) are interested in receiving a notification by
email when the report is updated each month, please send an email to
[email protected]. Comments, suggestions, or error-reporting are welcome
and can be sent to [email protected].
CalNeva Realty provides professional real estate services to clients throughout Greater Reno-
Tahoe through our two offices in Minden and Midtown Reno. We represent clients who are
selling or buying real estate and operate a full-service licensed brokerage as members of Reno-
Sparks Association of REALTORS (RSAR), Sierra Nevada Association of REALTORS (SNAR),
Incline Village Association of REALTORS (IVR), and Northern Nevada Regional Multiple Listing
Service (NNRMLS).
For further insight into the Greater Reno-Tahoe real estate market, visit our blog at
www.FreeNevadaMove.com/blog. There are frequent entries with additional market
comparisons, recent homes sold, and other useful information.
If you have a need for Greater Reno-Tahoe real estate market data not contained in this report,
please feel free to contact Mitch Argon (775-315-4424 or [email protected]) for
further assistance.
Introduction
The Greater Reno-Tahoe Real Estate Report
© 2006-2019, CalNeva Realty www.CalNevaRealty.com - 800-305-3015. Page 3 of 29

Months Supply of Inventory (MSI)
Apr-2019 Apr-2020 % Apr-2019 Apr-2020 % May-2019 May-2020 % May-2019 May-2020 %
Reno 400$ 438$ 10% 360 254 (29%) 2.4 1.5 (36%) 787 566 (28%)
Sparks 340$ 385$ 13% 164 125 (24%) 1.7 1.6 (7%) 243 241 (1%)
Carson City 360$ 325$ (10%) 54 47 (13%) 2.0 1.7 (11%) 95 96 1%
Carson Valley + 418$ 424$ 2% 62 63 2% 2.8 2.0 (27%) 178 144 (19%)
Dayton 320$ 337$ 5% 29 28 (3%) 2.3 1.8 (21%) 77 58 (25%)
Fernley 265$ 273$ 3% 55 39 (29%) 1.8 1.8 (2%) 87 82 (6%)
Lake Tahoe ++ 900$ 735$ (18%) 8 7 (13%) 5.6 5.2 (8%) 59 55 (7%)
+ Includes Minden, Gardnerville, Genoa, and Topaz areas
++ Due to low transaction volume, this number varies greatly and is not 100% representative of the Lake Tahoe market.
This summary is for single family (stick built) homes only.
Neutral Market 4 to 6 Months
Buyer Market > 6 Months
Market Snapshot - Single Family (Stick Built)
Median Price (in Thousands) Homes Sold Inventory
Seller Market < 4 Months
The Greater Reno-Tahoe Real Estate Report
© 2006-2019, CalNeva Realty www.CalNevaRealty.com - 800-305-3015. Page 4 of 29
Annual Median Home Price Trend (page 5)
Annual Number of Homes Sold (page 6)
Annual Sold Price to List Price % (page 7)
Annual TrendsAbout the Charts
This chart shows the annual median home price from 2002 to the present year for each
city/area in the region. For the current year, the chart will display the median price on a
"year to date" or "YTD" basis. The YTD median price will be from January 1st of the
current year to the last day of the month prior to the current issue of this report. The
median price in this chart will be more stable than the median home prices for each month
(see Monthly Reports) due to the increased number of homes that are used to compute
the median price on an annual basis. In the Lake Tahoe market, there are significantly
fewer homes sold each month so the YTD median price may be more volatile until April or
May for the current year.
This chart shows the annual number of homes sold from 2002 to the present year for
each city/area in the region. For the current year, the chart will display the number of
homes sold on a "year to date" or "YTD" basis. As a result, the current year will be
substantially lower in January and increase each month until you will be able to
approximate how many homes will be sold during the current year.
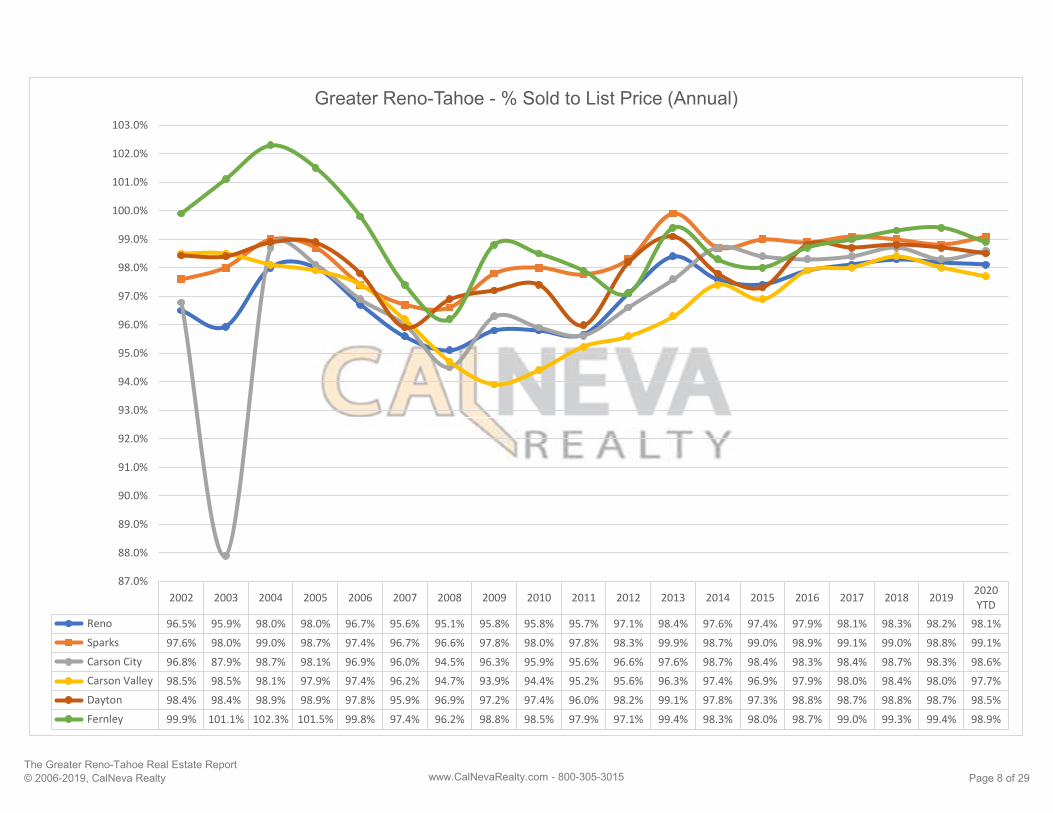
This chart shows what buyers are "actually paying" for homes relative to the "list price"
from 2002 to the current year. Year to Date (YTD) for the current year reflects this
measurement from January 1st to the last day of the month prior to the current issue.
Not surprisingly, you will see this percentage decrease during a Buyer's market and
increase during a Seller's market and the trendline closely corresponds to median price
increase trends.
The Greater Reno-Tahoe Real Estate Report
© 2006-2019, CalNeva Realty www.CalNevaRealty.com - 800-305-3015. Page 5 of 29

The Greater Reno-Tahoe Real Estate Report
© 2006-2019, CalNeva Realty www.CalNevaRealty.com - 800-305-3015 Page 6 of 29
2002 2003 2004 2005 2006 2007 2008 2009 2010 2011 2012 2013 2014 2015 2016 2017 2018 20192020
YTD
Reno $187,90 $219,00 $295,00 $355,00 $340,00 $325,00 $261,00 $190,00 $180,00 $158,00 $170,00 $221,00 $250,00 $290,00 $315,00 $350,00 $394,50 $407,50 $425,00
Sparks $169,00 $193,00 $263,00 $325,00 $315,00 $285,00 $237,00 $175,00 $163,00 $146,45 $160,00 $199,50 $235,00 $264,00 $288,50 $315,00 $353,50 $365,00 $379,50
Carson City $177,00 $199,00 $256,45 $317,50 $319,00 $280,00 $248,00 $195,00 $175,00 $144,90 $143,00 $175,40 $200,00 $230,00 $265,00 $287,00 $327,50 $349,00 $349,45
Carson Valley $220,50 $255,00 $317,00 $395,00 $395,00 $369,67 $285,00 $239,95 $218,25 $190,00 $195,00 $250,45 $277,50 $315,00 $325,00 $370,00 $418,00 $430,00 $453,25
Dayton $143,50 $160,37 $225,00 $250,45 $269,45 $240,00 $210,00 $158,95 $142,00 $117,50 $115,50 $139,95 $161,00 $190,10 $220,00 $259,25 $290,00 $317,50 $327,70
Fernley $123,43 $127,85 $165,00 $228,90 $247,00 $220,00 $166,00 $109,95 $107,00 $87,000 $89,000 $123,25 $140,00 $168,00 $209,84 $222,92 $252,00 $265,80 $275,00
$-
$50,000
$100,000
$150,000
$200,000
$250,000
$300,000
$350,000
$400,000
$450,000
$500,000
Greater Reno-Tahoe - Median Home Price (Annual)

The Greater Reno-Tahoe Real Estate Report
© 2006-2019, CalNeva Realty www.CalNevaRealty.com - 800-305-3015 Page 7 of 29
2002 2003 2004 2005 2006 2007 2008 2009 2010 2011 2012 2013 2014 2015 2016 2017 2018 2019
Reno 3,578 3,861 4,099 4,175 2,915 2,399 2,497 3,572 3,629 3,995 4,185 4,246 4,092 4,361 4,451 4,744 4,165 4,377
Sparks 1,331 1,582 1,655 1,896 1,195 952 1,077 1,661 1,718 1,903 1,896 1,821 1,870 1,955 2,106 2,075 1,815 1,885
Carson City 766 696 751 674 499 385 340 385 406 525 597 602 541 598 683 780 612 670
Carson Valley 1,031 1,111 1,164 905 613 494 459 552 566 633 755 756 741 827 875 915 808 823
Dayton 198 229 264 288 198 144 176 308 239 332 366 322 304 324 313 398 438 370
Fernley 487 588 863 915 441 312 341 584 479 505 524 502 466 517 518 619 637 579
-
500
1,000
1,500
2,000
2,500
3,000
3,500
4,000
4,500
5,000
Greater Reno-Tahoe - Housing Units Sold (Annual)
The Greater Reno-Tahoe Real Estate Report
© 2006-2019, CalNeva Realty www.CalNevaRealty.com - 800-305-3015 Page 8 of 29
2002 2003 2004 2005 2006 2007 2008 2009 2010 2011 2012 2013 2014 2015 2016 2017 2018 20192020
YTD
Reno 96.5% 95.9% 98.0% 98.0% 96.7% 95.6% 95.1% 95.8% 95.8% 95.7% 97.1% 98.4% 97.6% 97.4% 97.9% 98.1% 98.3% 98.2% 98.1%
Sparks 97.6% 98.0% 99.0% 98.7% 97.4% 96.7% 96.6% 97.8% 98.0% 97.8% 98.3% 99.9% 98.7% 99.0% 98.9% 99.1% 99.0% 98.8% 99.1%
Carson City 96.8% 87.9% 98.7% 98.1% 96.9% 96.0% 94.5% 96.3% 95.9% 95.6% 96.6% 97.6% 98.7% 98.4% 98.3% 98.4% 98.7% 98.3% 98.6%
Carson Valley 98.5% 98.5% 98.1% 97.9% 97.4% 96.2% 94.7% 93.9% 94.4% 95.2% 95.6% 96.3% 97.4% 96.9% 97.9% 98.0% 98.4% 98.0% 97.7%
Dayton 98.4% 98.4% 98.9% 98.9% 97.8% 95.9% 96.9% 97.2% 97.4% 96.0% 98.2% 99.1% 97.8% 97.3% 98.8% 98.7% 98.8% 98.7% 98.5%
Fernley 99.9% 101.1% 102.3% 101.5% 99.8% 97.4% 96.2% 98.8% 98.5% 97.9% 97.1% 99.4% 98.3% 98.0% 98.7% 99.0% 99.3% 99.4% 98.9%
87.0%
88.0%
89.0%
90.0%
91.0%
92.0%
93.0%
94.0%
95.0%
96.0%
97.0%
98.0%
99.0%
100.0%
101.0%
102.0%
103.0%
Greater Reno-Tahoe - % Sold to List Price (Annual)

Peak Date Trough Date % Change* New High Date % Change**
Reno 379,000$ Aug-2005 142,000$ Jan-2012 (63%) 438,250$ Apr-2020 209%
Sparks 346,000$ Sep-2005 126,500$ Jan-2012 (63%) 389,000$ Mar-2020 208%
Carson City 346,000$ Aug-2005 124,225$ Jun-2012 (64%) 379,950$ Mar-2020 206%
Carson Valley + 432,000$ Sep-2005 163,000$ Jan-2012 (62%) 481,750$ Mar-2020 196%
Fernley 262,000$ May-2006 71,250$ Mar-2012 (73%) 278,000$ Mar-2020 290%
Dayton 305,000$ Jul-2006 89,900$ Mar-2012 (71%) 350,000$ Aug-2019 289%
Lake Tahoe ++ 1,673,000$ Nov-2005 320,000$ Jun-2012 (81%) 1,962,125$ May-2014 513%
* from Peak ** from Trough
+ Includes Minden, Gardnerville, Genoa, and Topaz areas
++ Due to low transaction volume, this number varies greatly and is not 100% representative of the Lake Tahoe market.
This summary is for single family (stick built) homes only.
Recent "Peak to Trough" Median Price Summary
The Greater Reno-Tahoe Real Estate Report
© 2006-2019, CalNeva Realty www.CalNevaRealty.com - 800-305-3015. Page 9 of 29

The Greater Reno-Tahoe Real Estate Report
© 2006-2019, CalNeva Realty www.CalNevaRealty.com - 800-305-3015 Page 10 of 29
$-
$50,000
$100,000
$150,000
$200,000
$250,000
$300,000
$350,000
$400,000
$450,000
Reno-Sparks Single Family Home "Bubble Chart"
Reno-Sparks Median Price 1% Quarterly Appreciation Rate
1995 - 2000 = 4.1% straight line appreciation per year
RED LINE = 1% per quarter apprecition (4.1% per year)
Q3-2005 - $355,000
Q1-2012 - $145,000
Q1-2020 - $401,263
Q1-2020 - $348,024
+ 82%
+ 15.3%
Q3-2005 - $195,420
Q1-2012 - $253,119
- 43%

Median Home Prices by City (page 11)
Homes Sold by City (page 12)
Months of Inventory by City (page 13)
Local Market Summaries (pages 14-27)
Monthly TrendsAbout the Charts
This chart shows the monthly median price over the last 24 months for each city in the
region. The table below the chart displays the median price (rounded up to the nearest
thousand) for each month.
You will notice that the median price can fluctuate from month to month. As a result, you
will want to look at the 'trendline' for a specific city over a period of 4-6 months or more.
Also, the Lake Tahoe area is ommitted from this report due to the substantially higher
median price over other areas in the region; by including Lake Tahoe, the increased scale
renders the other market's trend lines extremely difficult to reasonably view. You can see
the Lake Tahoe median price trend (over the last 24 months) on a later chart dedicated to
Lake Tahoe real estate.
This chart shows "Months of Inventory" (see page 28 for definitions) over the last 24
months for each market in the region. Just like any other open market system, an increas
in inventory provides more choices for a "buyer" which leads to a Buyer's market where the
home buyer will generally have more negotiating leverage. Conversely, when inventory
levels are lower, home sellers have less competition (buyers have fewer choices), the
homes seller will have an advantage in setting and realizing a higher price. The National
Association of REALTORS (NAR) uses the guideline of a 'balanced market' between 4-6
months of inventory. We use the same standard in this report.
Specific areas or "price bands" can determine a 'buyer' or 'seller' market and should be
discussed carefully with your CalNeva Realty agent.
These charts two for each local market) show the relationship between median price trend
and the number of homes sold as well as the months supply of inventory. Note that
inventory and homes sold are measured on the right axis while median price is measured
on the left axis.
This 'view' into the market enables you to see the relationship of units sold and months
supply of inventory has on price for each local market.
This chart shows the number of homes sold over the last 24 months for each market in the
region.
The Greater Reno-Tahoe Real Estate Report
© 2006-2019, CalNeva Realty www.CalNevaRealty.com - 800-305-3015. Page 11 of 29

The Greater Reno-Tahoe Real Estate Report
© 2006-2019, CalNeva Realty www.CalNevaRealty.com - 800-305-3015 Page 12 of 29
A M J J A S O N D J-19 F M A M J J A S O N D J-20 F M A
Reno $386 $395 $400 $400 $396 $391 $403 $395 $380 $379 $383 $391 $400 $422 $412 $420 $410 $405 $415 $415 $405 $430 $406 $430 $438
Sparks $357 $353 $365 $365 $355 $345 $353 $360 $345 $339 $360 $350 $340 $351 $374 $380 $379 $379 $365 $370 $367 $369 $367 $389 $385
Carson City $360 $307 $348 $330 $337 $350 $375 $315 $349 $330 $340 $330 $360 $340 $360 $355 $355 $358 $340 $357 $340 $357 $345 $380 $325
Carson Valley $401 $427 $410 $440 $442 $399 $430 $423 $405 $475 $372 $417 $418 $425 $450 $428 $439 $395 $399 $465 $450 $452 $410 $482 $424
Dayton $286 $286 $285 $306 $300 $304 $293 $285 $315 $299 $325 $292 $320 $321 $295 $327 $350 $314 $330 $334 $293 $329 $335 $308 $337
Fernley $248 $255 $253 $253 $253 $243 $259 $262 $259 $259 $271 $260 $265 $275 $266 $265 $265 $268 $263 $274 $275 $275 $275 $278 $273
$-
$100
$200
$300
$400
$500
$600
Me
dia
n H
om
e P
rice
(T
ho
usa
nd
s)
Greater Reno-TahoeMedian Home Price by City/Area

The Greater Reno-Tahoe Real Estate Report
© 2006-2019, CalNeva Realty www.CalNevaRealty.com - 800-305-3015 Page 13 of 29
A M J J A S O N D J-19 F M A M J J A S O N D J-20 F M A
Reno 336 410 421 375 374 306 320 321 253 235 244 280 360 458 406 431 427 402 415 321 352 258 307 357 254
Sparks 149 162 165 180 172 137 139 139 126 87 111 168 164 213 155 167 189 166 141 131 156 126 144 145 125
Carson City 57 60 68 43 61 45 51 41 45 33 33 49 54 75 49 77 53 58 69 45 59 42 45 41 47
Carson Valley 79 63 67 69 88 70 73 62 62 53 46 54 62 75 86 69 83 83 71 67 69 65 51 70 63
Dayton 36 57 44 34 44 27 42 28 29 17 22 31 29 38 39 40 29 36 31 24 30 30 33 29 28
Fernley 56 53 60 53 54 63 45 44 44 26 38 47 55 55 61 53 48 39 51 47 40 38 38 49 39
-
50
100
150
200
250
300
350
400
450
500
Ho
me
s S
old
Greater Reno-TahoeHousing Units Sold by City/Area

The Greater Reno-Tahoe Real Estate Report
© 2006-2019, CalNeva Realty www.CalNevaRealty.com - 800-305-3015 Page 14 of 29
M J J A S O N D J-19 F M A M J J A S O N D J-20 F M A M
Reno 1.3 1.6 1.8 2.2 2.5 2.8 2.7 2.5 2.3 2.3 1.9 2.1 2.4 2.7 2.9 3.0 2.9 2.6 2.2 1.9 1.5 1.2 1.2 1.5 1.5
Sparks 0.9 1.3 1.5 1.7 2.0 2.2 2.3 2.2 2.0 2.1 1.5 1.4 1.7 2.0 2.3 2.3 2.4 2.4 2.0 1.7 1.2 1.0 0.8 1.3 1.6
Carson City 1.0 1.1 1.3 1.6 1.7 1.9 1.8 1.7 1.4 1.6 1.7 1.9 2.0 2.5 2.7 2.6 2.5 2.3 1.8 1.6 1.3 1.0 1.1 1.5 1.7
Carson Valley 1.4 2.0 2.3 2.4 2.5 2.7 2.6 2.7 2.5 2.2 2.0 2.0 2.8 2.7 3.1 3.1 3.3 3.0 2.7 2.4 2.1 2.0 1.7 2.0 2.0
Dayton 1.4 1.6 1.5 1.6 1.9 1.9 1.6 1.5 1.4 1.6 1.5 2.0 2.3 2.4 2.7 2.6 2.8 2.5 2.6 2.5 1.7 1.7 1.6 2.3 1.8
Fernley 1.6 1.9 1.9 2.2 2.1 2.4 2.3 2.0 2.1 2.4 1.8 1.6 1.8 2.1 2.2 2.5 2.7 2.7 2.4 2.1 2.0 1.9 1.8 1.9 1.8
-
1.0
2.0
3.0
4.0
5.0
6.0
7.0
8.0
9.0
10.0
Mo
nth
s S
up
ply
of
Inv
en
tory
(M
SI)
Greater Reno-TahoeMonths Supply of Inventory (MSI) by City/Area
> 6 Months = Buyer's Market
4 - 6 Months = Neutral Market
< 4 Months = Seller's Market

The Greater Reno-Tahoe Real Estate Report
© 2006-2019, CalNeva Realty www.CalNevaRealty.com - 800-305-3015 Page 15 of 29
A M J J A S O N D J-19 F M A M J J A S O N D J-20 F M A
Median Price (Thousands) $386 $395 $400 $400 $396 $391 $403 $395 $380 $379 $383 $391 $400 $422 $412 $420 $410 $405 $415 $415 $405 $430 $406 $430 $438
Price Change (annual) 17% 13% 13% 4% 10% 12% 12% 10% 10% 3% 1% (2%) 4% 7% 3% 5% 3% 4% 3% 5% 7% 13% 6% 10% 10%
Homes Sold 336 410 421 375 374 306 320 321 253 235 244 280 360 458 406 431 427 402 415 321 352 258 307 357 254
Sold Change (annual) (25%) (11%) (20%) (14%) (25%) (29%) (19%) (14%) (27%) (18%) (23%) (23%) 7% 12% (4%) 15% 14% 31% 30% 0% 39% 10% 26% 28% (29%)
$386
$400
$438
-
50
100
150
200
250
300
350
400
450
500
$-
$50
$100
$150
$200
$250
$300
$350
$400
$450
$500
Ho
me
s So
ld
Me
dia
n P
rice
(T
ho
usa
nd
s)
RenoMedian Price & Homes Sold

The Greater Reno-Tahoe Real Estate Report
© 2006-2019, CalNeva Realty www.CalNevaRealty.com - 800-305-3015 Page 16 of 29
A M J J A S O N D J-19 F M A M J J A S O N D J-20 F M A
Median Price (Thousands) $386 $395 $400 $400 $396 $391 $403 $395 $380 $379 $383 $391 $400 $422 $412 $420 $410 $405 $415 $415 $405 $430 $406 $430 $438
Price Change (annual) 17% 13% 13% 4% 10% 12% 12% 10% 10% 3% 1% (2%) 4% 7% 3% 5% 3% 4% 3% 5% 7% 13% 6% 10% 10%
MSI 1.1 1.3 1.6 1.8 2.2 2.5 2.8 2.7 2.5 2.3 2.3 1.9 2.1 2.4 2.7 2.9 3.0 2.9 2.6 2.2 1.9 1.5 1.2 1.2 1.5
MSI Change (annual) 116% 138% 95% 82% 90% 70% 65% 40% 18% (8%) (18%) (25%) (32%) (47%) (36%) (28%)
$386
$400
$438
-
1.0
2.0
3.0
4.0
5.0
6.0
7.0
8.0
9.0
10.0
$-
$50
$100
$150
$200
$250
$300
$350
$400
$450
$500
Mo
nth
s Su
pp
ly o
f In
ven
tory
(M
SI)
Me
dia
n P
rice
(T
ho
usa
nd
s)
RenoMedian Price & Months Supply of Inventory (MSI)
> 6 Months = Buyer's Market
4 - 6 Months = Neutral Market
< 4 Months = Seller's Market

The Greater Reno-Tahoe Real Estate Report
© 2006-2019, CalNeva Realty www.CalNevaRealty.com - 800-305-3015 Page 17 of 29
A M J J A S O N D J-19 F M A M J J A S O N D J-20 F M A
Median Price (Thousands) $357 $353 $365 $365 $355 $345 $353 $360 $345 $339 $360 $350 $340 $351 $374 $380 $379 $379 $365 $370 $367 $369 $367 $389 $385
Price Change (annual) 15% 12% 22% 9% 8% 10% 7% 7% 1% (1%) 3% 2% (5%) (0%) 3% 4% 7% 10% 3% 3% 6% 9% 2% 11% 13%
Homes Sold 149 162 165 180 172 137 139 139 126 87 111 168 164 213 155 167 189 166 141 131 156 126 144 145 125
Sold Change (annual) (32%) (25%) (28%) (6%) (19%) (20%) (5%) (9%) (11%) (24%) (9%) (10%) 10% 31% (6%) (7%) 10% 21% 1% (6%) 24% 45% 30% (14%) (24%)
$357
$340
$385
-
50
100
150
200
250
$-
$50
$100
$150
$200
$250
$300
$350
$400
$450
Ho
me
s So
ld
Me
dia
n P
rice
(T
ho
usa
nd
s)
SparksMedian Price & Homes Sold

The Greater Reno-Tahoe Real Estate Report
© 2006-2019, CalNeva Realty www.CalNevaRealty.com - 800-305-3015 Page 18 of 29
A M J J A S O N D J-19 F M A M J J A S O N D J-20 F M A
Median Price (Thousands) $357 $353 $365 $365 $355 $345 $353 $360 $345 $339 $360 $350 $340 $351 $374 $380 $379 $379 $365 $370 $367 $369 $367 $389 $385
Price Change (annual) 15% 12% 22% 9% 8% 10% 7% 7% 1% (1%) 3% 2% (5%) (0%) 3% 4% 7% 10% 3% 3% 6% 9% 2% 11% 13%
MSI 0.8 0.9 1.3 1.5 1.7 2.0 2.2 2.3 2.2 2.0 2.1 1.5 1.4 1.7 2.0 2.3 2.3 2.4 2.4 2.0 1.7 1.2 1.0 0.8 1.3
MSI Change (annual) 151% 166% 123% 85% 82% 57% 54% 38% 18% 8% (13%) (23%) (37%) (52%) (50%) (6%)
$357
$340
$385
-
1.0
2.0
3.0
4.0
5.0
6.0
7.0
8.0
9.0
10.0
$-
$50
$100
$150
$200
$250
$300
$350
$400
$450
Mo
nth
s Su
pp
ly o
f In
ven
tory
(M
SI)
Me
dia
n P
rice
(T
ho
usa
nd
s)
SparksMedian Price & Months Supply of Inventory (MSI)
> 6 Months = Buyer's Market
4 - 6 Months = Neutral Market
< 4 Months = Seller's Market

The Greater Reno-Tahoe Real Estate Report
© 2006-2019, CalNeva Realty www.CalNevaRealty.com - 800-305-3015 Page 19 of 29
A M J J A S O N D J-19 F M A M J J A S O N D J-20 F M A
Median Price (Thousands) $360 $307 $348 $330 $337 $350 $375 $315 $349 $330 $340 $330 $360 $340 $360 $355 $355 $358 $340 $357 $340 $357 $345 $380 $325
Price Change (annual) 26% 11% 20% 16% 12% 19% 20% 9% 27% 8% 8% 5% (0%) 11% 3% 8% 5% 2% (9%) 13% (3%) 8% 1% 15% (10%)
Homes Sold 57 60 68 43 61 45 51 41 45 33 33 49 54 75 49 77 53 58 69 45 59 42 45 41 47
Sold Change (annual) (19%) (17%) (36%) (28%) (14%) (37%) (29%) (45%) (4%) (15%) (13%) 9% (5%) 25% (28%) 79% (13%) 29% 35% 10% 31% 27% 36% (16%) (13%)
$360 $360
$325
-
10
20
30
40
50
60
70
80
90
$-
$50
$100
$150
$200
$250
$300
$350
$400
Ho
me
s So
ld
Me
dia
n P
rice
(T
ho
usa
nd
s)
Carson CityMedian Price & Homes Sold

The Greater Reno-Tahoe Real Estate Report
© 2006-2019, CalNeva Realty www.CalNevaRealty.com - 800-305-3015 Page 20 of 29
A M J J A S O N D J-19 F M A M J J A S O N D J-20 F M A
Median Price (Thousands) $360 $307 $348 $330 $337 $350 $375 $315 $349 $330 $340 $330 $360 $340 $360 $355 $355 $358 $340 $357 $340 $357 $345 $380 $325
Price Change (annual) 26% 11% 20% 16% 12% 19% 20% 9% 27% 8% 8% 5% (0%) 11% 3% 8% 5% 2% (9%) 13% (3%) 8% 1% 15% (10%)
MSI 0.8 1.0 1.1 1.3 1.6 1.7 1.9 1.8 1.7 1.4 1.6 1.7 1.9 2.0 2.5 2.7 2.6 2.5 2.3 1.8 1.6 1.3 1.0 1.1 1.5
MSI Change (annual) 39% 103% 119% 134% 101% 124% 107% 61% 44% 22% 1% (7%) (7%) (37%) (33%) (22%)
$360 $360
$325
-
1.0
2.0
3.0
4.0
5.0
6.0
7.0
8.0
9.0
10.0
$-
$50
$100
$150
$200
$250
$300
$350
$400
$450
Mo
nth
s Su
pp
ly o
f In
ven
tory
(M
SI)
Me
dia
n P
rice
(T
ho
usa
nd
s)
Carson CityMedian Price & Months Supply of Inventory (MSI)
> 6 Months = Buyer's Market
4 - 6 Months = Neutral Market
< 4 Months = Seller's Market

The Greater Reno-Tahoe Real Estate Report
© 2006-2019, CalNeva Realty www.CalNevaRealty.com - 800-305-3015 Page 21 of 29
A M J J A S O N D J-19 F M A M J J A S O N D J-20 F M A
Median Price (Thousands) $401 $427 $410 $440 $442 $399 $430 $423 $405 $475 $372 $417 $418 $425 $450 $428 $439 $395 $399 $465 $450 $452 $410 $482 $424
Price Change (annual) 8% 18% 16% 21% 13% 5% 22% 3% 2% 15% 4% (1%) 4% (0%) 10% (3%) (1%) (1%) (7%) 10% 11% (5%) 10% 16% 2%
Homes Sold 79 63 67 69 88 70 73 62 62 53 46 54 62 75 86 69 83 83 71 67 69 65 51 70 63
Sold Change (annual) (16%) (27%) (32%) (19%) 4% (28%) (9%) (13%) (23%) (7%) (2%) (11%) (22%) 19% 28% 0% (6%) 19% (3%) 8% 11% 23% 11% 30% 2%
$401 $418 $424
-
10
20
30
40
50
60
70
80
90
100
$-
$100
$200
$300
$400
$500
$600
Ho
me
s So
ld
Me
dia
n P
rice
(T
ho
usa
nd
s)
Carson ValleyMedian Price & Homes Sold

The Greater Reno-Tahoe Real Estate Report
© 2006-2019, CalNeva Realty www.CalNevaRealty.com - 800-305-3015 Page 22 of 29
A M J J A S O N D J-19 F M A M J J A S O N D J-20 F M A
Median Price (Thousands) $401 $427 $410 $440 $442 $399 $430 $423 $405 $475 $372 $417 $418 $425 $450 $428 $439 $395 $399 $465 $450 $452 $410 $482 $424
Price Change (annual) 8% 18% 16% 21% 13% 5% 22% 3% 2% 15% 4% (1%) 4% (0%) 10% (3%) (1%) (1%) (7%) 10% 11% (5%) 10% 16% 2%
MSI 1.4 1.4 2.0 2.3 2.4 2.5 2.7 2.6 2.7 2.5 2.2 2.0 2.0 2.8 2.7 3.1 3.1 3.3 3.0 2.7 2.4 2.1 2.0 1.7 2.0
MSI Change (annual) 65% 61% 59% 49% 101% 38% 39% 28% 35% 11% 2% (12%) (15%) (6%) (12%) (2%)
$401 $418 $424
-
1.0
2.0
3.0
4.0
5.0
6.0
7.0
8.0
9.0
10.0
$-
$100
$200
$300
$400
$500
$600
Mo
nth
s Su
pp
ly o
f In
ven
tory
(M
SI)
Me
dia
n P
rice
(T
ho
usa
nd
s)
Carson ValleyMedian Price & Months Supply of Inventory (MSI)
> 6 Months = Buyer's Market
4 - 6 Months = Neutral Market
< 4 Months = Seller's Market

The Greater Reno-Tahoe Real Estate Report
© 2006-2019, CalNeva Realty www.CalNevaRealty.com - 800-305-3015 Page 23 of 29
A M J J A S O N D J-19 F M A M J J A S O N D J-20 F M A
Median Price (Thousands) $286 $286 $285 $306 $300 $304 $293 $285 $315 $299 $325 $292 $320 $321 $295 $327 $350 $314 $330 $334 $293 $329 $335 $308 $337
Price Change (annual) 14% 21% 15% 20% 8% 18% 6% 2% 7% (4%) 26% 3% 12% 12% 4% 7% 17% 4% 13% 17% (7%) 10% 3% 5% 5%
Homes Sold 36 57 44 34 44 27 42 28 29 17 22 31 29 38 39 40 29 36 31 24 30 30 33 29 28
Sold Change (annual) 9% 46% (2%) (15%) 26% (36%) 40% (3%) 32% (43%) 0% (24%) (19%) (33%) (11%) 18% (34%) 33% (26%) (14%) 3% 76% 50% (6%) (3%)
$286
$320
$337
-
10
20
30
40
50
60
$-
$50
$100
$150
$200
$250
$300
$350
$400
Ho
me
s So
ld
Me
dia
n P
rice
(T
ho
usa
nd
s)
DaytonMedian Price & Homes Sold

The Greater Reno-Tahoe Real Estate Report
© 2006-2019, CalNeva Realty www.CalNevaRealty.com - 800-305-3015 Page 24 of 29
A M J J A S O N D J-19 F M A M J J A S O N D J-20 F M A
Median Price (Thousands) $286 $286 $285 $306 $300 $304 $293 $285 $315 $299 $325 $292 $320 $321 $295 $327 $350 $314 $330 $334 $293 $329 $335 $308 $337
Price Change (annual) 14% 21% 15% 20% 8% 18% 6% 2% 7% (4%) 26% 3% 12% 12% 4% 7% 17% 4% 13% 17% (7%) 10% 3% 5% 5%
MSI 1.4 1.4 1.6 1.5 1.6 1.9 1.9 1.6 1.5 1.4 1.6 1.5 2.0 2.3 2.4 2.7 2.6 2.8 2.5 2.6 2.5 1.7 1.7 1.6 2.3
MSI Change (annual) (6%) 27% (9%) 46% 60% 48% 84% 62% 48% 31% 65% 60% 26% 9% 12% 12%
$286
$320
$337
-
1.0
2.0
3.0
4.0
5.0
6.0
7.0
8.0
9.0
10.0
$-
$50
$100
$150
$200
$250
$300
$350
$400
Mo
nth
s Su
pp
ly o
f In
ven
tory
(M
SI)
Me
dia
n P
rice
(T
ho
usa
nd
s)
DaytonMedian Price & Months Supply of Inventory (MSI)
> 6 Months = Buyer's Market
4 - 6 Months = Neutral Market
< 4 Months = Seller's Market
The Greater Reno-Tahoe Real Estate Report
© 2006-2019, CalNeva Realty www.CalNevaRealty.com - 800-305-3015 Page 25 of 29
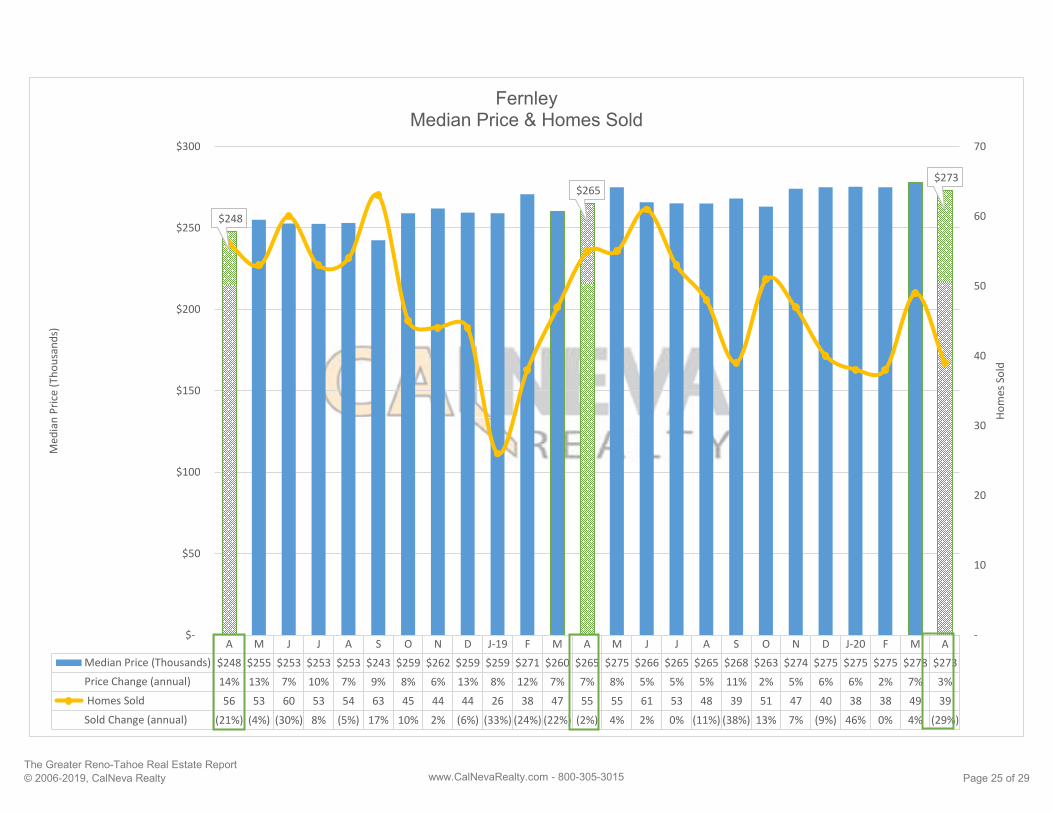
A M J J A S O N D J-19 F M A M J J A S O N D J-20 F M A
Median Price (Thousands) $248 $255 $253 $253 $253 $243 $259 $262 $259 $259 $271 $260 $265 $275 $266 $265 $265 $268 $263 $274 $275 $275 $275 $278 $273
Price Change (annual) 14% 13% 7% 10% 7% 9% 8% 6% 13% 8% 12% 7% 7% 8% 5% 5% 5% 11% 2% 5% 6% 6% 2% 7% 3%
Homes Sold 56 53 60 53 54 63 45 44 44 26 38 47 55 55 61 53 48 39 51 47 40 38 38 49 39
Sold Change (annual) (21%) (4%) (30%) 8% (5%) 17% 10% 2% (6%) (33%) (24%) (22%) (2%) 4% 2% 0% (11%) (38%) 13% 7% (9%) 46% 0% 4% (29%)
$248
$265 $273
-
10
20
30
40
50
60
70
$-
$50
$100
$150
$200
$250
$300
Ho
me
s So
ld
Me
dia
n P
rice
(T
ho
usa
nd
s)
FernleyMedian Price & Homes Sold

The Greater Reno-Tahoe Real Estate Report
© 2006-2019, CalNeva Realty www.CalNevaRealty.com - 800-305-3015 Page 26 of 29
A M J J A S O N D J-19 F M A M J J A S O N D J-20 F M A
Median Price (Thousands) $248 $255 $253 $253 $253 $243 $259 $262 $259 $259 $271 $260 $265 $275 $266 $265 $265 $268 $263 $274 $275 $275 $275 $278 $273
Price Change (annual) 14% 13% 7% 10% 7% 9% 8% 6% 13% 8% 12% 7% 7% 8% 5% 5% 5% 11% 2% 5% 6% 6% 2% 7% 3%
MSI 1.5 1.6 1.9 1.9 2.2 2.1 2.4 2.3 2.0 2.1 2.4 1.8 1.6 1.8 2.1 2.2 2.5 2.7 2.7 2.4 2.1 2.0 1.9 1.8 1.9
MSI Change (annual) 6% 51% 8% 10% 9% 8% 19% 14% 30% 11% 6% 5% (5%) (21%) (4%) 17%
$248
$265 $273
-
1.0
2.0
3.0
4.0
5.0
6.0
7.0
8.0
9.0
10.0
$-
$50
$100
$150
$200
$250
$300
Mo
nth
s Su
pp
ly o
f In
ven
tory
(M
SI)
Me
dia
n P
rice
(T
ho
usa
nd
s)
FernleyMedian Price & Months Supply of Inventory (MSI)
> 6 Months = Buyer's Market
4 - 6 Months = Neutral Market
< 4 Months = Seller's Market

The Greater Reno-Tahoe Real Estate Report
© 2006-2019, CalNeva Realty www.CalNevaRealty.com - 800-305-3015 Page 27 of 29
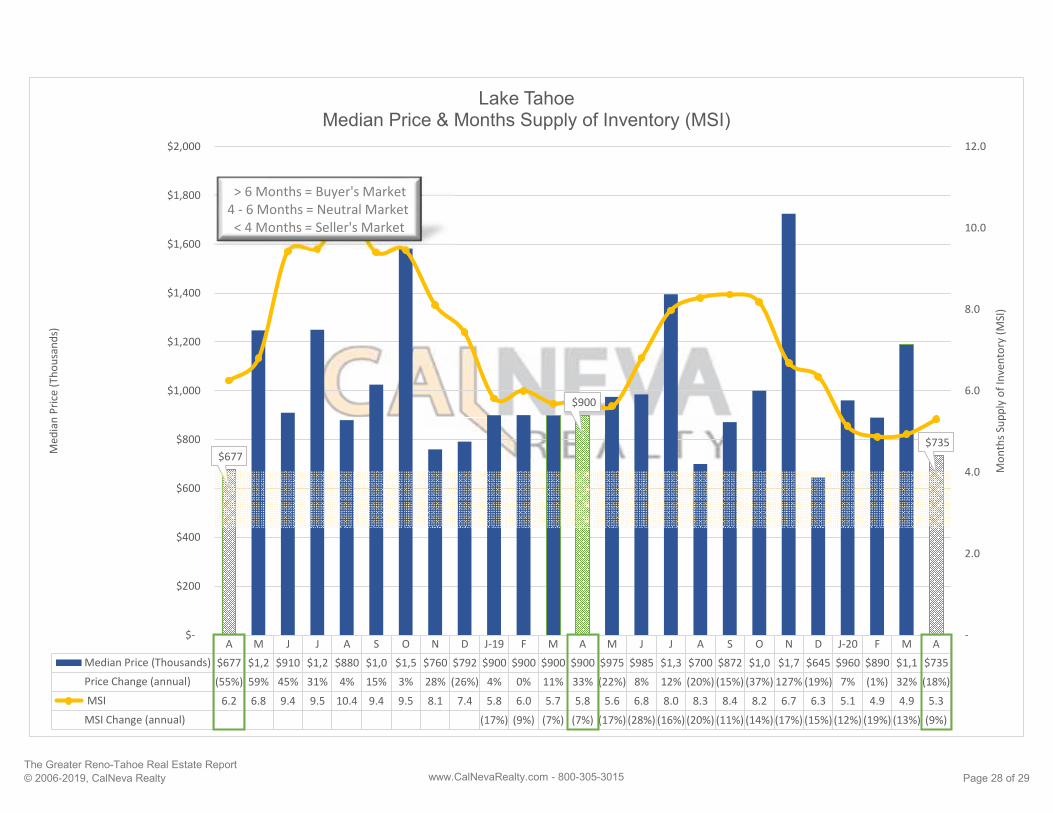
A M J J A S O N D J-19 F M A M J J A S O N D J-20 F M A
Median Price (Thousands) $677 $1,2 $910 $1,2 $880 $1,0 $1,5 $760 $792 $900 $900 $900 $900 $975 $985 $1,3 $700 $872 $1,0 $1,7 $645 $960 $890 $1,1 $735
Price Change (annual) (55%) 59% 45% 31% 4% 15% 3% 28% (26%) 4% 0% 11% 33% (22%) 8% 12% (20%) (15%) (37%) 127% (19%) 7% (1%) 32% (18%)
Homes Sold 6 8 12 7 12 13 10 11 12 12 13 8 8 9 10 11 15 16 15 9 12 7 9 8 7
Sold Change (annual) (14%) 14% 33% (42%) 9% (13%) 25% 10% 140% (14%) 63% (47%) 33% 13% (17%) 57% 25% 23% 50% (18%) 0% (42%) (31%) 0% (13%)
$677
$900
$735
-
2
4
6
8
10
12
14
16
18
$-
$200
$400
$600
$800
$1,000
$1,200
$1,400
$1,600
$1,800
$2,000
Ho
me
s So
ld
Me
dia
n P
rice
(T
ho
usa
nd
s)
Lake TahoeMedian Price & Homes Sold
The Greater Reno-Tahoe Real Estate Report
© 2006-2019, CalNeva Realty www.CalNevaRealty.com - 800-305-3015 Page 28 of 29
A M J J A S O N D J-19 F M A M J J A S O N D J-20 F M A
Median Price (Thousands) $677 $1,2 $910 $1,2 $880 $1,0 $1,5 $760 $792 $900 $900 $900 $900 $975 $985 $1,3 $700 $872 $1,0 $1,7 $645 $960 $890 $1,1 $735
Price Change (annual) (55%) 59% 45% 31% 4% 15% 3% 28% (26%) 4% 0% 11% 33% (22%) 8% 12% (20%) (15%) (37%) 127% (19%) 7% (1%) 32% (18%)
MSI 6.2 6.8 9.4 9.5 10.4 9.4 9.5 8.1 7.4 5.8 6.0 5.7 5.8 5.6 6.8 8.0 8.3 8.4 8.2 6.7 6.3 5.1 4.9 4.9 5.3
MSI Change (annual) (17%) (9%) (7%) (7%) (17%) (28%) (16%) (20%) (11%) (14%) (17%) (15%) (12%) (19%) (13%) (9%)
$677
$900
$735
-
2.0
4.0
6.0
8.0
10.0
12.0
$-
$200
$400
$600
$800
$1,000
$1,200
$1,400
$1,600
$1,800
$2,000
Mo
nth
s Su
pp
ly o
f In
ven
tory
(M
SI)
Me
dia
n P
rice
(T
ho
usa
nd
s)
Lake TahoeMedian Price & Months Supply of Inventory (MSI)
> 6 Months = Buyer's Market
4 - 6 Months = Neutral Market
< 4 Months = Seller's Market

Term Definition
Home A Home in this report is defined as a single family residential property that is "stick built" constructed.
Condominiums, townhomes, multi-family properties, manufactured homes, and vacant land are not included in the
definition of a "Home" in this report.
Median Price The SOLD price of the Home in the middle of all Homes sold during that month.
For example, if Homes in a given month sold for $330,000, $333,000, $342,000, $355,000, $670,000, the median
Home price is $342,000. Since housing data has extreme values, the median is a better representation of the
general level of the housing market than the average (which would be $406,000 in this example - the sum of all
values divided by 5). Prices are displayed in "thousand dollars": 500 = 500,000; 1,235 = 1,235,000 and rounded to
the nearest thousand dollars for display purposes.
% change in Median Home sale price compared to the same month in the prior year.
Home Inventory Effective January, 2018, Number of Homes listed for sale EXCLUDING pending homes (homes under contract).
Pre January, 2018, this metric includies homes that are currently in escrow (all pending categories).
Inventory Change % change in the Home Inventory compared to the same month in the prior year.
Homes Sold The number of Homes that closed escrow during the specified calendar month.
Homes Sold Change % change in the Homes Sold compared to the same month in the prior year.
Months Inventory
Definition The number of months to fully deplete the current Home Inventory based on the rate of Homes Sold per month on
average over the prior 12 months. This is calculated by dividing the current month's Home Inventory by the
average of the Total Homes Sold in the prior 12 months. (Home Inventory) / [ (Total Homes Sold in prior 12
months) * 12 ]. By averaging the Homes sold per month over the last year, seasonal cycles are factored and
provide a more accurate view of this measurement.
Information Source The data supporting the charts in this report is obtained from the Northern Nevada Regional Multiple Listing
Service (NNRMLS). This data is deemed reliable but not guaranteed.
Lake Tahoe - All Lake Tahoe (NV) (MLS area 650) - Does Not Include Incline Village, NV
Reno - All Reno (MLS area 101)
Sparks - All Sparks (MLS area 108)
Carson City - All Carson City (MLS area 200)
Carson Valley - Gardnerville/Minden/Genoa/Topaz (MLS area 300)
Dayton - Dayton (MLS area 420)
Fernley - All Fernley (MLS area 450)
Scope/Source of Data The data used in this report is based on information from the Northern Nevada Regional Multiple Listing Service®
(NNRMLS) for the time period identified on this report. This data will not include homes sold outside
of the NNRMLS such as For Sale By Owner homes and new homes from builders that were not listed in NNRMLS.
Data Sources & Definitions
The Greater Reno-Tahoe Real Estate Report
© 2006-2019, CalNeva Realty www.CalNevaRealty.com - 800-305-3015. Page 29 of 29


