The Great Impact of Geotechnical Features on System ...
22
The Great Impact of Geotechnical Features on System Performance Scott A. Anderson, Ph.D., P.E. FHWA Resource Center Geotechnical Engineering Technical Services Team Manager
Transcript of The Great Impact of Geotechnical Features on System ...

The Great Impact of Geotechnical Features on
System Performance
Scott A. Anderson, Ph.D., P.E. FHWA Resource Center
Geotechnical Engineering Technical Services Team Manager

Thesis
• Corridors are the primary assets of a transportation agency. A transportation system will have multiple corridors.
• Geotechnical features such as embankments, slopes and retaining walls have a large influence on the performance of corridors.
• Performance (corridor or system) is the attribute agencies will be measuring and managing – and care most about.
2
What is a corridor?
•
3

Corridors in Wyoming
4
URS, WYDOT, 2010

What is a geotechnical feature?
• A geotechnical asset: slopes, walls, and embankments are examples Performance is largely attributed to soil or rock performance Does not include pits or quarries, or knowledge, such as a
subsurface information database • These are assets that are not part of corridors
– “Geotechnical Assets”
5
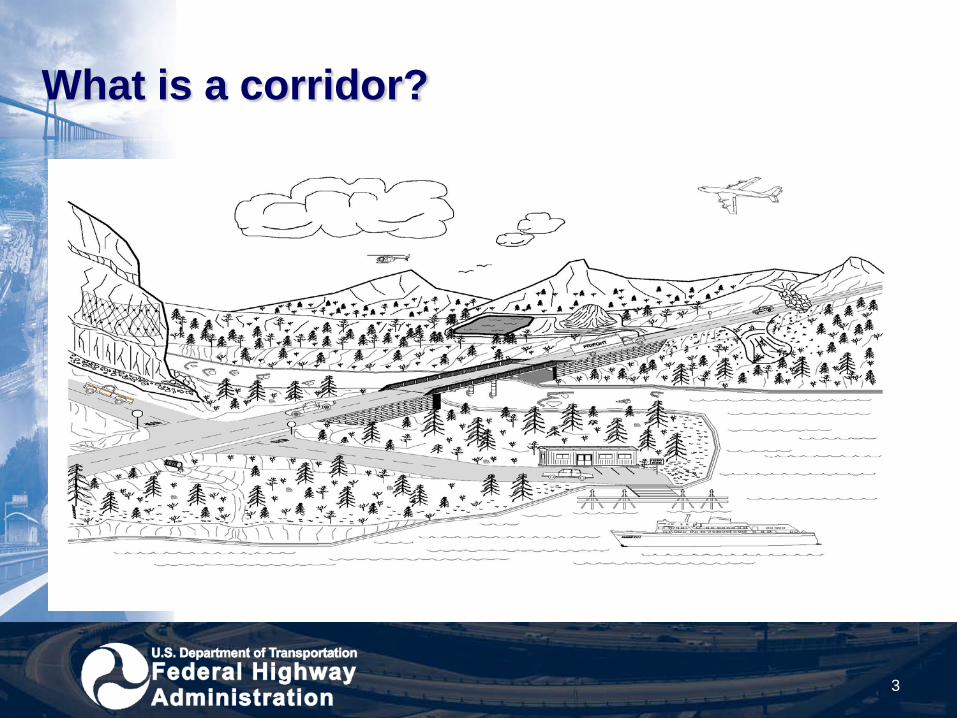
What is “performance”?
• Many definitions concurrently • Our ultimate objective(s) • Something that can be measured • Something that can be managed
6

USDOT Performance Report

Condition Reporting
Report to Congress • System Conditions • Operational Performance • Safety • Revenue and Expenditures • Investment Analysis
Difficult to associate performance with federal investments

What is “system performance”?
FHWA’s System Performance Goal: The Nation’s highway system provides safe,
reliable, effective and sustainable mobility for all users.
9
FHWA is now going farther…

Performance Management in the Future
10
Performance Management of the Federal Highway Program is a systematic approach to making investment and strategic decisions using information about the condition and performance of the system and developing an approach to achieve a desired set of national goals
Performance Management Success Utah Example
• Strategic Direction identifies ‘final four’ of goals that guide performance management and planning Take Care of What We Have Make the System Work Better Improve Safety Increase Capacity
11

Performance Based Planning at Mn/DOT
• Policy Plan Vision: A Safe, Efficient and Sustainable Transportation
System Emerged from discussions with stakeholders Identified challenges and opportunities Defined policies to guide decisions
12
Safety Twin Cities Mobility Infrastructure Preservation
Greater Minnesota Metropolitan and Regional Mobility
Maintenance & Security
Community Development and Transportation
National and Global Connections
Energy and the Environment
Statewide Connections
Accountability and Transparency

Performance Management Elements Reporting Examples
13
2007 Annual Attainment Report Maryland DOT
State of the System 2005 Bay Area Transportation
Good to Great Strategic Plan and Annual Report New Mexico DOT
Business Plan 2004 & 2005 Ohio Department of Transportation
Measures, Markers and Mileposts Washington State Department of Transportation
Dashboard Virginia Department of Transportation
Tracker Missouri Department of Transportation
Performance Management in the Future
14
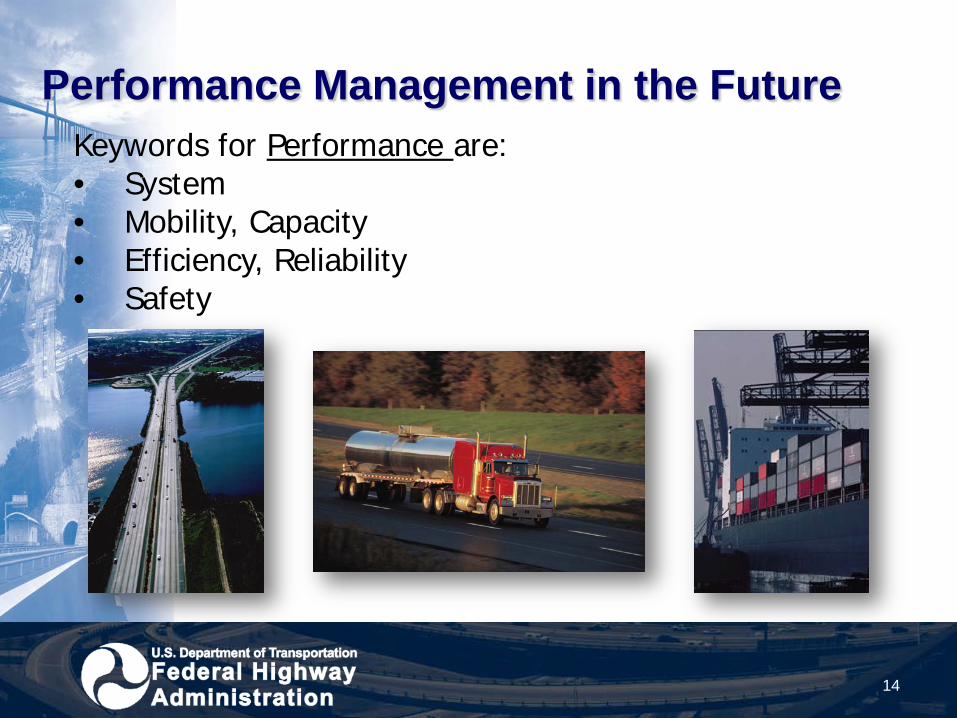
Keywords for Performance are: • System • Mobility, Capacity • Efficiency, Reliability • Safety

For a system to perform well, its corridors must perform well and deliver mobility, capacity, efficiency, reliability and safety
•
15
One broken link can change all of that

Geotechnical Message
• Consider 200 slopes, 10 walls and 50 embankment culverts identified as ‘in need’ by separate inventory and assessment methods Measure: reduce number Target: 10% reduction
• Consider 10 corridors of primary significance Measure: safety, efficiency, mobility Target 10% improvement
16
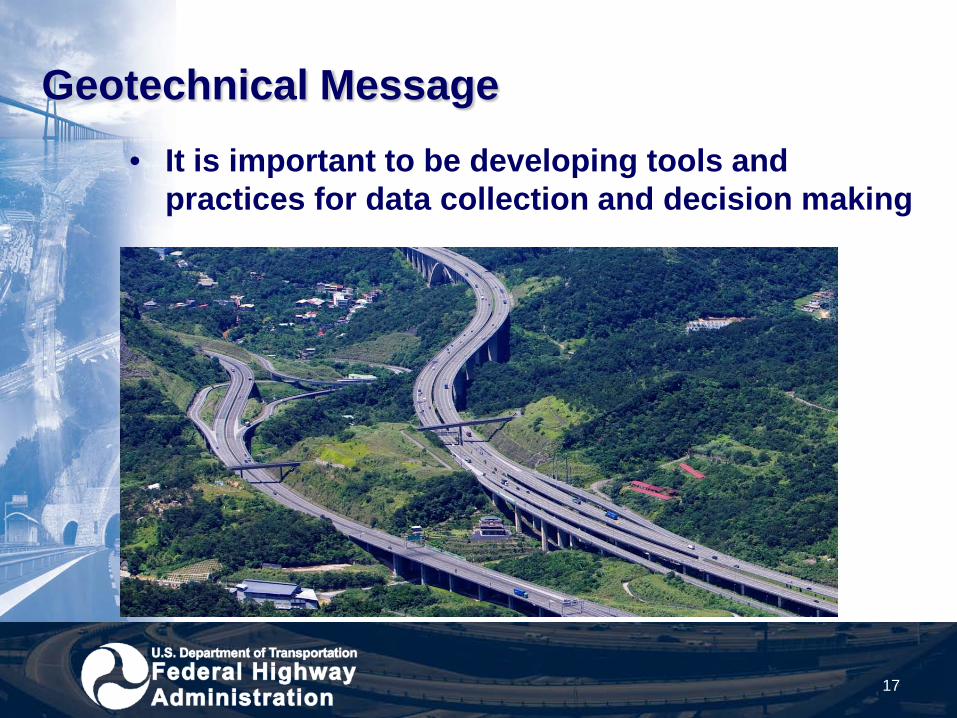
Geotechnical Message • It is important to be developing tools and
practices for data collection and decision making
17

Geotechnical Message • It is also important to be looking beyond – to how
that contributes to improved performance of a system through performance of a corridor Bridges Pavement Walls Signs Slopes Embankments Tunnels Etc.
18

Recent U.S. examples • Embankment on I-75 in
TN March 8, 2011 Both SB lanes still closed Built in 1970s 150 ft high embankment CMP culvert
• Deterioration • Separation • Saturation • Weakening • Failure
19

Recent U.S. examples • Rockslide on I-40 in NC
October 2009 6 month closure 25,000 ADT $10 m repair* $ 65 m travel time costs* $57 m operating costs* $44 m congestion costs* $10 m other costs*
*HDR, 2010
20
US-64 in TN, November 2009, $22 m

Recent U.S. examples • Rockfall on I-70 in CO
March 2010 Repeat from Nov. 2004 4 days full closure 200 mile detour 2 months partial closure $1.6 m repair
21
Culvert failure on same corridor • June 2003 • Similar closures • $4.2 m repair

Final Thoughts
22
• Focus on features can lead to stovepipes
• Focus on corridors requires integration
• Geotechnical features are not ‘solid as rock’ – there are ownership responsibilities
• System performance is limited by the weakest link, which may be geotechnical