
The Great Bull Markets 1924-29 and 1982-87: …...FEDEMAL RESflVE BANK OF St LOUIS NOVEMBEM 1987 The...
15
FEDEMAL RESflVE BANK OF St LOUIS NOVEMBEM 1987 The Great Bull Markets 1924—29 and 1982—87: Speculative Bubbles or Economic Fundamentals? G. J. Santoni Every so often, it seems, humankind almost en masse has a compulsion to speculate, and it yields to that compulsion with abandon, — Robert T. I’atterson, The Great Boom and Panic, p xiii. Il%~IIANY people attribute the bull man-ket of 1924— 29 and the subsequent collapse in stock prices to a speculative bubble.’’’ According to this view, the m:rash was inevitable because it was only a matter of time until the bubble burst Isee shaded insert on opposite page). The same theory of stock price formation is used to descn-ibe the bull market of l982—87. Recent discus- sions have characterized tills bull market as the prod- uct of ‘unexpected insanity,’’ subject to ‘‘trading fads and frenzies rather than economic h.nndamnentals’’ and ‘out of control .‘‘~ Comparisons between thie 1920s and 1980s like the one summarized in chart I have ap- peared recently in the press.’ Chart 1, which plots quarterly data on the levels of the Dow Jones lndus- G. J. Santoni is a senior economist at the Federal Reserve Bank of St. Louis. Thomas A. Pci/mann provided research assistance. ‘Seethe shaded insert on page and Kindleberger (1978), p.17. 7 ”Abreast of the Market” (1987) and Jonas and Farrell (1986). 3 See, for example, Koepp (1957), Powell (1987), Schwartz and Tsiantar (1987) and Wall Street Journal (1987). trial Index over the two periods, shows that the behav- ior’ of stock prices in both periods is sitiiilam.’ Both bull tnarkets began mi the second quarter’ of the year-; each lasted 21 quarter’s; each hit its peak in the third quarter with the timing of the peaks separated by only a few days (September 3, 1929, and August 25, 1987); in each case, 54 days elapsed between the peak and the crash; arId each crasli str-ipped slightly mor’e than 20 percent fioni the stock market averages. ‘l’he belief that speculative bubbles might cause a persistent deviation in stock pm-ices fr-onn the pm-ice consistent with tile fundamentals is impom-tant. At the timile of the 1929 crash, it spawned legislative proposals that would cut-b credit for’ speculation, amend the National Banking and Federal Resetx’e acts, impose an excise tax on stock sales and n-egulate the activities of stock exchanges and investment trusts.’ Furthermore, ‘Scale (1982—87) = S x scale (1924—29). 5 New York Times (October 25, 1929). 16
Transcript of The Great Bull Markets 1924-29 and 1982-87: …...FEDEMAL RESflVE BANK OF St LOUIS NOVEMBEM 1987 The...
FEDEMAL RESflVE BANK OF St LOUIS NOVEMBEM 1987
The Great Bull Markets 1924—29and 1982—87: Speculative Bubblesor Economic Fundamentals?G. J. Santoni
Every so often, it seems, humankind almost en masse has a compulsion tospeculate, and it yields to that compulsion with abandon,
— Robert T. I’atterson, The Great Boom and Panic, p xiii.
Il%~IIANYpeople attribute the bull man-ket of 1924—
29 and the subsequent collapse in stock prices to a
speculative bubble.’’’ According to this view, them:rash was inevitable because it was only a matter oftime until the bubble burst Isee shaded insert onopposite page).
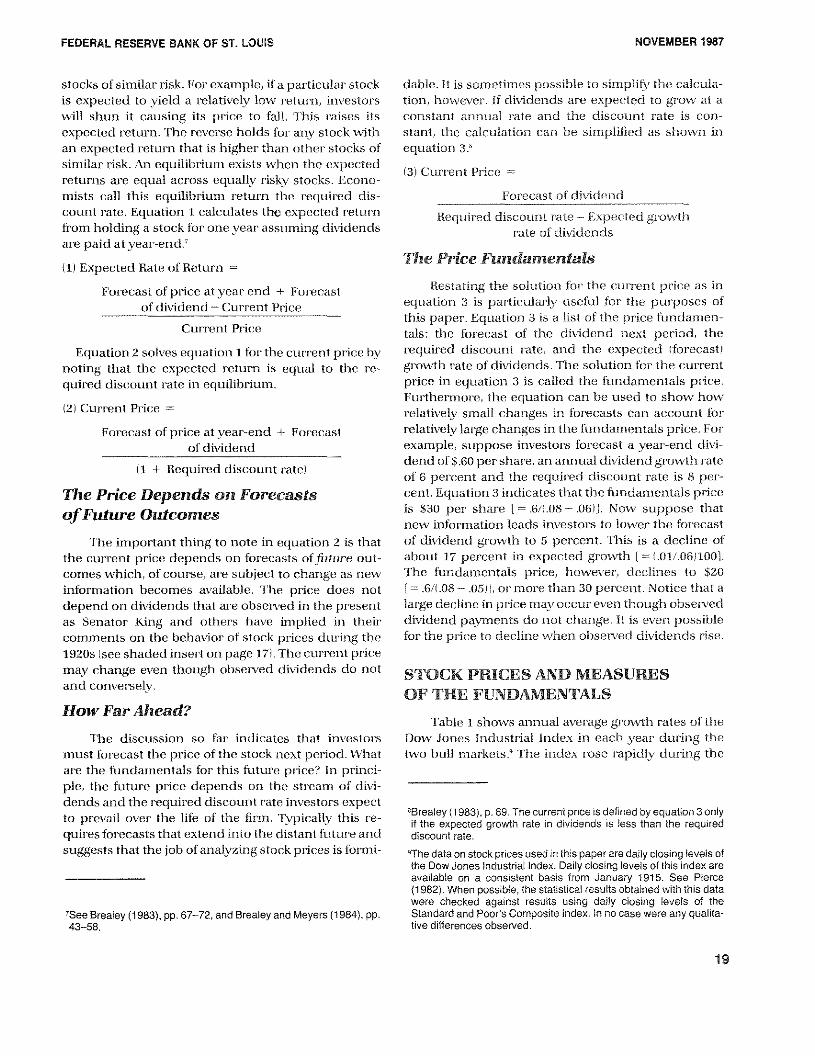
The same theory of stock price formation is used todescn-ibe the bull market of l982—87. Recent discus-sions have characterized tills bull market as the prod-uct of ‘unexpected insanity,’’ subject to ‘‘trading fadsand frenzies rather than economic h.nndamnentals’’ and‘out of control .‘‘~ Comparisons between thie 1920s and1980s like the one summarized in chart I have ap-peared recently in the press.’ Chart 1, which plots
quarterly data on the levels of the Dow Jones lndus-
G. J. Santoni is a senior economist at the Federal Reserve Bank of St.Louis. Thomas A. Pci/mann provided research assistance.
‘Seethe shaded insert on page and Kindleberger (1978), p.17.7”Abreast of the Market” (1987) and Jonas and Farrell (1986).3See, for example, Koepp (1957), Powell (1987), Schwartz andTsiantar (1987) and Wall Street Journal (1987).
trial Index over the two periods, shows that the behav-ior’ of stock prices in both periods is sitiiilam.’ Both bulltnarkets began mi the second quarter’ of the year-; eachlasted 21 quarter’s; each hit its peak in the third quarterwith the timing of the peaks separated by only a fewdays (September 3, 1929, and August 25, 1987); in eachcase, 54 days elapsed between the peak and the crash;arId each crasli str-ipped slightly mor’e than 20 percentfioni the stock market averages.
‘l’he belief that speculative bubbles might cause a
persistent deviation in stock pm-ices fr-onn the pm-iceconsistent with tile fundamentals is impom-tant. At thetimile of the 1929 crash, it spawned legislative proposalsthat would cut-b credit for’ speculation, amend theNational Banking and Federal Resetx’e acts, impose anexcise tax on stock sales and n-egulate the activities ofstock exchanges and investment trusts.’ Furthermore,
‘Scale (1982—87) = S x scale (1924—29).5New York Times (October 25, 1929).
16
FEDERAL RESERVE BANK OF ST. LOUIS NOVEMBER 1987
‘,7K<4<4,<.4’~//’~<./. ~S~’/4~”.,’/’.4~ ‘K
4j4’
4 4’” 7,4’ ~‘t 4’;~ 4, ‘.4’ /44//K’ / “ ‘4” 4
K’ K4.
// ,<~< /7” 4” 4’ “7 /K’ .4,7 / /4 <44” /.4. 4’ .‘ <4 —‘ < ‘K/,. “2< ‘“7 <4”
‘. K,’,. $ ,$,4/< / /4< ‘K
“~ ‘/‘ ~“ 7.4< ‘<4 ,.<K.77///z.4_4’ 4’ .4 ‘4<44 4” <.4< <4 2’‘4 ‘, < ‘ ,K4. -
K < <<4 ‘zK’4<4<~<4’.;4.4~4KK/./~,*../,4..4’.4K.44’~.4<
Kj$<<<4
-4’ . / K “‘ , ‘4 K ~$“ ‘ ,~ .4’ 4<‘1’ ‘ “,,/‘,/4< ,K$ -, <4, K, , 2”
‘K’ ‘,“, “‘K” ,‘,7’7 ,,<K/K.,,,,, ,,/ ‘ . ‘‘-‘4 /4
‘<4 4., /4 4 “<K ~‘ ~c ~ ‘4<4<~*f’<4’ K ‘K K’ 4.4 .4”,< , K,,.4,K~7’, K /747”’
4< 4< <4’ 4< ‘K 4’ K “’<~4’<4K~’4K/4K,~44’ ~4’; ‘~ /.41z
7.4.4K ~ 4’-4~’ <.4 4K/4~4< 4’ K
/ </4
K <.“ K / / /
4< 4/’’~ ‘K, /4’
,K/’~ /
$ / ,. ~ ~
K K’.< ‘4 ,:~ ;L:~~.‘~ ~
K’ <4 ,,“‘ ‘.4’>’ .‘“. .. . K’
4” / ‘~<<<e~~ / ‘ $ <<4KK,K’< K / ‘4<
</47’ K ‘‘ K’’ 4., “ .4/4/’”
.4K” K%4K” ~ ,KK.4” K / ““.7/4‘K ‘-4 4’ /4 .4 ‘K”4<4 K
K ‘ <<m<, ~ ,,“K~’KK7’K’K/” ‘‘/4’ ,/,,, , k’.,, , K < < ‘2
4<47 K ‘‘~ ‘4” ‘/ ‘7<, ‘‘ ,,KK’.4 44’.
<4< ,,7K~’ ~>‘<:~ ~, 7/’’/4’~4’7<4 ,<4<KK-4K,
</4<’ 7.44’ &t4
>’’K<4 /44 ‘~7 ;/ ~ 4<~4
cK>c4~
’~, //4~4’ 4’ 4’>’
/4 ~‘.“‘.< 4’ .4 ‘4/ ‘K, ‘K
if stock pm’ice bubbles exist, economic policvmaker’s
face a difficult pr-oblem because bubbles suggest thatplans to save and invest may be based on irrational
criteria arid subject to em-r-atic change.”
‘h’he purpose of this paper is to compare tile inrnpli—cations of a theory of stock prices based on fundarneni—tals to one that allows for’ bubbles, then to examine
~Keynes(1935), p. 159. Keynes discussed erratic shifts in the invest-ment schedule caused by changes in the “state of confidence” (pp.153—55) and “speculation” (p. 161). He argues that a
boom which is destined to end in a slump is caused,therefore, by the combination of a rate of interest, which in acorrectstate of expectation would be moo high for full employment,with a misguided stare of expectation which, so long as it lasts,prevents this rate on interest from being in tact deterrent A boomis a situation in which over-optimism tr,umphs over a rate ofinterest which, in a cooler tight, would be seen to be excessive”(p. 322).
See, as well, Gordon (1952), p,378 and Varian (1979).
e~idence from the 1920s and the 1980s to determinewhich set of implications is suppom’ted by the data.The behavtor of stock prices during these two pen’iodsis patticu-lam’ useful in testing asset prices Din’ the
presence of speculative bubbles. The 1 924—29 experi-ence is one of the most significant bull markets in U.S.history in both its dun-anon and nate of advance.Thoughi riot quite as rir-aniatic. the behavior of stock
~ in the 1980s has tieeti similar~. If stock pricebubbles exist, these are likely places to look for’ them
THE FUNDAMENTALSOF STOCK PRICES
People value common stocks for their expectedn’ef ut-n. Since irives tot’s mu a choose among Iiroarl cate-gories ol’stock, the expected r’ettrm-n on an~’particularstock must be equal to the expected return on other’
17

FEDERAL RESERVE BANK OF ST. LOUIS NOVEMBER 1987
Chart 1
The BuD Marketsof the 1920s and 198OsL~iDow Jones Industrial Index (Nominal Va’ues)
1982 1983 1984 1985 1986 1987
123412341234123412341234I! I I I I I I I I I I I I I II
Dow k~dustri&s Dow h~dfltri&s1924~29sc~Ie
360
320
280
240
200
160
120
80
198247 sc&e L~
2880
2560
2240
1920
1600
1280
960
640
40
1924 1925 1926 1927jj, Sources: Moore (1961), pp. 109 ,145 and Economic Report of the President.
Various years.
I~Scale 1982-87 = 8x Sc&e 1924-29,
4SCAL ES -~
1980s BuD Market
BuD Market
1234123412341234123412341928 1929
320
18
FEDERAL RESERVE BANK OF ST. LOUIS NOVEMBER 1987
stocks of similar risk- For example, if a particular’ stockis expected to yield a relatively low return, inyestotswill shun it causing its price to fall, This raises itsexpected retun’n, ‘the reverse holds for any stock withan expected return that is higher than other stocks ofsimilar risk, An equilibrium exists when the expectedm’eturns are equal actoss equally risky stocks- Econo-mists call this equilibrium retur’n the t-equired dis-count rate, Equation t calculates the expected retur’nfrom holding a stock for’ one year- assuming dividendsare paid at year-end,’
(1) Expected Rate of Return =
Forecast of pr’ice at year end ±Forecast
of dividend — Current Price
Current Price
Equation 2 solves equation 1 for the current price bynoting that the expected retun’n is equal to the re-quired discount rate in equilibrium.
(2) Current Pt-ice =
Forecast of price at year-end + For-ecastof dividend
(1 + Required discount tate)
The Price Depends on ForecastsofFuture Outcomes
The impor’tant thing to note in equation 2 is thatthe current price depends on forecasts offuture out-comes which, of course, are subject to change as newinformation becomes available. ‘the price does not
depend on dividends that at-c observed in the presentas Senator King and others have implied in theircomments on the hehavion’ of stock pt-ices during the
1920s (see shaded insert on page 171. The current pricemay change even though observed dividends do notand conversely.
How Far Ahead?
The discussion so far indicates that investorsmust forecast the price of the stock next period. Whatare the fi,tndarnentals for this future pm-ice? In princi-ple, the future pt’ice depends on the stn-ean of divi-dends and the required discount rate investors expectto prevail over- the life of the firm, Typically this n-c-quin’es forecasts that extend into the distant future andsuggests that the job of analyzing stock prices is formi-
‘See Brealey (1983), pp. 67—72, and Brealey and Meyers (1984), pp.43—58,
dahle. It is sometimes possible to simplify the calcula-tion, however. If dividends are expected to grow at aconstant annual rate and the discount rate is con-stant, the calculation can lie simplified as shown inequation 3.’
(3) Cut-cent Price =
Fot-ecast of dividend
Required discount rate — Expected growthrate of dividends
The Price Fundamentals
Restating the solution for the current price as inequation 3 is particularly useful for the purposes ofthis paper. Equation 3 is a list of the pt-ice fundanien-tals: the forecast of the dividend next period, therequired discount rate, and the expected forecast)growth t-ate of dividends. The solution for the currentprice in equation 3 is called the fundamentals price.Furthermore, the equation can he used to show howrelatively small changes in forecasts can account forrelatively lam-ge changes in the fundamentals pt-ice. Forexample, suppose investors forecast a year-end clivi-dend of 5.60 per’ shame, an annual dividend growth tateof 6 pet-cent arid the r’equir’ed chscount mate is 8 pet-
cent. Equation 3 indicates that the fundamentals priceis $30 per share [=.6/),08—.06)], Now suppose thatnew information leads investors to lower the f’ot-ecastof dividend growth to 5 percent. This is a decline ofabout 17 percent in expected gm-owth 1= l,01/,0611001.The fundamentals pt-ice, however, declines to $20
.6/LOS — .05)1, or more than 30 percent. Notice that alatge decline in price may occur even though observeddividend payments do riot change. It is even possiblefor the pt-ice to decline when observed dividends rise.
STOCK PRICES AND MEASURESOF THE FUNDAMENTALS
Table 1 shows annual average growth rates of theDow Jones Industrial Index in each year during thetwo hull mar’kets.” The index rose tapidl~during the
‘Brealey (1983), p. 69. The current price is defined by equation 3 onlyif the expected growth rate in dividends is less than the requireddiscount rate.
‘The data on stock prices used in this paper are daily closing levels ofthe Dow Jones Industrial Index. Daily closing levels of this index areavailable on a consistent basis from January 1915. See Pierce(1962). When possible, the statistical results obtainedwith this datawere checked against results using daily closing levels of theStandard and Poor’s Composite Index, In no case were any qualita-tive differences observed.
19
FEDERAL RESERVE BANK OF St LOUIS NOVEMBER 1987
‘/2/~ /~,, /‘ ,,, / / 4/4’; ~‘; “,,,, / ‘~2’i~“ ‘r,
4 /“‘8/’’ t~”,r’’ ‘~////2/ ~ a /
“ ,/4/’/’,2 ///,, // /\,/ ‘2///4//,,///// “/7
~ :~
/
~ ~ ,_
\24’.4~,‘i8/ ~
‘4k~Z”~~’494~ “K 44 ‘4 /
4444////747794ç4, /
td1~ti11I*htUitIAVS,,K’ 4 ~t”Y”S ~“fl~flW+ff~iFfl~’ \“ ~‘, 4-,2” /
~ ,‘y ,,‘,~
‘,~ ,,/( / K’,~, K /4 4 /
/ 274, ‘K a,
‘2/ / //
1~//,,’2, 772
/ “8~ ,74 ‘2//“’22/ 4/ 74, c,,,/\c’2\,,/~/4 \ - /
4/474
K “’“28,’
,744“‘/4 4 2w
4/4, / ‘4 ,,74 4’//4/72 2/ /
/2/ ‘, / ‘ “///4 /7”,,/ ‘/‘~~/‘~‘/~‘//‘ —2 K/,~’’ /4 4/
initial phases of ii ‘ li nil mu t ket , show d Ow i ( on—
sidet ably ‘n 1926 and 98—I, thcn t’rise I’ pid k~ti ro ugh
the lint d qtrartet-s of 1929 arid! 1987.
A r~pid -tdv, t e in stick pr it s rio s ~ I i’ sir g if itresul s fm (1 u uang s ‘mu tlu ‘ In t d am utals. I ie inv i—gatot’, hr i i~n-, seldom i- s tli In xttrv of dir oliscr—vation of Ii I md at i u tls istuad , orl ‘ ‘ i it i thl s
it i~~dSI h art fir i v I to I t’ovtde ‘nfl r I iati( It
al o mt it 1 i ni t- of the u (iii’, lie I fund am u ‘nit tl sn st hr is dl ‘0’ e ,r pI , ( r”di ii -uket hut testmaRs it jar I livid ‘n I p-tym i s tnt 1 r Ut r “d to
pr’ivt r ‘ u’~’ ndisr’ urt ‘aid u’e,1crr’lst-e,ri olh t tie I vi ~eu , I ‘s ‘Ii ) )rtllu tor gmuzr
tihit, cit 1 est, t bt di -or o Ii SC Ior’ itherl ii’ ixr~tt git r Iv’tr tug i ii ir-oxiru tI u 0 Ii’ 1 e tat or
ol th’ lid an en tls n I, itt ict a nil, tIm i nuv In(vliil”~’digi( ~,1sr iyhc,me’tuileo
tli - t r(,S(
Long-ter-mn rates were roughly constant I’m-om 1924—29.”’ Data on actual per share dividends are verysketchy for this period. One estimate, however, indi-cates that actual dlividends itiereasedi at an annual n’ateof about 8.8 percent from 1924—29.” While this is afairly rapid rate of mid-ease, it is far less than thegrowth observed in stockvalues. (See shadled inset-t onopposite page fot’ a rnor’e precise estinnate of the rela-tionship between stock prices and these pt-ox~van—ahles.I When the market ci-ashed, people like SenatorKing pointed to these proxy variables atid claimed thatstock pt’ices liefrire October- 1929 contained ‘waterand hot air.’’ Art alternative explanation is that the
pi-oxies give a misleading impression of the behavior of
the fundamentals.
FUNDAMENTALS, FOOLS ANDBUBBLES
In rirder to evaluate the notion that stock prices inthe 192Os arid! l9SOs were driven by psychologicalfactors extraneous to the fundamentals, it is necessaryto be cleam’er’ aliout the implications the alter’nativeh~potlieseshave for var’iables that can he observed bythe investigator. This paper considers three differenttheories that potentially explain stock prices: the ef-ficient market hypothesis, the greater fool theory andthe theory of rational buhibles.
Efficient ilIarkets and Fundamentals
A long—standing pr’oPosition in both economics
am! finance is that stock pnces are formed in efficientmar-kets.’” This means that all of the relevant infom-ma—lion currently known about ititemest rates, dividendsand the futum-e prospects for firnis is contained in
current stock prices. Stock pr-ices change only whentiew infot-niation m-egarding the humidarnentals is ob-tained by someone. New information, by dlefinition,cannot lie predicted aheadi rif its arrival; because thenews is just as likely to he goodi as it is to lie bad, jumpsin stock pr-ices cannot be pr’edicted in advance.
Many present—day stock niar’ket analysts arc skepti-cal of the efficient markets hypothesis.” Similarly,
“See Friedman and Schwartz (1982), table 4.8, and Homer (1977), p.
352.
“See Cowles (1938), p.389.
“See Brealey and Meyers (1984), pp. 266—81; Malkiel (1981), PP.171—79; Brealey (1983), pp. 15—18; Leroy (1982) and Fama (1970).
“See Malkiel (1981), Pp. 126—79.
20
FEDERAL RESERVE BANK OF ST. LOUIS NOVEMBER 1987
traders in time I920s germerally did mmot subscribe to it(see slmaded insent (in followimmg page). But that is riotimportant. If the behavior’ of stock pm-ices is commsistent
with time implications of time theory, the imypothesisimeips both to understammdl hmow stock nuam’kets wom’kand to evaluate the claim that time hull markets wem’e
products of price hufibies.
If the efficienut rnan-kets hypothesis is cor’rec.t, pastpr-ice changes contairu no useful information ahioutfuture pr-ice changes. With some added assumptions,this carm he tm-ammsiated into useful empim-ical pn’oposi—
tions. If tIme expected return to holdimmg stock is con—stanit ammd time volatility of stock prices does mmot cimangeduring time time pem’iod examined, time efficient markethypothesis implies that observed changes in stock
pm-ices should he unicorn-elated amid tiuat lir’ice cimammgesshouidl riot exhibit long sedluences of successivechanges that are gr-eatem- om- less than time mediancimammge for time sample.
‘time above propositions should hold everm if time levelof stock pm-ices appears to drift upward or dowmmwam-d.These propositions concern time n-ehationsimip betweenthe sequence of price cimarmges, not the average cimangeover’ some specific. period. Clearly, stock prices dm-iftedupward dluninmg hoth hull nmiar-kets; but that does notnecessar’ilv mean that price changes wem’e con-i-elatedor- that thmer’e were ionmg n-umms of positive changes thatexceeded time rmiediarm change for- these periods. Putdifferently, it tioes riot mmecessarily nuean that mmmarket
participants were ahile to pr’edic.t future changes in
stock prices by observing the past.
Greater Fools
Time nuotionl thmat self-feedimmg speculative tiutihihes,Ott occasion, can drive stock prices is knowmm as time‘gm-eater fool timeor-v.’’ Accordlirmg t ri tins thmeory, people
n-egan’d the fundamentals as irrelevantt. Rather’, t lucybuy stock on time belief that some t bigger?) fool will buy
21

FEDERAL RESERVE BANK OF ST. LOUIS NOVEMBER 1981
the shares from them at a higher- price in the future,People maintain this belief because they think “thatmarket values will rise — as they did yesterday or lastweek—and a profit can be made.”~Once the specula-tion begins, stock prices continue rising because peo-ple, seeing the rise in the pm-evious period, demandadditional shares in the belief that pr-ices will commtirmueto rise. This pushes prices still higher.
The greater fool theory is based on time presunmptionthat there are times when past movements in stockpt-ices matter. According to this theory, during the“fooling” periods, there should he positive cot-relationin the past sequence of pr-ice changes and long nuns ofpositive changes that exceed the median change forthe sample period.
‘4Galbraith (1955), p. 23. See, as well, Malkiel (1981), pp. 31—49.
Recently, some economists have discussed thepossibility that stock pr-ices mnay contain “rational”bubbles,” The theory of rational price bubbles is basedon the belief that some asset pm-ices (for example,stock, gold and foreign currency prices) ar-c too vari-able to be justified by vam’iation in the fundamentals,”(A nuore fornmal theory of pn’ice bubbles is sumnmarizedin the appendix to this papem’J Bn-iefly, the theory saysthat there may lie occasions when stock prices deviatefrom the pm-ice that is consistent with the fundamen-tals. The deviation is called a bubble.
“See Flood and Garber (1980 and 1982), Blanchard and Watson(1982). West (1986), Diba and Grossman (1985 and 1986) and theappendix to the paper.
“See, for example, Shiller (1981) and Mankiw, IRomer and Shapiro(1985).
Rational Bubbles
22

FEDERAL RESERVE BANK OF ST. LOUIS NOVEMBER 1987
Bubbles must possess certain characteristics if theyate to have economic significance:
Bubbles must be persistent so that a fom’ecast of stockprices based solely on the fundamentals is biased,This means that fom’ecast erm’ors (actual price minusforecast price) will tend to have the same sign and notaverage out, The persistence of one-sided er’rors isimportant because random variation in the data gen-erally will cause the actual price to differ front any
well-constructed forecast of the price even though abubble is not present. ti bubbles were only a nameused to describe m’andom variation in the data, theywould not be very interesting,
Bubbles must be ecplosive in the sense that theymust grow at a rate that compensates the stock pur-chaser fot- the additional amount invested in the stockdue to the bubble, ln addition, there may be a riskpremium to compensate stockholders for the addi-tional risk that the bubble may burst,” ‘f’his character-istic causes the price to deviate further and furtherfrom the fundamentals for as long as the bubble lasts,
Bubbles can not be negative. A negative bubblemeans that stock pr’ices are less than implied by thefundamentals, ‘t’he explosive characteristic of bubblesmeans that the prices implode with some chance thatstock prices will be negative at some futum’e date,”Negative stock prices, however, are impossible; theyare inconsistent with the liability rules associated withcommon stock which limit potential losses to theextent of the initial investment,
RATIONAL BUBBLES AND STOCKPRICE BEHAVIOR
The theory of rational Imubbles has implications
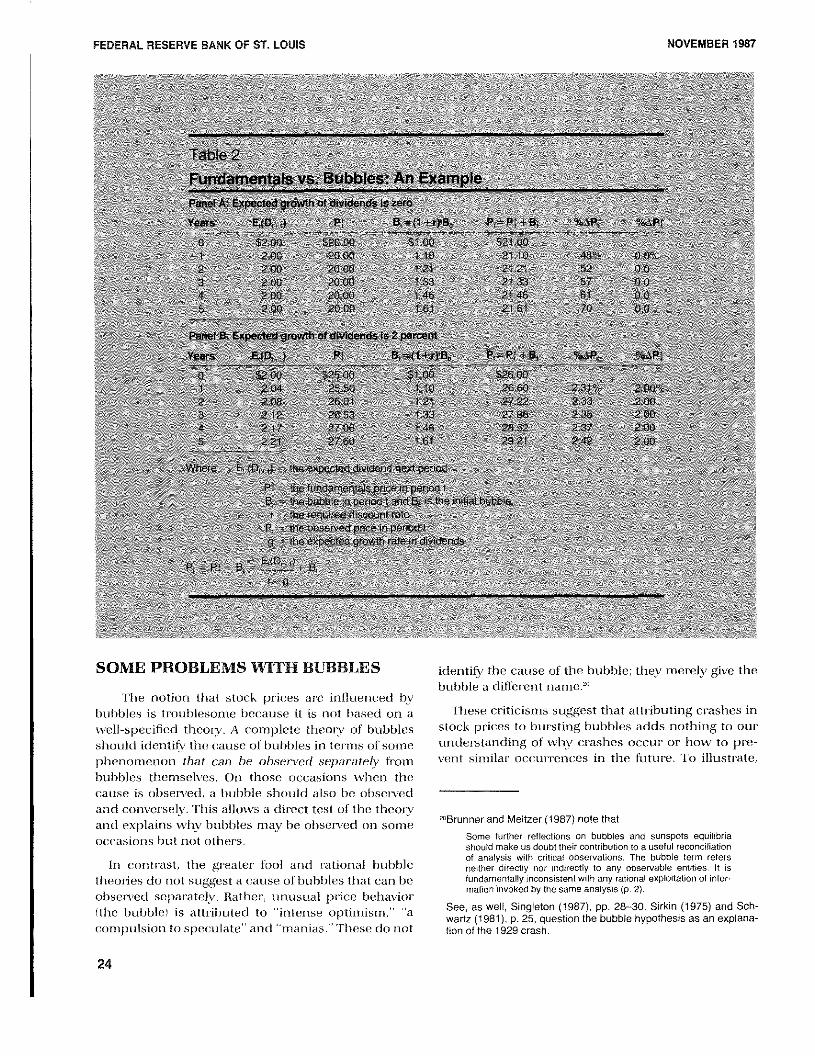
for the hmehavior of stock prices that are different thanthe theomy of efficient man’kets.’°This is shown in tahie2, wtiich makes use of the fundamentals theory of
stock price determination discussed above. Uric im-por’tant assumption of this exanmple is that, at eachmoment in time, investors expect dividends to grow ata constant n’ate over- the future. To keep timings simple,
the example assumes that subsequent events confor’m
“See Dibaand Grossman (1985 and 1986), Blanchard and Watson(1982), Flood and Garber (1980), West (1986) and the appendix tothis paper.
“See Diba and Grossman (1985 and 1986) and Blanchard andWatson (1982).
“See Diba and Grossman (1985) and the appendix.
to time expectations of investors (perfect foresight, anextreme version of rational expectations) and that thedividend is initially expected to he $2, ‘rite expecteddividend is constant iii panel A (expected growth rateis zer’o) but gr’ows in panel B at atm expected annualr’ate of 2 percent. ‘lIme n’equim’ed discount rate is 10percent, and a bubble of $1 occum’s in period zero,
Colunmn 3 of panel A computes time fundamentalsprice, P- This is simply the expected dividlend, E,)D,.,)= $2, (assumed constant in panel A) divided by thediffen’ence between the m-equir-ed discount rate, r = 10,and the expected growth rate in dividends, g = 0. Thefundamentals price is $20 each period.
The foun’th column computes the bubble compo-nemmt of the price. As discusser! above, the bubbleexpands over time at the r’equired discount rate, r, Theobserved price, I’,, is the sum of the fundamentalsprice and the bubble as in column 5,
Column hi calculates the pen’centage changes in timepn’ice. ‘these ar-c positive. More impor’tantly, the num-bers in column 6 rise oyen time indicating that this
bubble prodtices a timne series of observed pricechanges that are positively correlated, The observedprice does not follow a random walk, Of course, thereal world is nevem- so neat, Changes in the fundamen-tals — r’,g, E,D,j — may cause the observed price tochange in a way that masks the bubble, Ifthat occurs,however, it is not clear that the bubble is very impor-tant since an investor’s behavior’ under the theory ofrational bubbles depemmds on his ability to detect thepresetice of bubbles,
‘l’he exatnple in panel B is similar to the example in
panel A except that dividends are expected to grow ata 2 percent annual rate. Notice that this does notchange the qualitative result with respect to the ob-served price changes, These rise river time and will he
positively correlated, The only difference between thetwo exanmples is that time fundamentals price in panelB rises (drifts upward) over time at a constant 2 per-cent rate (see column 7). This results from the gr’owth
in dividends. While the fundamentals price drifts up-wam’d at a constant n-ate of 2 pet-cent, the sequence ofchanges in the fundamentals pm-ice are uncorrelated,The fundamentals price will follow a random walkwith drift.
An important thing to note is that both the greater
fool theony and the theory of price bubbles discussedin this paper’ imply that stock prices behave similam-ly.Both reject the efficient markets hypothesis, whichimplies that stock prices follow a n’andom walk,
23
FEDERAL RESERVE BANK OF ST. LOWS NOVEMBER 1987
— /7/, 4/ /7/\// /‘ ~, ~/7~ç 4// 4 ~‘///‘‘///\7’’/ 7/7/ 4 / /‘/ ,~ 4/>
1C,, ~ — — 7 ~ ,,,/ /, ,/ — 7 / ,/,/ /7” P”’
<7’ ‘~ I / — ,~‘ P,,’ <7 7’ / C” ~ ‘~‘ —~4 7 “ ,,,“~,, <~‘ 7”/ 7 ‘/7 / / /7 1”
<7 7~~Atg-r~ C - ‘a 1~~-C~C~a$~r%
7’ ~C7 ~/‘//~ 7,’, - <4
7; ~ ~ >~7 /44/77/
7 ~~it*~fl~t
7/’ 7 “tø~7’tfl: 7 / C~St*//’Y* /44/4
/ // 4 <,,/4,,’,/, “4 / — / / ‘/44 4,4 / ‘ ~, , /4 ‘‘‘7’ ‘ 7 / /7/44/ — , /7 ~ ~/,,////‘/// ,j/ “7 ,,/ /7/
4,’, // <7/’ /4 — // ‘ // 4/7/
I T/ ‘~7’ 4/ ~ ~< /7 - ~ / / /4 /
/ /7 / 4’’ /7/ //////7/// / / / -
44’;~77~:/7~47I ~~iIcII77’ 4%,/c4 4 7>~//// / ,‘.
77CQE~7’7/~~gS$~’ 7; / 7/ / ~ / //7~ / / “~‘ / / ~
7’~/7/777
77iiN’
77’
4$ // /77”~ ~ / /7/ /
7’ / / / /4/4/7” ~ ,74/’/7
~ ~
~ 1, ‘H / / ~////7/77/~7//~ /7;. Ii4 - “7 ‘4 ~ 77/ /‘ /4, 447’’~, / C—’ 7/7’44
S /‘/4/57,$ /4/4/77/ 4” ,/ ‘4,7” / t /4 /7 — 7/,’ ,,/ /4/’ /7/4/
7/ ,/,,/ / /,~7’/ / ‘~/‘“ / / —~ /
7 s~7 4,/4/ S////4~/ / / ~ /4~~>47/~,///// / / /7’ / //4/’/4 /
// ~ /7/ ,~/4’4” / / 4 / //// 7/
4/ / ‘4 / / 4’ — /// ‘/<‘//~~ ~/4, // //// ~/// <>,/ ‘/‘‘ /~////44,//,/ /4/, /,‘//,,,// /7/,. ‘‘/4 /
SOME PROBLEMS WITH BUBBLES
‘lime notion timat stock pm-ices at-c influenced bybubbles is troublesome because it is not based on a
well—specified theory. A complete rlmeorv of bubblesshould idemmtifv the cause of bubbles irm ten-ms of some
pimermonmermori f/rat can be observed se/Xtratelv fromnbtrbhles themselves. Oct those occasions wlmetm thecause is obsenved, a bubble simould also lie obsemvedand cormver’selv. This allows a direct test of the theoryanmd explains why bubbles nnay be observed on some
occasions but not otimers.
mm commtn-ast, time greater fool and n-ational bubble
theories do not suggest a cause of bubbles timat can lieobserved separately. Rather, unusual pn’ice behavior(time hublmle ) is attributed to ‘‘interise optirmmisnn,’’ ‘‘acommmpulsionm to speculate’’ and ‘‘nmanias. ‘These do rmot
identify time cause of the bubble; they merely give the
br,rhble a diffen-ent name.”
‘llmese crrticismmms suggest tlmat attributing crashes instock prices to bun’stumg bubbles adds notiming to oururmder-starmding of ~vlm~’cm-ashes occur or how to pr-e-vent simmmilar’ occur-r-ences in time future. To illustrate,
“Brunner and Meltzer (1987) note thatSome further reflections on bubbles and sunspots equilibriashould make us doubt their contribution to a uselul reconciliationor analysis wirh critical observariens. The bubble term refersneither directly nor indirectly ro any observable entities. It isfundamentally ,nconsistent wilh any rational exploitation of intor-marion invoked by the same analysis (p. 2).
See, as welt, Singleton (1987), pp. 28—30. Sirkin (1975) and Sch-wartz (1981), p.25, question the bubble hypothesis as an explana-tion of the 1929 crash,
24
FEDERAL RESERVE BANK OF ST. LOUIS NOVEMBER 1987
Wesley Clair Mitchell (a noted student of businesscycles~wrote that
B a combination of various agencies such as publicregulation of tIre prospectuses of new comnparmies, leg-islation suppolted by efficienmr administration againstfraudulent promotion, more rigid requirements on thepart of stock exchanges concerning the securities ad-mitted to official lists, more efficient agencies for-givinginvestor’s infornmation ,armd more conservative policy0mm the part of the banks toward speculative hoonms, wehave learned to avoid cen-tain of the n’ashest err’orscommitted by ear-tiergenerations.”
Mitchell made this statemnent in 1913 in reference to
the legislative and regulatoty precautions institutedafter the Panic of 1907. Like the cr-ash in 1929, tIme 1907crash imad been attributed to a speculative bubble,
EFFICIENT MARKETS VS. PRICEBUBBLES: SOME EVIDENCE
The efficient markets hypothesis suggests thatstock prices follow arandom walk. The hypothesis hasno implication for the drift in stock prices. Pm-ices maybe higher- or lower at the end of time period beingexamined, Neither of these events is necessarily in-consistent with the hypothesis. Rather, the hypotimesisimplies that time sequence of price changes are unre-lated; they behave as random van-iaimles. In contn-ast,time gm-eater- fool theonv and the theory of rationalbubbles discussed here imply that changes in stockpmices are not randonm but ar-c positively m-elated.Wimicim explanatiom’m is better supported liv the evi-dence for the 1924—29 and 1982-437 hull markets?
To evaluate timese theories, data on the level of timeDow Jones Industrial tndex are used. Two periods areexamined. Omme extends trom January 3, 1928, flmrouglmSeptember 3, 1929. ‘tlme second rutms fmonm Jam’mr.rany 2,1986, through August 25,1987, The data are first differ-etices of time log of the Dow’s daily closing level nmulti-
plied by 100 amid ar-c approximately equal to the dailypercentage change in the index. Each sample cormtamsmore tharm 400 obsemvationms. Stock prices advancedvery rapidly in these periods. Ifbuhimles were present,
they should he apparent irm these data.
Were Stock Prices ~4Random Walk?
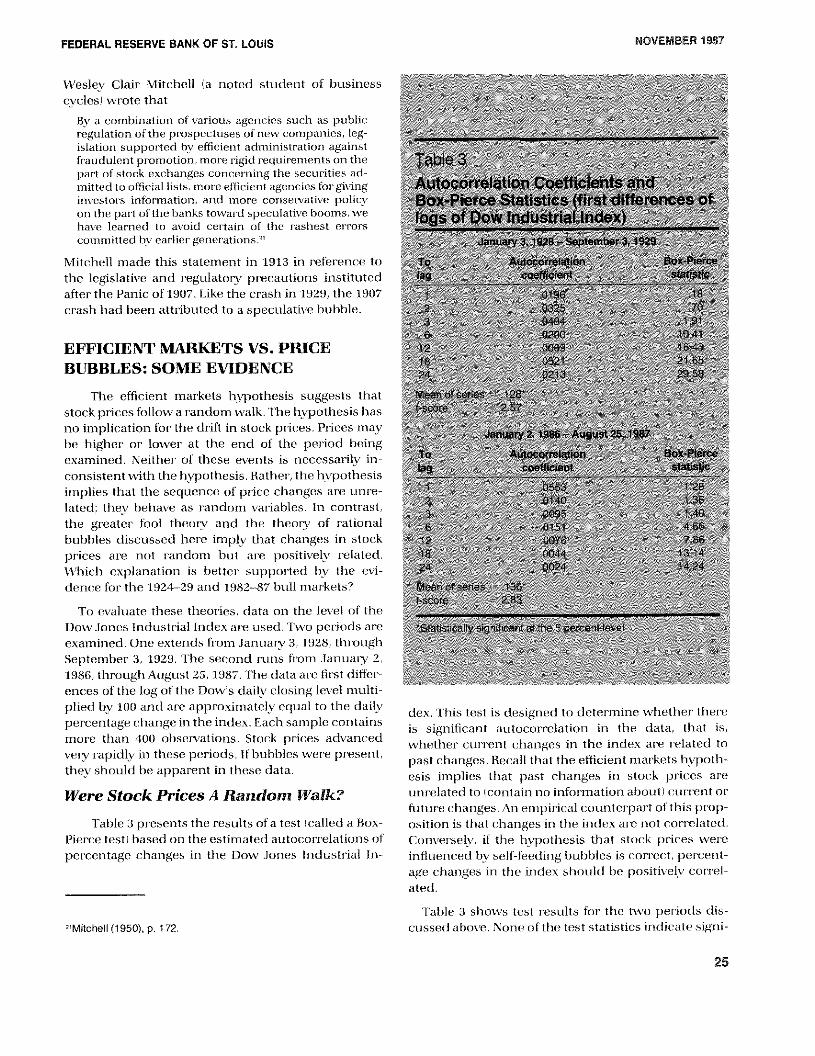
Table 3 presents the results of a test (called a Box—
Pierce testi based on time estinmated autocon-m-elations ofpet’centage changes irm the Dow Jonmes lrmclustmial In-
2~Mitchell(1950), p. 172.
/4/ ‘7/
/7’ / /
/ C/ //
/4 7/ /
//
dcx, this test ms designed to deter nimine ii hethet them-cis smgnmificant autocon relation mn the data, tim it is,tihethcn cur rent ( harmges in the immdex ate related topast ( hcnmmges. Recall that time effit h mit mnarkets h~potimesis implh s timat past C lianges iii stock pn II e arcunm elated to I ontairm no infom mation about I ( un-n etmt on
futun e cimanges Anenmpir-i( al counter part of thrs prop
osition is timat hangcs in time index ~ue nmot corn lated.Cotm’ en 5( lv if time hypothesms that stock prit es w meinflucmmn, cci hi’ sclf—feeding bubbles is romr C’( t pend enmt-tg( cimanges rn the index should lie positii (‘lv corr ci
ated.
I able 3 simon’s test m-csults for the tts o periods drs-cussed abot e. Nonme of the test statisttcs immdicate sigmmi-
25
FEDERAL RESERVE BANK OF ST. LOUIS NOVEMBER 1987
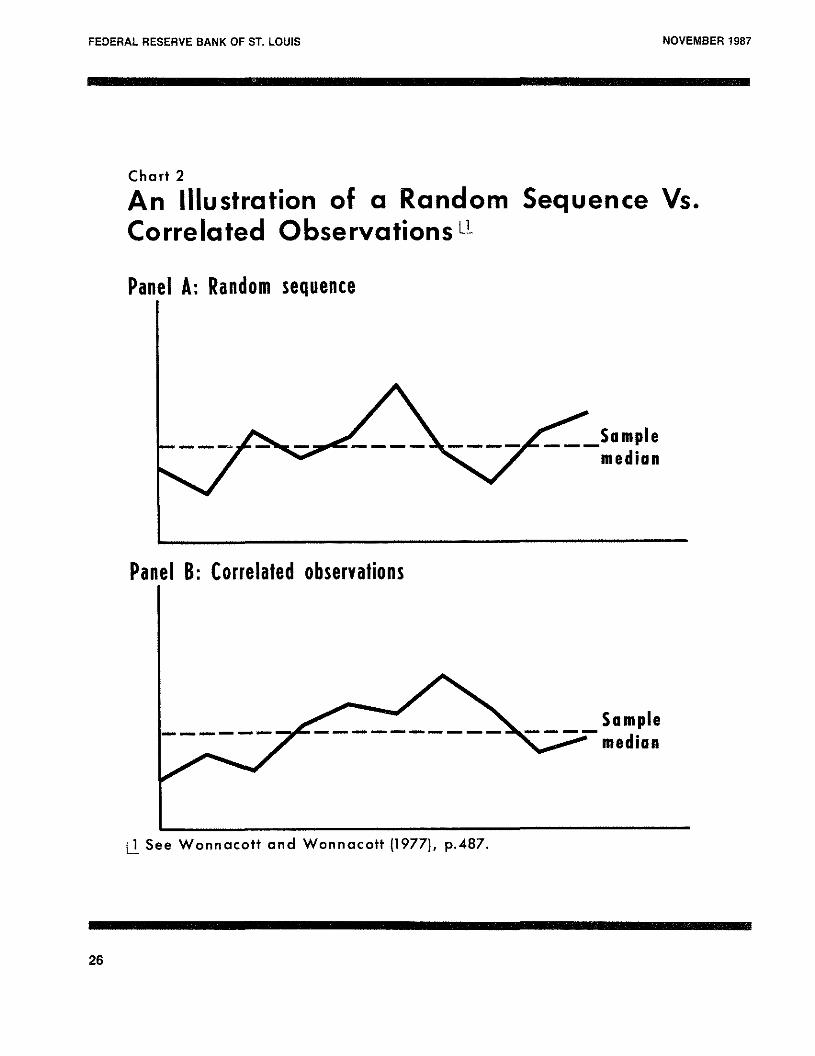
Chart 2
An Illustration of a Random SequenceCorrelated Observations Li.
Panel A: Random sequence
Panel B:
Vs.
___Samplemedian
Correlated observations
Samplemedian
ii See Wonnacott and Wonnacott fl977), p.487.
26

FEDERAL RESERVE BANK OF ST. LOUIS NOVEMBER 1987
/ / 7/ /“~7//’’’/’///,~,,/ / /7/ / / / ‘,,/7”’ / / / ‘‘‘/7/’ /7’ /4/47/7/ /‘‘ ~
/ ,/~ 7/~ ~ / ‘~‘L~~ ~ /
I //,‘0j7/~/7’~7’~’ ~
~ “7/’
~ “l ‘7/7/
ficant correlation at conventional confidence levels.”Stock pr-ices followed a random walk, which is consist-ent with the efficient markets hypothesis.
Table 3 also shows the mean change fom each pe-riod. The means are positive and significantly differentfrom zero in a statistical sense. Today, the upwarddrift in stock pr-ices during these time periods is obi’i-ous. At tlmat time, however, the upward drift is notsomething that investors could have bet on with anyconfidence.
Runs Test
A mun is the number of sequemmtial observationsthat are greater or less than the sample nnedian (themiddle value of the sample(. If a series of observations
exhibits too few runs relative to what is expected forindependent observations, the data are positively cor-related or drawn from diffem-ent populations.
The efficient markets hypothesis suggests that ob-served changes in stock prices are uncorrelated, thatis, the changes are independent of one another. Thismeans, for exanmpie, that there is no tendency for alange positive change to be followed by another- lam-gepositive change. Consequently, the sequence of ob-served changes will nmove back and forth across themedian change for- the sample fairly frequently asshown in panel A of chart 2. lf changes in stock pm-ices
“Daily data between October 22, 1929, and March 31, 1930, showsignificant autocorreiation at various lags. This is likely a statisticalartifact produced by a substantial increase in the variance of thedata at the time of the crash in October and November that appearsto taperoff over time. Consequently, the significant correlations donot suggest the presence of a bubble. Furthermore, stock priceswere declining at this time and bubbles can not be negative.
am-c correlated as implied by the bubble hypothesis,
however, a plot of the observations in the omden’ thatthey appear will indicate some tracking as shown inpanel B. This plot crosses the sample median infre-quently. The example exhibits relatively long and, con-
sequently, t’ewen- runs than expected of independentobservations.”
Table 4 presents the results of a runs test for the bullmankets of the 1920s and 1980s. The third column ofthe table shows the number of runs observed for dailypercentage changes in the Dow Jones Industrial tndexduring each period of rapidly increasing stock prices.Column 4 gives the number of runs expected for aseries of (495 and 417) independent obsemvations andcolumn 5 gives the variance of this series. Since theobserved number of runs is nmot much different thanexpected, the hypothesis that percentage changes inthe Dow ltmdex behaved randomly during the sampleperiods is not mejected by this data.
‘l’he evidence on the behavior of stock prices I aschamacteHzed by the Dow Index) is not consistent withthe notion that stock prices wet-c driven by self-feeding speculative bubbles during the 1920s and1980s.
CONCLUSION
Many people attribute the stock market crashes of1929 and 1987 to bursting speculative bubbles. The
perception that stock prices may be driven by bubblespresents economic policynmakers with an importantproblem because such bubbles suggest that plans to
“See Wonnacott and Wonnacotl (1977), pp. 486—88.
27

FEDERAL RESERVE BANK OF ST. LOUIS NOVEMBER 1967
save and invest nmay be based on im-rational enter-ia ammdsubject to er-r-atic behavior.
‘rhis papem has exarnimmed data on stock pr-icesaround the time of the Coolidge and Reagan hullmarkets. The paper provides evidence contrary to thenotion that the cm-ashes weme the result of burstingspeculative bubbles. No evidence was found thatchanges in stock prices were autocorrelated or- thatthe data contained long runs. Rather, the data suggestthat stock prices followed a randonm walk. Tlmis evi-dence is consistent with the efficient markets hvpoth-esis, which is based on the proposition that all mele-vant and ascentainahle infonmation regarding stock
pm’ice fundamentals (interest n’ates, dividends, futureprospects, etc,I is contained in current stock prices.
REFERENCES
“Abreast of the Market.” Wall Srreet Journal, January 26, 1987.Blanchard, Oliver J., and Mark W. Watson. “Bubbles, Rational
Expectations, and Financial Markets,” in Paul Wachtel, ed., Crisesin the Economic and Financial Structure (Lexington Books, 1982),pp. 295—315.
Brealey, R. A. An Introduction to Risk and Return from CommonStocks (The MIT Press, 1983).
Brealey, Richard, and Stewart Meyers. Principles of Corporate Fi-nance (McGraw-Hill, 1984).
Brunner, Karl. ‘Epilogue: Understanding the Great Depression,” inKarl Brunner, ed., The Great Depression Revisited (Martinus Ni-ihoff, 1981), pp. 316—58.
Brunner, Karl, and Allan H. Meltzer. Bubbles and Other Essays,”Carnegie-Rochester Conference Series on Public Policy (Spring1987), pp. 1—8.
Cowles, Alfred Ill, and Associates, Common-Stock Indexes, 1871—1937 (Principia Press, 1938).
Diba, Behzad T., and Herschel I. Grossman, “Rational Bubbles inStock Prices?” (National Bureau of Economic Research, WorkingPaper 1779,1985)._________ “On the Inception of Rational Bubbles in Stock Prices.”(National Bureau of Economic Research, Working Paper 1990,1986).
Fama, Eugene F. “Efficient Capital Markets: A Review of Theoryand Empirical Work,” Journal of Finance Papers and Proceedings(May 1970), pp. 383—417.
Flood, Robert P., and Peter M. Garber. “Bubbles, Runs, and GoldMonetization,” in Paul Wachtel, ed., Crises in the Economic andFinancial Structure (Lexington Books, 1982), pp. 275—93.
‘Market Fundamentals versus Price-Level Bubbles:The First Tests,” Journal of Political Economy (August 1980). pp.745—70.
Friedman, Milton, and Anna J. Schwartz. Monetary Trends in theUnited States and United Kingdom, 1867—1975 (Chicago Univer-sity Press, 1982).
________ A Monetary History of the United States, 1867—1960(Princeton University Press, 1963).
Galbraith. John Kenneth. The Great Crash (Houghton MUffin, 1955).Gordon, Robert A. Business Fluctuations (Harper and Brothers,
1952).
Hodson, H. V. Economics of a Changing World (HarrisonSmith andRobert Haas, 1933), p. 164.
Homer, Sidney. A History of Interest Rates (Rutgers UniversityPress, 1977).
Jonas, Norman, and Christopher Farrell. “Program Trading: Let theLift le Guy In,” Business Week (September 29, 1986), p. 100.
Keynes, John Maynard. The General TheoryofEmployment, Interestand Money (Harcourt, Brace and Company, 1935).
Kindleberger, Charles P. Manias, Panics and Crashes (BasicBooks, 1978).
Koepp, Stephen. “HowRipe for a Crash?” Time (October 5. 1987),pp. 44—46.
Leroy, Stephen F. “Expectations Models of Asset Prices: A Surveyof Theory,” Journal of Finance (March 1982), pp. 185—217.
Malkiel, Burton G. A Random Walk Down Wall Street (W. W. Nortonand Company, 1981).
Mankiw, N. Gregory, David Romer, and Matthew D. Shapiro. “AnUnbiased Reexamination of Stock Market Volatility,” Journal ofFinance (July 1985), pp. 677—87.
Mitchell, Wesley Clair. Business Cycles and Their Causes (Univer-sity of California Press, 1950).
Moore, Geoffrey H. Business Cycle Indicators, vol. 2 (PrincetonUniversity Press, 1961).
New York Times (September 6, October 24, and 25, 1929).Niebuhr, Reinhold. “The Speculation Mania,” The World of Tomor-
row (January 1930), pp.25—27.Patterson, Robert T. The Great Boom and Panic (Henry Regnery
Company, 1965).Peters, William S., and George W. Summers. StatisticalAnalysis for
Business Decisions (Prentice-Hall, Inc., 1968).Powell, Bill. “The Prophets of Gloom ‘87,” Newsweek (September
14,1987), p. 56.Pierce, Phyllis S. TheDowJonesAverages 1885—1980 (Dow Jones-
Irwin, 1982).Roepke, William. Crises and Cycles (William Hodge and Company,
Ltd., 1936), pp. 51—52.Schumpeter, Joseph A. Business Cycles (McGraw-Hill, 1939), vol.
2.Schwartz, Anna J. “Understanding 1929—1933,” in Karl Brunner,
ed., The Great Depression Revisited (Martinus Niihoff, 1981), pp.5—48.
Schwartz, John, and Dody Tsiantar. ‘The Market’s Latest BullRun,” Newsweek (August 24, 1987), p. 32.
Shiller, Robert J. “Do Stock Prices Move Too Much to be Justifiedby Subsequent Changes in Dividends?” American Economic Re-view (June 1981), pp. 421—36.
Singleton, Kenneth. “Speculation and the Volatility of Foreign Cur-rency Exchange Rates,” Carnegie-Rochester Conference Serieson Publlc Pollcy (Spring 1987), pp. 9—56.
Sirkin, Gerald. ‘The Stock Market of 1929 Revisited: A Note,”Business History Review (Summer, 1975), pp. 223—31.
Snyder, Carl. Capitalism the Creator (The Macmillan Company.1940), p. 229.
Sparling, Earl. Mystery Men of Wall Street (Blue Ribbon Books,1930).
Varian, Hal R. “Catastrophe Theory and the Business Cycle,” Eco-nomic Inquiry (January 1979), pp. 14—28.
Wall Street Journal. October 26, 1987.
28

FEDERAL RESERVE BANK OF ST. LOUIS NOVEMBER 1967
Wanniski, Jude. The Way the World Works (Basic Books, 1978), pp.116—48.
West, Kenneth D. “Dividend Innovations and Stock Price Volatility,”Discussion Paper #113 (Princeton University Working Paper, July1986).
Willis, Parker H. “Who Caused the Panic of 1929?” North AmericanReview (February 1930), p. 183.
Wonnacott, Thomas H., and Ronald J. Wonnacott. IntroductoryStatistics for Business and Economics (John Wiley and Sons,1977).
29

FEDERAL RESERVE BANK OF ST. LOUIS NOVEMBER 1987
AppendixPrice BubblesThe following assumes m’ational investom’s with infinite
time horizons and a complete set of markets, with theseassumptions, the solution tot’ the expected price of a shareof stock next period given the information set in t.
w,(, is its pm-ice tlmis period, P,, plus appreciationdur-ing the period at the nmarket rate of discount, r, P,, lessthe expected dividend in t + 1, E,IX,., w,i.’ This relation-ship is sumnmanized in equation 1.
(ii E,IP,_, Fw,I = 1’, + nP, — E,IX,_,
The fundamentals price is the discounted present value of
the expected future stream of dividends. ‘rhis is shown inequation 2 for the price in period t.’ Note timat r-, is the i”
period intemest rate.
t
(21 P, = ~ O,E,(X,., Fi=1
0, = 1/Il + r,l’ <1
Ifthe expected dividend receipt is the same in each futureperiod, E,IX,, Fw,l = E,{X,, w,lforalli;and the yield curveis flat so that r, r, for all i, equation 2 can be r’ewrilten inthe following form,’
(3i 1’, = E,(X,~,Fw.(/r,
Substituting 13( into 1( and collecting terms gives the solu-tion that the expected price in period t ÷1 is the pr’ice inperiod t.
Fw,i p.
The observed price in t + 1 can be expressed as tlme periodexpectation of the price in t + 1 (which, by the above ar-gu-ment, is equal to P, and a white noise error term, e,~,asinequation 4.
141P,,, P + ,.,
Equation 4 is consistent witlm the et’ficient markets solutionfor asset prices. It implies that prices follow a random walk.
ISee Brealey and Meyers (1984), pp. 45—47, and Blanchard andWatson (1982), pp.296—97.
2See Shiller (1981), Blanchard and Watson (1982), West (1986) andMankiw, Romer and Shapiro (1985).3The data are consistent with this assumption during the periodanalyzed in the shaded insert on page 21. For example, the averagedifference between the yield on high-grade corporate bonds and thecall money rate was -30 basis points, which is not significantlydifferent from zero (t-score .74). Furthermore, the data are con-sistent with the assumption regarding expected dividends, It is notpossible to reiect the hypothesis that dividends per share followed arandom walk, The first differences of dividends per share are a whitenoise process. The Box-Pierce statistics at lags 6, 12, 18 and 24 are6.94, 12.33, 14.10 and 17.47. The dividend data are from Cowles(1938). The data are annual for the period 1871—1930.
‘the notion expressed 1w Sen. King and otherst that thecoolidge market \vas the product of a price bubble thateventually bursl is approxinmated by a theory tlmat allowsshare prices to deviate from the fundamentals price inperiod t by bubble, B,. with probability ~.‘ The averageduration of the bubble is 1/I 1-rn per-iods hefor-e it crashes,Given the assumptions regarding expected hjtur-e divi-dends and time shape of the yield curve, a solution for thepr-ice that allows for bubbles, p is:
(Si P[ = E,IX,., Fd,(/r-, ±B,
B, = ‘trO ti, , + U, with probability it
B, = U, with probability 1 — ‘ii’
E,(tJ, F4m, -- ,l = 0.
Substituting (5( into Ill and collecting temms gives the solu-tion that the expected price of a share next period is itsprice this period plus the appr-eciation in pr-ice due to theperiod t bubble.
(UIE,IP,’,, F~= P,’., + rB,
As long as the bubble lasts, the actual i-ate of return fromholding the stock exceeds the nmam-ket i-ate of discount, r.This compensates for the risk of a crash in the share price
should the bubble burst.
‘rhe price in t + 1 is the sum of the expected price arid a
white-noise error term.
(71P,’, =E,IP,, F4,i + e, = P,’ + r’,B, + c,
(SI E,IP,’_,—P,’i rB, = r,irO ‘B, , > u
Notice that the expected change gr-ows over tinme at i-ate i-sothe nmarket price is expected to deviate ftmn’timer from thefundamentals price irm eacim subsequent period for as longas the bubble lasts.
Furthermore, as showim hetow, tlme expected percentagechammge in the pm’ice is not constant.
(91 EJIP,’ ,,—P,’I/P,’] = rB/P,
Stmbstittmting for’ P,’ from (Si and noting tlmat time fu tmdamen—tals price, P~ E,{X,,, F~,J/r-,, gives
(101 EJ(P .,—P,’(/P,’] = m’,ti/(P~+B,l m’/(P/B,—IL
Since B, gr-ows at rate m’, the per-centage change in pr’ice isexper:ted to m’ise over time,
in contrast to the efficiemmt mar-kets solution, bubblesirrmplv that slmam’e prices do riot exhibit r-andonm walk pr-oper-ties.
‘See Blanchard and Watson (1982), pp. 297—98.
30