Motion and Force Speed, Velocity, Slope, Friction, and Distance.
Upload
colin-jacksonCategory
view
215download
0
The graphs Part II…

The slope of a position vs time graph is?
The slope of part 1?
The slope of part 2?
The velocity in interval 3?
Velocity
+ 2 m/s -1m/s

Consider a car moving with a constant, rightward (+) velocity of +10 m/s.
What does a velocity vs time graph look like for this motion?
Zero Acceleration

Now consider a car moving with a rightward (+), changing velocity – that is, a car that is moving rightward and speeding up or accelerating.
The car is moving in the positive direction and speeding up, it is said to have a positive acceleration.
And the graph?

The instantaneous acceleration of an object at a certain time is the slope of the velocity versus time graph at that time. It can be positive, negative, or zero.
The slope of a velocity time graph is …
Slope = Δy = Change in velocity = Δx Change in time
ACCELERATION
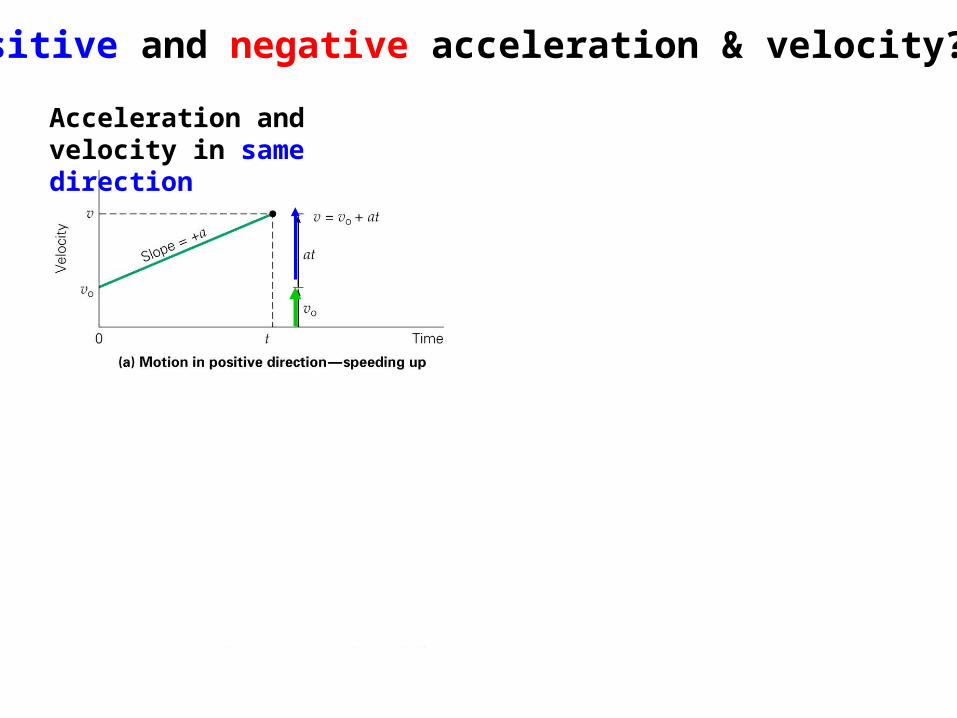
Positive and negative acceleration & velocity?Acceleration and velocity are in opposite directionsAcceleration and
velocity in same direction
Acceleration and velocity in same direction
Acceleration and velocity are in opposite directions

Describe the motion of the dot.
What does the position vs time graph look like?
What does the velocity vs time graph look like?
What does the acceleration vs time graph look like?
Constant positive velocity

Describe the motion of the dot.
What does the position vs time graph look like?
What does the velocity vs time graph look like?
What does the acceleration vs time graph look like?
A negative constant velocity
Describe the motion of the dot.
What does the position vs time graph look like?
What does the velocity vs time graph look like?
What does the acceleration vs time graph look like?
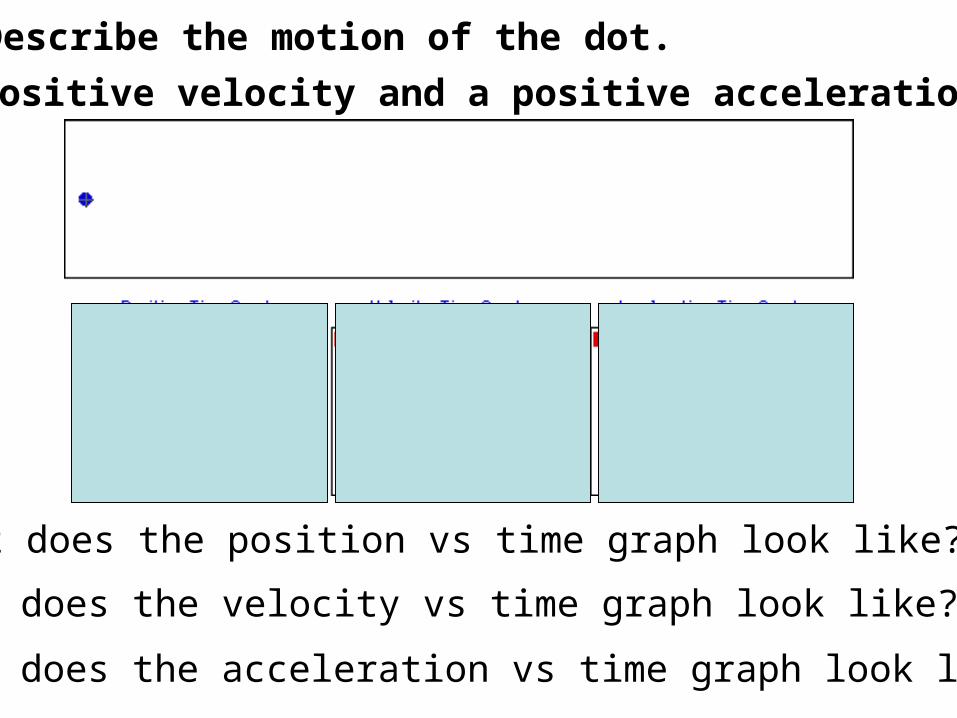
A positive velocity and a positive acceleration

Describe the motion of the dot.
What does the position vs time graph look like?
What does the velocity vs time graph look like?
What does the acceleration vs time graph look like?
A positive velocity and negative acceleration

Describe the motion of the dot.
What does the position vs time graph look like?
What does the velocity vs time graph look like?
What does the acceleration vs time graph look like?
A negative velocity and negative acceleration

Summary
Velocity in Quad 1: positive
Velocity in Quad 4: negative
Acceleration: positive if slope positive
negative if slope negative

Example: The velocity-time graph for a two-stage rocket is shown below. Use the graph and your understanding of slope calculations to determine the acceleration of the rocket during the listed time intervals
0 to 1 sec 1 to 4 sec 4 to 9 sec 9 to 12 sec
+ 40m/s2
accelerating upward+20 m/s2
Still accelerating upward-20 m/s2
Decelerating & moving upward
-20 m/s2 Accelerating downward

3,2,1,Blast off…

Area and Graphs

Example 2: a) What is the acceleration in interval A?
Acc = Δy = (20 – 0 m/s) = Δx (10 – 0 s)
+ 2 m/s2
b) What distance does it travel in first the 20s?
The distance covered is the “area under” the line.
Area = ½ bh
Distance = ½ (20s)(40m/s) Distance = 400 m

Example 2:
The distance covered is the “area under” the line.
c) What is the acceleration in interval B?
Constant velocity of +40 m/s
d) What is the distance traveled during t=20s to t = 40s?
Area = (b)(h)
Distance = (20s)(40m/s)
Distance = 800m
e) What is the total distance?
Distance = 400m + 800m = 1200m

Acceleration Graph
m/s2 vs second

Graph Summary

d vs t graphalso referred to as a position time graph
• Slope of line is velocity
• Linear line represents a constant velocity
• Horizontal line represents no motion
• Curved line represents acceleration
• Steeper slope represents greater velocity
• Slope = d /t = velocity
• Distance from detector CAN be indicated

v vs t graph• Slope of line is acceleration• Linear line represents uniform acceleration• Horizontal line represents constant velocity, a=o• Curved line represents changing acceleration• Steeper slope represents greater acceleration• Slope = v /t = acceleration• Distance from detector cannot be indicated, only
direction: away is positive and towards is negative• Area under curve indicates displacement
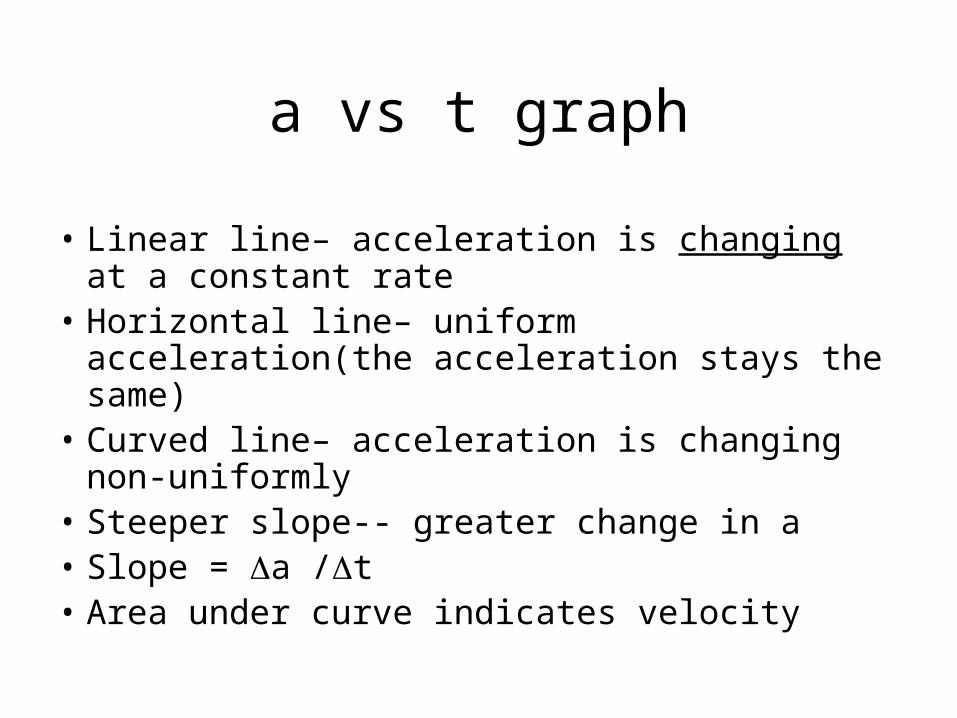
a vs t graph
• Linear line– acceleration is changing at a constant rate
• Horizontal line– uniform acceleration(the acceleration stays the same)
• Curved line– acceleration is changing non-uniformly
• Steeper slope-- greater change in a• Slope = a /t• Area under curve indicates velocity

Comparing graphsNo motion (v=0)
velocity vs. time
00.20.40.60.8
1
1 2 3 4 5 6
time
ve
loc
ity
Series1
acceleration vs. time
00.20.40.60.8
1
1 2 3 4 5 6
time
ac
ce
lera
tio
n
Series1
Distance Vs. Time
0
2
4
6
1 2 3 4 5
time
dis
tan
ce
Series1

Constant Velocity (a=0) positive direction
velocity Vs. Time
0
2
4
6
1 2 3 4 5
time
ve
loc
ity
Series1
Distance vs. time
0
10
20
30
1 2 3 4 5 6
time
dis
tan
ce
Series1
acceleration vs. time
00.20.40.60.8
1
1 2 3 4 5 6
time
ac
ce
lera
tio
n
Series1

Constant velocity (a=0) negative direction
acceleration vs. time
00.20.40.60.8
1
1 2 3 4 5 6
time
ac
ce
lera
tio
n
Series1
velocity vs. time
-6
-4
-2
0
1 2 3 4 5 6
time
ve
loc
ity
Series1
distance vs. time
0
10
20
30
1 2 3 4 5 6
time
dis
tan
ce
Series1

Classwork: Graphing Little Dudes WS # 2