The Global Submarine Market 2014 2024 - ap1inc.com - SP.pdf · “The Global Submarine Market...
22
The Global Submarine Market 2014–2024 1 The Global Submarine Market 2014–2024 Report Price: US$4,800 (Single User)
Transcript of The Global Submarine Market 2014 2024 - ap1inc.com - SP.pdf · “The Global Submarine Market...

The Global Submarine Market 2014–2024
1
The Global Submarine Market 2014–2024
Report Price: US$4,800 (Single User)

The Global Submarine Market 2014–2024
2
Summary
“The Global Submarine Market 2014–2024” offers the reader detailed analysis of the global submarine market
over the next ten years, and provides market size forecasts. It covers the key technological and market trends
in the submarine market.
The demand for global submarines is anticipated to be driven by growing regional tensions, coupled with
maritime conflicts. The new technological advancements in the sector will also drive demand. The market is
expected to be dominated by North America, followed by Asia Pacific and Europe. In spite of the budget
sequestration measures, the US still has the highest spend in the sector and is almost equal to the spending in
Asia-Pacific, which is the second largest spending region. Asia Pacific is the second largest market for
submarines with major spenders in the region including China, India, Australia and Japan.
“The Global Submarine Market 2014–2024” provides detailed analysis of the current industry size and growth
expectations from 2014 to 2024, including highlights of key growth stimulators. It also benchmarks the industry
against key global markets and provides a detailed understanding of emerging opportunities in specific areas.
Key Findings
A major finding in the report entails that the sector demand will be largely driven by increase in maritime
security threats and need for replacement of obsolete submarines; leading to consistent growth in the market.
The demand for submarines is also anticipated to be driven by the need for the balance of power by countries
with major militaries. In a bid to counter the growing threat of the Chinese Navy, various nations around the
world are expected to procure numerous submarines during the forecast period. Cumulatively, the global
market for submarines is expected to value US$XX billion during the forecast period. The market is expected
to be led by North America, followed by Asia Pacific and Europe. Despite the after effects of the recent
economic crisis, Europe’s share of the global market is projected to increase during the forecast period due to
the scheduled deployment of various submarines including programs such as the Astute, Successor, Yasen
and Borei classes among others, which had been initiated in previous years.
Key Features and Benefits
The report provides detailed analysis of the market for global submarines during 2014–2024, including the
factors that influence why countries are investing or cutting expenditure on these segments. It provides
detailed expectations of growth rates and projected total expenditure.

The Global Submarine Market 2014–2024
3
1 Global Submarine Market Size and Drivers
1.1 Global Submarine Market Size and Forecast 2014–2024
1.1.1 Demand for submarines to grow at a CAGR of 5.19%
The global submarine market is expected to value US$XX billion in 2014, and increase at a CAGR of XX%
during the forecast period, to reach US$XX billion by 2024. The market consists of three categories: SSN,
SSBN, and SSK. The SSN segment is expected to account for XX% of the global submarine market, followed
by the SSK segment with a share of XX%, and SSBN with the remaining XX%. During the forecast period, the
cumulative global expenditure on submarines is expected to reach US$XX billion.
The chart below shows the expected submarine market value during 2014–2024:
Figure 1: Global Submarine Market (US$ Billion), 2014–2024
Source: SDI analysis © SDI
0.0
5.0
10.0
15.0
20.0
25.0
30.0
35.0
2014 2015 2016 2017 2018 2019 2020 2021 2022 2023 2024
US
$ B
illi
on

The Global Submarine Market 2014–2024
4
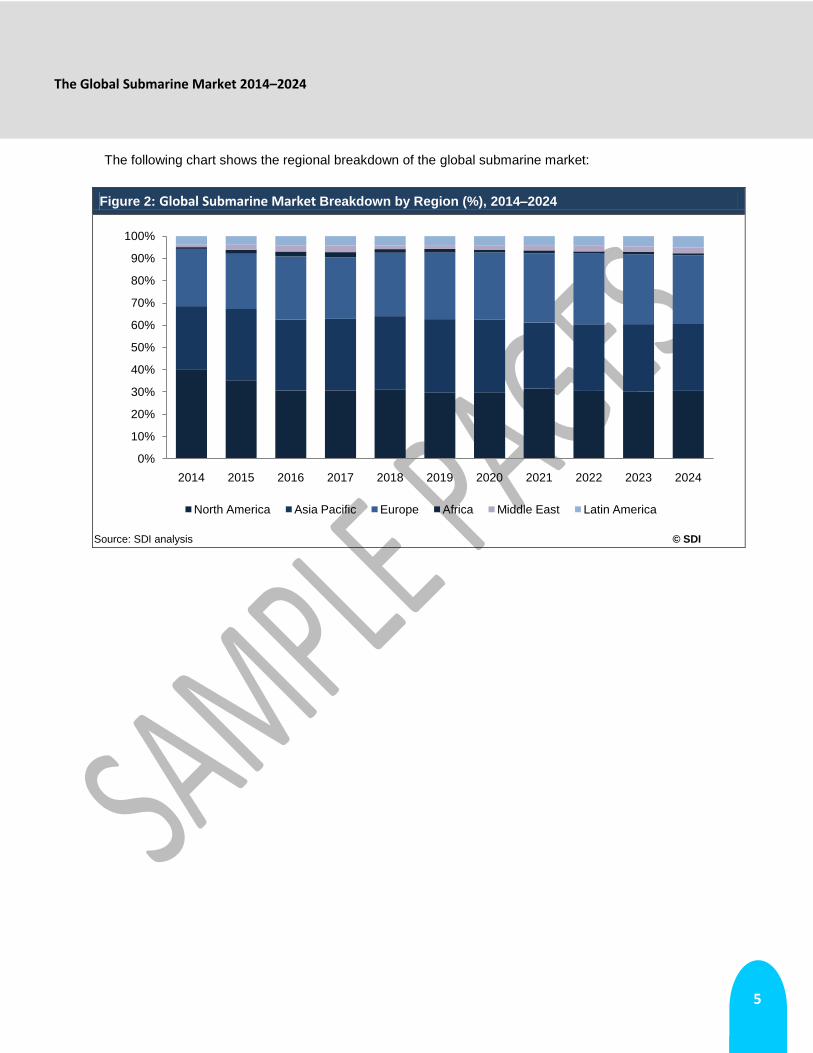
1.2 Global Submarine Market – Regional Analysis
1.2.1 North America leads the global submarine market
The total global submarine market is expected to be cumulatively worth US$XX billion across the forecast
period. The market, which is estimated at US$XX billion in 2014, is set to rise by a CAGR of XX%, to US$XX
billion by 2024. North America is expected to constitute XX% of the market during the forecast period with a
total spending of US$XX billion. In spite of the budget sequestration measures, the US still has the highest
spend in the sector and is almost equal to the spending in Asia-Pacific, which is the second largest spending
region. European nations are expected to cumulatively spend US$XX billion across the forecast period, and
constitute XX% of the total submarine market.
The rise of regional powers including India and China, with a strong desire for power projection, and growing
regional tensions, coupled with maritime conflicts, will drive growth in the submarine sector in the Asia Pacific
region. Additionally, Asian countries are keen to develop indigenous submarines, which will drive further
growth in the sector. It is expected that the cumulative spend by Asia in the sector will amount US$XX billion,
or XX% of the total market. Brazil and Argentina are the main spenders in the submarine sector in Latin
America, and the countries in the region are expected to cumulatively spend US$XX billion. The remaining
XX% of the overall spending on submarines is expected to be on submarine procurement by countries of
African and Middle Eastern region.
The table below gives a brief overview of the global submarine market:
Table 1: Global Submarine Market Overview
Region Market in 2014 Market in 2024 Total Market (2014–2024)
Annualized growth/decline
(2014–2024)
North America US$XX billion US$XX billion US$XX billion XX%
Europe US$XX billion US$XX billion US$XX billion XX%
Asia-Pacific US$XX billion US$XX billion US$XX billion XX%
Latin America US$XX billion US$XX billion US$XX billion XX%
Middle East US$XX billion US$XX billion US$XX billion XX%
Africa US$XX billion US$XX billion US$XX billion XX%
Total Submarine Market US$XX billion US$XX billion US$XX billion XX%
Source: SDI analysis © SDI
The Global Submarine Market 2014–2024
5
The following chart shows the regional breakdown of the global submarine market:
Figure 2: Global Submarine Market Breakdown by Region (%), 2014–2024
Source: SDI analysis © SDI
0%
10%
20%
30%
40%
50%
60%
70%
80%
90%
100%
2014 2015 2016 2017 2018 2019 2020 2021 2022 2023 2024
North America Asia Pacific Europe Africa Middle East Latin America

The Global Submarine Market 2014–2024
6
2 SWOT Analysis of the Global Submarine Market
Table 2: SWOT Analysis of the Global Submarine Market
Source: SDI analysis © SDI
Strengths Weaknesses
Opportunities Threats
The Global Submarine Market 2014–2024
7
3 Country Analysis – Global Submarine Market
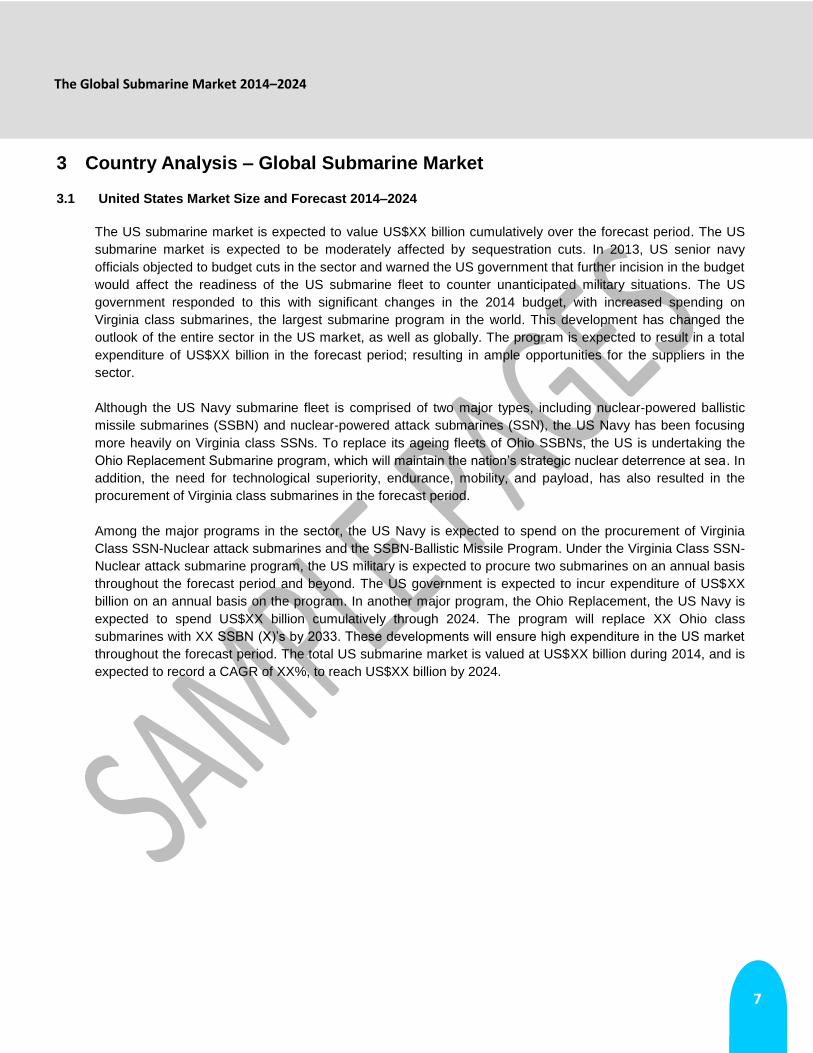
3.1 United States Market Size and Forecast 2014–2024
The US submarine market is expected to value US$XX billion cumulatively over the forecast period. The US
submarine market is expected to be moderately affected by sequestration cuts. In 2013, US senior navy
officials objected to budget cuts in the sector and warned the US government that further incision in the budget
would affect the readiness of the US submarine fleet to counter unanticipated military situations. The US
government responded to this with significant changes in the 2014 budget, with increased spending on
Virginia class submarines, the largest submarine program in the world. This development has changed the
outlook of the entire sector in the US market, as well as globally. The program is expected to result in a total
expenditure of US$XX billion in the forecast period; resulting in ample opportunities for the suppliers in the
sector.
Although the US Navy submarine fleet is comprised of two major types, including nuclear-powered ballistic
missile submarines (SSBN) and nuclear-powered attack submarines (SSN), the US Navy has been focusing
more heavily on Virginia class SSNs. To replace its ageing fleets of Ohio SSBNs, the US is undertaking the
Ohio Replacement Submarine program, which will maintain the nation’s strategic nuclear deterrence at sea. In
addition, the need for technological superiority, endurance, mobility, and payload, has also resulted in the
procurement of Virginia class submarines in the forecast period.
Among the major programs in the sector, the US Navy is expected to spend on the procurement of Virginia
Class SSN-Nuclear attack submarines and the SSBN-Ballistic Missile Program. Under the Virginia Class SSN-
Nuclear attack submarine program, the US military is expected to procure two submarines on an annual basis
throughout the forecast period and beyond. The US government is expected to incur expenditure of US$XX
billion on an annual basis on the program. In another major program, the Ohio Replacement, the US Navy is
expected to spend US$XX billion cumulatively through 2024. The program will replace XX Ohio class
submarines with XX SSBN (X)’s by 2033. These developments will ensure high expenditure in the US market
throughout the forecast period. The total US submarine market is valued at US$XX billion during 2014, and is
expected to record a CAGR of XX%, to reach US$XX billion by 2024.

The Global Submarine Market 2014–2024
8
The table below gives a brief overview of the US submarine market:
Table 3: US Submarine Market Overview
Particulars Market in 2014 Market in 2024 Total Market
(2014–2024)
Annualized growth/decline
(2014–2024)
SSBN US$XX million US$XX billion US$XX billion XXX%
SSN US$XX million US$XX billion US$XX billion XXX%
Total Submarine market US$XX billion US$XX billion US$XX billion XXX%
Source: SDI analysis © SDI
The chart below shows the submarine market size in the US between 2014 and 2024:
Figure 3: Submarine Market in the US (US$ Billion), 2014–2024
Source: SDI analysis © SDI
0
1
2
3
4
5
6
7
8
9
10
2014 2015 2016 2017 2018 2019 2020 2021 2022 2023 2024
US
$ B
illio
n

The Global Submarine Market 2014–2024
9
The table below shows the key US submarine programs:
Table 4: Key US Submarine programs
Program/Equipment Name
Type Quantity Procured
Supplier/Country Delivery Period Total Contract
Value
Ohio Replacement Program
SSBN XX XX 2014–2024 US$XX billion
Virginia-class submarines
SSN XX XX 2014–2042 US$XX billion
Source: SDI analysis © SDI
The following chart shows the category break–up of the submarine market in the US from 2014–2024:
Figure 4: US Submarine Market Split By Category in the US (%), 2014–2024
Source: SDI analysis © SDI
0%
10%
20%
30%
40%
50%
60%
70%
80%
90%
100%
2014 2015 2016 2017 2018 2019 2020 2021 2022 2023 2024
SSN-Nuclear Attack Submarine SSBN-Balistic Missile Submarine

The Global Submarine Market 2014–2024
10
Report Methodology
Strategic Defense Intelligence (SDI) dedicated research and analysis teams consist of experienced
professionals with a background in industry research and consulting in the defense sector. The market size is
derived by consolidating ongoing procurement programs, modernization initiatives, and future procurement
plans, utilizing information gathered through primary and secondary sources. Forecasting is conducted based
on the lifetime of current inventory levels, suitability/need of the weapon category for a specific country, budget
availability, and opinion of leading industry experts. The following research methodology is followed for all
databases and reports.
3.2 Secondary Research
The research process begins with exhaustive secondary research to source reliable qualitative and
quantitative information related to the global submarine market. The secondary research sources that are
typically referred to include, but are not limited to:
Globally renowned think tanks
Industry associations
National government documents and statistical databases
Company websites, annual reports, financial reports, broker reports, and investor presentations
Industry trade journals and other literature
Internal and external proprietary databases
News articles, press releases, and webcasts specific to the companies operating in the market
3.3 Primary Research
SDI conducts hundreds of primary interviews a year with industry participants and commentators in order to
validate its data and analysis. A typical research interview fulfills the following functions:
Provides first-hand information on market size, market trends, growth trends, competitive landscape, and
future outlook.
Helps to validate and strengthen secondary research findings.
Further develops the analyses team’s expertise and market understanding.
The participants who typically take part in such a process include, but are not limited to:
Industry participants: CEOs, VPs, business development managers, market intelligence managers, and
national sales managers.
External experts: investment bankers, valuation experts, research analysts, and key opinion leaders
specializing in defense markets.

The Global Submarine Market 2014–2024
11
3.4 Conventions
Currency conversions are performed on the basis of average annual conversion rate format calculations.
All the values in tables, with the exception of compounded annual growth rate (CAGR) and compounded
annual rate of change (CARC) are displayed to one decimal place. Growth rates may, therefore, appear
inconsistent with absolute values due to this rounding method.
Related Reports
The Global Military Simulation and Virtual Training Market 2014–2024
The Global Military IT, Data and Computing Market 2014–2024
The Global Government Biometric Systems Market 2014–2024
The Global Military GPS/GNSS Market 2013–2023
The Global Military Ammunition Market 2013–2023
The Global Man-Portable Military Electronics Market 2013–2023

The Global Submarine Market 2014–2024
12
TABLE OF CONTENTS
1 Introduction ......................................................................................................................... 13
1.1 What is this Report About? ............................................................................................................. 13
1.2 Definitions ...................................................................................................................................... 13
1.3 Summary Methodology ................................................................................................................... 15
1.4 About Strategic Defence Intelligence .............................................................................................. 16
2 Executive Summary ............................................................................................................ 17
3 Global Submarine market Size and Drivers ...................................................................... 19
3.1 Submarine Market Size and Forecast 2014-2024 ........................................................................... 19
3.1.1 Demand for submarines to grow at a CAGR of XX% ...............................................................................19
3.2 Global Submarine Market – Regional Analysis ............................................................................... 20
3.2.1 North America leads the global submarine market ...................................................................................20
3.2.2 Submarine expenditure in North America set to experience nominal growth ...........................................22
3.2.3 Asia Pacific Submarine market to be the second largest market globally ................................................24
3.2.4 Submarine market in Europe expected to grow at a CAGR of XX% ........................................................26
3.2.5 Brazil expected to be the highest spender in the submarine sector in Latin America ..............................28
3.2.6 African submarine market to be negligible as large defense spenders have recently completed submarine
acquisitions ............................................................................................................................................................30
3.2.7 Middle Eastern submarine market to be robustduring the forecast period ...............................................31
3.3 Submarine Sub–Sector Market Size Composition .......................................................................... 32
3.3.1 SSNs are expected to have the largest share of the total submarine market during the forecast period 32
3.3.2 Demand for SSKs expected to fall during the forecast period ..................................................................34
3.3.3 Market for ballistic missile submarines to record a CAGR of XX% during the forecast period .................35
3.4 Demand Drivers and Growth Stimulators ........................................................................................ 36
3.4.1 Robust procurement plans in Asia to drive market growth .......................................................................36
3.4.2 Replacement of obsolete submarines is expected to drive the demand ..................................................36
3.4.3 Maritime security threats fuel the global demand for submarines.............................................................37
3.5 Defense Budget Spending Review ................................................................................................. 38
3.5.1 European capital expenditure expected to increase during the forecast period .......................................38
3.5.2 Asian defense budgets expected to increase at a robust pace ................................................................39
3.5.3 North American defense expenditure projected to increase marginally during the forecast period .........40
3.5.4 Modernization programs likely to drive defense expenditure in South American countries .....................41
3.5.5 Military budgets of African countries expected to increase during the forecast period .............................42
3.5.6 Defense budgets of Middle Eastern countries likely to increase during the forecast period ....................43
3.6 Defense Modernization Review ...................................................................................................... 44
The Global Submarine Market 2014–2024
13
3.6.1 Financial constraints causing delays in European defense modernization programs ..............................44
3.6.2 Defense budgets of Asian countries likely to be driven by competitive arms acquisitions .......................44
3.6.3 Global economic slowdown leading to defense budget cuts in the North American region .....................44
3.6.4 Need to replace aging equipment driving South American defense expenditure .....................................45
3.6.5 Security threats increasing the defense budget of African countries ........................................................45
3.6.6 Demand for air defense systems is likely to increase in the Middle East .................................................45
3.7 Technological Developments .......................................................................................................... 47
3.7.1 Shift to Integrated Electric Power Systems ...............................................................................................47
3.7.2 Mature Air Independent Propulsion systems seen as a must have capability ..........................................47
3.7.3 Demand for Nuclear Submarines paves way for state-of-the-art technology equipment .........................48
3.7.4 Improvements in submarine stealth ..........................................................................................................49
3.7.5 Improvements in active and passive sonar and sensor technologies .......................................................49
3.8 Market Trends ................................................................................................................................ 50
3.8.1 Increasing demand for submarines among the developing economies ....................................................50
3.8.2 Growing need for Multi-mission submarines .............................................................................................50
3.9 Industry Consolidation .................................................................................................................... 52
3.9.1 Collaborative approach to submarine construction ...................................................................................52
3.9.2 Mergers and Acquisitions ..........................................................................................................................52
3.10 Key Challenges .............................................................................................................................. 53
3.10.1 Defense budget cuts across the world impede the growth of the global submarine market ....................53
3.10.2 Lack of skilled labor hampers growth of the industry ................................................................................53
4 SWOT Analysis of the SubmarineMarket .......................................................................... 54
4.1 Strengths ........................................................................................................................................ 55
4.1.1 Submarines regarded as the strategic assets of the Navy .......................................................................55
4.1.2 Integration of technological innovations to propel the global demand for submarines .............................55
4.1.3 Numerous countries looking to enhance indigenous submarine development capabilities ......................56
4.2 Weaknesses ................................................................................................................................... 57
4.2.1 Lack of skilled labor impacts the growth of the industry ............................................................................57
4.2.2 Corruption and delays in technology transfers mar the growth of the industry .........................................57
4.3 Opportunities .................................................................................................................................. 59
4.3.1 Need to replace obsolete submarines .......................................................................................................59
4.3.2 Maritime security threats are expected to drive the demand for submarines ...........................................59
4.3.3 Arms race in Asia-Pacific is anticipated to drive the procurement of submarines ....................................60
4.3.4 Boost to local submarine industry in BRIC ................................................................................................60
4.4 Threats ........................................................................................................................................... 61
4.4.1 A reduction in global military expenditure is likely to affect the submarine market ...................................61
The Global Submarine Market 2014–2024
14
4.4.2 Inadequately trained navies affect the overall sales of submarines .........................................................61
5 Country Analysis – Submarine Market .............................................................................. 62
1 62
5.1 United States Market Size and Forecast 2014–2024 ...................................................................... 63
5.1.1 Nuclear attack submarines expected to account for the largest share of US submarine expenditure .....66
5.1.2 SSBN segment expected to register a CAGR of XX% over the forecast period ......................................68
5.2 United Kingdom Market Size and Forecast 2014–2024 .................................................................. 70
5.2.1 SSBN expected to account for the largest share of UK spending on submarines....................................73
5.2.2 SSN segment expected to register a CAGR of XX% over the forecast period .........................................75
5.3 Russia Market Size and Forecast 2014–2024 ................................................................................ 76
5.3.1 Russian SSN submarine market to witness highest spending during the forecast period .......................79
5.3.2 SSBN expected to account for the second largest segment in the Russian submarine market ...............81
5.3.3 SSK to account for a considerable share of expenditure in the Russian submarine market ....................83
5.4 France Market Size and Forecast 2014–2024 ................................................................................ 85
5.4.1 Barracuda SSN program to sustain the spending in the French submarine market ................................87
5.5 Chinese Market Size and Forecast 2014-2024 ............................................................................... 88
5.5.1 SSBN segment is expected to constitute for XX% share in Chinese submarine market .........................91
5.5.2 SSN segment expected to constitute the second largest market share during the forecast period .........93
5.5.3 SSK segment is expected to account for the third largest share during the forecast period ....................94
5.6 Indian Market Size and Forecast 2014-2024 .................................................................................. 96
5.6.1 SSK expected to constitute the largest market share ...............................................................................99
5.6.2 India spending significantly on SSBNs during the forecast period .........................................................101
5.6.3 Spending on SSN to account for the third largest segment in India .......................................................102
5.7 Australia Market Size and Forecast 2014-2024 ............................................................................ 103
5.7.1 Long-term SSK procurement program to sustain spending in the Australian submarine market ...........105
5.8 Saudi Arabian Market Size and Forecast 2014–2024 ................................................................... 106
5.8.1 Long-term SSK procurement program to sustain spending in the Saudi Arabian submarine market ....108
5.9 Israel Market Size and Forecast 2014–2024 ................................................................................ 109
5.9.1 Israel to spend on the procurement of SSK submarines ........................................................................111
5.10 Brazil Market Size and Forecast 2014–2024 ................................................................................ 112
5.10.1 Brazil is expected to spend US$XX billion on diesel electric submarines during the forecast period ....115
5.10.2 Expenditure on SSNs Type submarines expected to remain the largest over the forecast period ........116
5.11 Argentina Market Size and Forecast 2014–2024 .......................................................................... 117
5.11.1 Argentina is expected to invest in SSNs during the forecast period .......................................................119
5.12 Egypt Market Size and Forecast 2014-2024 ................................................................................. 120

The Global Submarine Market 2014–2024
15
5.12.1 Egypt SSK market to grow at a CAGR of XX% during the forecast period ............................................122
5.13 Algeria Market Size and Forecast 2014-2024 ............................................................................... 123
5.13.1 Algeria is expected to invest US$XX million in procurement of SSKs during the forecast period ..........125
6 Major Submarine Programs .............................................................................................. 126
6.1 SSBNs .......................................................................................................................................... 126
6.1.1 US - SSBN (X) Program ..........................................................................................................................126
6.1.2 UK - Successor Program.........................................................................................................................127
6.1.3 Russia - Borei-Class ................................................................................................................................129
6.1.4 China - Jin-Class (Type 094) ..................................................................................................................130
6.1.5 India - Arihant-Class ................................................................................................................................131
6.2 SSNs ............................................................................................................................................ 132
6.2.1 US - Virginia-Class ..................................................................................................................................132
6.2.2 UK - Astute-Class ....................................................................................................................................133
6.2.3 France - Barracuda-Class .......................................................................................................................135
6.2.4 China - Type 095 .....................................................................................................................................136
6.2.5 Russia - Yasen-Class ..............................................................................................................................137
6.3 SSKs ............................................................................................................................................ 138
6.3.1 Brazil - S-BR diesel-electric submarines .................................................................................................138
6.3.2 Turkey - U-214 ........................................................................................................................................139
6.3.3 Japan - Sōryū-Class ................................................................................................................................140
6.3.4 Australia - SEA 1000 future submarine project .......................................................................................141
6.3.5 India - Project–75 (I) ................................................................................................................................142
6.3.6 China - Yuan-Class (Type 041) ...............................................................................................................143
7 Competitive Landscape and Strategic Insights .............................................................. 144
7.1.1 Navantia S.A: overview ...........................................................................................................................146
7.1.2 Navantia S.A: products and services ......................................................................................................146
7.1.3 Navantia S.A: recent announcements and strategic initiatives ...............................................................146
7.1.4 Navantia SA: alliances ............................................................................................................................146
7.1.5 Navantia SA: recent contract wins ..........................................................................................................147
7.1.6 Fincantieri: overview ................................................................................................................................147
7.1.7 Fincantieri: products and services ...........................................................................................................147
7.1.8 Fincantieri: recent announcements and strategic initiatives ...................................................................148
7.1.9 Fincantieri: alliances ................................................................................................................................148
7.1.10 Fincantieri: recent contract wins ..............................................................................................................148
7.1.11 Fincantieri: financial analysis ..................................................................................................................149
7.1.12 DCNS: overview ......................................................................................................................................151

The Global Submarine Market 2014–2024
16
7.1.13 DCNS: products and services .................................................................................................................151
7.1.14 DCNS: recent announcements and strategic initiatives ..........................................................................152
7.1.15 DCNS: alliances ......................................................................................................................................153
7.1.16 DCNS: recent contract wins ....................................................................................................................153
7.1.17 DCNS: financial analysis .........................................................................................................................155
7.1.18 Kockums: overview .................................................................................................................................157
7.1.19 Kockums: products and services ............................................................................................................157
7.1.20 Kockums: recent announcements and strategic initiatives .....................................................................157
7.1.21 Kockums: alliances ..................................................................................................................................158
7.1.22 Kockums: recent contract wins ...............................................................................................................158
7.1.23 BAE Systems: overview ..........................................................................................................................158
7.1.24 BAE Systems: products and services .....................................................................................................158
7.1.25 BAE Systems: recent announcements and strategic initiatives ..............................................................159
7.1.26 BAE Systems: alliances ..........................................................................................................................159
7.1.27 BAE Systems: recent contract wins ........................................................................................................160
7.1.28 BAE Systems: financial analysis .............................................................................................................161
7.1.29 Mazagon Docks: overview ......................................................................................................................163
7.1.30 Mazagon Docks: products and services .................................................................................................163
7.1.31 Mazagon Docks: recent announcements and strategic initiatives ..........................................................163
7.1.32 Mazagon Docks: alliances.......................................................................................................................163
7.1.33 Mazagon Docks: recent contract wins ....................................................................................................164
7.1.34 Mazagon Docks: financial analysis .........................................................................................................164
7.1.35 Hyundai Heavy Industries: overview .......................................................................................................166
7.1.36 Hyundai Heavy Industries: products and services ..................................................................................166
7.1.37 Hyundai Heavy Industries: recent announcements and strategic initiatives ...........................................166
7.1.38 Hyundai Heavy Industries: alliances .......................................................................................................166
7.1.39 Hyundai Heavy Industries: recent contract wins .....................................................................................167
7.1.40 Hyundai Heavy Industries: financial analysis ..........................................................................................167
7.1.41 Daewoo Shipbuilding & Marine Engineering (DSME): recent announcements and strategic initiatives 169
7.1.42 Daewoo Shipbuilding & Marine Engineering (DSME): recent contract wins ...........................................169
7.1.43 Daewoo Shipbuilding & Marine Engineering (DSME): financial analysis ...............................................170
7.1.44 PO Sevmash: overview ...........................................................................................................................172
7.1.45 PO Sevmash: products and services ......................................................................................................172
7.1.46 PO Sevmash: recent announcements and strategic initiatives ...............................................................172
7.1.47 PO Sevmash: alliances ...........................................................................................................................173
7.1.48 PO Sevmash: recent contract wins .........................................................................................................173
7.1.49 Huntington Ingalls Industries (HII): overview...........................................................................................174
The Global Submarine Market 2014–2024
17
7.1.50 Huntington Ingalls Industries (HII): products and services ......................................................................174
7.1.51 Huntington Ingalls Industries (HII): recent announcements and strategic initiatives ..............................174
7.1.52 Huntington Ingalls Industries (HII): alliances ...........................................................................................175
7.1.53 Huntington Ingalls Industries (HII): recent contract wins .........................................................................175
7.1.54 Huntington Ingalls Industries (HII): financial analysis .............................................................................176
7.1.55 General Dynamics Electric Boat Corp.: overview ...................................................................................178
7.1.56 General Dynamics Electric Boat Corp.: products and services ..............................................................178
7.1.57 General Dynamics Electric Boat Corp.: recent announcements and strategic initiatives .......................178
7.1.58 General Dynamics Electric Boat Corp.: alliances ...................................................................................179
7.1.59 General Dynamics Electric Boat Corp.: recent contract wins .................................................................179
7.1.60 Admiralty Shipyards: overview ................................................................................................................181
7.1.61 Admiralty Shipyards: products and services ...........................................................................................181
7.1.62 Admiralty Shipyards: recent announcements and strategic initiatives ....................................................181
7.1.63 Admiralty Shipyards: recent contract wins ..............................................................................................182
7.1.64 ThyssenKrupp Marine Systems AG: overview ........................................................................................182
7.1.65 ThyssenKrupp Marine Systems AG: products and services ...................................................................182
7.1.66 ThyssenKrupp Marine Systems AG: recent announcements and strategic initiatives............................183
7.1.67 ThyssenKrupp Marine Systems AG: alliances ........................................................................................183
7.1.68 ThyssenKrupp Marine Systems AG: recent contract wins ......................................................................184
7.1.69 ASC Pty Ltd: overview .............................................................................................................................184
7.1.70 ASC Pty Ltd: products and services ........................................................................................................185
7.1.71 ASC Pty Ltd: recent announcements and strategic initiatives ................................................................185
7.1.72 ASC Pty Ltd: alliances .............................................................................................................................185
7.1.73 ASC Pty Ltd: recent contract wins ...........................................................................................................186
7.1.74 ASC Pty Ltd: financial analysis ...............................................................................................................187
7.1.75 Golcuk Naval Shipyard: overview ...........................................................................................................189
7.1.76 Golcuk Naval Shipyard: products and services.......................................................................................189
7.1.77 Golcuk Naval Shipyard: recent announcements and strategic initiatives ...............................................189
7.1.78 Mitsubishi Heavy Industries (MHI): overview ..........................................................................................189
7.1.79 Mitsubishi Heavy Industries (MHI): products and services .....................................................................189
7.1.80 Mitsubishi Heavy Industries (MHI): recent announcements and strategic initiatives ..............................190
7.1.81 Mitsubishi Heavy Industries (MHI): alliances ..........................................................................................190
7.1.82 Mitsubishi Heavy Industries (MHI): recent contract wins ........................................................................190
7.1.83 Mitsubishi Heavy Industries (MHI): financial analysis .............................................................................191
7.1.84 Kawasaki Shipbuilding Corporation: overview ........................................................................................193
7.1.85 Kawasaki Shipbuilding Corporation: products and services ...................................................................193
7.1.86 Kawasaki Shipbuilding Corporation: recent announcements and strategic initiatives ............................193

The Global Submarine Market 2014–2024
18
7.1.87 Kawasaki Shipbuilding Corporation: alliances ........................................................................................194
7.1.88 Kawasaki Shipbuilding Corporation: recent contract wins ......................................................................194
7.1.89 Saab: overview ........................................................................................................................................194
7.1.90 Saab: products and services ...................................................................................................................195
7.1.91 Saab: recent announcements and strategic initiatives ............................................................................195
7.1.92 Saab: alliances ........................................................................................................................................196
7.1.93 Saab: recent contract wins ......................................................................................................................196
7.1.94 Saab: financial analysis ...........................................................................................................................197
7.1.95 Thales: overview .....................................................................................................................................199
7.1.96 Thales: products and services ................................................................................................................199
7.1.97 Thales: recent announcements and strategic initiatives .........................................................................199
7.1.98 Thales: alliances ......................................................................................................................................200
7.1.99 Thales: recent contract wins ...................................................................................................................200
7.1.100 Thales: financial analysis ........................................................................................................................202
7.1.101 Lockheed Martin Corp.: overview ............................................................................................................204
7.1.102 Lockheed Martin Corp.: products and services .......................................................................................204
7.1.103 Lockheed Martin Corp.: recent news and strategic initiatives .................................................................204
7.1.104 Lockheed Martin Corp.: alliances ............................................................................................................205
7.1.105 Lockheed Martin Corp.: recent contract wins ..........................................................................................206
7.1.106 Lockheed Martin Corp.: financial analysis ...............................................................................................208
8 Appendix ............................................................................................................................ 210
8.1 Methodology ................................................................................................................................. 210
8.2 About SDI ..................................................................................................................................... 210
8.3 Disclaimer .................................................................................................................................... 210

The Global Submarine Market 2014–2024
19
LIST OF FIGURES
Figure 1: Global Submarine Market (US$ Billion), 2014–2024 ............................................................................................................................ 19 Figure 2: Submarine Market Breakdown by Region (%), 2014–2024 .................................................................................................................. 21 Figure 3: North American Submarine Market (US$ Billion), 2014–2024 .............................................................................................................. 23 Figure 4: Asia-Pacific Submarine Market (US$ Billion), 2014-2024 ..................................................................................................................... 25 Figure 5: European Submarine Market (US$ Billion), 2014–2024 ....................................................................................................................... 27 Figure 6: Latin American Submarine Market (US$ Million), 2014–2024 .............................................................................................................. 29 Figure 7: African Submarine Market (US$ Million), 2014-2024 ............................................................................................................................ 30 Figure 8: Middle East Submarine Market (US$ Million), 2014–2024.................................................................................................................... 31 Figure 9: Submarine Market Breakdown by Segment (%), 2014–2024 ............................................................................................................... 33 Figure 10: SSN Market Size (US$ Billion), 2014–2024 ....................................................................................................................................... 33 Figure 11: SSK Market Size (US$ Billion), 2014–2024 ........................................................................................................................................ 34 Figure 12: SSBN Market Size (US$ Billion), 2014–2024 ..................................................................................................................................... 35 Figure 13: Defense Capital Expenditure of Top Three European Defense Spenders (US$ Billion), 2014–2024 .................................................. 38 Figure 14: Defense Capital Expenditure of Top Three Asian Defense Spenders (US$ Billion), 2014–2024 ....................................................... 39 Figure 15: Defense Capital Expenditure of Top North American Defense Spenders (US$ Billion), 2014–2024 ................................................... 40 Figure 16: Defense Capital Expenditure of Top Three South American Defense Spenders ................................................................................ 41 Figure 17: Defense Capital Expenditure of Top Three African Countries (US$ Billion), 2014–2024.................................................................... 42 Figure 18: Defense Capital Expenditure of Top Three Middle Eastern Defense Spenders .................................................................................. 43 Figure 19: Submarine Market in the US (US$ Billion), 2014–2024 ...................................................................................................................... 64 Figure 20: Submarine Market Split By Category in the US (%), 2014–2024 ........................................................................................................ 65 Figure 21: SSN Market Size in the US (US$ Billion), 2014–2024 ........................................................................................................................ 67 Figure 22: SSBN Market Size in the US (US$ Billion), 2014–2024 ...................................................................................................................... 69 Figure 23: Submarine Market in the UK (US$ Billion), 2014–2024 ...................................................................................................................... 71 Figure 24: Submarine Market Split By Category in the UK (%), 2014–2024 ........................................................................................................ 72 Figure 25: SSBN Market Size in the UK (US$ Billion), 2014–2024 ...................................................................................................................... 74 Figure 26: SSN Market Size in the US (US$ Billion), 2014–2024 ........................................................................................................................ 75 Figure 27: Submarine Market in Russia (US$ Billion), 2014–2024 ...................................................................................................................... 77 Figure 28: Submarine Market Split By Category in Russia (%), 2014–2024 ........................................................................................................ 78 Figure 29: SSN Market Size in Russia (US$ Million), 2014–2024 ....................................................................................................................... 80 Figure 30: SSBN Market Size in Russia (US$ Million), 2014–2024 ..................................................................................................................... 82 Figure 31:SSK Market Size in Russia (US$ Million), 2014–2024 ......................................................................................................................... 84 Figure 32: Submarine Market in France (US$ million), 2014–2024 ..................................................................................................................... 86 Figure 33: SSN Market Size in France (US$ Million), 2014–2024 ....................................................................................................................... 87 Figure 34: Submarine Market in China (US$ Billion), 2014-2024 ........................................................................................................................ 89 Figure 35: Submarine Market Split by Sector in China (%), 2014-2024 ............................................................................................................... 90 Figure 36: SSBN Market Size in China (US$ Million), 2014-2024 ....................................................................................................................... 92 Figure 37: SSN Market Size in China (US$ Million), 2014-2024 .......................................................................................................................... 93 Figure 38: SSK Market Size in China (US$ Million), 2014-2024 .......................................................................................................................... 95 Figure 39: Submarine Market in India (US$ Billion), 2014-2024 .......................................................................................................................... 97 Figure 40: Submarine Market Split by Sector in India (%), 2014-2024 ................................................................................................................ 98 Figure 41: SSK Market Size in India (US$ Million), 2014-2024.......................................................................................................................... 100 Figure 42: SSBN Market Size in India (US$ Million), 2014-2024 ....................................................................................................................... 101 Figure 43: SSN Market Size in India (US$ Million), 2014-2024 ......................................................................................................................... 102 Figure 44: Submarine Market in Australia (US$ Million), 2014-2024 ................................................................................................................. 104 Figure 45: SSK Market Size in Australia (US$ Million), 2014-2024 ................................................................................................................... 105 Figure 46: Submarine Market in Saudi Arabia (US$ Million), 2014–2024 .......................................................................................................... 107 Figure 47: SSK Market Size in Saudi Arabia (US$ Million), 2014–2024 ............................................................................................................ 108 Figure 48: Submarine Market in Israel (US$ Million), 2014–2024 ...................................................................................................................... 110 Figure 49: SSK Market Size in Israel (US$ Million), 2014–2024 ........................................................................................................................ 111 Figure 50: Submarine Market in Brazil (US$ Million), 2014–2024 ..................................................................................................................... 113 Figure 51: Submarine Market Split by Sector in Brazil (%), 2014–2024 ............................................................................................................ 114 Figure 52: SSK Market Size in Brazil (US$ Million), 2014–2024 ........................................................................................................................ 115 Figure 53: SSN Market Size in Brazil (US$ Million), 2014–2024 ....................................................................................................................... 116 Figure 54: Submarine Market in Argentina (US$ Million), 2014–2024 ............................................................................................................... 118

The Global Submarine Market 2014–2024
20
Figure 55: SSN Market Size in Argentina (US$ Million), 2014–2024 ................................................................................................................. 119 Figure 56: Submarine Market in Egypt (US$ Million), 2014-2024 ...................................................................................................................... 121 Figure 57: SSK Market Size in Egypt (US$ Million), 2014-2024 ........................................................................................................................ 122 Figure 58: Submarine Market in Algeria (US$ Million), 2014-2024 .................................................................................................................... 124 Figure 59: SSK Market Size in Algeria (US$ Million), 2014-2024 ...................................................................................................................... 125 Figure 60: Fincantieri - Revenue Trend Analysis (Euro Million), CY2009–2013................................................................................................. 149 Figure 61: Fincantieri - Operating Profit Trend Analysis (Euro Million), CY2009–2013 ..................................................................................... 150 Figure 62: Fincantieri - Net Profit Trend Analysis (Euro Million), CY2009-2013 ................................................................................................ 150 Figure 63: DCNS - Revenue Trend Analysis (EUR Billion), CY2009–2013 ....................................................................................................... 155 Figure 64: DCNS - Operating Profit Trend Analysis (EUR Million), CY2009–2013 ........................................................................................... 156 Figure 65: DCNS - Net Income Trend Analysis (EUR Million), CY2009–2013 .................................................................................................. 156 Figure 66: BAE Systems - Revenue Trend Analysis (GBP Billion), CY2009-2013 ............................................................................................. 161 Figure 67: BAE Systems - Operating Profit Trend Analysis (GBP Billion), CY2009–2013 ................................................................................. 162 Figure 68: BAE Systems - Net Profit Trend Analysis (GBP Million), CY2009-2013 ........................................................................................... 162 Figure 69: Mazagon Docks - Revenue Trend Analysis (Rs Billion), FY2009-2012 ............................................................................................ 164 Figure 70: Mazagon Docks - Operating Profit Trend Analysis (Rs Billion), FY2009–2012 ................................................................................. 165 Figure 71: Mazagon Docks - Net Profit Trend Analysis (Rs Billion), FY2009-2012 ............................................................................................ 165 Figure 72: Hyundai Heavy Industries - Revenue Trend Analysis (KRW Billion), FY2010–2012 ......................................................................... 167 Figure 73: Hyundai Heavy Industries - Operating Profit Trend Analysis (KRW Billion), FY2010–2012 ............................................................. 168 Figure 74: Hyundai Heavy Industries - Net Profit Trend Analysis (KRW Billion), FY2010-2012 ........................................................................ 168 Figure 75: Daewoo Shipbuilding & Marine Engineering (DSME): Revenue Trend Analysis (US$ Billion), FY2009–2013 .................................. 170 Figure 76: Daewoo Shipbuilding & Marine Engineering (DSME): Operating Profit Trend Analysis (US$ Billion), FY2009–2013 ........................ 171 Figure 77: Daewoo Shipbuilding & Marine Engineering (DSME): Net Profit Trend Analysis (US$ Billion), FY2009-2013 .................................. 171 Figure 78: Huntington Ingalls Industries (HII): Revenue Trend Analysis (US$ Million), FY2009–2013 ............................................................... 176 Figure 79: Huntington Ingalls Industries (HII): Operating Profit Trend Analysis (US$ Million), FY2009–2013 .................................................... 177 Figure 80: Huntington Ingalls Industries (HII): Net Profit Trend Analysis (US$ Million), FY2009–2013 .............................................................. 177 Figure 81: ASC Pty Ltd - Revenue Trend Analysis (US$ Million), FY2009–2013 ............................................................................................... 187 Figure 82: ASC Pty Ltd - Operating Profit Trend Analysis (US$ Million), FY2009–2013 ................................................................................... 188 Figure 83: ASC Pty Ltd - Net Profit Trend Analysis (US$ Million), FY2009-2013 .............................................................................................. 188 Figure 84: Mitsubishi Heavy Industries (MHI) - Revenue Trend Analysis (JPY Billion), 2009–2013 ................................................................... 191 Figure 85: Mitsubishi Heavy Industries (MHI) - Operating Profit Trend Analysis (JPY Billion), FY2010–2014 .................................................... 192 Figure 86: Mitsubishi Heavy Industries (MHI) - Net Profit Trend Analysis (JPY Billion), FY2010–2014 .............................................................. 192 Figure 87: Saab - Revenue Trend Analysis (SEK Billion), FY2009–2013 .......................................................................................................... 197 Figure 88: Saab - Operating Profit Trend Analysis (SEK Million), FY2009–2013 ............................................................................................... 198 Figure 89: Saab - Net Profit Trend Analysis (SEK Million), FY2009–2013 ......................................................................................................... 198 Figure 90: Thales - Revenue Trend Analysis (US$ Billion), FY2009–2013 ........................................................................................................ 202 Figure 91: Thales - Operating Profit Trend Analysis (EUR Million), FY2009–2013 ............................................................................................ 203 Figure 92: Thales - Net Profit Trend Analysis (EUR Million), FY2009–2013 ...................................................................................................... 203 Figure 93: Lockheed Martin Corp. - Revenue Trend Analysis (US$ Billion), FY2009–FY2013 .......................................................................... 208 Figure 94: Lockheed Martin Corp. - Operating Profit Trend Analysis (US$ Billion), FY2009–FY2013 ................................................................ 209 Figure 95: Lockheed Martin Corp. - Net Profit Trend Analysis (US$ Billion), FY2009–FY2013 .......................................................................... 209

The Global Submarine Market 2014–2024
21
LIST OF TABLES
Table 1: Global Submarine Market Overview ...................................................................................................................................................... 20 Table 2: Global Submarine Market Overview ...................................................................................................................................................... 32 Table 3: SWOT Analysis of the Submarine market ............................................................................................................................................. 54 Table 4: Leading Submarine Markets and Top Segments ................................................................................................................................... 62 Table 5: US Submarine Market Overview ........................................................................................................................................................... 63 Table 6: Key Submarine Programs ..................................................................................................................................................................... 64 Table 7: The UK Submarine Market Overview .................................................................................................................................................... 71 Table 8: Key UK Submarine Programs ............................................................................................................................................................... 72 Table 9: Russian Submarine Market Overview ................................................................................................................................................... 77 Table 10: Key Russian Submarine Programs ..................................................................................................................................................... 78 Table 11: French Submarine Market Overview ................................................................................................................................................... 85 Table 12: Major French Submarine Programs .................................................................................................................................................... 86 Table 13: Chinese Submarine Market Overview ................................................................................................................................................. 89 Table 14: Key Chinese Submarine Programs ..................................................................................................................................................... 90 Table 15: Indian Submarine Market Overview .................................................................................................................................................... 96 Table 16: Key Indian Submarine Programs......................................................................................................................................................... 97 Table 17: Australian Submarine Market Overview ............................................................................................................................................ 103 Table 18: Key Australian Submarine Programs................................................................................................................................................. 104 Table 19: Saudi Arabian Submarine Market Overview ...................................................................................................................................... 106 Table 20: Israeli Submarine Market Overview ................................................................................................................................................... 109 Table 21: Brazilian Submarine Market Overview ............................................................................................................................................... 112 Table 22: Key Submarine Programs ................................................................................................................................................................. 113 Table 23: Argentina Submarine Market Overview ............................................................................................................................................. 117 Table 24: Major Argentine Submarine Programs .............................................................................................................................................. 117 Table 25: Egyptian Submarine Market Overview .............................................................................................................................................. 120 Table 26: Algerian Submarine Market Overview ............................................................................................................................................... 123 Table 27: Program Details – SSBN (X) ............................................................................................................................................................. 126 Table 28: Program Details – Successor ............................................................................................................................................................ 128 Table 29: Program Details – Borei-Class .......................................................................................................................................................... 129 Table 30: Program Details – Jin (Type 094) ...................................................................................................................................................... 130 Table 31: Program Details – Arihant-Class ....................................................................................................................................................... 131 Table 32: Program Details – Virginia Class ....................................................................................................................................................... 132 Table 33: Program Details – Astute-Class ........................................................................................................................................................ 134 Table 34: Program Details – Barracuda Class .................................................................................................................................................. 135 Table 35: Program Details – Type 095 .............................................................................................................................................................. 136 Table 36: Program Details – Yasen-Class ........................................................................................................................................................ 137 Table 37: Program Details –Scorpene Class .................................................................................................................................................... 138 Table 38: Program Details – U-214 ................................................................................................................................................................... 139 Table 39: Program Details – Soryu-Class ......................................................................................................................................................... 140 Table 40: Program Details – SEA 1000 Future Submarine Project ................................................................................................................... 141 Table 41: Program Details – Project–75 (I) ....................................................................................................................................................... 142 Table 42: Program Details – Yuan-Class (Type 041) ........................................................................................................................................ 143 Table 43: Competitive Landscape – Global Submarines ................................................................................................................................... 145 Table 44: Navantia SA.: Alliances ..................................................................................................................................................................... 146 Table 45: Navantia SA.: Recent Contract Wins ................................................................................................................................................. 147 Table 46: Fincantieri.: Alliances ........................................................................................................................................................................ 148 Table 47: Fincantieri.: Recent Contract Wins .................................................................................................................................................... 148 Table 48: DCNS: Alliances ............................................................................................................................................................................... 153 Table 49: DCNS: Recent Contract Wins ........................................................................................................................................................... 153 Table 50: Kockums: Alliances ........................................................................................................................................................................... 158 Table 51: Kockums: Recent Contract Wins ....................................................................................................................................................... 158 Table 52: BAE Systems: Alliances .................................................................................................................................................................... 159 Table 53: BAE Systems: Recent Contract Wins ................................................................................................................................................ 160 Table 54: Mazagon Docks: Alliances ................................................................................................................................................................ 163

The Global Submarine Market 2014–2024
22
Table 55: Mazagon Docks: Recent Contract Wins ............................................................................................................................................ 164 Table 56: Hyundai Heavy Industries: Alliances ................................................................................................................................................. 166 Table 57: Hyundai Heavy Industries: Recent Contract Wins ............................................................................................................................. 167 Table 58:Daewoo Shipbuilding & Marine Engineering (DSME): Recent Contract Wins ..................................................................................... 169 Table 59: PO Sevmash: Alliances ..................................................................................................................................................................... 173 Table 60:PO Sevmash: Recent Contract Wins.................................................................................................................................................. 173 Table 61: Huntington Ingalls Industries (HII): Alliances ..................................................................................................................................... 175 Table 62:Huntington Ingalls Industries (HII): Recent Contract Wins .................................................................................................................. 175 Table 63: General Dynamics Electric Boat Corp.: Alliances .............................................................................................................................. 179 Table 64:General Dynamics Electric Boat Corp.: Recent Contract Wins ........................................................................................................... 179 Table 65:Admiralty Shipyards: Recent Contract Wins ....................................................................................................................................... 182 Table 66: ThyssenKrupp Marine Systems AG: Alliances .................................................................................................................................. 183 Table 67:ThyssenKrupp Marine Systems AG: Recent Contract Wins ............................................................................................................... 184 Table 65: ASC Pty Ltd: Alliances ...................................................................................................................................................................... 185 Table 66 ASC Pty Ltd: Recent Contract Wins ................................................................................................................................................... 186 Table 67 Mitsubishi Heavy Industries: Alliances ................................................................................................................................................ 190 Table 68 Mitsubishi Heavy Industries: Recent Contract Wins ........................................................................................................................... 190 Table 69: Saab: Alliances ................................................................................................................................................................................. 196 Table 70: Saab: Recent Contract Wins ............................................................................................................................................................. 196 Table 71: Thales: Alliances ............................................................................................................................................................................... 200 Table 72: Thales: Recent Contract Wins ........................................................................................................................................................... 200 Table 73: Lockheed Martin Corp. - Alliances ..................................................................................................................................................... 205 Table 74: Lockheed Martin Corp. - Recent Contract Wins................................................................................................................................. 206