The global risks barometer - Department of Statisticsaldous/Real-World/barometers-2011.pdf ·...
38
1 | Global Risks 2011 Drivers that increase risk Drivers that could both increase or reduce risk Drivers that reduce risk The symbols in the “Drivers and indicators” denote the following The global risks barometer The global risks barometer assesses the influencing factors, global impact and risk perceptions of the 37 risks in the five risk categories: economic, geopolitical, societal, environmental and technological at a global level. In Global Risks 2011, Sixth Edition, the influencing factors and global impact have been generated and refined though the 18 workshops with experts in each risk category. The risk perception characteristics, which include key interconnections, likelihood, severity, and variation in perception and confidence level are data extracted from the Global Risks Survey 2010. The barometer is designed to trigger discussions on global risks at multiple levels: at an individual risk level to understand the factors that influence the risk and its consequences described as global impact, in relationship with the highly interconnected risks to understand the directionality and the feedback loop with other risks, and at a systemic level as it has been illustrated in the Global Risk Landscape. The barometer is a living document for several reasons. First, the risks that have been captured at a global level do not necessarily play out at a local level in a similar manner hence there is a need for further discussion. Second, the risk characteristics evolve as the world moves on. Lastly, there are many interpretations on how the risks may be influenced and impacted; hence there is a broader need to continually improve the work. Readers are encouraged to provide constructive contribution to further elaborate this living document that will feed into future Global Risks reports.
Transcript of The global risks barometer - Department of Statisticsaldous/Real-World/barometers-2011.pdf ·...

1 | Global Risks 2011
Drivers that increase risk Drivers that could both increase or reduce risk
Drivers that reduce risk
The symbols in the “Drivers and indicators” denote the following
The global risks barometer
The global risks barometer assesses the influencing factors, global impact and risk perceptions of the 37 risks in the five risk categories: economic, geopolitical, societal, environmental and technological at a global level. In Global Risks 2011, Sixth Edition, the influencing factors and global impact have been generated and refined though the 18 workshops with experts in each risk category. The risk perception characteristics, which include key interconnections, likelihood, severity, and variation in perception and confidence level are data extracted from the Global Risks Survey 2010.
The barometer is designed to trigger discussions on global risks at multiple levels: at an individual risk level to understand the factors that influence the risk and its consequences described as global impact, in relationship with the highly interconnected risks to understand the directionality and the feedback loop with other risks, and at a systemic level as it has been illustrated in the Global Risk Landscape.
The barometer is a living document for several reasons. First, the risks that have been captured at a global level do not necessarily play out at a local level in a similar manner hence there is a need for further discussion. Second, the risk characteristics evolve as the world moves on. Lastly, there are many interpretations on how the risks may be influenced and impacted; hence there is a broader need to continually improve the work. Readers are encouraged to provide constructive contribution to further elaborate this living document that will feed into future Global Risks reports.

2 | Global Risks 2011
Drivers that increase risk Drivers that could both increase or reduce risk
Drivers that reduce risk
The symbols in the “Drivers and indicators” denote the following
The global risks barometer
Figure 1
Figure 1
Sharp increase and volatility in the prices of financial assets including mortgages, asset-backed securities and debt instruments
Sharp increase and volatility in prices of real assets (commercial and private real estate)
Excessive capital flows to emerging markets, inducing asset price bubbles
New arbitrage opportunities, causing currency carry trades from low-to high-interest rate countries
Changes in central bank policy frameworks which allocate more weight to overall financial stability rather than just price stability
Policy shifts encouraging domestic consumption and creating further productive investment opportunities in emerging economies
Greater transparency and stronger financial regulation regarding surveillance, capital and liquidity ratios, risk retention and counterparty risk management in over-the-counter derivative markets
Reversals of global economic growth as collapse in asset prices undermines consumer confidence and the allocative efficiency of the financial system (the current financial crisis reduced world output by roughly 2% and contracted advanced economies by roughly 4%).
Possible collapse of banking systems as investors lose trust in financial markets and governance institutions.
Perceived impactin Billion US $
Drivers and indicators Global impact
Asset price collapse
A collapse of real and financial asset prices leads to the destruction of wealth, deleveraging, reduced household spending and impaired aggregate demand.
Perceived likelihoodto occur in the next ten years
low med high
Figure 1Economic Risks

3 | Global Risks 2011
Drivers that increase risk Drivers that could both increase or reduce risk
Drivers that reduce risk
The symbols in the “Drivers and indicators” denote the following
The global risks barometer
Figure 1
Figure 1
Government policies such as price ceilings on food prices, lead to reallocation of production and food shortages
Fluctuating economic growth in emerging market economies
Fluctuations as a function of the global business cycle
Currency devaluation should a number of countries attempt to shift the relative strength of their currencies to spur exports
Climate change and extreme weather events which increase production uncertainty
Retrenchment from globalization, through e.g. protectionist barriers and “resource nationalism” from countries possessing rare metals
Advances in new information and communication technologies that smooth price fluctuations by improving information flow between sellers, buyers and middlemen
Advances in agricultural technologies that create more resilient crops
Advances in financial instruments that allow consumers and producers of commodities to manage better risks associated with volatile production levels
Lower growth as volatility causes uncertainty for investments by individuals and companies (such as farmers and mining companies)
Volatile and rising food prices lead to hunger and malnutrition among the poor where food accounts for a large proportion of household spending or earnings.
The global business cycle may be exacerbated by commodity price fluctuations.
Perceived impactin Billion US $
Drivers and indicators Global impact
Extreme commodity price volatility
Volatile mineral, metal and agricultural commodity prices create uncertainty for governments and business as well as costs for producers and consumers.
Perceived likelihoodto occur in the next ten years
low med high
Economic Risks

4 | Global Risks 2011
Drivers that increase risk Drivers that could both increase or reduce risk
Drivers that reduce risk
The symbols in the “Drivers and indicators” denote the following
The global risks barometer
Figure 1
Figure 1
Aggressive quantitative easing
Volatile commodity prices
Collapse in asset prices leading to widespread failures in the financial sector with attendant recessionary impact
High unemployment rates in combination with large and protracted output gaps
Effective monetary policies that reduce the chance of severe swings towards inflation or deflation
An inflationary spiral could impoverish savers and creditors and have adverse consequences for investment, growth and future prosperity.
A deflationary spiral could foster precautionary spending patterns that may exacerbate recessionary trends.
Perceived impactin Billion US $
Drivers and indicators Global impact
Extreme consumer price volatilityVolatile prices for consumer goods and services distort demand, create uncertainty for governments and business, and increase costs for both producers and consumers.
Perceived likelihoodto occur in the next ten years
low med high
Economic Risks
5 | Global Risks 2011
Drivers that increase risk Drivers that could both increase or reduce risk
Drivers that reduce risk
The symbols in the “Drivers and indicators” denote the following
The global risks barometer
Figure 1
Figure 1
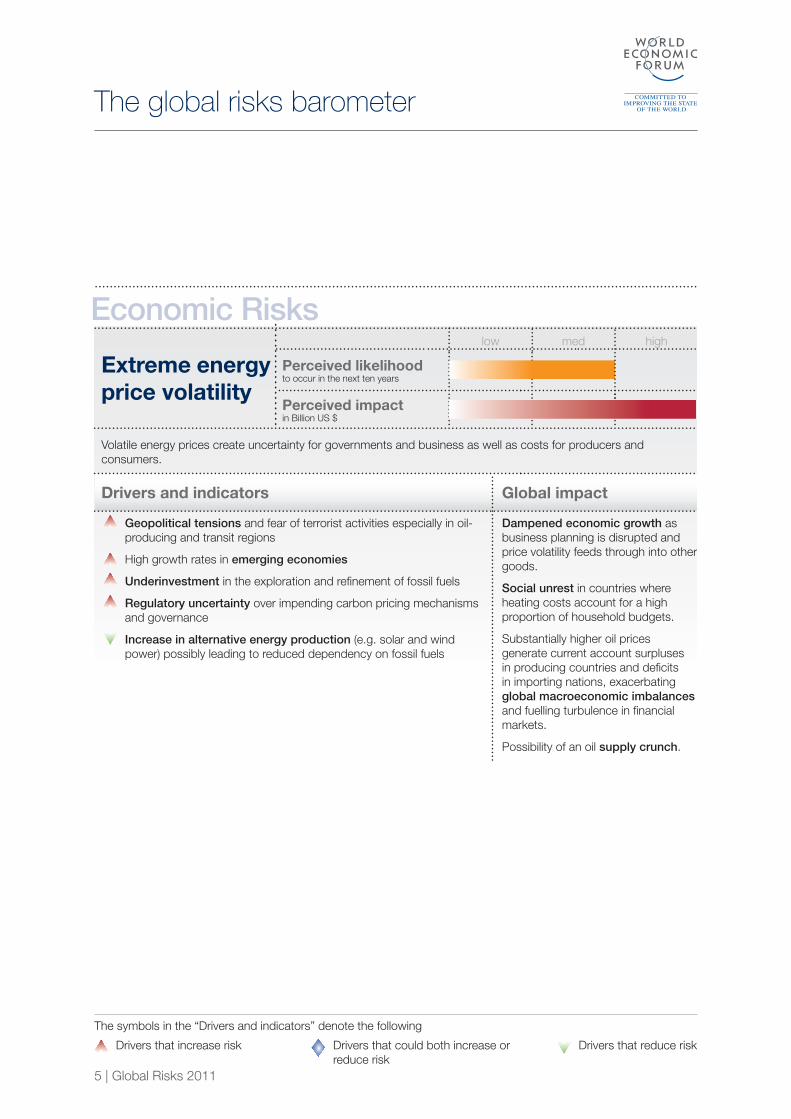
Geopolitical tensions and fear of terrorist activities especially in oil-producing and transit regions
High growth rates in emerging economies
Underinvestment in the exploration and refinement of fossil fuels
Regulatory uncertainty over impending carbon pricing mechanisms and governance
Increase in alternative energy production (e.g. solar and wind power) possibly leading to reduced dependency on fossil fuels
Dampened economic growth as business planning is disrupted and price volatility feeds through into other goods.
Social unrest in countries where heating costs account for a high proportion of household budgets.
Substantially higher oil prices generate current account surpluses in producing countries and deficits in importing nations, exacerbating global macroeconomic imbalances and fuelling turbulence in financial markets.
Possibility of an oil supply crunch.
Perceived impactin Billion US $
Drivers and indicators Global impact
Extreme energy price volatility
Volatile energy prices create uncertainty for governments and business as well as costs for producers and consumers.
Perceived likelihoodto occur in the next ten years
low med high
Economic Risks

6 | Global Risks 2011
Drivers that increase risk Drivers that could both increase or reduce risk
Drivers that reduce risk
The symbols in the “Drivers and indicators” denote the following
The global risks barometer
Figure 1
Figure 1
Rising debt levels and fiscal deficits in advanced economies
Rising market interest rates
Increasing dependency ratios and demographic challenges (for example due to ageing in advanced economies)
Clear exit strategies on behalf of governments holding high and rising levels of debt
Persistently high rates of inflation
Social security and healthcare systems reform to a sustainable level while providing necessary level of social safety net
High government debt-to-GDP ratios stifle economic growth and exert upward pressure on real interest rates.
In highly indebted economies, spreads on government bonds may rise significantly, exacerbating sovereign debt crises, particularly in some OECD countries.
Sovereign debt crises in Eurozone countries threaten European economic integration, with negative impacts on other blocs considering currency unions and the potential to precipitate wider retreats from globalization.
Fiscal austerity leads to cutbacks in innovation and education programmes with long-term opportunity costs.
Potential for social unrest and political instability resulting from the breakdown of social safety nets.
Perceived impactin Billion US $
Drivers and indicators Global impact
Fiscal crises
Excessive debt burdens generate rising interest rates, inflation pressures and sovereign debt crises.
Perceived likelihoodto occur in the next ten years
low med high
Economic Risks

7 | Global Risks 2011
Drivers that increase risk Drivers that could both increase or reduce risk
Drivers that reduce risk
The symbols in the “Drivers and indicators” denote the following
The global risks barometer
Figure 1
Increase in the absolute size of current account imbalances
Substantial changes in the conduct of monetary policy such as quantitative easing
Competitive devaluations of currencies
High number of potentially misaligned currency pegs maintained
Continued reliance on the US dollar despite its loss in value due to no other alternative international settlement currency, particularly in the context of a disruption in the Euro
Extent to which debtor countries are able to address fiscal challenges and surplus countries are able to balance consumption with savings
Meaningful growth policies that change the incentives for the use of income in both deficit and surplus countries so as to reduce imbalances
The correction of global imbalances typically comes at the price of sharp income contractions and adverse foreign exchange developments in deficit countries.
Currency volatility adversely affects trade and may lead to an increase in protectionist measures, retrenchment from globalization and additional global governance failures.
Running sustained and large current account deficits requires capital inflows on the part of deficit countries. This implies an increase in public debt when accompanied by fiscal deficits, leading potentially to fiscal crises.
Perceived impactin Billion US $
Drivers and indicators Global impact
Global imbalances and currency volatility
Global savings and investment imbalances foster unsustainable current account imbalances, unsustainable levels of external debt and ultimately wide swings in foreign exchange rates.
Perceived likelihoodto occur in the next ten years
low med high
Economic Risks

8 | Global Risks 2011
Drivers that increase risk Drivers that could both increase or reduce risk
Drivers that reduce risk
The symbols in the “Drivers and indicators” denote the following
The global risks barometer
Figure 1
Figure 1
Constraints on fiscal budgets and decisions to reduce infrastructure spending
Lack of security standards and guidance provided by governments to address vulnerability of critical information infrastructure and power grids to attempted attacks
Increasing capacity and inclination of terrorist networks to target infrastructure for political objectives
Population growth and urbanization increasingly putting stress on existing infrastructure
Increases in access to credit by the private sector to finance large infrastructure projects
International cooperation on regionally facing critical infrastructure
Increased transaction costs and disruption to business caused by inadequate or failing infrastructure.
Unsustainable demand for natural resources and associated damage to the environment caused by inefficient distribution of water, energy and sanitation services.
Domino effects from interdependencies of critical infrastructure, intensifying crisis situations.
Perceived impactin Billion US $
Drivers and indicators Global impact
Infrastructure fragility
The failure to adequately invest in, upgrade and secure infrastructure networks severely hinders growth and development, and reduces the resilience of infrastructure networks to endogenous or exogenous shocks.
Perceived likelihoodto occur in the next ten years
low med high
Economic Risks

9 | Global Risks 2011
Drivers that increase risk Drivers that could both increase or reduce risk
Drivers that reduce risk
The symbols in the “Drivers and indicators” denote the following
The global risks barometer
Figure 1
Figure 1
Lack of availability of credit leading to credit rationing
Negative financial conditions both in deposit-taking banks and the shadow banking (non-bank) sector, including deteriorating capital ratios and asset impairments
New regulations which successfully address moral hazard and conflicts of interest in the financial system
Consistently low interest rates, guarantees and other measures which encourage inter-bank lending
Collapse of asset prices, including financial assets and real estate, leading to a sharp and protracted recession.
Perceived impactin Billion US $
Drivers and indicators Global impact
Liquidity/credit crunch
Reductions in the availability of liquidity, loans and credit from banks and capital markets increase borrowing costs for governments, businesses and consumers, deter investment and negatively impact financial markets and economic activity.
Perceived likelihoodto occur in the next ten years
low med high
Economic Risks

10 | Global Risks 2011
Drivers that increase risk Drivers that could both increase or reduce risk
Drivers that reduce risk
The symbols in the “Drivers and indicators” denote the following
The global risks barometer
Figure 1
Impact of interest groups on regulatory process in the form of short-term responses to structural challenges
Commitment to multistakeholder and international dialogue on regulatory challenges with a focus on understanding opposing incentives and conflicting perspectives
Higher levels of effective coordination among national regulators
Distortions to capital allocation and/or increased costs of doing business, leading to reduced profitability and higher product prices.
Increased risk of failure of international structures such as the G20 with knock-on geo-economic and geopolitical effects.
Perceived impactin Billion US $
Drivers and indicators Global impact
Regulatory failures
Inadequate, fragmented or obsolete regulations, institutions or reforms negatively impact industry structures, capital flows and market competition, constraining both investment and innovation, and the effectiveness of international cooperation.
Perceived likelihoodto occur in the next ten years
low med high
Economic Risks

11 | Global Risks 2011
Drivers that increase risk Drivers that could both increase or reduce risk
Drivers that reduce risk
The symbols in the “Drivers and indicators” denote the following
The global risks barometer
Figure 1
Implementation of implicit and explicit trade barriers through tariffs, subsidies, national content requirements, etc.
Increasing populist politics fed by slow growth and high levels of unemployment
Increased hurdles to cross-border migration
Tangible progress in international trade negotiations such as the Doha Round
Successful negotiations in bilateral and regional trade agreements
Declines in global trade and the efficiency of global capital markets lead to decreases in innovation and economic growth.
Welfare losses and higher levels of poverty globally.
Perceived impactin Billion US $
Drivers and indicators Global impact
Retrenchment from globalization
Economies adopt policies that create barriers to flows of goods, capital and labour, while failing to engage with multilateral governance structures to address global challenges.
Perceived likelihoodto occur in the next ten years
low med high
Economic Risks

12 | Global Risks 2011
Drivers that increase risk Drivers that could both increase or reduce risk
Drivers that reduce risk
The symbols in the “Drivers and indicators” denote the following
The global risks barometer
Figure 1
Social unrest
Excessive savings and investment into unproductive assets
Demographic pressures due to China’s ageing population
Chinese government’s ability to maintain political stability in the wake of loss in growth momentum
Chinese government’s success in maintaining stable renminbi in the wake of loss in export momentum
Adverse effects on global capital and commodity markets could foster a reversal in globalization, as China is a large importer of commodities from other emerging market countries. Its reserves are invested abroad (predominantly in US government bonds) and it has a sizeable presence in other countries through direct investments in land and commodity producers and through development aid.
Bursting of an investment-driven, large-scale infrastructure and construction projects bubble.
Socio-economic unrest due to rising unemployment rates.
Perceived impactin Billion US $
Drivers and indicators Global impact
Slowing Chinese economy (<6%)
China’s growth slows to 6% or less.
Perceived likelihoodto occur in the next ten years
low med high
Economic Risks

13 | Global Risks 2011
Drivers that increase risk Drivers that could both increase or reduce risk
Drivers that reduce risk
The symbols in the “Drivers and indicators” denote the following
The global risks barometer
Figure 1
Institutional weakness in fragile states
Economic disparity and low wages
Continuing or increasing levels of organized crime and illicit trade
Regulatory and global governance failures
Citizen education and information, including literacy, which increase opportunities for legitimate activities and raise awareness on the impacts of corruption
Increased transparency of global financial flows
Stronger links between international civil society and legal institutions in advanced economies
National laws containing extraterritorial provisions to hold companies liable for corruption, such as the US Foreign Corrupt Practices Act and United Kingdom Anti-Bribery Bill
Increasing private sector engagement and commitment to reduce corruption
Increased transaction costs for businesses, governments and individuals.
Creating barriers to growth by reducing willingness to take business risks and deterring foreign investment.
Reduced levels of citizen trust in government.
Erosion of institutions and civil service functions.
Increasing security concerns for individuals threatened by coercion.
Perceived impactin Billion US $
Drivers and indicators Global impact
Corruption
The abuse of power for personal gain by businesses and public officials undermines the rule of law, governance, investment flows and economic development.
Perceived likelihoodto occur in the next ten years
low med high
Geopolitical Risks
14 | Global Risks 2011
Drivers that increase risk Drivers that could both increase or reduce risk
Drivers that reduce risk
The symbols in the “Drivers and indicators” denote the following
The global risks barometer
Figure 1
Figure 1
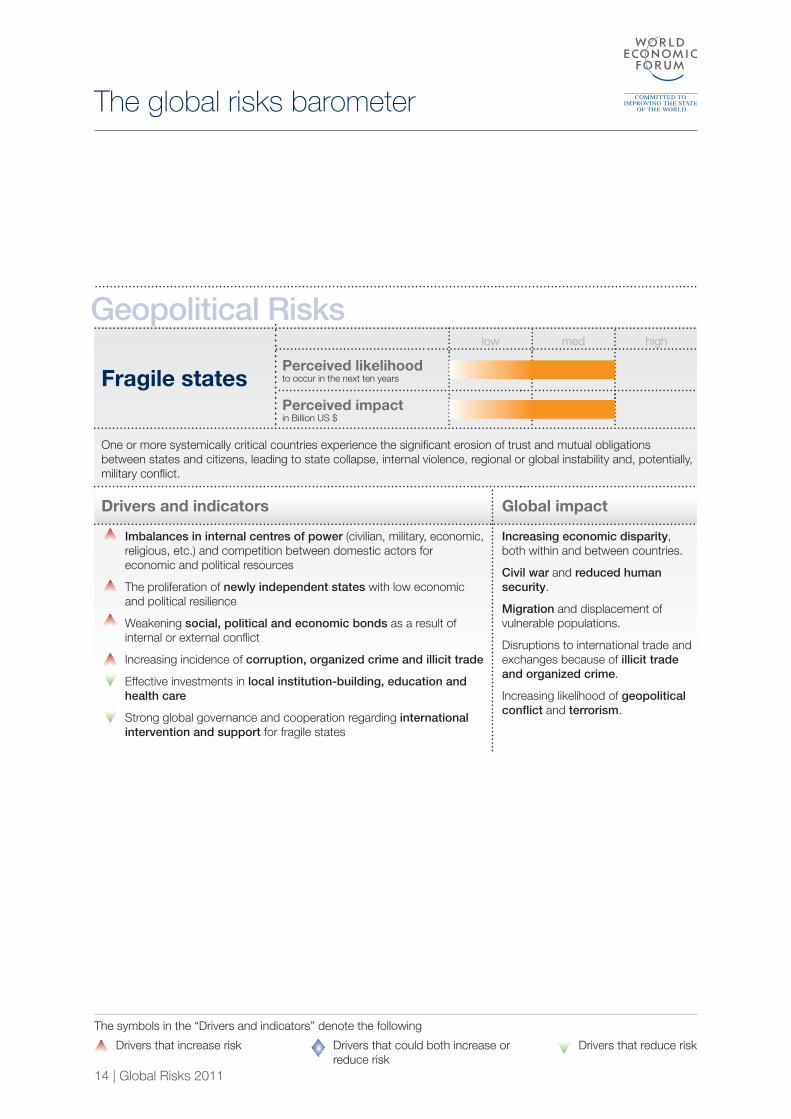
Imbalances in internal centres of power (civilian, military, economic, religious, etc.) and competition between domestic actors for economic and political resources
The proliferation of newly independent states with low economic and political resilience
Weakening social, political and economic bonds as a result of internal or external conflict
Increasing incidence of corruption, organized crime and illicit trade
Effective investments in local institution-building, education and health care
Strong global governance and cooperation regarding international intervention and support for fragile states
Increasing economic disparity, both within and between countries.
Civil war and reduced human security.
Migration and displacement of vulnerable populations.
Disruptions to international trade and exchanges because of illicit trade and organized crime.
Increasing likelihood of geopolitical conflict and terrorism.
Perceived impactin Billion US $
Drivers and indicators Global impact
Fragile states
One or more systemically critical countries experience the significant erosion of trust and mutual obligations between states and citizens, leading to state collapse, internal violence, regional or global instability and, potentially, military conflict.
Perceived likelihoodto occur in the next ten years
low med high
Example of barometer “Fragile states”Geopolitical Risks

15 | Global Risks 2011
Drivers that increase risk Drivers that could both increase or reduce risk
Drivers that reduce risk
The symbols in the “Drivers and indicators” denote the following
The global risks barometer
Figure 1
Figure 1
Rising political populism at the national level
Increased tension over territorial disputes, particularly those linked to access to natural resources or strategic assets
Fragile states which have the potential to fuel regional conflict
Rising tensions in the Middle East and the Korean peninsula
Global governance successes which decrease the likelihood of misunderstandings and miscalculations among states, and increase the potential for dispute resolution
Loss of human lives through warfare.
Loss of property and economic resources, at both personal and national levels through warfare.
Reinforces global governance failures by creating new levels of distrust among nations.
Breaks global trade patterns and may lead to reduced growth at a global level due to protectionist reactions (though national economies may be stimulated through innovation).
Perceived impactin Billion US $
Drivers and indicators Global impact
Geopolitical conflict
Military actions or aggressive foreign or trade policies on the part of global or regional powers disrupt political or social stability, negatively impacting populations, investment and financial markets.
Perceived likelihoodto occur in the next ten years
low med high
Geopolitical Risks

16 | Global Risks 2011
Drivers that increase risk Drivers that could both increase or reduce risk
Drivers that reduce risk
The symbols in the “Drivers and indicators” denote the following
The global risks barometer
Figure 1
Discrepancies in political views, incentives and decision-making systems between advanced and emerging economies
Reluctance of established powers to acknowledge and adjust to the rising power of emerging economies
Increasing interconnectedness and complexity of global risks, which defy traditional governance responses
Disintermediation of traditional forms of leadership and governance through technological and social shifts
Sustained success in implementing global agreements on climate change based on UN mechanisms
Development of a well-informed and well-mobilized global public opinion sharing norms and values of global citizenship
Increased impact and likelihood of other global risks and less-effective global risk response.
Increasing likelihood of geopolitical conflict through reduced means of peaceful settlement.
Reduced global growth and economic inefficiency due to increasing protectionism.
Reduced trust among states by heightening divisions rather than commonalities.
Regulatory arbitrage opportunities.
in Billion US $
Drivers and indicators Global impact
Global governance failures
Weak or inadequate global institutions, agreements or networks, combined with competing national and political interests, impede attempts to cooperate on addressing global risks.
Perceived likelihoodto occur in the next ten years
low med high
Geopolitical Risks

17 | Global Risks 2011
Drivers that increase risk Drivers that could both increase or reduce risk
Drivers that reduce risk
The symbols in the “Drivers and indicators” denote the following
The global risks barometer
Figure 1
State fragility which fosters illicit trade by facilitating the production and export of illicit goods and services
Rising economic disparity which creates incentives for engaging in illicit trade as a source of employment and wealth creation
Global governance failures, particularly in law enforcement, supply-chain security and customs regulations
Increased consumer education and awareness of the aggregate impact of illicit trade
Increasing financial and goods transparency, and tracking
Regulatory and global governance reforms which reduce opportunities for regulatory arbitrage
Legalization and decriminalization that shifts the dynamics of demand and supply of illicit goods
Reduces public and private sector revenues and, in time, innovation, by distorting markets and reducing tax bases.
Stimulates corruption, organized crime and state fragility.
Threatens biodiversity through unregulated activities.
Criminalization/marginalization of segments of the population.
Perceived impact
Drivers and indicators Global impact
Illicit trade
Increases in the illegal trafficking of goods and people cause social, political, economic and environmental harm by increasing the burden on supply chains, exacerbating wealth inequalities and financing destabilizing activities.
Perceived likelihoodto occur in the next ten years
low med high
Geopolitical Risks

18 | Global Risks 2011
Drivers that increase risk Drivers that could both increase or reduce risk
Drivers that reduce risk
The symbols in the “Drivers and indicators” denote the following
The global risks barometer
Figure 1
Figure 1
Weak institutions, attributable to both state fragility and corruption
Rising economic disparity which creates incentives for engaging in organized crime as a source of employment and wealth creation
Global governance failures, particularly in law enforcement and intelligence gathering
Illicit trade activity, which is a primary occupation of organized criminal activities as well as a main source of income
Legalization and decriminalization of illicit goods that alter the flow of goods and financing to organized crime
Increasing financial and goods transparency and tracking
Global cooperation on intelligence-sharing and law enforcement across jurisdictions to identify and prosecute organized criminals
Reduces public and private sector revenues by creating grey and black markets, creating unfair competition, and reducing tax bases.
Negative impacts reduce social stability and security by creating unsafe environments, which in turn deter tourism and investment
Perceived impactin Billion US $
Drivers and indicators Global impact
Organized crime
The unlawful activities of highly organized, disciplined associations weaken state authority, negatively impact investment climates, undermine the rule of law and slow growth.
Perceived likelihoodto occur in the next ten years
low med high
Geopolitical Risks

19 | Global Risks 2011
Drivers that increase risk Drivers that could both increase or reduce risk
Drivers that reduce risk
The symbols in the “Drivers and indicators” denote the following
The global risks barometer
Figure 1
Increasing levels of activity in space make tensions or conflict in space more likely
Rising risks of traditional geopolitical conflict increases the likelihood of conflict spilling over into space
Lack of global governance, in particular related to space technologies and territorial rights
Increasing levels of space debris that make space activities increasingly unsafe
Possible direct impact on traditional geopolitical conflict on Earth due to the intricate nature of state interest on Earth and in space.
Reduced opportunities presented by space as a new avenue for economic and human development by creating extreme uncertainties for investors, public and private.
Human injury and loss of life from attacks from or accidents in space.
Perceived impactin Billion US $
Drivers and indicators Global impact
Space security
The insufficient regulation of commercial and military activity in space jeopardizes potential economic, commercial and technological benefits derived from space exploration and leads to geopolitical tension and confrontation.
Perceived likelihoodto occur in the next ten years
low med high
Geopolitical Risks
20 | Global Risks 2011
Drivers that increase risk Drivers that could both increase or reduce risk
Drivers that reduce risk
The symbols in the “Drivers and indicators” denote the following
The global risks barometer
Figure 1
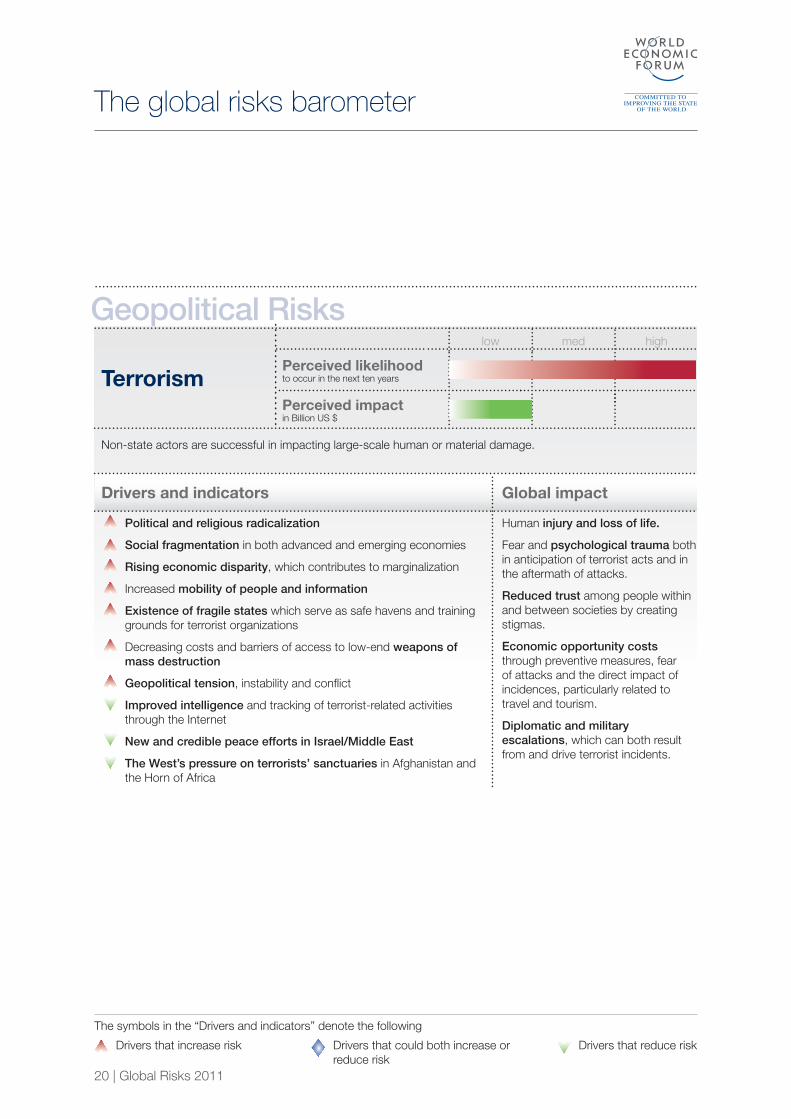
Political and religious radicalization
Social fragmentation in both advanced and emerging economies
Rising economic disparity, which contributes to marginalization
Increased mobility of people and information
Existence of fragile states which serve as safe havens and training grounds for terrorist organizations
Decreasing costs and barriers of access to low-end weapons of mass destruction
Geopolitical tension, instability and conflict
Improved intelligence and tracking of terrorist-related activities through the Internet
New and credible peace efforts in Israel/Middle East
The West’s pressure on terrorists’ sanctuaries in Afghanistan and the Horn of Africa
Human injury and loss of life.
Fear and psychological trauma both in anticipation of terrorist acts and in the aftermath of attacks.
Reduced trust among people within and between societies by creating stigmas.
Economic opportunity costs through preventive measures, fear of attacks and the direct impact of incidences, particularly related to travel and tourism.
Diplomatic and military escalations, which can both result from and drive terrorist incidents.
Perceived impactin Billion US $
Drivers and indicators Global impact
Terrorism
Non-state actors are successful in impacting large-scale human or material damage.
Perceived likelihoodto occur in the next ten years
low med high
Geopolitical Risks

21 | Global Risks 2011
Drivers that increase risk Drivers that could both increase or reduce risk
Drivers that reduce risk
The symbols in the “Drivers and indicators” denote the following
The global risks barometer
Figure 1
Figure 1
Iran’s nuclear ambitions, particularly whether it will test a nuclear device or seek de facto nuclear status with the capability to develop a nuclear device on short notice
Rising demand for nuclear technologies for civilian use, which lower the cost of technologies and increase the risk of misappropriated nuclear material
Rising levels of organized crime, illicit trade and fragile states
Geopolitical conflict and related arms races which increase the demand for nuclear weapons
Technological advances and increasing access to information which lower the cost and difficulties of manufacturing biological and chemical agents
Continued survival of the Non-Proliferation Treaty, bilateral agreements and negotiations designed to limit nuclear technologies
Geopolitical conflict driven by fears of rogue states acquiring WMD capabilities which existentially threaten other nations.
Terrorist attacks with unprecedented consequences because of new capabilities.
Increased need for spending on intelligence and surveillance.
Global power shifts as more countries increase diplomatic bargaining power thanks to the acquisition of WMD capabilities.
Perceived impactin Billion US $
Drivers and indicators Global impact
Weapons of mass destruction
The proliferation of nuclear, chemical, biological and radiological technologies and materials leads to crises.
Perceived likelihoodto occur in the next ten years
low med high
Geopolitical Risks

22 | Global Risks 2011
Drivers that increase risk Drivers that could both increase or reduce risk
Drivers that reduce risk
The symbols in the “Drivers and indicators” denote the following
The global risks barometer
Figure 1
Human activities that release particulate matters, such as the use of fossil fuels
Particulate-releasing natural catastrophes, such as volcanic eruptions and forest fires
Shifts in weather patterns which influence air pollution levels on a local and regional basis
Government policies and regulations controlling pollution and incentivizing businesses and consumers towards greater use of non-polluting energy sources
Technological innovation that contributes to spread of clean energy production and shifts to alternative energy
Detrimental effects on wildlife, vegetation and broader biodiversity and environmental impacts (e.g. acid rain caused by smog and holes in the ozone layer holes, etc.).
Air pollution increases human health hazards such as heart disease and respiratory diseases (e.g. asthma) resulting in loss of life, higher healthcare costs and loss of productivity.
Perceived impactin Billion US $
Drivers and indicators Global impact
Air pollution
Declining air quality due to pollution and climate shifts threatens social stability, health outcomes and economic development.
Perceived likelihoodto occur in the next ten years
low med high
Environmental Risks

23 | Global Risks 2011
Drivers that increase risk Drivers that could both increase or reduce risk
Drivers that reduce risk
The symbols in the “Drivers and indicators” denote the following
The global risks barometer
Figure 1
Figure 1
Population growth and increases in resource-intensive consumption patterns
Continuing deforestation, driven primarily by logging, mining and agricultural land use
Decline in the number of pollinators, such as bees, that contribute to reproduction of many plants
Growth in intensive agriculture and monoculture
Infrastructure development and other investment decisions which can drive either acute destruction and ill-use, or actively improve long-term sustainability of resource use
Conservation and preservation policies which are successfully implemented at local levels to manage the impact of human activity on ecosystems
Legal and economic support to population segments who currently rely on unsustainable land-use practices for survival and income
Increasing levels of awareness of the economic importance of biodiversity, in particular the economic and social value maintained by biodiverse systems and the trade-offs involved in ensuring their continued existence
International agreements which help lower externalities affecting biodiversity and/or prevent unsustainable exploitation of renewable resources
Irreversible environmental damage, including extinction of flora and fauna and shifts in habitat.
Increases in the rate of climate change.
Negative impact on food and water security, as agricultural yields fall and ecosystems supporting water sources are damaged.
Significant economic loss for those who depend on healthy and well functioning ecosystems to generate income (e.g. farmers).
Destabilization of communities and traditional activities which lead to psychological trauma, economic damage, and migration.
Perceived impactin Billion US $
Drivers and indicators Global impact
Biodiversity loss
The degradation of biodiversity in multiple biospheres around the world results in stocks of renewable resources below regenerative capacity and reduced species diversity, with potentially irreversible consequences for the environment and associated industries.
Perceived likelihoodto occur in the next ten years
low med high
Environmental Risks

24 | Global Risks 2011
Drivers that increase risk Drivers that could both increase or reduce risk
Drivers that reduce risk
The symbols in the “Drivers and indicators” denote the following
The global risks barometer
Figure 1
Population growth and increases in resource-intensive consumption patterns
Degree of ocean acidification, which affects the CO2 absorption level in the ocean, drives calcification of organisms and impacts global warming
Extent to which mitigation measures are adopted and rigorously enforced by governments, including international agreements on reducing carbon and other greenhouse gas emissions
Financial innovation in instruments to help spread risk and economic burden of climate change
Technological advances in agriculture to adapt crops to droughts and extreme temperatures
Declining crop yields and risk of starvation, especially in Africa prolonged drought and high temperatures.
Impacts on marine ecosystems of rising temperature and acidification include destruction of coral reefs threatening marine biodiversity.
Economic losses from climate shifts were estimated by the British government at 5-20% of the annual global gross domestic product.
Increase in the spread of infectious diseases, particularly because warmer temperatures allow disease-carrying insects, animals and microbes to survive in areas where they were once contained by cold weather.
Possible unintended consequences from interventions meant to reduce climate change, such as geo-engineering.
Perceived impactin Billion US $
Drivers and indicators Global impact
Climate change
Droughts, extreme temperatures and other chronic weather events caused by climatological shifts cause harm to lives, human health, infrastructure, property, economic activity and the environment.
Perceived likelihoodto occur in the next ten years
low med high
Environmental Risks

25 | Global Risks 2011
Drivers that increase risk Drivers that could both increase or reduce risk
Drivers that reduce risk
The symbols in the “Drivers and indicators” denote the following
The global risks barometer
Figure 1
[Earthquakes and volcanic eruptions themselves are caused by natural geophysical phenomena; these influencing factors address the scale of the impacts]
Increasing population growth and density in disaster-prone areas
Rigour of and compliance with building codes, affecting how buildings and critical infrastructure are able to withstand varying frequencies and durations of earthquakes; encompasses factors such as cost of bringing older buildings up to standard, and quality of materials and workmanship
Effective crisis management capabilities in affected areas. such as resident awareness, rapid response mechanisms, mitigation plans and execution efficiency, (including to secondary effects such as aftershocks, fire, landslides and tsunami)
Advances in technologies that enable more sensitive detection and early warning systems.
Significant economic loss.
Loss of life through immediate trauma and subsequent diseases where infrastructure is chronically affected.
Displacement of people as a consequence of the destruction of residences and businesses.
Interruption to the global logistics and transport networks with indirect impacts including economic damage, reduced production, interruption of flows of food, critical materials and other resources.
Increased costs related to stricter building codes.
Perceived impactin Billion US $
Drivers and indicators Global impact
Earthquakes and volcanic eruptions
Earthquakes, volcanic action and other geophysical catastrophes cause harm to lives, human health, infrastructure, property, economic activity and the environment.
Perceived likelihoodto occur in the next ten years
low med high
Environmental Risks

26 | Global Risks 2011
Drivers that increase risk Drivers that could both increase or reduce risk
Drivers that reduce risk
The symbols in the “Drivers and indicators” denote the following
The global risks barometer
Figure 1
Figure 1
Increasing population growth and density in flooding-prone areas
Climate change through extreme rainfall, rising sea levels, melting ice-sheets, glacial lake outburst floods, etc.
Deforestation and destruction of ecosystems that provide natural barriers and absorption of water
Urbanization and development that increase the concentration of people and economic assets in high-risk areas such as floodplains and coastal zones
Infrastructure investment to build and maintain levees, drainage and flood control
Governance systems that support preparedness, rapid response, evacuation plans and regional/international cooperation in the event of a disaster
Advances in technologies that enable more sensitive detection and early warning systems
Systematic and long-term plans to remove people and property from danger zones
Coastal flooding inundates wetlands and other low-lying lands, erodes beaches and increases the salinity of rivers, bays and groundwater tables.
Economic loss in the form of affected agriculture, damage to residential areas and critical infrastructure, as well as disruption to regional and global supply chains.
International displacement, migration and resettlement.
Erosion of fertile surface soil, affecting biodiversity and food production.
Water contamination as floodwater picks up household and industrial waste, pesticides, heavy metals and other toxic chemicals.
Perceived impactin Billion US $
Drivers and indicators Global impact
Flooding
Severe flooding causes harm to lives, human health, infrastructure, property, economic activity and the environment.
Perceived likelihoodto occur in the next ten years
low med high
Environmental Risks

27 | Global Risks 2011
Drivers that increase risk Drivers that could both increase or reduce risk
Drivers that reduce risk
The symbols in the “Drivers and indicators” denote the following
The global risks barometer
Figure 1
Figure 1
Increasing population growth and density in flooding-prone areas
Climate change and shifts in weather patterns through rising ocean temperatures which increase the energy potential of hurricanes and tropical storms
Rigour of and compliance with building codes, affecting how buildings and critical infrastructure are able to withstand varying frequencies and durations of storms and cyclones; encompasses factors such as cost of bringing older buildings up to standard, and quality of materials and workmanship
Emergency preparedness such as resident awareness, early warning and rapid response mechanisms (including to secondary effects such as fires, flooding and landslides )
Economic loss in the form of affected agriculture, damage to residential areas and critical infrastructure.
Loss of life through immediate trauma and subsequent diseases where infrastructure is chronically affected
Displacement of people as a consequence of the destruction of residences and businesses
Interruption to the global logistics and transport networks with indirect impacts including economic damage, reduced production, interruption of flows of food, critical materials and other resources.
Increased costs related to stricter building codes.
Crop damage, impacting food security.
Perceived impactin Billion US $
Drivers and indicators Global impact
Storms and cyclones
Storms, cyclones and other acute weather events cause harm to lives, human health, infrastructure, property, economic activity and the environment.
Perceived likelihoodto occur in the next ten years
low med high
Environmental Risks

28 | Global Risks 2011
Drivers that increase risk Drivers that could both increase or reduce risk
Drivers that reduce risk
The symbols in the “Drivers and indicators” denote the following
The global risks barometer
Figure 1
Subsidy schemes incentivizing overexploitation
Population growth and increases in resource-intensive consumption patterns
Declining yields from land resources which increase pressure to exploit marine resources
Extent to which international coordination on ocean governance can address territorial disputes and the marine resources are exploited (“tragedy of the commons”)
Advances in technologies which enable more effective exploitation of marine resources, but which come with the threat of unintended consequences (such as oil spills during deepwater drilling)
Increasing levels of awareness of the economic importance of ocean resources and governance, in particular the economic and social value maintained by stable marine ecosystems and the trade-offs involved in ensuring their continued existence
Governance on seaborne waste such as the Great Pacific Garbage Patch, where pelagic plastics, chemical sludge and other debris have been trapped by the currents of the North Pacific Gyre
Overexploitation of marine resources leads to environmental degradation and biodiversity loss, threatening the estimated US$ 375 billion per year in goods and services which depend on marine biodiversity.
Increased competition for marine resources leads to geopolitical tensions and conflict between nations.
Potential wide-spread environmental degradation, loss of habitat and wide-scale pollution affecting marine, birds and human life.
Perceived impactin Billion US $
Drivers and indicators Global impact
Ocean governance
Inadequate global regulation, authority and coordination create conflict over the appropriate use of the sea for transport and marine resources, threatening economic development and regional stability.
Perceived likelihoodto occur in the next ten years
low med high
Environmental Risks

29 | Global Risks 2011
Drivers that increase risk Drivers that could both increase or reduce risk
Drivers that reduce risk
The symbols in the “Drivers and indicators” denote the following
The global risks barometer
Figure 1
Figure 1
Increase in risk factors such as high cholesterol, high blood pressure, obesity, smoking and alcohol combined with environmental factors and sedentary lifestyle
Increasing economic disparity where this results in larger proportions of the population having inadequate access to healthcare
Policies which successfully raise awareness and incentivize healthy behavioural choices in terms of diet and exercise
Effective prevention, screening and wellness programmes
Advances in diagnostics, drug development and therapeutics
New scientific data on and improved understanding of causal links, genetic factors and precise treatment mechanisms
Increased death rates due to these diseases.
Decrease in labour force productivity and savings.
Decrease in quality of life.
Increased burden on human resources to provide healthcare.
Increased financial burden both for states and individuals to cover healthcare costs.
Increased prevalence of mental illness and depression for both working age and elderly cohorts.
Perceived impactin Billion US $
Drivers and indicators Global impact
Chronic diseases
Rising levels of chronic diseases, such as obesity, cancer and heart disease, increase health costs and threaten productivity and economic growth.
Perceived likelihoodto occur in the next ten years
low med high
Societal Risks

30 | Global Risks 2011
Drivers that increase risk Drivers that could both increase or reduce risk
Drivers that reduce risk
The symbols in the “Drivers and indicators” denote the following
The global risks barometer
Figure 1
Increasing proportion of the ageing population becoming dependent on social safety nets
Concurrent decreases in fertility and mortality in advanced economies
Continuing lack of economic opportunities for young populations in emerging economies
Increase in fertility rate in fragile states
Decreasing fertility rates in emerging economies due to higher levels of education, job market changes, women’s empowerment, contraception etc.
Older cohorts becoming more economically active
Migration of economically active populations to redress labour-market imbalances
Changes in retirement policies such as raising legal age of retirement
Growing economic and financial burden of social safety nets such as healthcare and pension systems.
Threats to fiscal solvency, particularly for advanced economies, because of long-term liabilities of ageing populations.
Growing impoverishment in old age.
Skewing of democratic political systems towards protecting the interests of the elderly.
Resentment of younger generations because of economic burdens and lack of opportunity.
Threats to social stability from large numbers of unemployed youth in emerging economies.
Perceived impactin Billion US $
Drivers and indicators Global impact
Demographic challenges
Ageing populations in industrialized economies and young populations in emerging economies threaten economic growth and social stability.
Perceived likelihoodto occur in the next ten years
low med high
Societal Risks

31 | Global Risks 2011
Drivers that increase risk Drivers that could both increase or reduce risk
Drivers that reduce risk
The symbols in the “Drivers and indicators” denote the following
The global risks barometer
Figure 1
Executive pay and incentive structures which distort national income structures
Decline of labour institutions and collective bargaining
Access to education at the levels necessary for participation in the modern labour market
Access to employment opportunities, particularly for the younger and the elderly generations
Social safety nets and transfer policies with the effect of efficiently redistributing wealth where appropriate
Social fragmentation, including higher rates of social unrest, crime and marginalization.
Mistrust in the system of governance at both the national and international level, leading to democratic disengagement and rise of direct action.
Shorter life expectancies and higher rates of chronic disease and depression, as the intergenerational transmission of wealth creates growing disparities in health.
Perceived impactin Billion US $
Drivers and indicators Global impact
Economic disparity
Wealth and income disparities, both within countries and between countries, threaten social and political stability as well as economic development.
Perceived likelihoodto occur in the next ten years
low med high
Societal Risks

32 | Global Risks 2011
Drivers that increase risk Drivers that could both increase or reduce risk
Drivers that reduce risk
The symbols in the “Drivers and indicators” denote the following
The global risks barometer
Figure 1
Figure 1
Low levels or quality of infrastructure involved in distributing food and related commodities, with the potential to restrict supply
Population growth and increasing caloric consumption per person, resulting in rising demand
Rising food prices, particularly in the context of rising economic disparity
Trends reducing arable land available for sustainable food production, e.g. competition from biofuels
Rising water scarcity
Increases in climate change-related natural disasters, including flooding, droughts, storms and cyclones
Protectionist policies and market distortions such as export controls, price floors and subsidies
Technological advances which improve crop yields and/or resilience to extreme temperatures, lower water availability and weather events
Destruction of local ecosystems because of monoculture, forest clearing and soil exhaustion.
Social and political unrest.
Loss of locally suitable knowledge and skills because of shifts to industrial food production.
Malnutrition, which may result in permanent physical impairment and lost productivity.
Migration pressures.
Commodity price volatility as shortages ripple through global markets.
Perceived impactin Billion US $
Drivers and indicators Global impact
Food security
Inadequate or unreliable access to appropriate quantities and quality of food and nutrition threatens social stability, health outcomes and economic development.
Perceived likelihoodto occur in the next ten years
low med high
Societal Risks

33 | Global Risks 2011
Drivers that increase risk Drivers that could both increase or reduce risk
Drivers that reduce risk
The symbols in the “Drivers and indicators” denote the following
The global risks barometer
Figure 1
Figure 1
Surge of medication/ vaccination-resistant strains
Emergence of H1N1 and new strains of the virus
Increasing transmissibility of new viral strains (viral evolutionary rule)
Contamination of food and water sources because of humanitarian crises or poor sanitation
Level of enforcement of intellectual property rights affecting the development and distribution of new and generic drugs at affordable prices
Effective international preparedness, monitoring and coordination for pandemics, including vaccine availability, supply-chain preparedness, emergency communication, transportation and treatment infrastructure
Effective international monitoring and coordination for managing known infectious diseases, including policy and legal support at international and national levels
Coverage of basic immunizations to entire populations
Improved sanitation facilities and hygiene behaviours, particularly in rural areas and urban slums
Significant loss of life.
Critical disruption in commercial and trade activities as well as critical services that may result in widespread economic and social loss.
Severe burden on health systems.
Public panic, which may amplify the overall impact of infectious diseases.
Ongoing loss of productivity because of long-term infectious disease burdens the labour force.
Emergence of drug-resistant bacteria and other pathogens.
Perceived impactin Billion US $
Drivers and indicators Global impact
Infectious diseases
The incidence and patterns of both known and emerging infectious diseases shift to new regions and population segments through a series of pandemics or sub-pandemic outbreaks, threatening global health and economic activity.
Perceived likelihoodto occur in the next ten years
low med high
Societal Risks

34 | Global Risks 2011
Drivers that increase risk Drivers that could both increase or reduce risk
Drivers that reduce risk
The symbols in the “Drivers and indicators” denote the following
The global risks barometer
Figure 1
Figure 1
Internal, regional and international conflicts
Increasing demand from ageing societies to bring in migrant workers for elderly care
Increasing parochialism in receiving countries, especially given current and expected economic conditions
Effectiveness of limits on migration imposed by industrialized countries seeking to accept only the most skilled migrants
Skilled migrants returning to their countries of origin as improving economic conditions offer greater opportunities
Pre-emptive social measures to deal with economic issues and ensure equitable sharing of resources and infrastructure
International frameworks, agreements and effective governance which take into account the economic hardships of poor countries on one hand and ageing populations on the other
Contribution to or strain on social services and safety nets such as healthcare, pensions, housing and education.
Social tension especially involving lower paid workers in the receiving country’s labour force.
Emerging economies suffering from brain drain.
Suffering of people and destruction of resources in forced migrations.
Reduced productivity and economic activity because of restrictions on the global movement of talent.
Where migration is inhibited, loss of remittances from diaspora.
Perceived impactin Billion US $
Drivers and indicators Global impact
Migration
Migration flows place economic and social benefits and costs on both receiving and sending countries.
Perceived likelihoodto occur in the next ten years
low med high
Societal Risks

35 | Global Risks 2011
Drivers that increase risk Drivers that could both increase or reduce risk
Drivers that reduce risk
The symbols in the “Drivers and indicators” denote the following
The global risks barometer
Figure 1
Figure 1
Population growth, especially in areas where water is scarce
Short-term, piecemeal and unsustainable water management policies and practices
Increased competition for water among resource-intensive systems such as food and energy production
Low levels or quality of infrastructure for water distribution and management
Subsidies and other market distortions which encourage excessive water use
Water quality degradation through acidification, eutrophication (addition of artificial and/or non-artificial substances, such as nitrates and phosphates in fertilizers or sewage, to a fresh water system) or oil spills
Changing climate conditions which shift rainfall patterns
Extent to which industrial, agricultural and household users are empowered to implement suitable water management solutions
Increasing awareness and engagement by business and government on the importance of demand-side management of water use
Improved understanding of the social and economic costs of unsustainable water use
Progressive, market-led pricing regimes for water which include the full cost of water (including externalities) and lower demand
Success in managing transboundary water sources, including upstream and downstream water management by multiple stakeholders
Reduced agricultural yields, reduced food security and economic challenges for agricultural communities.
Physical and economic conflict over access to scarce water.
Spread of infectious diseases because of contaminated water.
Loss of biodiversity through water shortages in fragile ecosystems.
Migration pressures.
Reduced human security for populations forced to travel long distances for water.
Social and political unrest.
Perceived impactin Billion US $
Drivers and indicators Global impact
Water security
Declines in the quality and quantity of potable water which threaten to undermine social stability and economic development and to promote both inter-state and intra-state conflict.
Perceived likelihoodto occur in the next ten years
low med high
Societal Risks

36 | Global Risks 2011
Drivers that increase risk Drivers that could both increase or reduce risk
Drivers that reduce risk
The symbols in the “Drivers and indicators” denote the following
The global risks barometer
Figure 1
Figure 1
Lack of generalized and comprehensive security standards, making networked critical infrastructures as vulnerable as their weakest link
Extreme weather and catastrophic events such as earthquakes damaging key infrastructures that are highly networked
False perceptions of security leading to lack of urgency or incoherent measures creating new vulnerabilities
Increase in malicious infiltration in CII through cyber-terrorists or enemy states
Pervasive small-scale data breaches, such as phishing, that could develop into systemic problems
Early detection of events and effectiveness of business continuity management
Deterrent effect of clear legal framework to penalize offenders
Adequate investment in maintaining infrastructure, hardware and software to meet new demands
Shared contingency plan and sharing of infrastructure in emergency situations
Degree of data, information and infrastructure sharing among governments and with private institutions
Severe disruptions to critical government, communication, energy and financial systems.
Disruption of business services, resulting in severe economic loss.
Decreased trust in systems profoundly changes ways of life.
Unforeseen cascading effects on other highly interconnected networks.
Potential loss of life as CII breakdown hampers emergency responses.
Perceived impactin Billion US $
Drivers and indicators Global impact
Critical information infrastructure breakdown
Systemic failures of critical information infrastructure (CII) and networks negatively impact industrial production, public services and communications.
Perceived likelihoodto occur in the next ten years
low med high
Technological Risks

37 | Global Risks 2011
Drivers that increase risk Drivers that could both increase or reduce risk
Drivers that reduce risk
The symbols in the “Drivers and indicators” denote the following
The global risks barometer
Figure 1
Figure 1
Lack of transparency on meta collection of data and algorithms
Difficulty of tracing altered data and infiltrator activity and the lack of agreement on how to intervene when erroneous data is created or misallocated
Incompatibility of new and old systems, carrying risks of destabilizing the network
Increased reliance on cloud services for data storage and analytics
Extent to which policy and regulatory frameworks can keep up, given the lag between innovation cycles and government decision-making cycles
Deterrent effect of clear legal framework to penalize offenders
Information sharing among governments and private firms regarding loss events
Improved education and personal awareness on ethical and moral responsibilities of online activities, including a false sense of security from encryption
Development of best practices for data security
Disruption of global e-commerce and network communication as security concerns make users retreat from online services.
Paralysis of business and governance as trust decreases in data collection, storage, distribution systems and organizations processing mass data.
Increased degree of tolerance to breaches of privacy.
Negative blow to the open source society affecting data and process sharing which hampers innovation and trust.
Unexpected second- and third-order effects through the interconnectedness of systems and data which are generally poorly understood.
Perceived impactin Billion US $
Drivers and indicators Global impact
Online data and information security
The accidental loss of data or fraud online triggers a loss of confidence in data sharing, negatively affecting e-commerce and communication.
Perceived likelihoodto occur in the next ten years
low med high
Technological Risks
38 | Global Risks 2011
Drivers that increase risk Drivers that could both increase or reduce risk
Drivers that reduce risk
The symbols in the “Drivers and indicators” denote the following
The global risks barometer
Figure 1
Figure 1
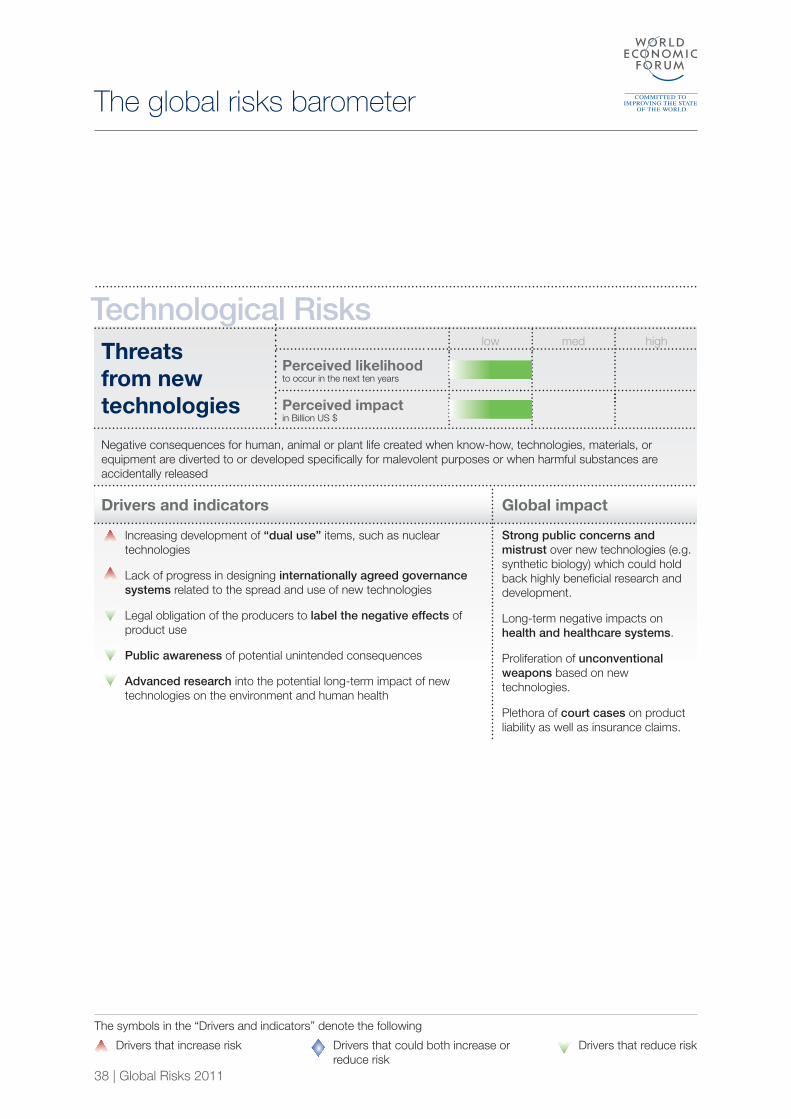
Increasing development of “dual use” items, such as nuclear technologies
Lack of progress in designing internationally agreed governance systems related to the spread and use of new technologies
Legal obligation of the producers to label the negative effects of product use
Public awareness of potential unintended consequences
Advanced research into the potential long-term impact of new technologies on the environment and human health
Strong public concerns and mistrust over new technologies (e.g. synthetic biology) which could hold back highly beneficial research and development.
Long-term negative impacts on health and healthcare systems.
Proliferation of unconventional weapons based on new technologies.
Plethora of court cases on product liability as well as insurance claims.
Perceived impactin Billion US $
Drivers and indicators Global impact
Threats from new technologies
Negative consequences for human, animal or plant life created when know-how, technologies, materials, or equipment are diverted to or developed specifically for malevolent purposes or when harmful substances are accidentally released
Perceived likelihoodto occur in the next ten years
low med high
Technological Risks