The Global Economic Crisis and the Future of Social Protection International Labour Conference 98 th...
47
The Global Economic Crisis and the Future of Social Protection International Labour Conference 98 th session Geneva 8 June 2009
-
Upload
aleesha-mckenzie -
Category
Documents
-
view
214 -
download
0
Transcript of The Global Economic Crisis and the Future of Social Protection International Labour Conference 98 th...
The Global Economic Crisis and the Future
ofSocial Protection
International Labour Conference 98th session
Geneva 8 June 2009
Deflationary spiral•Asset (stock, property) markets
deflating negative wealth effect
more bank insolvency generalized credit squeeze
•Lower external demand, world trade excess capacity investment slowdown
•Depressed domestic demand lower prices, outputrices, output lower employment, incomes
3
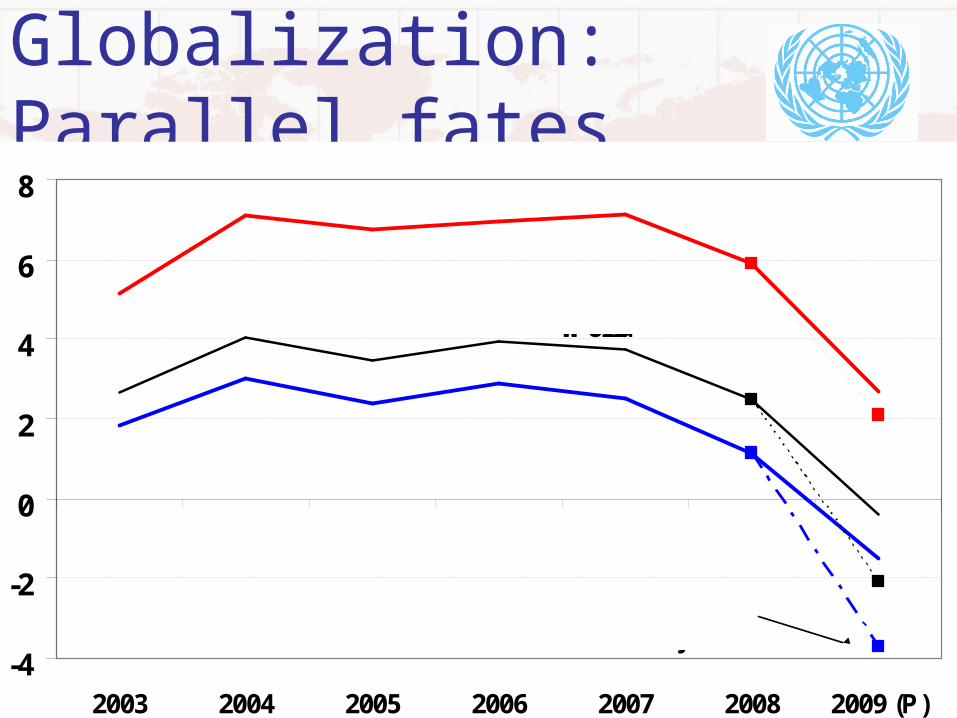
Globalization: Parallel fates
-4
-2
0
2
4
6
8
2003 2004 2005 2006 2007 2008 2009 (P)
Developing countries
Developed countries
World
Preliminary, revised forecast
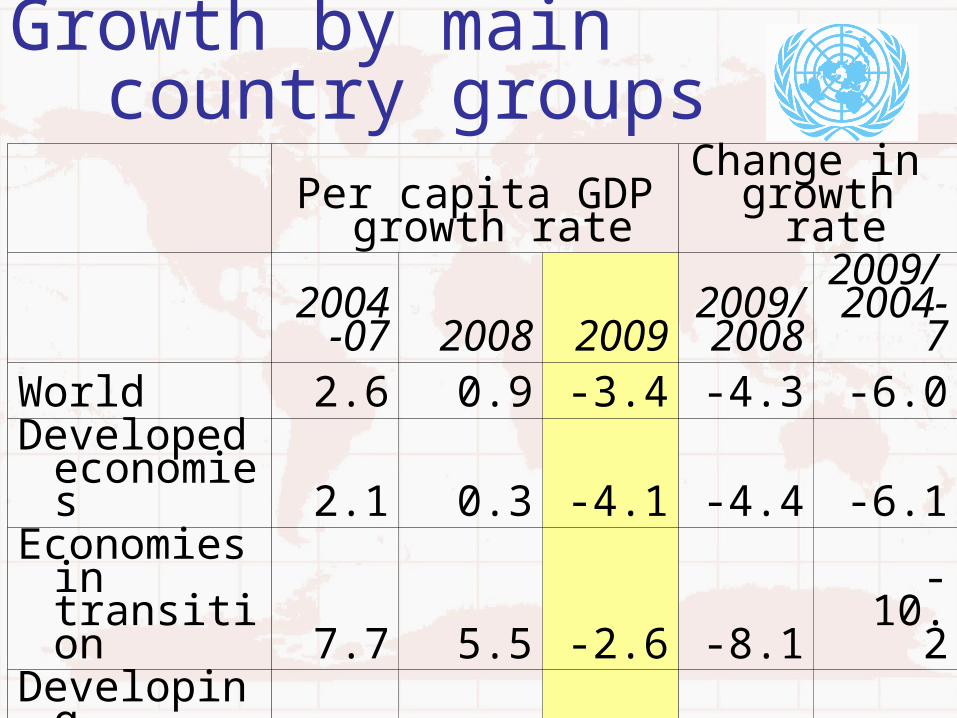
Growth by main country groups
Per capita GDP growth rate
Change in growth rate
2004-07 2008 2009
2009/
2008
2009/ 2004-
7World 2.6 0.9 -3.4 -4.3 -6.0Developed
economies 2.1 0.3 -4.1 -4.4 -6.1
Economies in transition 7.7 5.5 -2.6 -8.1 -10.2
Developing economies 5.7 4.0 0.1 -3.9 -5.6
LDCs 5.2 3.6 0.3 -3.3 -4.9
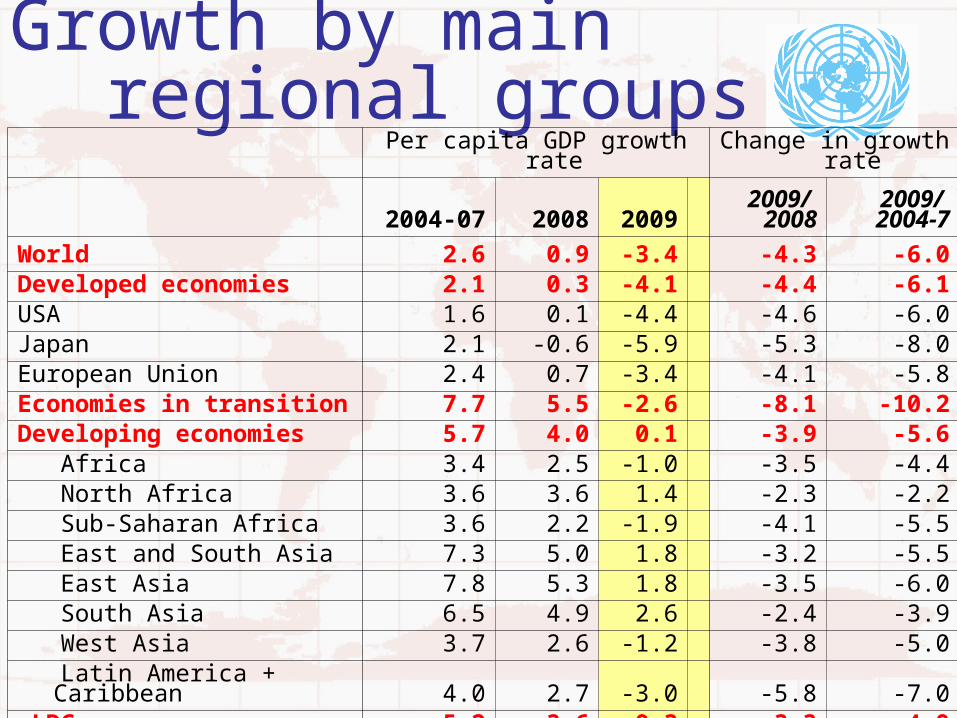
Growth by main regional groups
Per capita GDP growth rateChange in growth
rate
2004-07 2008 20092009/
20082009/
2004-7
World 2.6 0.9 -3.4 -4.3 -6.0
Developed economies 2.1 0.3 -4.1 -4.4 -6.1
USA 1.6 0.1 -4.4 -4.6 -6.0
Japan 2.1 -0.6 -5.9 -5.3 -8.0
European Union 2.4 0.7 -3.4 -4.1 -5.8
Economies in transition 7.7 5.5 -2.6 -8.1 -10.2
Developing economies 5.7 4.0 0.1 -3.9 -5.6
Africa 3.4 2.5 -1.0 -3.5 -4.4
North Africa 3.6 3.6 1.4 -2.3 -2.2
Sub-Saharan Africa 3.6 2.2 -1.9 -4.1 -5.5
East and South Asia 7.3 5.0 1.8 -3.2 -5.5
East Asia 7.8 5.3 1.8 -3.5 -6.0
South Asia 6.5 4.9 2.6 -2.4 -3.9
West Asia 3.7 2.6 -1.2 -3.8 -5.0 Latin America +
Caribbean 4.0 2.7 -3.0 -5.8 -7.0
LDCs 5.2 3.6 0.3 -3.3 -4.9
LDCs excl. Bangladesh 5.4 3.4 -0.6 -3.9 -6.0
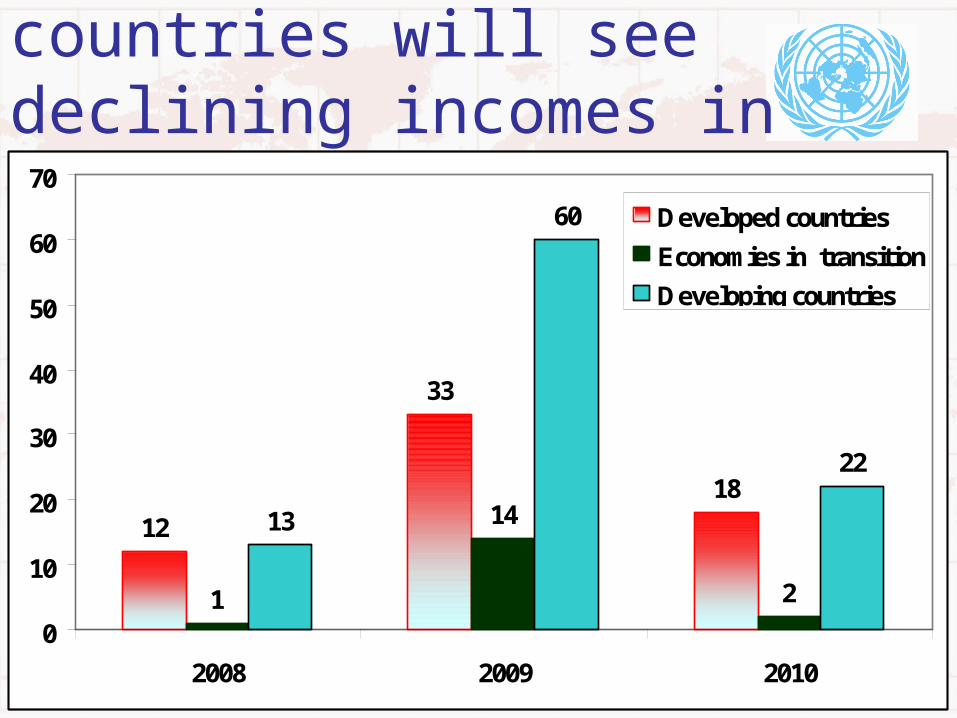
60 developing countries will see declining incomes in 2009
12
33
18
1
14
2
13
60
22
0
10
20
30
40
50
60
70
2008 2009 2010
Developed countries
Economies in transition
Developing countries
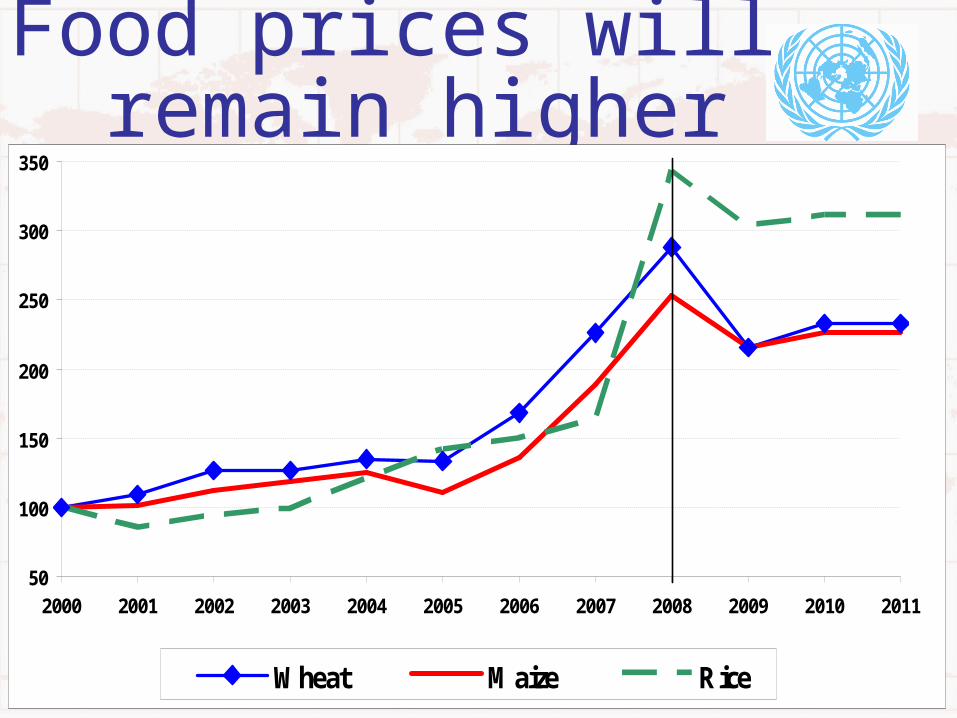
Food prices will remain higher
50
100
150
200
250
300
350
2000 2001 2002 2003 2004 2005 2006 2007 2008 2009 2010 2011
Wheat Maize Rice

10
Trade impacts•Exports decline all developing countries
•Terms of trade primary exporters
•Trade surpluses, reserves may run down quickly
•But lower energy, food prices help net food and oil-importers
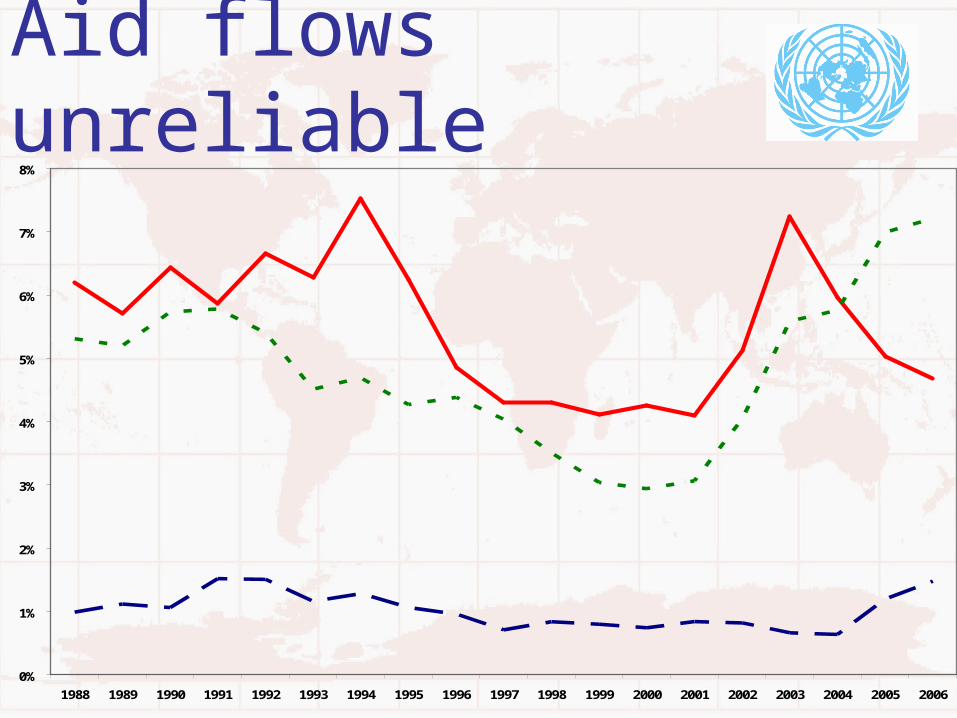
Aid flows unreliable
0%
1%
2%
3%
4%
5%
6%
7%
8%
1988 1989 1990 1991 1992 1993 1994 1995 1996 1997 1998 1999 2000 2001 2002 2003 2004 2005 2006
Other LICs
Sub-Saharan Africa
LDCs

Remittances to developing countries, 2008-2010
45
260
41
239
42
238
0
50
100
150
200
250
300
Low-income countries Middle-income countries
(bil
lion
s of
US
doll
ars)
2008
2009
2010
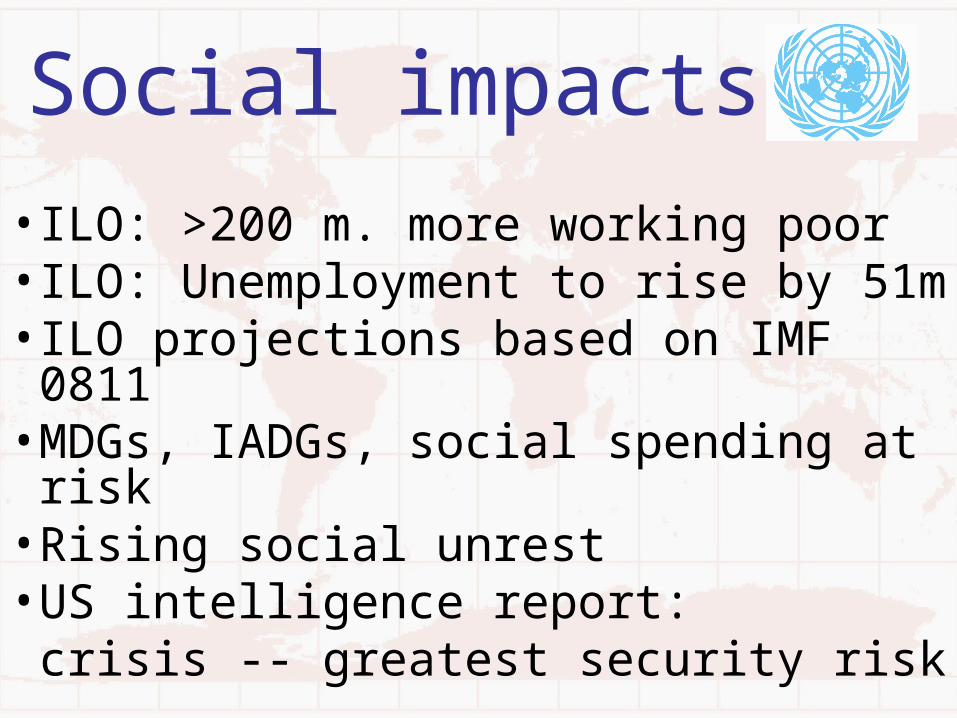
Social impacts
•ILO: >200 m. more working poor •ILO: Unemployment to rise by 51m•ILO projections based on IMF 0811•MDGs, IADGs, social spending at risk
•Rising social unrest•US intelligence report:
crisis -- greatest security risk

Livelihoods threatened• Declining living standards• Many livelihoods under threat,
especially when social protection not well-developed
• Migrant workers especially vulnerable• Prolonged slowdown in world economy
likely to cause remittances, job creation, tourism and ODA to decline, unemployment to increase, particularly among youth
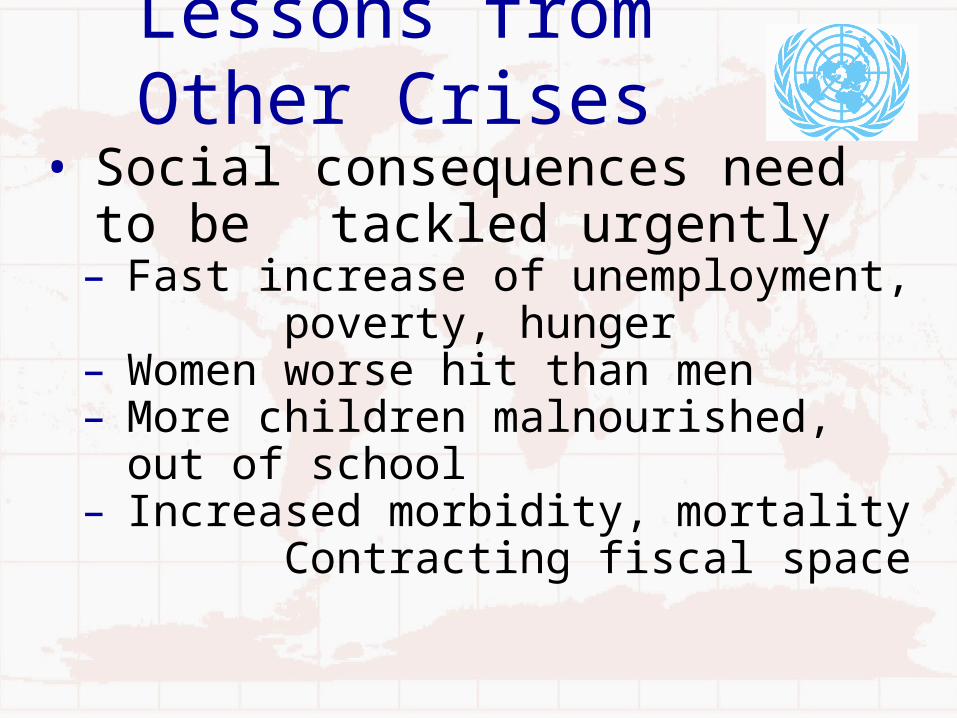
Lessons from Other Crises• Social consequences need to
be tackled urgently – Fast increase of unemployment,
poverty, hunger– Women worse hit than men– More children malnourished,
out of school– Increased morbidity, mortality
Contracting fiscal space
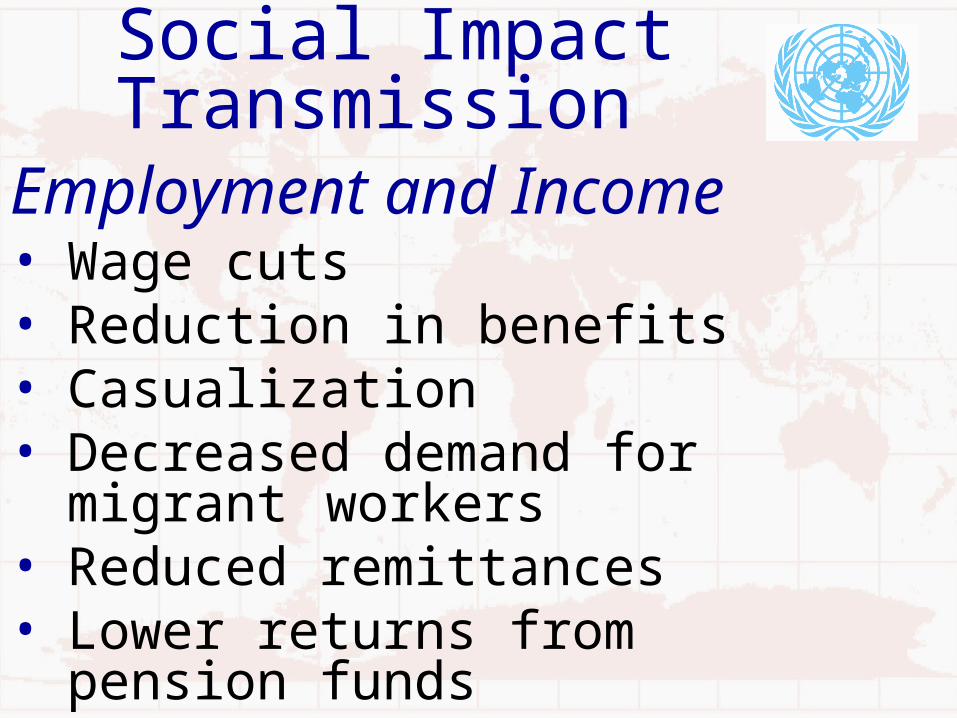
Social Impact Transmission
Employment and Income• Wage cuts• Reduction in benefits• Casualization• Decreased demand for
migrant workers• Reduced remittances• Lower returns from pension
funds
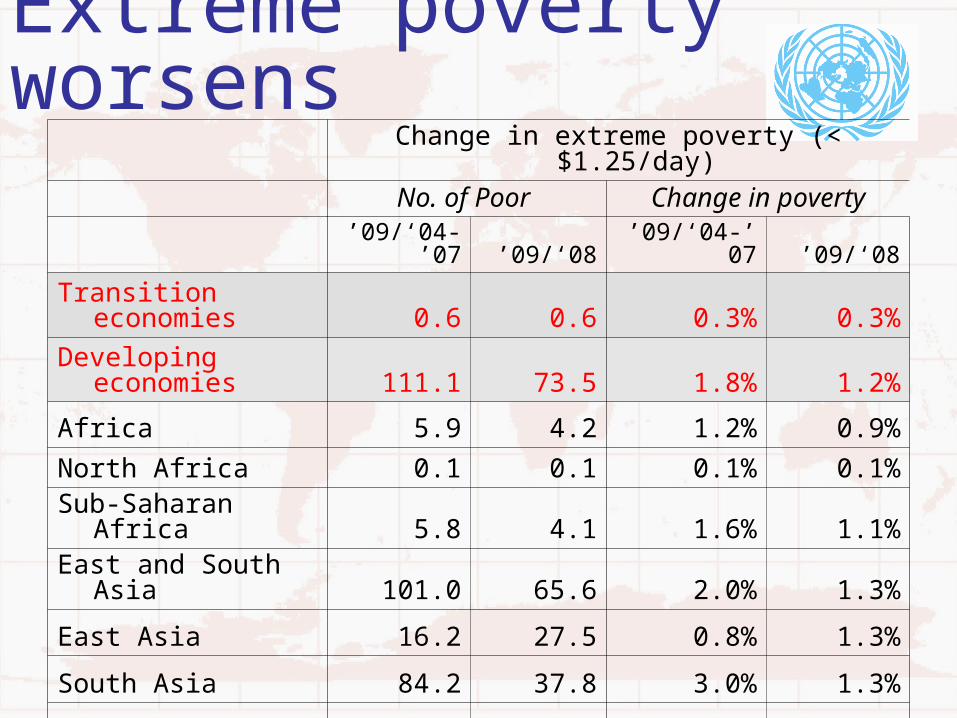
Extreme poverty worsens
Change in extreme poverty (< $1.25/day)
No. of Poor Change in poverty’09/‘04-’0
7 ’09/‘08 ’09/‘04-’07 ’09/‘08
Transition economies 0.6 0.6 0.3% 0.3%
Developing economies 111.1 73.5 1.8% 1.2%
Africa 5.9 4.2 1.2% 0.9%North Africa 0.1 0.1 0.1% 0.1%Sub-Saharan Africa 5.8 4.1 1.6% 1.1%East and South
Asia 101.0 65.6 2.0% 1.3%East Asia 16.2 27.5 0.8% 1.3%South Asia 84.2 37.8 3.0% 1.3%West Asia 0.6 0.2 0.5% 0.2%LAC 4.1 3.7 0.7% 0.7%
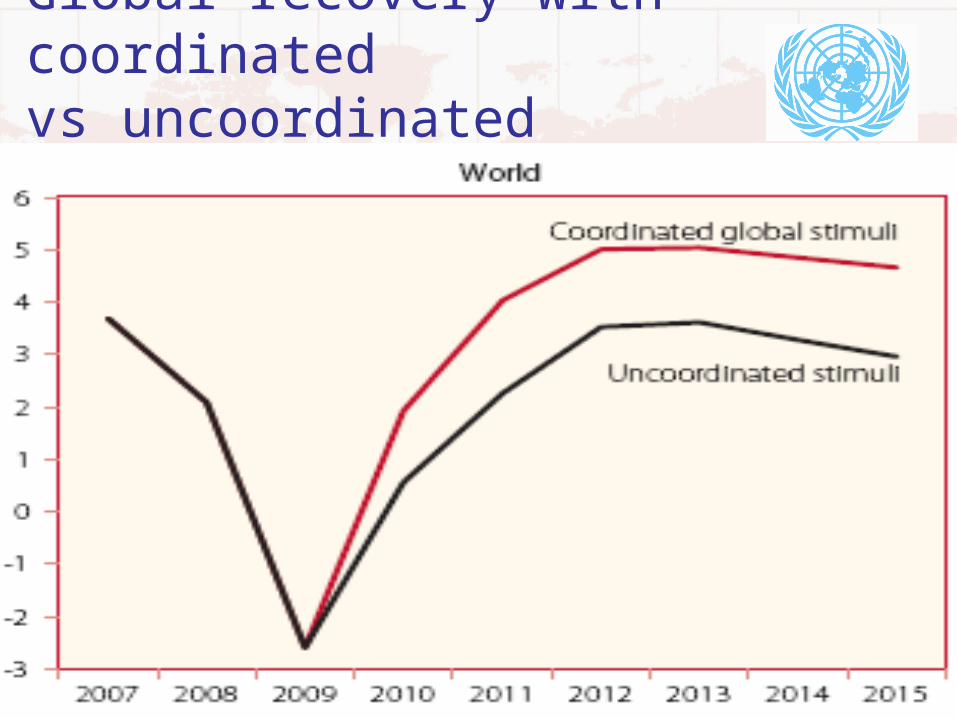
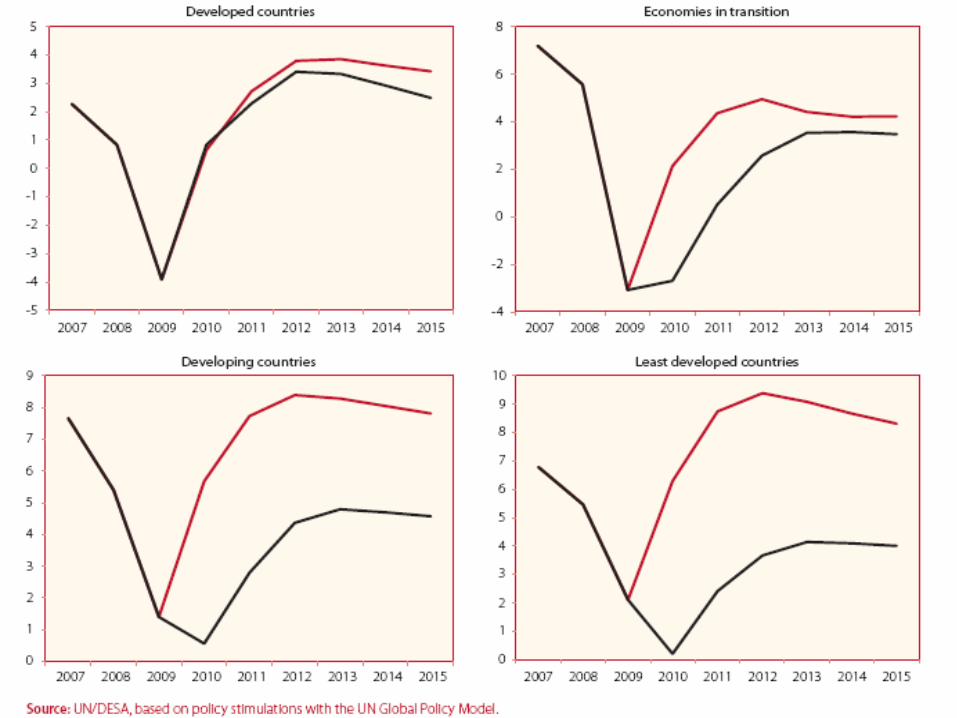
Global recovery with coordinated vs uncoordinated stimuli, 2010-2015

Output, jobs recovery lags, 1991, 2001
Duration of output recovery and job market recovery after the 1991 and 2001 US recessions (in months)
0
10
20
30
40
50
60
Output Job market recovery
1991 2001
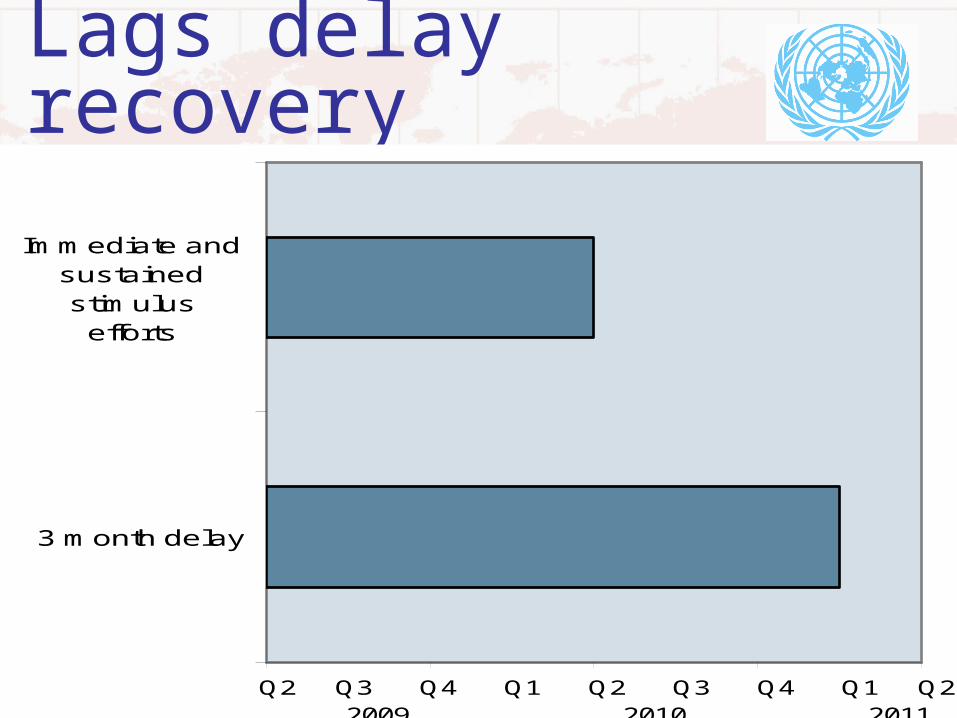
Lags delay recovery
0 2 4 6 8
3 month delay
Immediate andsustainedstimulus
efforts
Q2 Q3 Q4 Q1 Q2 Q3 Q4 Q1 Q2 2009 2010 2011

Coordination failure
As a % of GDP As a % of World GDPTotal 1.7 1.4
Advanced Economies 1.3 -
Developing & Emerging Economies 2.7 -
Table 7: Economic Stimulus in 2009
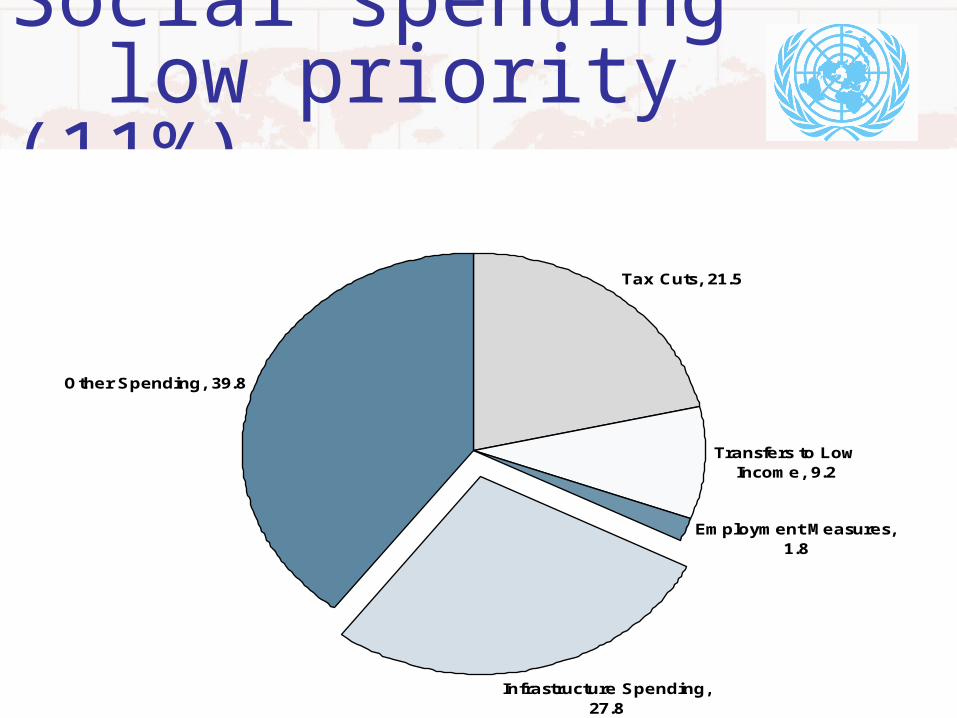
Social spending low priority (11%)
Infrastructure Spending, 27.8
Employment Measures, 1.8
Transfers to Low Income, 9.2
Other Spending, 39.8
Tax Cuts, 21.5
• Education • Health • Employment programmes
• Social security
Government Spending on Social Services down
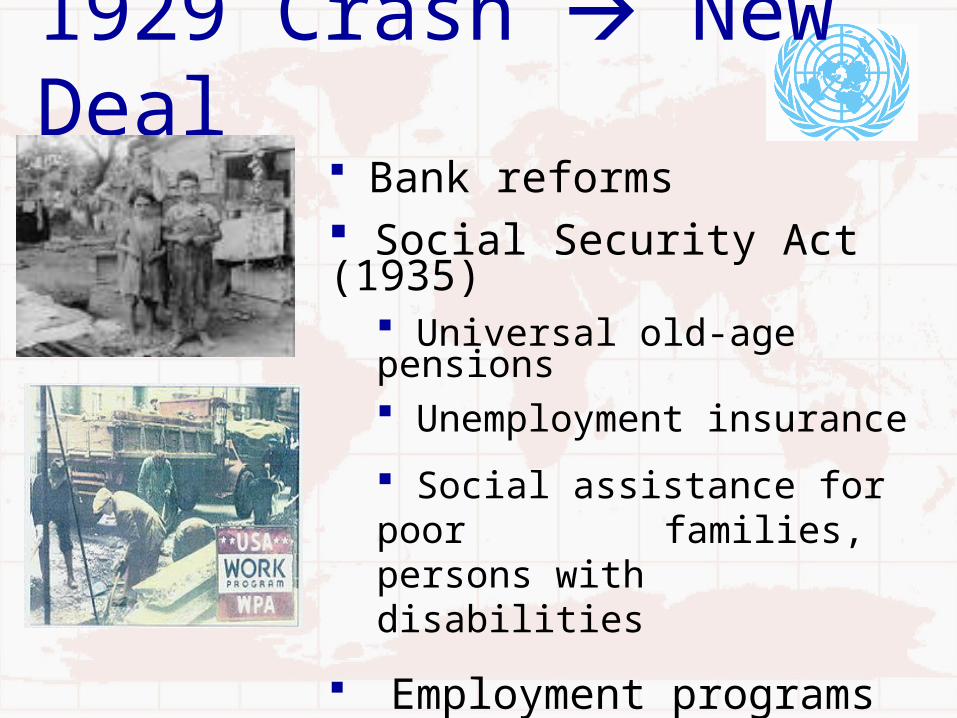
1929 Crash New Deal
Bank reforms Social Security Act (1935)
Universal old-age pensions Unemployment insurance
Social assistance for poor families, persons
with disabilities
Employment programs (public works), collective bargaining, minimum wages Farm/rural programs
Global New Deal?
• Limit contagion • Monetary responses• Fiscal stimuli• Poor coordination• Improve + enforce regulation• Reform international system
•basic and modest social protection
guarantees for all– Income security for older persons and persons with disabilities through basic, universal non-contributory pensions
–Child benefits–Employment programmes –Universal basic health care–Food security programmes
A Social Protection Floor?
Normative Reasons
• Unacceptable poverty and inequality
– > half the world below $2/day poverty line
• Social security is a human right: – Articles 22, 25 of Universal Declaration
of Human Rights: “Everyone, as a member of society, has the right to social security”
– But 80% of world population no access• 1995 World Summit – “society for all”
Economic Reasons
• Inequality economically inefficient, dysfunctional
• Raising incomes of poor increases domestic demand, encouraging growth by expanding domestic markets
• Social Protection enhances human resources and productive employment with better educated, healthy and well nourished workforce.
Political Reasons –Social Protection can help
* prevent conflict * enhance political
stability–Poverty and gross inequities
generates social tensions and conflicts
–Social benefits ensure political support of citizens

Social Transfers Reduce Poverty in >half OECD
countries
0
5
10
15
20
25
30
35
40
France Germany Italy Netherlands Sweden UK US
Pre-tax/transfer Post-tax/transfer
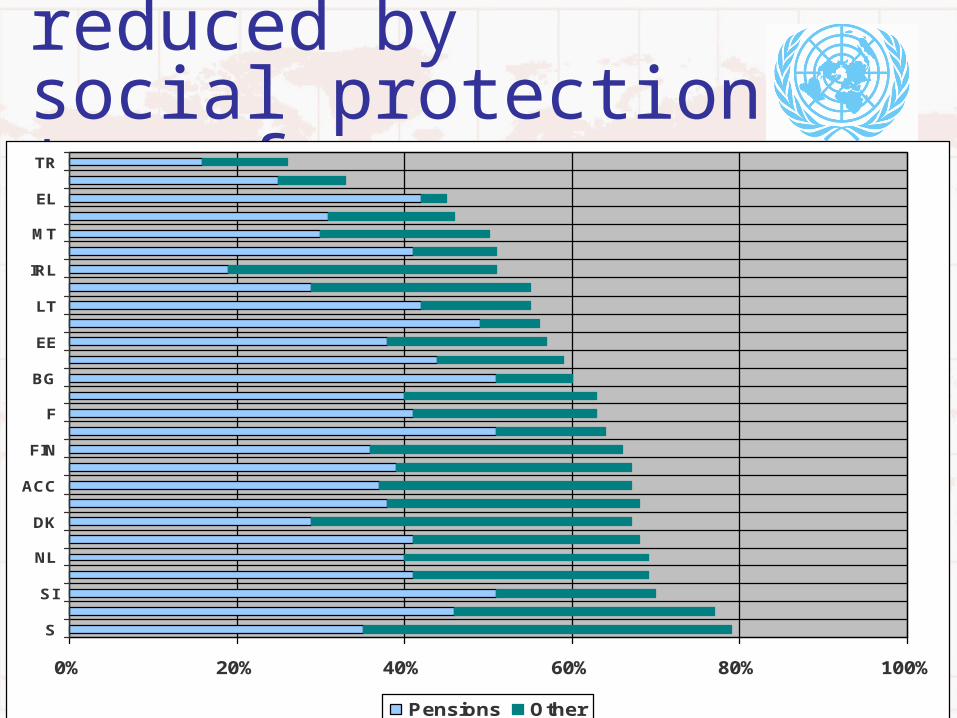
Poverty risk reduced by social protection transfers
0% 20% 40% 60% 80% 100%
S
SI
NL
DK
ACC
FIN
F
BG
EE
LT
IRL
MT
EL
TR
Pensions Other
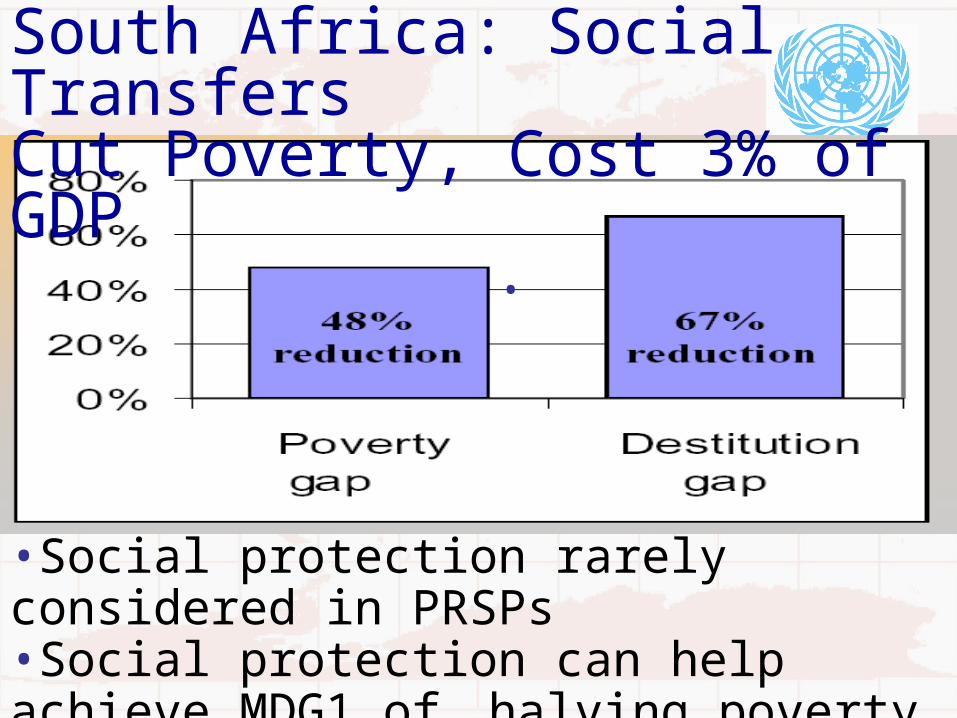
South Africa: Social Transfers Cut Poverty, Cost 3% of GDP
•
•Social protection rarely considered in PRSPs •Social protection can help achieve MDG1 of halving poverty by 2015

Reducing Poverty Requires:
1. Employment-generating macroeconomic and
sectoral policies 2. Progressive fiscal
policies: taxation, spending
3. Social Transfers 4. Remittances
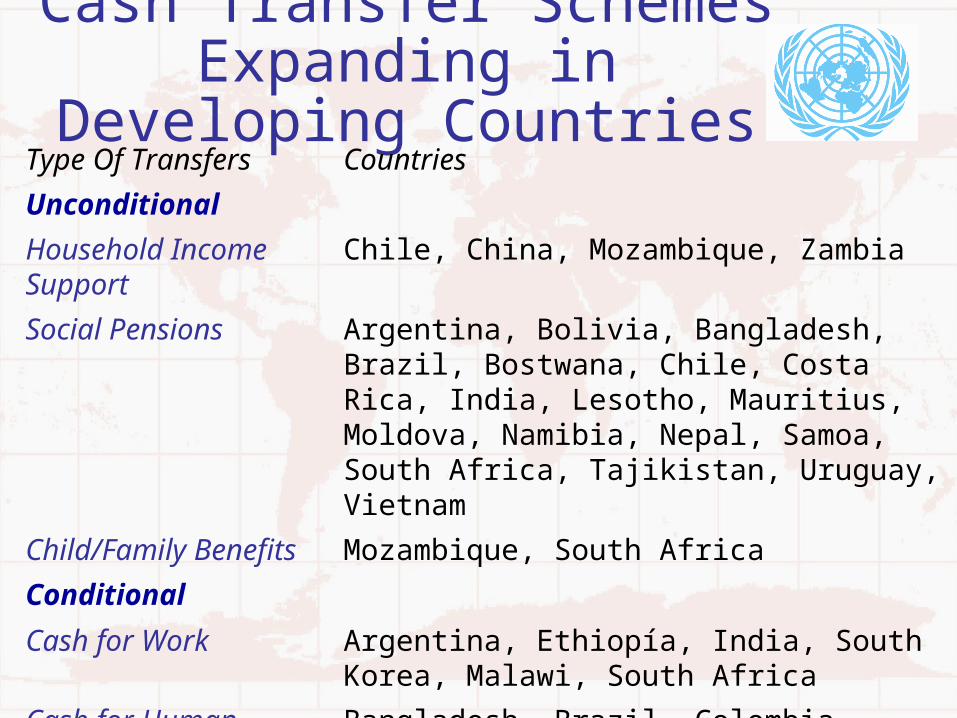
Cash Transfer Schemes Expanding in Developing
CountriesType Of Transfers Countries
Unconditional
Household Income Support
Chile, China, Mozambique, Zambia
Social Pensions Argentina, Bolivia, Bangladesh, Brazil, Bostwana, Chile, Costa Rica, India, Lesotho, Mauritius, Moldova, Namibia, Nepal, Samoa, South Africa, Tajikistan, Uruguay, Vietnam
Child/Family Benefits
Mozambique, South Africa
Conditional
Cash for Work Argentina, Ethiopía, India, South Korea, Malawi, South Africa
Cash for Human Development
Bangladesh, Brazil, Colombia, Ecuador, Honduras, Jamaica, México, Mongolia, Nicaragua
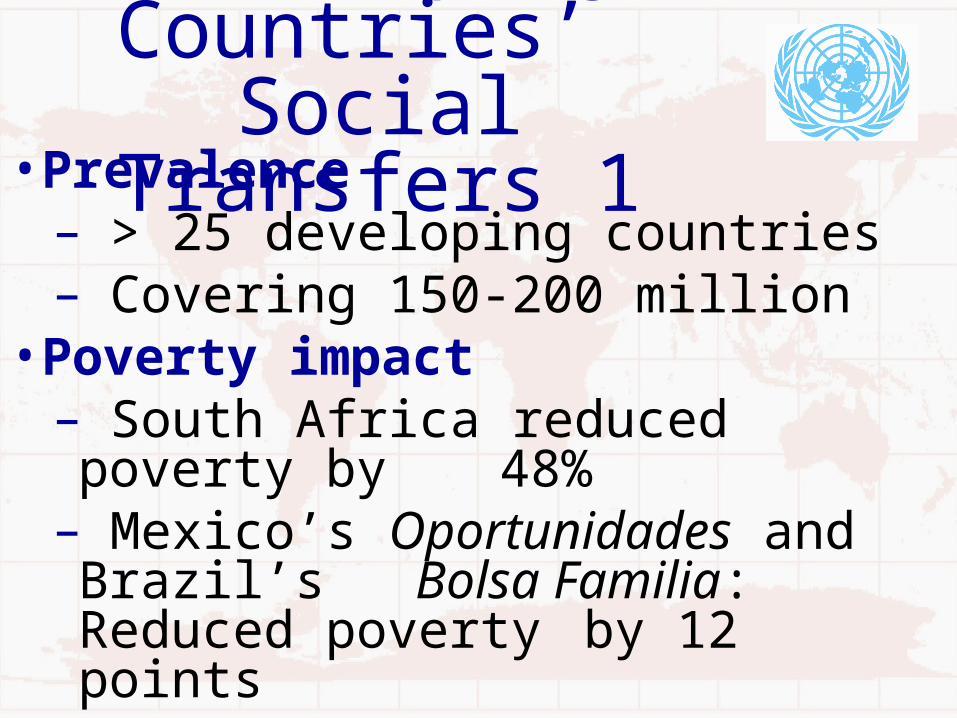
Developing Countries’
Social Transfers 1•Prevalence – > 25 developing countries – Covering 150-200 million
•Poverty impact – South Africa reduced poverty by 48%
– Mexico’s Oportunidades and Brazil’s Bolsa Familia: Reduced poverty by 12 points

Developing Countries’
Social Transfers 2•Education: Positive enrolment and school
attendance effects in Mexico, Brazil, Colombia, Bangladesh, Nicaragua, Zambia
•Health: Positive effects on height,
weight of children and nutritional status in Colombia, Mexico, Chile, Malawi, South Africa
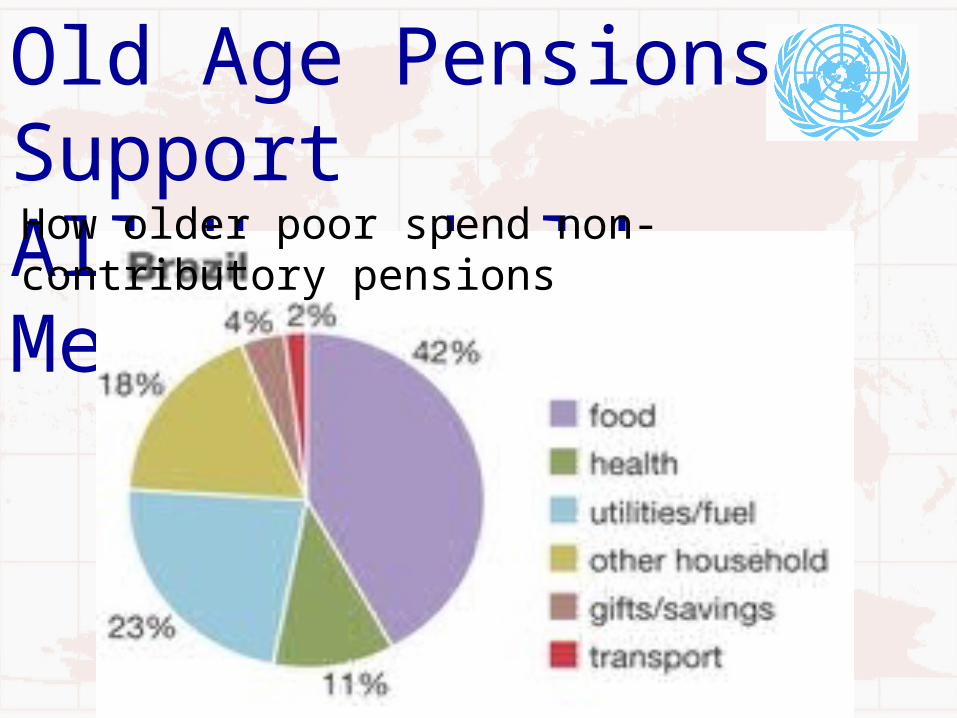
Old Age Pensions Support All Household Members
How older poor spend non-contributory pensions

Old Age Pensions Support All Household Members
How older poor spend non-contributory pensions

Old-Age Crisis? Changing
dependency ratios
Source: UN DESA 2007
Can Developing Countries Afford
Social Protection? • Countries at same level of economic
development differ significantly in terms of social protection, spending
• Reach of social protection systems depends on political attitudes: – to win electoral support– to reduce poverty
• Affordability -- issue of political will: how much society is willing to
redistribute • Universal approach politically more• Targetting (safety net) expensive, misses
many

UNDESA: Cost of Universal Old-Age Pensions ($1/day) in 100 countries
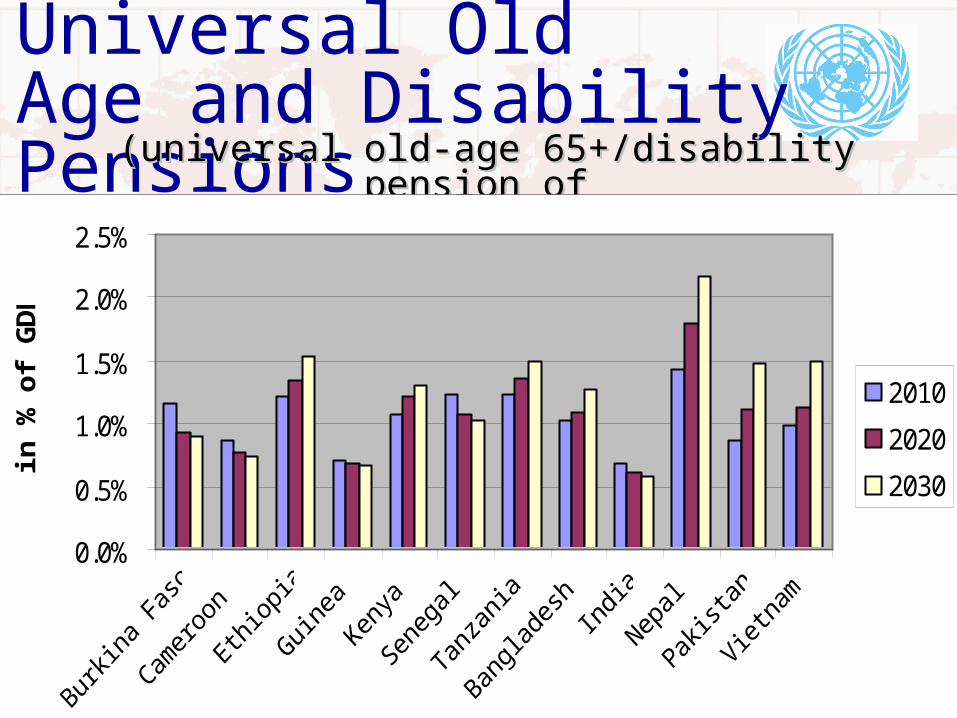
ILO: Cost of Universal OldAge and Disability Pensions(universal(universal old-age 65+/disability pension of old-age 65+/disability pension of
$1/day + 15% admin costs) (% of GDP)$1/day + 15% admin costs) (% of GDP)
0.0%
0.5%
1.0%
1.5%
2.0%
2.5%
in %
of
GD
P
2010
2020
2030

Affordability, Financing•Basic package of social
transfers affordable with 1-3% of GDP in developing countries
•Social transfers grow with fiscal space available by increasing GDP, taxation or aid
•Billions lost through poor international tax cooperation, tax systems
•70% of world inequality due to international inequalities

World Income Distribution
International responses• UN, BIS forecasts more accurate than
others; IMF, WB upbeat till late 2008• IMF, WB also marginalized by G7, etc• IMF discouraging strong fiscal stimulus by
developing countries without surplus• G7 G20: more inclusive? legitimate?
crisis-, but not developmental or equitable• London $1.1 trillion -- costless: loans + SDRs• PGA (Stiglitz) Commission of Experts• Doha Declaration: June 09 summit on impact
of crisis on developing countries

New Bretton Woods moment?
Bretton Woods, 1944: United Nations conference on monetary and financial affairs
• 15 years after 1929 Depression• Middle of WW2• US initiative vs UK Treasury stance• 44 countries (28 developing countries; 19 LA)• IMF, IBRD, ITO – UN system• Clear emphasis on sustaining growth, employment
creation, development, not just financial stability
• But BWIs very different governance arrangements
UN leadership?• Universal, legitimate lead reform
process?• Ensure comprehensive systemic reform• Ensure developmental financial system• Ensure inclusive financial system • Develop capacity for offering 2nd
opinion to interested member states • Align IMF, WB with UNDA (including
FfD), IADGs to ensure policy coherence
53
Thank youPlease visit UN-DESA Please visit UN-DESA www.un.orgwww.un.org
G24 G24 www.g24.orgwww.g24.org andand PGAPGA www.un.org/ga/president/63/ websites websites
• Research papersResearch papers• Policy briefsPolicy briefs• Other documentsOther documents
Acknowledgements: Isabel OrtizAcknowledgements: Isabel Ortiz