The George Washington University - finance.gwu.edu GWU... · The George Washington University...
63
The George Washington University Consolidated Financial Statements and Schedule of Expenditures of Federal Awards and Reports in Accordance with the OMB Uniform Guidance For the year ended June 30, 2018 EIN 53-0196584
Transcript of The George Washington University - finance.gwu.edu GWU... · The George Washington University...

The George Washington University Consolidated Financial Statements and Schedule of Expenditures of Federal Awards and Reports in Accordance with the OMB Uniform Guidance For the year ended June 30, 2018 EIN 53-0196584
2
3 47
48
Government Auditing Standards ....49-50
the O 51 52
.................................... 53 56
..................................... 57
Management's .. ... 58

PricewaterhouseCoopers LLP, 1800 Tysons Blvd., McLean, VA 22102-4261 T: (703) 918-3000, F: (703) 918-3100, www.pwc.com/us
Report of Independent Auditors
To the President and Board of Trustees of The George Washington University
Report on the Consolidated Financial Statements
We have audited the accompanying consolidated financial statements of The George Washington University and its subsidiaries (the University), which comprise the consolidated statements of financial position as of June 30, 2018 and 2017, and the related consolidated statements of unrestricted activities, consolidated statements of activities, and consolidated statements of cash flows for the years then ended, and the related notes to the financial statements.
Management’s Responsibility for the Consolidated Financial Statements
Management is responsible for the preparation and fair presentation of the consolidated financial statements in accordance with accounting principles generally accepted in the United States of America; this includes the design, implementation, and maintenance of internal control relevant to the preparation and fair presentation of consolidated financial statements that are free from material misstatement, whether due to fraud or error.
Auditors’ Responsibility
Our responsibility is to express an opinion on the consolidated financial statements based on our audits. We conducted our audit in accordance with auditing standards generally accepted in the United States of America and the standards applicable to financial audits contained in Government Auditing Standards, issued by the Comptroller General of the United States. Those standards require that we plan and perform the audit to obtain reasonable assurance about whether the consolidated financial statements are free from material misstatement.
An audit involves performing procedures to obtain audit evidence about the amounts and disclosures in the consolidated financial statements. The procedures selected depend on our judgment, including the assessment of the risks of material misstatement of the consolidated financial statements, whether due to fraud or error. In making those risk assessments, we consider internal control relevant to the University’s preparation and fair presentation of the consolidated financial statements in order to design audit procedures that are appropriate in the circumstances, but not for the purpose of expressing an opinion on the effectiveness of the University’s internal control. Accordingly, we express no such opinion. An audit also includes evaluating the appropriateness of accounting policies used and the reasonableness of significant accounting estimates made by management, as well as evaluating the overall presentation of the consolidated financial statements. We believe that the audit evidence we have obtained is sufficient and appropriate to provide a basis for our audit opinion.
Opinion In our opinion, based on our audits, the consolidated financial statements referred to above present fairly, in all material respects, the consolidated financial position of The George Washington University and its subsidiaries as of June 30, 2018 and 2017, and the changes in its net assets and its cash flows for the years then ended in accordance with accounting principles generally accepted in the United States of America.

2
Other Matters
Other Information
Our audit was conducted for the purpose of forming an opinion on the consolidated financial statements as a whole. The accompanying schedule of expenditures of federal awards for the year ended June 30, 2018 is presented for purposes of additional analysis as required by Title 2 U.S. Code of Federal Regulations Part 200, Uniform Administrative Requirements, Cost Principles, and Audit Requirements for Federal Awards (Uniform Guidance) and is not a required part of the consolidated financial statements. Such information is the responsibility of management and was derived from and relates directly to the underlying accounting and other records used to prepare the consolidated financial statements. The information has been subjected to the auditing procedures applied in the audit of the consolidated financial statements and certain additional procedures, including comparing and reconciling such information directly to the underlying accounting and other records used to prepare the consolidated financial statements or to the consolidated financial statements themselves, and other additional procedures in accordance with auditing standards generally accepted in the United States of America. In our opinion, the schedule of expenditures of federal awards is fairly stated, in all material respects, in relation to the consolidated financial statements as a whole.
Other Reporting Required by Government Auditing Standards
In accordance with Government Auditing Standards, we have also issued our report dated September 18, 2018 on our consideration of the University’s internal control over financial reporting and on our tests of its compliance with certain provisions of laws, regulations, contracts and grant agreements and other matters for the year ended June 30, 2018. The purpose of that report is solely to describe the scope of our testing of internal control over financial reporting and compliance and the results of that testing and not to provide an opinion on the effectiveness of internal control over financial reporting or on compliance. That report is an integral part of an audit performed in accordance with Government Auditing Standards in considering the University’s internal control over financial reporting and compliance.
September 18, 2018 McLean, Virginia

2018 2017ASSETS Cash and cash equivalents 122,808$ 243,149$ Short-term investments 290,092 75,054 Accounts receivable, net 78,452 74,082 Pledges receivable, net 47,371 56,446 Investments 2,253,953 2,165,852 Loans and notes receivable, net 48,251 35,649 Property, plant, and equipment, net 1,708,079 1,712,115 Other assets 18,625 21,633
Total assets 4,567,631$ 4,383,980$
LIABILITIES Accounts payable and accrued expenses 198,173$ 185,875$ Deferred revenue:
Tuition and other deposits 64,697 67,416 Grants and contracts payments 24,050 17,138
Bonds and notes payable, net 1,855,973 1,761,945 Funds advanced for student loans 29,621 29,761
Total liabilities 2,172,514 2,062,135
NET ASSETS Unrestricted net assets: Unrestricted operating (deficit) (33,881) (31,659) Unrestricted capital and investing 1,714,570 1,609,371 Total unrestricted 1,680,689 1,577,712 Temporarily restricted 427,847 464,887 Permanently restricted 286,581 279,246
Total net assets 2,395,117 2,321,845 Total liabilities and net assets 4,567,631$ 4,383,980$
(in thousands)
Consolidated Statements of Financial PositionAs of June 30, 2018 and 2017
The accompanying notes are an integral part of these consolidated financial statements.
3

Capital and Total Capital and TotalOperating Investing Unrestricted Operating Investing Unrestricted
REVENUEStudent tuition and fees 1,067,678$ -$ 1,067,678$ 1,019,581$ -$ 1,019,581$
Less: University funded scholarships (317,030) - (317,030) (289,744) - (289,744) Net student tuition and fees 750,648 - 750,648 729,837 - 729,837
Grants and contractsProgram funds 170,326 - 170,326 161,924 - 161,924 Indirect cost recoveries 31,362 - 31,362 29,323 - 29,323
Investment income, net 18,454 19,286 37,740 15,866 81,384 97,250 Investment real property rents and appreciation - 128,704 128,704 - 112,683 112,683 Change in value of split-interest agreements - 2 2 - 6 6Auxiliary enterprises 118,733 - 118,733 116,102 - 116,102 Contributions, net 20,160 901 21,061 16,350 2,139 18,489 Net assets released from restrictions 17,852 58,584 76,436 14,405 45,280 59,685 Medical education agreements 64,814 40 64,854 63,759 33 63,792 Other income 28,796 2,669 31,465 35,879 2,591 38,470
Total revenue 1,221,145 210,186 1,431,331 1,183,445 244,116 1,427,561
EXPENSESSalaries and wages 576,590 - 576,590 556,998 - 556,998 Fringe benefits 125,363 - 125,363 119,866 - 119,866 Purchased services 252,304 550 252,854 232,912 537 233,449 Supplies 15,522 88 15,610 14,235 110 14,345 Equipment 10,551 3,554 14,105 9,788 6,451 16,239 Bad debt 3,610 - 3,610 1,731 - 1,731 Occupancy 48,639 89,888 138,527 47,066 84,787 131,853 Investment real property expense - 35,969 35,969 - 34,397 34,397 Scholarships and fellowships 16,941 - 16,941 16,311 - 16,311 Communications 4,064 - 4,064 4,312 - 4,312 Travel and training 26,918 2 26,920 25,856 - 25,856 Interest - 62,329 62,329 - 60,147 60,147 Debt extinguishment costs - 14,042 14,042 - 23,154 23,154 Other 38,362 2,661 41,023 35,133 3,107 38,240
Total expenses 1,118,864 209,083 1,327,947 1,064,208 212,690 1,276,898
OTHER INCREASES (DECREASES) IN NET ASSETSDebt service and mandatory purposes (99,598) 99,598 - (103,185) 103,185 -Endowment support 76,861 (78,781) (1,920) 75,129 (77,672) (2,543) Capital expenditures (10,545) 10,545 - (13,480) 13,480 -Postretirement related changes - (1,704) (1,704) - 14,600 14,600 Support/investment (71,221) 74,438 3,217 (79,534) 79,199 (335)
Total other changes in net assets (104,503) 104,096 (407) (121,070) 132,792 11,722
INCREASE (DECREASE) IN NET ASSETS (2,222) 105,199 102,977 (1,833) 164,218 162,385
NET ASSETS (DEFICIT) AT THE BEGINNING OF THE YEAR (31,659) 1,609,371 1,577,712 (29,826) 1,445,153 1,415,327
NET ASSETS (DEFICIT) AT THE END OF THE YEAR (33,881)$ 1,714,570$ 1,680,689$ (31,659)$ 1,609,371$ 1,577,712$
20172018
Consolidated Statements of Unrestricted ActivitiesYears Ended June 30, 2018 and 2017
(in thousands)
The accompanying notes are an integral part of these consolidated financial statements.
4

Total Temporarily Permanently Total Temporarily PermanentlyUnrestricted Restricted Restricted Total Unrestricted Restricted Restricted Total
REVENUEStudent tuition and fees 1,067,678$ -$ -$ 1,067,678$ 1,019,581$ -$ -$ 1,019,581$
Less: University funded scholarships (317,030) - - (317,030) (289,744) - - (289,744) Net student tuition and fees 750,648 - - 750,648 729,837 - - 729,837
Grants and contractsProgram funds 170,326 - - 170,326 161,924 - - 161,924 Indirect cost recoveries 31,362 - - 31,362 29,323 - - 29,323
Investment income, net 37,740 26,121 - 63,861 97,250 55,494 - 152,744 Investment real property rents and appreciation 128,704 - - 128,704 112,683 - - 112,683 Change in value of split-interest agreements 2 990 1,018 2,010 6 1,643 1,378 3,027 Auxiliary enterprises 118,733 - - 118,733 116,102 - - 116,102 Contributions, net 21,061 15,756 4,123 40,940 18,489 32,592 2,139 53,220 Net assets released from restrictions 76,436 (76,667) 231 - 59,685 (60,120) 435 - Medical education agreements 64,854 - - 64,854 63,792 - - 63,792 Other income 31,465 - 20 31,485 38,470 - 24 38,494
Total revenue 1,431,331 (33,800) 5,392 1,402,923 1,427,561 29,609 3,976 1,461,146
EXPENSESSalaries and wages 576,590 - - 576,590 556,998 - - 556,998 Fringe benefits 125,363 - - 125,363 119,866 - - 119,866 Purchased services 252,854 - - 252,854 233,449 - - 233,449 Supplies 15,610 - - 15,610 14,345 - - 14,345 Equipment 14,105 - - 14,105 16,239 - - 16,239 Bad debt 3,610 - - 3,610 1,731 - - 1,731 Occupancy 138,527 - - 138,527 131,853 - - 131,853 Investment real property expense 35,969 - - 35,969 34,397 - - 34,397 Scholarships and fellowships 16,941 - - 16,941 16,311 - - 16,311 Communications 4,064 - - 4,064 4,312 - - 4,312 Travel and training 26,920 - - 26,920 25,856 - - 25,856 Interest 62,329 - - 62,329 60,147 - - 60,147 Debt extinguishment costs 14,042 - - 14,042 23,154 - - 23,154 Other 41,023 - - 41,023 38,240 - - 38,240
Total expenses 1,327,947 - - 1,327,947 1,276,898 - - 1,276,898
OTHER INCREASES (DECREASES) IN NET ASSETSEndowment support (1,920) 882 1,038 - (2,543) 75 2,468 - Postretirement related changes (1,704) - - (1,704) 14,600 - - 14,600 Support/investment 3,217 (4,122) 905 - (335) (1,512) 1,847 -
Total other changes in net assets (407) (3,240) 1,943 (1,704) 11,722 (1,437) 4,315 14,600
102,977 (37,040) 7,335 73,272 162,385 28,172 8,291 198,848
NET ASSETS AT THE BEGINNING OF THE YEAR 1,577,712 464,887 279,246 2,321,845 1,415,327 436,715 270,955 2,122,997
NET ASSETS AT THE END OF THE YEAR 1,680,689$ 427,847$ 286,581$ 2,395,117$ 1,577,712$ 464,887$ 279,246$ 2,321,845$
INCREASE (DECREASE) IN NET ASSETS
Consolidated Statements of ActivitiesYears Ended June 30, 2018 and 2017
(in thousands)
2018 2017
The accompanying notes are an integral part of these consolidated financial statements.
5
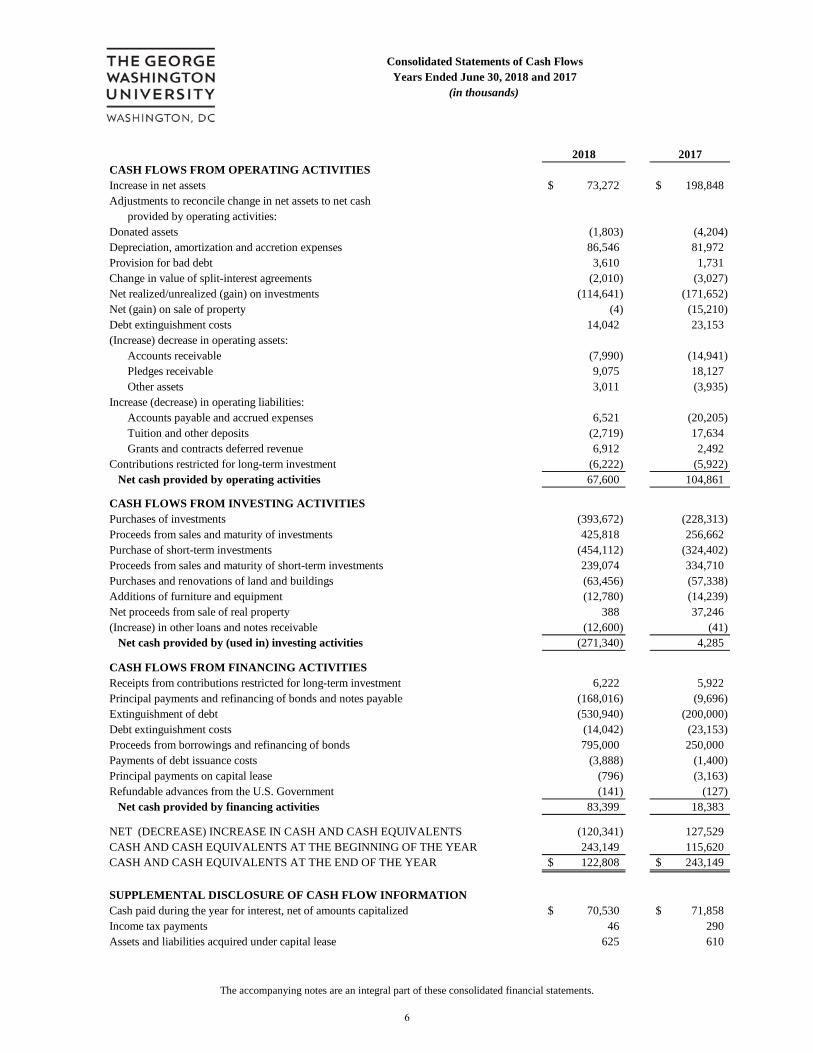
2018 2017CASH FLOWS FROM OPERATING ACTIVITIESIncrease in net assets 73,272$ 198,848$ Adjustments to reconcile change in net assets to net cash
provided by operating activities:Donated assets (1,803) (4,204) Depreciation, amortization and accretion expenses 86,546 81,972 Provision for bad debt 3,610 1,731 Change in value of split-interest agreements (2,010) (3,027) Net realized/unrealized (gain) on investments (114,641) (171,652) Net (gain) on sale of property (4) (15,210) Debt extinguishment costs 14,042 23,153 (Increase) decrease in operating assets:
Accounts receivable (7,990) (14,941) Pledges receivable 9,075 18,127 Other assets 3,011 (3,935)
Increase (decrease) in operating liabilities:Accounts payable and accrued expenses 6,521 (20,205) Tuition and other deposits (2,719) 17,634 Grants and contracts deferred revenue 6,912 2,492
Contributions restricted for long-term investment (6,222) (5,922) Net cash provided by operating activities 67,600 104,861
CASH FLOWS FROM INVESTING ACTIVITIESPurchases of investments (393,672) (228,313) Proceeds from sales and maturity of investments 425,818 256,662 Purchase of short-term investments (454,112) (324,402) Proceeds from sales and maturity of short-term investments 239,074 334,710 Purchases and renovations of land and buildings (63,456) (57,338) Additions of furniture and equipment (12,780) (14,239) Net proceeds from sale of real property 388 37,246 (Increase) in other loans and notes receivable (12,600) (41) Net cash provided by (used in) investing activities (271,340) 4,285
CASH FLOWS FROM FINANCING ACTIVITIESReceipts from contributions restricted for long-term investment 6,222 5,922 Principal payments and refinancing of bonds and notes payable (168,016) (9,696) Extinguishment of debt (530,940) (200,000) Debt extinguishment costs (14,042) (23,153) Proceeds from borrowings and refinancing of bonds 795,000 250,000 Payments of debt issuance costs (3,888) (1,400) Principal payments on capital lease (796) (3,163) Refundable advances from the U.S. Government (141) (127) Net cash provided by financing activities 83,399 18,383
NET (DECREASE) INCREASE IN CASH AND CASH EQUIVALENTS (120,341) 127,529 CASH AND CASH EQUIVALENTS AT THE BEGINNING OF THE YEAR 243,149 115,620 CASH AND CASH EQUIVALENTS AT THE END OF THE YEAR 122,808$ 243,149$
SUPPLEMENTAL DISCLOSURE OF CASH FLOW INFORMATIONCash paid during the year for interest, net of amounts capitalized 70,530$ 71,858$ Income tax payments 46 290Assets and liabilities acquired under capital lease 625 610
Consolidated Statements of Cash FlowsYears Ended June 30, 2018 and 2017
(in thousands)
The accompanying notes are an integral part of these consolidated financial statements.
6

THE GEORGE WASHINGTON UNIVERSITY NOTES TO THE CONSOLIDATED FINANCIAL STATEMENTS
7
Note 1 - The University
The George Washington University (the University) is a private, not-for-profit institution of higher education based in Washington, D.C. The University provides education and training services, primarily for students at the undergraduate, graduate, and postdoctoral levels, and performs research, training, and other services under grants, contracts, and similar agreements with sponsoring organizations, primarily departments and agencies of the U.S. Government. The University’s revenues are predominantly derived from student tuition, room, and other fees. The University is exempt from federal income taxes under Section 501(c) (3) of the Internal Revenue Code.
Note 2 - Summary of Significant Accounting Policies
Basis of Presentation and Principles of Consolidation
The consolidated financial statements have been prepared on the accrual basis of accounting in conformity with accounting principles generally accepted in the United States of America (GAAP) and reporting practices prescribed for not-for-profit entities. The consolidated financial statements include the accounts of the George Washington University and its wholly owned subsidiaries. Significant intercompany transactions and balances have been eliminated.
Cash and Cash Equivalents
Highly liquid financial instruments with original maturities at dates of purchase of three months or less are classified as cash equivalents and include U.S. Treasury securities, collateralized interest-bearing repurchase agreements carried at fair value, and other short-term, highly liquid investments carried at fair value. Cash and cash equivalents held by endowment fund investment managers are included in Investments. Purchases and sales of investment cash equivalents are netted for reporting on the Consolidated Statements of Cash Flows.
Aggregate cash and cash equivalent balances maintained at financial institutions exceed the amount guaranteed by federal agencies and therefore bear risk. The University has not experienced any loss due to this risk.
Contributions
Contributions, including unconditional promises to give, are recognized as revenues in the period received. Contributions received for capital projects, endowment funds, or student loans and contributions under split-interest agreements or perpetual trusts are reported as capital and investing unrestricted revenues, temporarily restricted revenues, or permanently restricted revenues according to donor-imposed restrictions. All other contributions are reported as operating revenues unless the donor has otherwise restricted the contributions. Conditional promises to give are not recognized until the conditions on which they depend are substantially met. Contributions of assets other than cash are recorded at their estimated fair value at the date of the gift. Promises to give with payments to be received after one year from the date of the financial statements are discounted at a risk-adjusted rate approximating the market rates for unsecured borrowing as required by fair value measurement accounting standards. Allowance is made for uncollectible contributions based upon management’s judgment after analysis of the creditworthiness of the donors, past collection experience, and other relevant factors.

THE GEORGE WASHINGTON UNIVERSITY NOTES TO THE CONSOLIDATED FINANCIAL STATEMENTS
8
Investments and Investment Income
Investments include both endowment and non-endowment investments owned by the University and are further detailed in Note 5. Investment income (loss) is included in unrestricted revenues, temporarily restricted revenues, or permanently restricted revenues depending on donor restrictions.
Investments known as split-interest agreements are unique to not-for-profit organizations. These are agreements where donors enter into trust or other arrangements under which the University receives benefits shared with other beneficiaries. The assets associated with these arrangements are recorded at their fair value and are included in Investments (Note 5). Once liabilities to other beneficiaries are satisfied, the residual assets are transferred to the University.
The University manages the following types of arrangements. The associated liabilities to beneficiaries in these arrangements are calculated based on various actuarial assumptions and are recorded in Accounts payable and accrued expenses (Note 9).
Gift annuities consist of non-trust assets donated to the University in exchange for a fixed paymentfor the life of the beneficiary(s).
Pooled life income funds are donated funds received by the University in which the donor receivesor assigns a life income. The funds are pooled by the University and are assigned a specific numberof units in the pool. The beneficiary(s) is paid the amount of income earned on the donor's assignedunits.
Charitable remainder trusts consist of trust assets donated to the University in exchange for apercentage of fair value-based payment for the life of the beneficiary(s).
The University is a beneficiary of trusts held by third parties which include:
Perpetual trusts where the University has an irrevocable right to income on trust assets in perpetuity,but never receives the assets held in trust. These beneficial interests are shown at fair value of theunderlying assets, which approximates the discounted present value of the anticipated cash flows.
Charitable remainder trusts similar to those described above, except that the University does not holdthe assets as trustee. These beneficial interests are shown at present value which is calculated usingthe fair value of the trust assets at the measurement date, discounted based on various actuarialassumptions impacting the timing of cash flows to the University.
Accounts Receivable
Accounts receivable are reported at net realizable value. Accounts are written off against the allowance for doubtful accounts when determined to be uncollectible based upon management’s assessment of individual accounts. The allowance for doubtful accounts is estimated based on the University’s historical experience and periodic review of individual accounts. The University does not accrue interest on these accounts.
Loans Receivable and Refundable Advances
Loans receivable are primarily related to federal student financial aid programs and are carried at face value, less an allowance for doubtful accounts of $0.47 million at June 30, 2018 and 2017. The allowance for doubtful accounts is estimated based on the University’s historical experience and periodic review of individual accounts. The majority of the University’s loans receivable represents amounts due under federally guaranteed programs; therefore no reserves are recorded for the federal portion. Generally, payment on loans receivable commences upon graduation and can extend up to 10 years. These loans carry interest rates

THE GEORGE WASHINGTON UNIVERSITY NOTES TO THE CONSOLIDATED FINANCIAL STATEMENTS
9
ranging from 3% to 7%. The carrying value of loans receivable approximates fair value. Funds provided by the U.S. Government under the Federal Perkins and Health Professions Student Loan Programs are loaned to qualified students. Health Profession funds may be loaned again after collection. The Perkins Loan program was not reauthorized by the federal government in September 2017, and therefore, collected funds will be returned to the U.S. Government and the University proportionate to their original funding. These federal loan programs have cash restricted as to their use of $3.1 million and $2.8 million as of June 30, 2018 and 2017, respectively.
Property, Plant, and Equipment
Land, buildings, furniture, and equipment are stated at cost or fair value at the date of donation. Buildings, furniture, and equipment are depreciated on a straight-line basis over the estimated useful life of the assets. Interest cost incurred during construction is capitalized as part of the cost of capital projects. Equipment under capital leases is included in assets and liabilities at the value of future minimum lease payments discounted by the University’s incremental borrowing rate. Property acquired on federally funded awards that meets the University’s capitalization criteria is recorded as an asset of the University and depreciated in accordance with the University's depreciation policy. These assets are disposed of as prescribed by relevant federal requirements at the conclusion of the award.
Net Asset Classes
Net assets and revenues, gains, and losses are classified based on the existence or absence of donor-imposed restrictions. The net assets of the University are classified and reported as follows:
Permanently restricted - Net assets subject to donor-imposed restrictions that stipulate they be maintained permanently by the University. Generally, the donors of these assets permit the University to use all or part of the income earned on related investments for general or specific purposes.
Temporarily restricted - Net assets subject to donor-imposed restrictions that may be or will be met either by actions of the University and/or by the passage of time.
Unrestricted - Net assets that are not subject to donor-imposed restrictions.
Revenues from sources other than contributions or investment income are reported as increases in unrestricted net assets. Contributions are reported as increases in the appropriate category of net assets, except contributions that impose restrictions that are met in the same fiscal year they are received are included in unrestricted revenues. Expenses are reported as decreases in unrestricted net assets. Gains and losses on investments are reported as increases or decreases in unrestricted net assets unless their use is restricted by explicit donor stipulations or by law. Expirations of temporary restrictions recognized on net assets, i.e., the donor-stipulated purpose has been fulfilled and/or the stipulated time period has elapsed, are reported as releases from temporarily restricted net assets to unrestricted net assets. Temporary restrictions on gifts to acquire or construct long-lived assets are considered met in the period in which the assets are acquired.
The University follows a practice of classifying its revenues and expenses within unrestricted net assets as capital and investing or operating. Items classified as capital and investing include accounts and transactions related to endowment funds and plant facilities, except for donor-restricted contributions to endowment principal and plant. Substantially all of the net assets classified as unrestricted in the Consolidated Statements of Financial Position have been invested in property and equipment, consolidated endowment pool, or are designated for specific uses.

THE GEORGE WASHINGTON UNIVERSITY NOTES TO THE CONSOLIDATED FINANCIAL STATEMENTS
10
Other Increases (Decreases) In Net Assets
Debt service and mandatory purposes - Transfers from operating net assets to capital and investing net assets are for principal and interest payments.
Endowment support - Transfers of investment income provide support for operating activities based on the spending policy of the Board of Trustees.
Capital expenditures - Transfers from operating net assets to capital and investing net assets are for equipment purchases.
Postretirement related changes - Recognition in unrestricted net assets of changes in the actuarial liability for postretirement benefit plans other than net periodic benefit cost, as well as amortization of changes recognized in prior years from unrestricted net assets to expenses as a component of the net periodic benefit cost.
Support/investment - Other transfers among operating net assets, capital and investing net assets, and temporarily/permanently restricted net assets.
Tuition, Fees, and Scholarships
The University recognizes unrestricted revenues from student tuition and fees within the fiscal year in which the academic term is predominantly conducted. Deferred tuition and fees are included in Deferred revenue: Tuition and other deposits in the Consolidated Statements of Financial Position.
Tuition discounts in the form of scholarships and grants-in-aid, including those funded by the endowment, research funds, and gifts, have been reported as a reduction of tuition revenues. A tuition discount represents the difference between the stated charge for tuition and fees and the amount that is billed to the student and/or third parties making payments on behalf of the student. Cash payments to students, excluding compensation, are reported as Scholarships and fellowships expense in the Consolidated Statements of Activities.
Grants and Contracts
The University recognizes grants and contracts sponsored research agreements revenue as it is earned in accordance with the agreement, generally when expenditures are incurred. Any funding received in advance of expenditure is recorded as deferred revenue on the Consolidated Statements of Financial Position.
Occupancy
The University uses the category of Occupancy to group costs associated with depreciation and maintenance of physical property. Occupancy expense includes depreciation, rent, utilities, insurance, taxes, repairs, and maintenance.
Use of Estimates
The preparation of financial statements in conformity with GAAP requires management to make estimates and assumptions that affect the reported amounts and disclosures at the date of the financial statements. Actual results could differ from these estimates.

THE GEORGE WASHINGTON UNIVERSITY NOTES TO THE CONSOLIDATED FINANCIAL STATEMENTS
11
Recent Accounting Standards
ASU 2014-09, Revenue from Contracts with Customers, will be effective for the University on July 1, 2018. This standard requires entities to recognize revenue from customers when or as performance obligations of the contract are met. The adoption of this standard will increase deferred revenue liability and reduce opening net assets by approximately $25 million.
ASU 2018-08, Clarifying the Scope and the Accounting Guidance for Contributions Received and Contributions Made, will be effective for the University on July 1, 2018. This update assists not-for-profit entities in evaluating whether transactions should be accounted for as contributions or as exchange transactions, and in determining whether a contribution is conditional. The adoption of this standard will not have a material effect on the University’s financial statements.
ASU 2016-14, Presentation of Financial Statements for Not-for-Profit Entities, will be effective for the University on July 1, 2018. The main requirements of the guidance include (a) presenting only two classes of net assets now entitled “net assets without donor restrictions” and “net assets with donor restrictions”, (b) classifying underwater amounts of donor-restricted endowment funds as “net assets with donor restrictions”, (c) use of placed-in-service approach for expiration of restrictions on capital gifts, (d) presentation of investment return net of expenses, and (e) disclosures of composition of net assets, liquidity, and expenses by both their natural and functional classification.
ASU 2016-02, Leases, will be effective for the University on July 1, 2019. This standard requires recognition of rights and obligations arising from lease contracts, including existing and new arrangements, as assets and liabilities on the balance sheet. The University is currently evaluating the effect of adoption on the financial statements.
Note 3 – Accounts Receivable
(in thousands) 2018 2017
Grants and contracts 37,072$ 35,218$ Student tuition and fee accounts 24,882 23,641 Due from affiliation agreements 3,260 4,008 Due from hospital limited partnership 6,950 4,502 Other 9,423 9,392 Allowance for doubtful accounts (3,135) (2,679) Total 78,452$ 74,082$
June 30

THE GEORGE WASHINGTON UNIVERSITY NOTES TO THE CONSOLIDATED FINANCIAL STATEMENTS
12
Note 4 – Pledges Receivable
(in thousands) 2018 2017
Unconditional promises expected to be collected in:Less than one year 42,823$ 38,985$ One year to five years 11,847 32,400 Over five years 1,029 1,218
Subtotal 55,699 72,603 Allowance for uncollectible pledges (6,910) (12,910) Unamortized discount to present value (1,418) (3,247)
Total 47,371$ 56,446$
June 30
Pledges receivable expected to be fulfilled more than one year from the date of the financial statements are recorded at fair value at the date of the gift, discounted at 3.95% - 4.59% with the discount amortized over the life of the pledge.
At June 30, 2018 and 2017, the University had received notification of outstanding bequest intentions and certain conditional promises to give of approximately $206 million and $178 million, respectively. These intentions and conditional promises are not recognized as assets and, if received, will generally be restricted for specific purposes stipulated by the donors, primarily endowments for faculty support, scholarships, or general operating support of a particular department or division of the University.

THE GEORGE WASHINGTON UNIVERSITY NOTES TO THE CONSOLIDATED FINANCIAL STATEMENTS
13
Note 5 – Investments
(in thousands) 2018 2017
Cash and cash equivalents 93,332$ 42,191$ Fixed income: Asset-backed securities 41,574 44,294 Corporate debt securities 32,269 43,403 Government debt securities 96,049 127,042 Other 7,233 4,419 Global equity 451,547 387,856 Hedge funds 193,321 146,508
` Private equity 139,570 169,449 Real estate 1,032,753 1,027,487 Split-interest agreements: GW as trustee 13,679 13,851 Trusts held by others 48,409 46,633 Deferred compensation plan assets 50,399 44,790 Other 54,036 54,901 Net pending trades - 13,092 Unrealized (loss) on open futures contracts (219) (64) Total 2,253,952$ 2,165,852$
Investment income, net:(in thousands) 2018 2017
Interest and dividends 15,343$ 10,854$ Net gain on investments carried at fair value 37,145 127,780 Net gain on investment carried at other than fair value 16,899 18,501 Administrative expenses (5,526) (4,391) Total 63,861$ 152,744$
Investment real property rents and appreciation:(in thousands) 2018 2017
Real property rents 49,975$ 55,603$ Net unrealized appreciation 78,729 57,080
128,704$ 112,683$
June 30
June 30
June 30
The University enters into derivative transactions for market risk management purposes only. The University has not and will not enter into any derivative transaction for speculative or profit generating purposes. As of June 30, 2018 and 2017, the fair value of the derivatives was not material.
The University holds a 28.56% interest in the Columbia Plaza Limited Partnership, whose income and distributions are accounted for under the equity method, which is included in Real estate at $23.6 million and $23.5 million as of June 30, 2018 and 2017, respectively. The University also holds a 20% interest in District
THE GEORGE WASHINGTON UNIVERSITY NOTES TO THE CONSOLIDATED FINANCIAL STATEMENTS
14
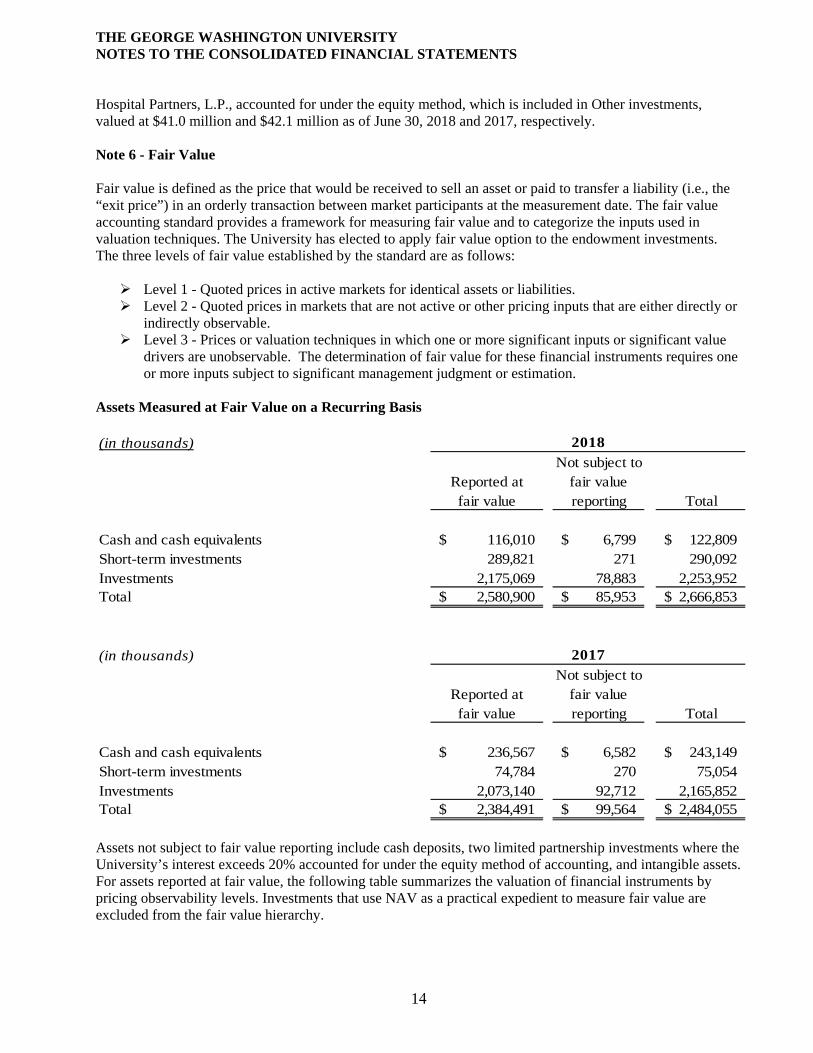
Hospital Partners, L.P., accounted for under the equity method, which is included in Other investments, valued at $41.0 million and $42.1 million as of June 30, 2018 and 2017, respectively.
Note 6 - Fair Value
Fair value is defined as the price that would be received to sell an asset or paid to transfer a liability (i.e., the “exit price”) in an orderly transaction between market participants at the measurement date. The fair value accounting standard provides a framework for measuring fair value and to categorize the inputs used in valuation techniques. The University has elected to apply fair value option to the endowment investments. The three levels of fair value established by the standard are as follows:
Level 1 - Quoted prices in active markets for identical assets or liabilities. Level 2 - Quoted prices in markets that are not active or other pricing inputs that are either directly or
indirectly observable. Level 3 - Prices or valuation techniques in which one or more significant inputs or significant value
drivers are unobservable. The determination of fair value for these financial instruments requires oneor more inputs subject to significant management judgment or estimation.
Assets Measured at Fair Value on a Recurring Basis
(in thousands)Not subject to
Reported at fair valuefair value reporting Total
Cash and cash equivalents 116,010$ 6,799$ 122,809$ Short-term investments 289,821 271 290,092 Investments 2,175,069 78,883 2,253,952 Total 2,580,900$ 85,953$ 2,666,853$
(in thousands)Not subject to
Reported at fair valuefair value reporting Total
Cash and cash equivalents 236,567$ 6,582$ 243,149$ Short-term investments 74,784 270 75,054 Investments 2,073,140 92,712 2,165,852 Total 2,384,491$ 99,564$ 2,484,055$
2018
2017
Assets not subject to fair value reporting include cash deposits, two limited partnership investments where the University’s interest exceeds 20% accounted for under the equity method of accounting, and intangible assets. For assets reported at fair value, the following table summarizes the valuation of financial instruments by pricing observability levels. Investments that use NAV as a practical expedient to measure fair value are excluded from the fair value hierarchy.

THE GEORGE WASHINGTON UNIVERSITY NOTES TO THE CONSOLIDATED FINANCIAL STATEMENTS
15
TotalAs of June 30, 2018 (in thousands) Level 1 Level 2 Level 3 Fair Value
Cash equivalents at fair value $ - $ 116,010 $ - $ - 116,010$ Short-term investments at fair value - 289,821 - 289,821 Investments:Cash and cash equivalents - 93,331 1 - 93,332 Fixed income:
Asset-backed securities 41,574 - - - 41,574 Corporate debt securities 16,849 - 15,420 - 32,269 Government debt securities 30,752 65,297 - - 96,049 Other 3,924 2,798 511 - 7,233
Global equity 300,010 150,268 - - 450,278 Hedge funds 193,321 - - - 193,321 Private equity 139,570 - - - 139,570 Real estate - 98 - 1,009,077 1,009,175 Split-interest agreements: - - - - -
GW as trustee - 13,679 - - 13,679 Trusts held by others - - - 48,409 48,409
Deferred compensation plan assets 33,212 10,036 7,151 50,399 Unrealized loss-open futures contracts - (219) - - (219) Total investments at fair value 726,000 358,464 25,968 1,064,637 2,175,069
Total assets at fair value $ 726,000 $ 764,295 $ 25,968 $ 1,064,637 $ 2,580,900
TotalAs of June 30, 2017 (in thousands) Level 1 Level 2 Level 3 Fair Value
Cash equivalents at fair value $ - $ 236,567 $ - $ - $ 236,567 Short-term investments at fair value - 74,784 - - 74,784 Investments:Cash and cash equivalents - 42,190 1 - 42,191 Fixed income:
Asset-backed securities 44,294 - - - 44,294 Corporate debt securities 17,229 - 26,174 - 43,403 Government debt securities 31,808 95,234 - - 127,042 Other 1,656 2,334 429 - 4,419
Global equity 260,603 126,047 - - 386,650 Hedge funds 146,508 - - - 146,508 Private equity 169,449 - - - 169,449 Real estate - - - 1,003,974 1,003,974 Split-interest agreements:
GW as trustee - 13,851 - - 13,851 Trusts held by others - - - 46,633 46,633
Deferred compensation plan assets - 28,354 10,133 6,303 44,790 Unrealized loss-open futures contracts - (64) - - (64) Total investments at fair value 671,547 307,946 36,737 1,056,910 2,073,140
Total assets at fair value $ 671,547 $ 619,297 $ 36,737 $ 1,056,910 $ 2,384,491
Classified in Fair Value HierarchyNAV
NAV Classified in Fair Value Hierarchy

THE GEORGE WASHINGTON UNIVERSITY NOTES TO THE CONSOLIDATED FINANCIAL STATEMENTS
16
The following estimates and assumptions were used to determine the fair value of each class of financial instruments listed above.
Cash, cash equivalents, and short-term investments - These investments include cash deposits ininvestment funds and short-term U.S. Treasury securities, money market accounts, and other short-term,highly liquid investments which are actively traded. Cash equivalents also include a bank repurchaseagreement valued at $5.3 million at June 30, 2018 and $5.2 million at June 30, 2017. The repurchaseagreement is collateralized by bank-owned securities issued by the U.S. Government or agencies thereof.Cash equivalents are priced using independent market prices in the primary trading market and areclassified as either Level 1 or Level 2.
Fixed income investments - These investments generally include asset-backed securities, convertiblebonds, corporate debt, investment funds with fixed income portfolios, and federal and municipal bondsand U.S. treasury notes. These assets are primarily valued using market prices, such as broker quotes, forthe same or similar instruments. Securities in this category that trade in less active markets and areredeemable in the near term are typically categorized as Level 2. Securities that are not publicly tradedmay be categorized as Level 1, 2 or 3 depending upon redemption terms. The fair value of investmentfunds not publicly traded has been estimated using the NAV of the funds which are calculated by theinvestment manager, and excluded from the fair value leveling table.
Global equity investments - These investments generally include separately held accounts, shares incommingled funds, and global equity holdings. Securities traded on an active exchange are priced usingunadjusted market quotes for identical assets and are classified as Level 1. The fair value of commingledfunds has been estimated using the NAV of the funds which are calculated by the investment manager,and excluded from the fair value leveling table.
Hedge funds - These investments generally include funds that invest in long and short positions, pursuinga diverse range of investment strategies. These investments are typically funds structured in a fund offunds vehicle. The objective of the fund of funds is to generate long-term capital appreciation. The fairvalue of these investments has been estimated using the NAV of the funds which are calculated by theinvestment manager, and excluded from the fair value leveling table.
Private equity - These investments generally include limited partnerships that are not publicly tradedand cannot be redeemed because the investments include restrictions that do not allow redemptionthrough maturity. The fair values of these investments have been estimated using the NAV of the funds,which are calculated by the investment manager and are excluded from the fair value leveling table. Thevaluation policies adopted by the manager are reviewed for propriety, consistency, compliance, andcompleteness. Inputs used to determine fair value are based upon the best available information providedby the investment manager and may incorporate management judgments and best estimates afterconsidering a variety of factors. For a small percentage of these investments, the manager reported NAVis prepared using non-U.S. GAAP, which may differ from fair value reported under U.S. GAAP. Wherematerial differences are known to exist, management bases its measurements on fair value estimatesobtained from the investment managers and/or third-party valuation advisors. Quantitative informationabout the significant unobservable inputs used in arriving at these fair value measurements is not readilyavailable. Changes to these inputs may result in significant changes to the fair value measurement andsuch changes could be material to the consolidated financial statements.

THE GEORGE WASHINGTON UNIVERSITY NOTES TO THE CONSOLIDATED FINANCIAL STATEMENTS
17
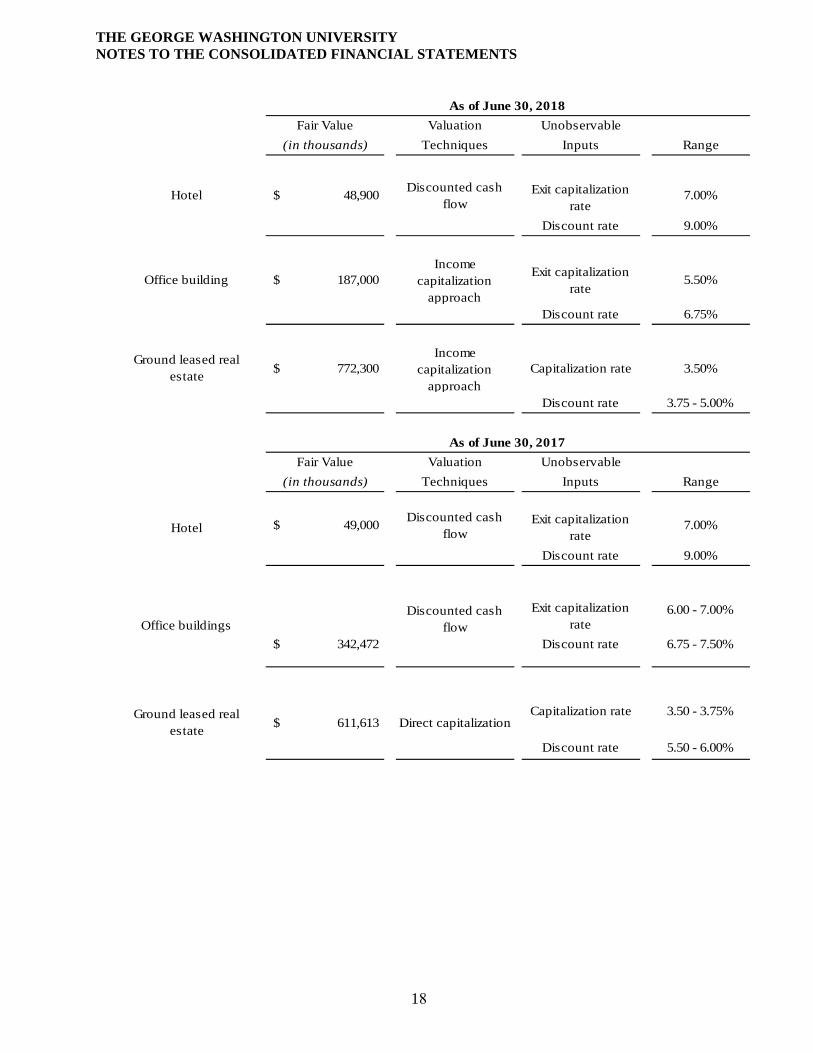
Real estate - Real estate investment properties are valued based on results from an independent appraisaland a professional third-party market valuation and are included in Level 3. To determine fair value incases where the two valuation methods yielded resulting values within 5%, the University adopted theaverage of the two values as the fair value. In cases where the variance between the two valuations wasgreater than 5%, the University considered the ranges of values provided by the valuation experts andmade certain assumptions with respect to future property cash flow expectations and risk pricing in theform of income capitalization rates and discount rates. Valuation adjustments represent management’sassumptions of how a market participant would view the properties, and are based on the range of futurecash flows and risk pricing presented in the appraisals and professional valuations. Different assumptionsor changes in future market conditions could significantly affect the estimated fair value and such changescould be material to the consolidated financial statements.
THE GEORGE WASHINGTON UNIVERSITY NOTES TO THE CONSOLIDATED FINANCIAL STATEMENTS
18
Fair Value Valuation Unobservable
(in thousands) Techniques Inputs Range
$ 48,900 Discounted cash
flowExit capitalization
rate7.00%
Discount rate 9.00%
$ 187,000 Income
capitalization approach
Exit capitalization rate
5.50%
Discount rate 6.75%
$ 772,300 Income
capitalization approach
Capitalization rate 3.50%
Discount rate 3.75 - 5.00%
Fair Value Valuation Unobservable
(in thousands) Techniques Inputs Range
$ 49,000 Discounted cash
flowExit capitalization
rate7.00%
Discount rate 9.00%
Exit capitalization rate
6.00 - 7.00%
$ 342,472 Discount rate 6.75 - 7.50%
Capitalization rate 3.50 - 3.75%
Discount rate 5.50 - 6.00%
Ground leased real estate
$ 611,613 Direct capitalization
As of June 30, 2018
As of June 30, 2017
Office buildings
Hotel
Hotel
Office building
Ground leased real estate
Discounted cash flow
THE GEORGE WASHINGTON UNIVERSITY NOTES TO THE CONSOLIDATED FINANCIAL STATEMENTS
19
Split-interest agreements - Assets received under split-interest agreements from donors where theUniversity serves as trustee are categorized as Level 1 based on the observability of pricing inputs to theunderlying investments held in those trusts. The University’s beneficial interests in perpetual trusts heldby third parties are categorized as Level 3. These are valued using a discounted cash flow analysis basedon the assumed timing and duration of those cash flows.
Deferred compensation plan assets - Assets purchased under deferred compensation arrangements includemutual funds, insurance company pooled separate accounts, and variable annuities and are categorized asLevel 1, Level 2, or Level 3 based on the observability of pricing inputs for the investment vehicles.Funds that are publicly traded are categorized as Level 1, while Level 2 assets include funds which arenot publicly traded, but have established NAV or are based on quoted prices for similar assets. Level 3assets include annuity contracts issued by an insurance company.
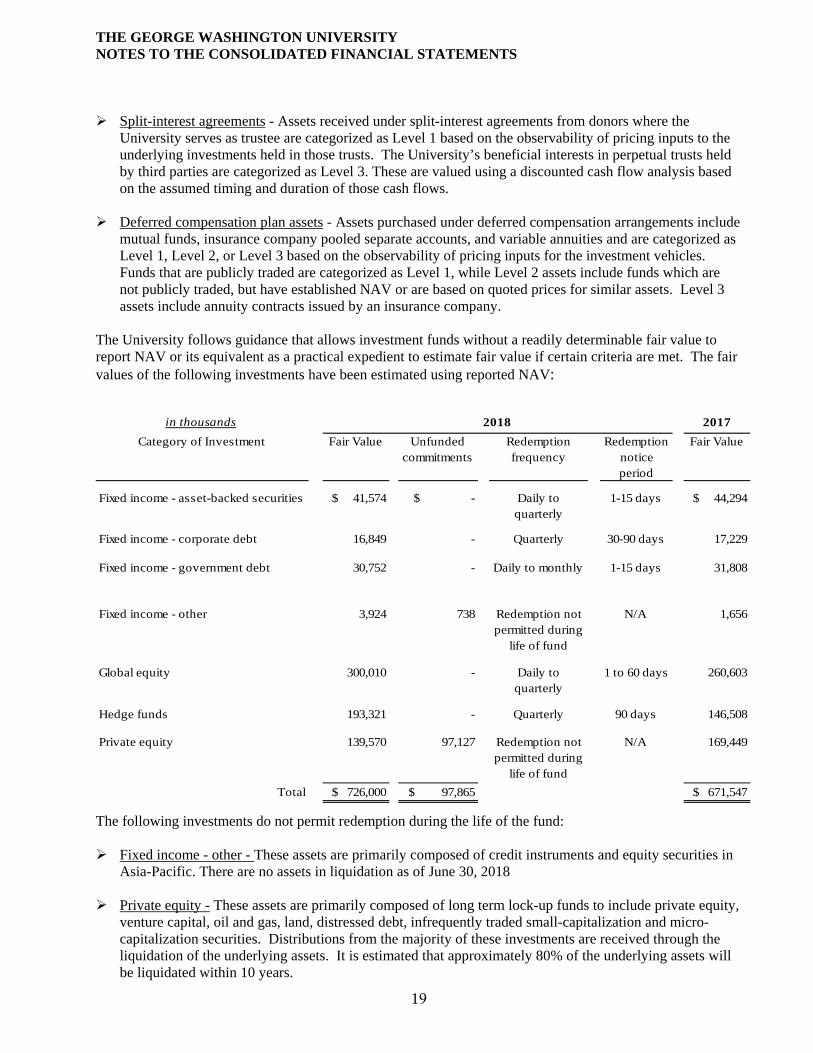
The University follows guidance that allows investment funds without a readily determinable fair value to report NAV or its equivalent as a practical expedient to estimate fair value if certain criteria are met. The fair values of the following investments have been estimated using reported NAV:
in thousands 2017
Category of Investment Fair Value Unfunded commitments
Redemption frequency
Redemption notice period
Fair Value
Fixed income - asset-backed securities $ 41,574 $ - Daily to quarterly
1-15 days $ 44,294
Fixed income - corporate debt 16,849 - Quarterly 30-90 days 17,229
Fixed income - government debt 30,752 - Daily to monthly 1-15 days 31,808
Fixed income - other 3,924 738 Redemption not permitted during
life of fund
N/A 1,656
Global equity 300,010 - Daily to quarterly
1 to 60 days 260,603
Hedge funds 193,321 - Quarterly 90 days 146,508
Private equity 139,570 97,127 Redemption not permitted during
life of fund
N/A 169,449
Total $ 726,000 $ 97,865 $ 671,547
2018
The following investments do not permit redemption during the life of the fund:
Fixed income - other - These assets are primarily composed of credit instruments and equity securities inAsia-Pacific. There are no assets in liquidation as of June 30, 2018
Private equity - These assets are primarily composed of long term lock-up funds to include private equity,venture capital, oil and gas, land, distressed debt, infrequently traded small-capitalization and micro-capitalization securities. Distributions from the majority of these investments are received through theliquidation of the underlying assets. It is estimated that approximately 80% of the underlying assets willbe liquidated within 10 years.

THE GEORGE WASHINGTON UNIVERSITY NOTES TO THE CONSOLIDATED FINANCIAL STATEMENTS
20
Changes in Level 3 Assets (in thousands)
Beginning of year
Net realized/unrealized
gains Purchases/additions Sales End of year
Total net gains included in earnings attributable to the
change in net unrealized gains for
assets still held at June 30, 2018
Real estate 1,003,974$ 75,555$ 657$ (71,109)$ 1,009,077$ 78,717$ Split- interest agreements - trusts held by others
46,633 1,419 535 (178) 48,409 1,419
Deferred compensation 6,303 96 752 7,151 -
1,056,910$ 77,070$ 1,944$ (71,287)$ 1,064,637$ 80,136$
(in thousands)
Beginning of year
Net realized/unrealized
gains Purchases/additions Sales End of year
Total net gains included in earnings attributable to the
change in net unrealized gains for
assets still held at June 30, 2017
Real estate 961,167 63,310 9,093 (29,596) 1,003,974 57,114 Split- interest agreements - trusts held by others
40,423 2,090 4,180 (60) 46,633 2,090
Deferred compensation 4,924 - 1,379 - 6,303 - 1,006,514$ 65,400$ 14,652$ (29,656)$ 1,056,910$ 59,204$
2018
2017
Level transfers are accounted for at the beginning of the reporting period and are typically the result of a change in the observability of significant valuation inputs. There were no level transfers in the years ended June 30, 2018 and 2017.
THE GEORGE WASHINGTON UNIVERSITY NOTES TO THE CONSOLIDATED FINANCIAL STATEMENTS
21
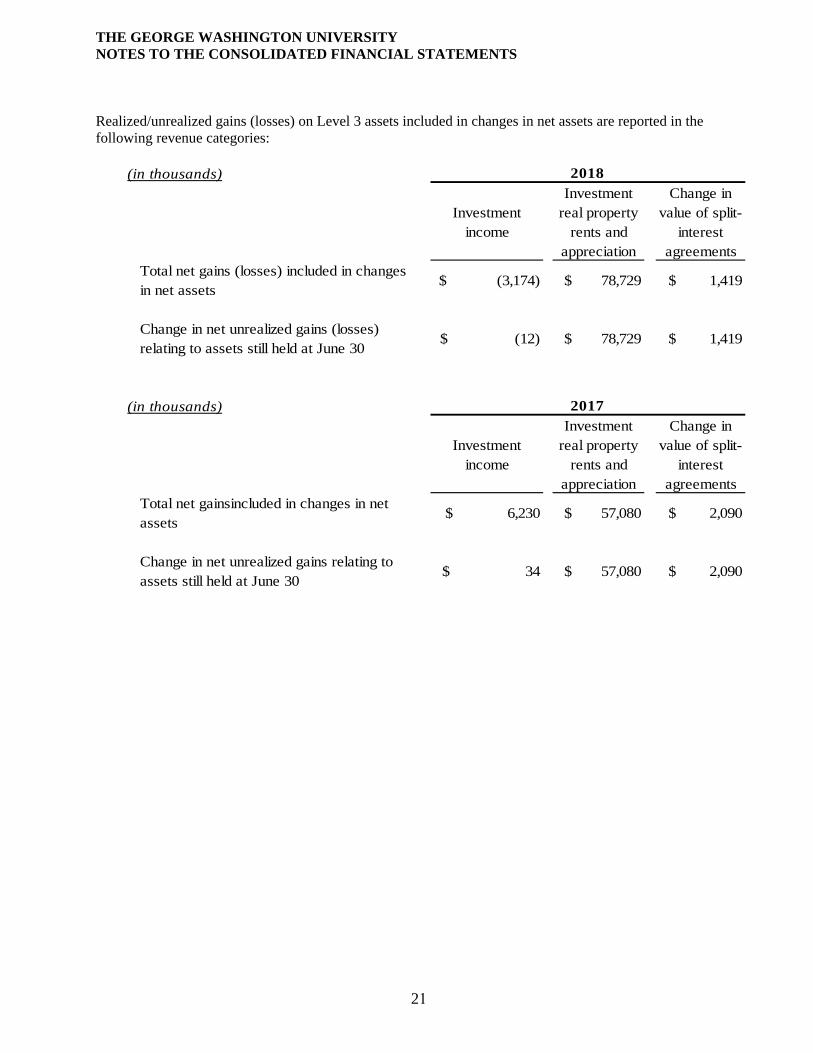
Realized/unrealized gains (losses) on Level 3 assets included in changes in net assets are reported in the following revenue categories:
(in thousands)
Investment income
Investment real property
rents and appreciation
Change in value of split-
interest agreements
Total net gains (losses) included in changes in net assets
$ (3,174) $ 78,729 $ 1,419
Change in net unrealized gains (losses) relating to assets still held at June 30
$ (12) $ 78,729 $ 1,419
(in thousands)
Investment income
Investment real property
rents and appreciation
Change in value of split-
interest agreements
Total net gainsincluded in changes in net assets
$ 6,230 $ 57,080 $ 2,090
Change in net unrealized gains relating to assets still held at June 30
$ 34 $ 57,080 $ 2,090
2018
2017

THE GEORGE WASHINGTON UNIVERSITY NOTES TO THE CONSOLIDATED FINANCIAL STATEMENTS
22
Note 7 - Endowment
The University’s Endowment (Endowment) consists of the unitized investment pool, investment real estate, and separately managed funds. The Endowment provides stable financial support to a wide variety of programs and activities in perpetuity, playing a critical role in enabling the University to achieve its mission. Programs supported by the Endowment include scholarships, chairs and professorships, fellowships, research activities, and libraries. The Endowment includes both donor-restricted endowment funds and funds designated by the Board of Trustees to function as endowments. Net assets associated with endowment funds, including Board-designated endowment funds, are classified and reported based on the existence or absence of donor-imposed restrictions.
Interpretation of Relevant Law
The University interprets the Uniform Prudent Management of Institutional Funds Act of 2007 (UPMIFA) as requiring the preservation of the fair value of the original gift as of the gift date of the donor-restricted endowment funds absent explicit donor stipulations to the contrary.
The University classifies as permanently restricted net assets (a) the original value of gifts donated to the permanent endowment, and (b) accumulations to the permanent endowment made in accordance with the direction of the applicable donor gift instrument. Appreciation on the donor-restricted endowment fund is classified as temporarily restricted net assets until those amounts are appropriated for expenditure by the University in a manner consistent with the standard of prudence prescribed by UPMIFA. The classification of temporarily restricted net assets includes funds donated to the University under an agreement permitting the Board to expend below the original value of the gift in periods of deficient earnings.
In accordance with UPMIFA, the University considers the following factors in making a determination to appropriate or accumulate donor-restricted endowment funds:
The preservation of the fund over time The purposes of the organization and the donor-restricted endowment fund General economic conditions including the possible effects of inflation and deflation The investment policies and expected total return from income and the appreciation of
investments Other resources of the organization
Endowment funds are categorized in the following net asset classes:
(in thousands)
Donor-restricted Endowment
Funds
Board-designated
Endowment Funds
Donor-restricted Endowment
Funds
Board-designated
Endowment Funds
Unrestricted $ (8,337) $ 1,253,818 $ (6,944) $ 1,196,133 Temporarily restricted 312,779 - 304,531 - Permanently restricted 240,550 - 235,427 - Total endowment funds $ 544,992 $ 1,253,818 $ 533,014 $ 1,196,133
2018 2017June 30

THE GEORGE WASHINGTON UNIVERSITY NOTES TO THE CONSOLIDATED FINANCIAL STATEMENTS
23
Changes in endowment funds by net asset classification are summarized as follows:
(in thousands)
UnrestrictedTemporarily Restricted
Permanently Restricted
Total
Endowment net assets, beginning of year $ 1,189,189 $ 304,531 $ 235,427 $ 1,729,147 Investment return: Investment income 17,338 5,030 - 22,368 Net appreciation (realized and unrealized)
82,322 24,114 - 106,436
Administrative expenses (2,204) (3,322) - (5,526)Total investment return 97,456 25,822 - 123,278 Contributions 5,575 7,962 4,086 17,623 Appropriations for expenditure (50,873) (31,854) - (82,727)Reinvestment of payout and internal transfers to endowments
4,134 6,318 1,037 11,489
Endowment net assets, end of year $ 1,245,481 $ 312,779 $ 240,550 $ 1,798,810
(in thousands)Unrestricted Temporarily
RestrictedPermanently Restricted
Total
Endowment net assets, beginning of year $ 1,086,617 $ 254,461 $ 229,200 $ 1,570,278 Investment return: Investment income 24,885 3,659 - 28,544 Net appreciation (realized and unrealized)
111,269 53,146 - 164,415
Administrative expenses (2,175) (2,216) - (4,391)Total investment return 133,979 54,589 - 188,568 Contributions 799 8,249 3,577 12,625 Appropriations for expenditure (49,282) (29,914) - (79,196)Reinvestment of payout and internal transfers to endowments 17,076 17,146 2,650 36,872 Endowment net assets, end of year $ 1,189,189 $ 304,531 $ 235,427 $ 1,729,147
2017
2018
Underwater Endowment Funds
From time to time, the fair value of assets associated with individual donor-restricted endowment funds may fall below the level that the donor or UPMIFA requires the University to retain as a fund of perpetual duration. In accordance with GAAP, deficiencies of this nature that are reported in unrestricted net assets were $8.3 million and $6.9 million as of June 30, 2018 and 2017, respectively.

THE GEORGE WASHINGTON UNIVERSITY NOTES TO THE CONSOLIDATED FINANCIAL STATEMENTS
24
Investment Objectives and Risk Parameters
The objective of the Endowment is to preserve and enhance the corpus of the endowment over time while also supporting the spending needs of the University. While it is the University’s goal to maintain purchasing power in practice, it is not the University’s accounting policy to accommodate purchasing power adjustments by classifying any additional portion of net appreciation as permanently restricted. The level of risk is measured by the annualized standard deviation of quarterly portfolio returns and is expected to be that incurred by university endowments of similar size with similar return objectives over a complete market cycle.
Strategies Employed for Achieving Objectives
Asset allocation policy is the cornerstone of a disciplined, consistent, and diversified approach to achieving the Endowment's investment objectives. The Endowment is broadly diversified across and within asset classes in order to minimize the impact of unexpected asset class- and security- specific adverse results and avoid excessive portfolio volatility. The Endowment's long-term target asset allocation is approved by the Subcommittee on Endowment and Investments of the Board of Trustees.
Spending Policy and How the Investment Objectives Relate to Spending Policy
The University's Board of Trustees establishes a spending policy that determines how endowment distributions are made. The spending policy is designed to balance current and future spending requirements by ensuring that a portion of investment return is distributed for current expenditure with the remainder reinvested to shield against inflation. The payout rate is approved annually by the Board of Trustees as part of the budget process. Currently, spending increases in the payout are capped by the change in the Consumer Price Index for the Washington, DC metro area, adjusted for new gifts received during the year. The annual payout is intended to approximate 5% of the average fair value of the endowment. In establishing this policy, the University considered the long-term expected return on its endowment.
Accumulated appreciation in endowment funds with donor-restricted corpus is classified as temporarily restricted net assets until appropriated for spending under the spending policy. At the time of appropriation, the amount of investment income necessary to satisfy the spending policy for the endowment fund and related purpose restrictions, if applicable, is reflected as a Net assets released from restriction, which reduces temporarily restricted net assets and increases unrestricted capital and investing net assets. Any excess of income earned over the approved spending amount is retained in unrestricted, temporarily restricted, or permanently restricted net assets depending on donor restrictions.

THE GEORGE WASHINGTON UNIVERSITY NOTES TO THE CONSOLIDATED FINANCIAL STATEMENTS
25
Note 8 - Property, plant, and equipment
(in thousands)2018 2017
Land 179,591$ 179,975$ Buildings 2,180,765 2,111,143 Construction in progress 22,757 26,250 Furniture and equipment 175,433 167,835 Library and historical research materials 69,540 74,230 Equipment under capital leases 9,298 9,917
2,637,384 2,569,350 Accumulated depreciation (929,305) (857,235) Total 1,708,079$ 1,712,115$
June 30
The value of Construction in progress includes the addition of capitalized interest of approximately $1.3 million for the year ended June 30, 2017. There was no capitalized interest for the year ended June 30, 2018.
Furniture and equipment expenditures (in thousands)
2018 2017
Capitalized 14,816$ 14,983$ Expensed 14,105 16,240 Total 28,921$ 31,223$
June 30
Depreciation expense
(in thousands)2018 2017
Buildings 59,926$ 56,002$ Furniture and equipment 23,163 23,098 Equipment under capital leases 1,505 1,773 Total 84,594$ 80,873$
June 30
THE GEORGE WASHINGTON UNIVERSITY NOTES TO THE CONSOLIDATED FINANCIAL STATEMENTS
26
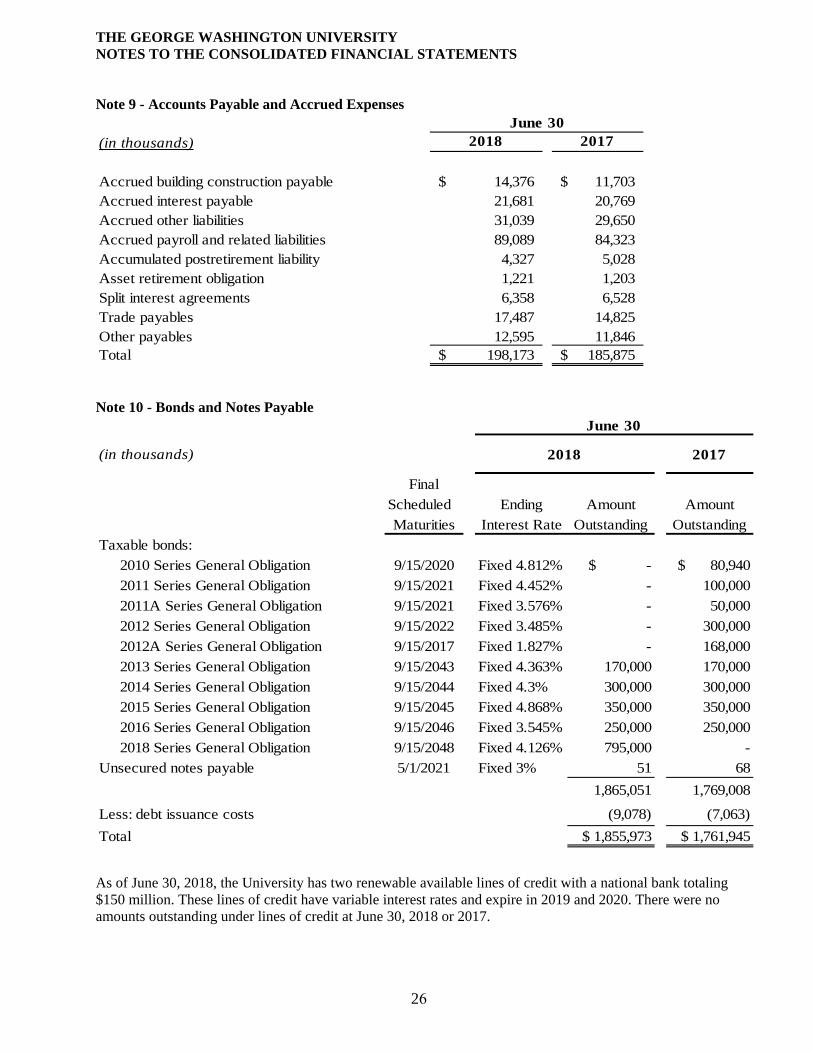
Note 9 - Accounts Payable and Accrued Expenses
Note 10 - Bonds and Notes Payable
Final
Scheduled Ending Amount Amount
Maturities Interest Rate Outstanding Outstanding
Taxable bonds:
2010 Series General Obligation 9/15/2020 Fixed 4.812% $ - $ 80,940
2011 Series General Obligation 9/15/2021 Fixed 4.452% - 100,000
2011A Series General Obligation 9/15/2021 Fixed 3.576% - 50,000
2012 Series General Obligation 9/15/2022 Fixed 3.485% - 300,000
2012A Series General Obligation 9/15/2017 Fixed 1.827% - 168,000
2013 Series General Obligation 9/15/2043 Fixed 4.363% 170,000 170,000
2014 Series General Obligation 9/15/2044 Fixed 4.3% 300,000 300,000
2015 Series General Obligation 9/15/2045 Fixed 4.868% 350,000 350,000
2016 Series General Obligation 9/15/2046 Fixed 3.545% 250,000 250,000
2018 Series General Obligation 9/15/2048 Fixed 4.126% 795,000 -
Unsecured notes payable 5/1/2021 Fixed 3% 51 68
1,865,051 1,769,008
Less: debt issuance costs (9,078) (7,063)
Total $ 1,855,973 $ 1,761,945
June 30
(in thousands) 2018 2017
As of June 30, 2018, the University has two renewable available lines of credit with a national bank totaling $150 million. These lines of credit have variable interest rates and expire in 2019 and 2020. There were no amounts outstanding under lines of credit at June 30, 2018 or 2017.
(in thousands) 2018 2017
Accrued building construction payable 14,376$ 11,703$ Accrued interest payable 21,681 20,769 Accrued other liabilities 31,039 29,650 Accrued payroll and related liabilities 89,089 84,323 Accumulated postretirement liability 4,327 5,028 Asset retirement obligation 1,221 1,203 Split interest agreements 6,358 6,528 Trade payables 17,487 14,825 Other payables 12,595 11,846 Total 198,173$ 185,875$
June 30

THE GEORGE WASHINGTON UNIVERSITY NOTES TO THE CONSOLIDATED FINANCIAL STATEMENTS
27
2018 bond issuance - In March 2018, the University issued $795 million in Series 2018 taxable, fixed-rate bonds at 4.126% with a maturity date of September 15, 2048. The bond proceeds were used to repay Series 2010, 2011, 2011A, and 2012 fixed-rate bonds totaling $521 million at average rate of 4.1%. The remaining portion of proceeds will be used for construction of student housing and to enhance the University’s academic mission.
Interest expense (in thousands) Expense category 2018 2017
Bonds/notes payable Interest $ 62,267 $ 60,032
Rental property Investment real property 10,985 10,382
Capital leases Interest 63 115
Total $ 73,315 $ 70,529
June 30
As of June 30, 2018, principal payments are due on bonds and note payable in accordance with the following schedule:
(in thousands)2019 $ 17 2020 17 2021 17 2022 - 2023 - Thereafter 1,865,000 Total $ 1,865,051
Fiscal Year Ending June 30

THE GEORGE WASHINGTON UNIVERSITY NOTES TO THE CONSOLIDATED FINANCIAL STATEMENTS
28
Note 11 - Commitments and Contingencies
The University is a defendant in certain pending civil suits. Based upon information currently available, management believes that any liability resulting therefrom will not materially affect the financial position or changes in net assets of the University.
Amounts received and expended by the University under various federal and state programs are subject to audit by government agencies. Management believes that adjustments, if any, which might result from such audits would not have a significant impact upon the consolidated financial position or changes in net assets of the University.
The University leases certain office, academic, residential, and administrative facilities under non-cancelable operating leases expiring at various dates through 2028. Rent expense under operating leases totaled $14.9 million and $15.7 million for the years ended June 30, 2018 and 2017, respectively. The aggregate minimum lease payments under these operating leases are as follows:
(in thousands)2019 12,263$ 2020 10,910 2021 10,983 2022 9,465 2023 9,414 Thereafter 18,181 Total 71,216$
Fiscal Year Ending June 30

THE GEORGE WASHINGTON UNIVERSITY NOTES TO THE CONSOLIDATED FINANCIAL STATEMENTS
29
Note 12 - Net Assets
Net assets and revenues, gains, and losses are classified based on the existence or absence of donor-imposed restrictions. Accordingly, net assets of the University are classified and reported as follows:
Permanently restricted - Net assets subject to donor-imposed restrictions that stipulate they be maintained permanently by the University. Generally, the donors of these assets permit the University to use all or part of the income earned on related investments for general or specific purposes.
Temporarily restricted - Net assets subject to donor-imposed restrictions that may be or will be met either by actions of the University and/or by the passage of time.
Temporarily and permanently restricted net assets consist of the following:
(in thousands)
Temporarily Permanently
Restricted Restricted
Building funds $ 2,173 $ - $ 23,263 $ -
Endowment funds:
Instruction & academic support 194,673 141,731 193,229 140,189
Student aid 95,812 86,622 88,773 83,586 Building funds 847 632 871 632
Other endowments 21,447 11,565 21,658 11,020
312,779 240,550 304,531 235,427
Loan funds - 3,816 - 3,812
Pledges:
Instruction & academic support 23,284 833 26,075 865
Student aid 12,252 391 14,129 383 Building funds 2,407 - 2,997 -
Other pledges 8,204 - 11,996 1
46,147 1,224 55,197 1,249
Split-interest agreements 28,239 27,799 27,720 26,903
Other 38,509 13,192 54,176 11,855
Total $ 427,847 $ 286,581 $ 464,887 $ 279,246
June 30
2018 2017
Temporarily Restricted
Permanently Restricted

THE GEORGE WASHINGTON UNIVERSITY NOTES TO THE CONSOLIDATED FINANCIAL STATEMENTS
30
Note 13 - Program and Supporting Activities Expense
(in thousands) 2018 2017
Instruction and academic support 746,025$ 706,209$ Research 205,820 193,102 Auxiliary enterprises 93,663 94,290 Student services 106,244 104,123 Institutional support 122,320 127,020 Independent operations 36,632 35,055 Student aid 17,243 17,099 Total 1,327,947$ 1,276,898$
June 30
Independent operations include expenses associated with the University’s investment real estate operations.
Costs related to the maintenance and operation of physical plant of $222.8 million and $214.8 million for the years ended June 30, 2018 and 2017, respectively, include depreciation of plant assets and interest on plant debt. These costs are allocated among program and supporting activities based upon periodic inventories of facility square foot usage. Interest on plant debt is allocated based on the percentage of actual interest expense attributable to properties.
Technology costs of $75.1 million and $71.9 million for the years ended June 30, 2018 and 2017, respectively, are allocated to other functions based upon relative benefits provided to academic and administrative users of the services. Technology costs include expenses associated with the operation and maintenance of administrative systems, campus network and telecommunications systems, computing labs, and related support for students and faculty.
Note 14 - Retirement Plans and Postretirement Benefits
Full-time and regular part-time faculty and staff are eligible for participation in the University’s defined contribution retirement program. The program is administered by the University. Independent vendors receive contributions for the plan for investment purposes and process distributions from the plan. Any present or future employee who completes two years of service becomes eligible to participate in the program.
The plan consists of both a noncontributory and a matching component. All eligible participants receive a contribution equal to 4% of their base salary. In addition, for those employees electing to participate in the matching portion of the program, the University contributes an additional amount equal to 1½% for each 1% of eligible compensation contributed by the employee, but not to exceed an amount equal to 6% of the participant’s eligible compensation. Participants are immediately fully vested in both types of the University’s contributions. Eligible participants direct the investment of contributions made on their behalf. For eligible participants who do not provide investment direction for contributions, the University contributions are invested in a Qualified Default Investment Alternative based on the expected year of retirement. University contributions to the retirement plan amounted to $39.2 million and $38.3 million for the years ended June 30, 2018 and 2017, respectively.

THE GEORGE WASHINGTON UNIVERSITY NOTES TO THE CONSOLIDATED FINANCIAL STATEMENTS
31
The University provides health care and life insurance benefits to certain retired employees. These employees become eligible for benefits after meeting age and service requirements. Effective June 1, 2017, the University updated its post retirement benefit plan to provide a Medicare health insurance exchange for retirees and long-term disability participants who are age 65 or older. A Retiree Health Savings Plan is provided for retirees who are under age 65 or are not Medicare eligible. The plan change reduced the accumulated postretirement liability by approximately $16 million. The University’s policy is to fund postretirement benefits as payments are made. Accounts payable and accrued expenses include accumulated postretirement liability of $4.3 million and $5.0 million as of June 30, 2018 and 2017, respectively.
Note 15 - Related Parties
MEDICAL FACULTY ASSOCIATES, INC.
The University has an Academic Affiliation Agreement with Medical Faculty Associates, Inc. (MFA). Under the agreement, MFA provides clinical teaching, research, and administrative services to the University which totaled approximately $34.6 million and $31.7 million the years ended June 30, 2018 and 2017, respectively. In addition, MFA leases certain office space, uses operational services, and provides academic support. Medical education agreements and other revenue of approximately $11.0 million and $11.2 million was reported for the years ended June 30, 2018 and 2017, respectively. In January 2016, the University provided a $20 million line of credit to the MFA.
Outstanding balances associated with the MFA are:
(in thousands) 2018 2017
Line of credit receivable 17,500$ 5,000$ Trade receivable 702 822 Trade payable (1,842) (2,693) Net receivable 16,360$ 3,129$
June 30
DISTRICT HOSPITAL PARTNERS, L.P.
The University has a 20% limited partnership interest in District Hospital Partners, L.P. (DHP), which owns and operates the GW Hospital and provides support to the University in developing and maintaining the medical academic and research programs. The University’s investment in DHP is recorded on the equity basis of accounting. The University’s share of the partnership’s profits for the years ended June 30, 2018 and 2017 was approximately $14.7 million and $16.0 million, respectively.
The University and DHP have executed several agreements, which reimburse or compensate the University for providing services or personnel to assist in the continued operations of the GW Hospital. Medical education agreements revenue of approximately $36.7 million and $34.8 million was reported for the years ended June 30, 2018 and 2017, respectively. The receivable from DHP for the unpaid balance of these services is $6.9 million and $4.5 million as of June 30, 2018 and 2017, respectively.
THE GEORGE WASHINGTON UNIVERSITY NOTES TO THE CONSOLIDATED FINANCIAL STATEMENTS
32
Note 16 – Subsequent events
The University has performed an evaluation of subsequent events through September 18, 2018, which is the date the financial statements were issued, noting no other events which affect the financial statements as of June 30, 2018.

Schedule of Expenditures of Federal Awards Notes to Schedule of Expenditures of Federal Awards and
Reports under the OMB Uniform Guidance
The George Washington UniversitySchedule of Expenditures of Federal Awards
For the year ended June 30, 2018
Federal Grantor/Pass‐Through Grantor/Cluster Title Federal CFDA Pass‐Through Total Federal Passed Through
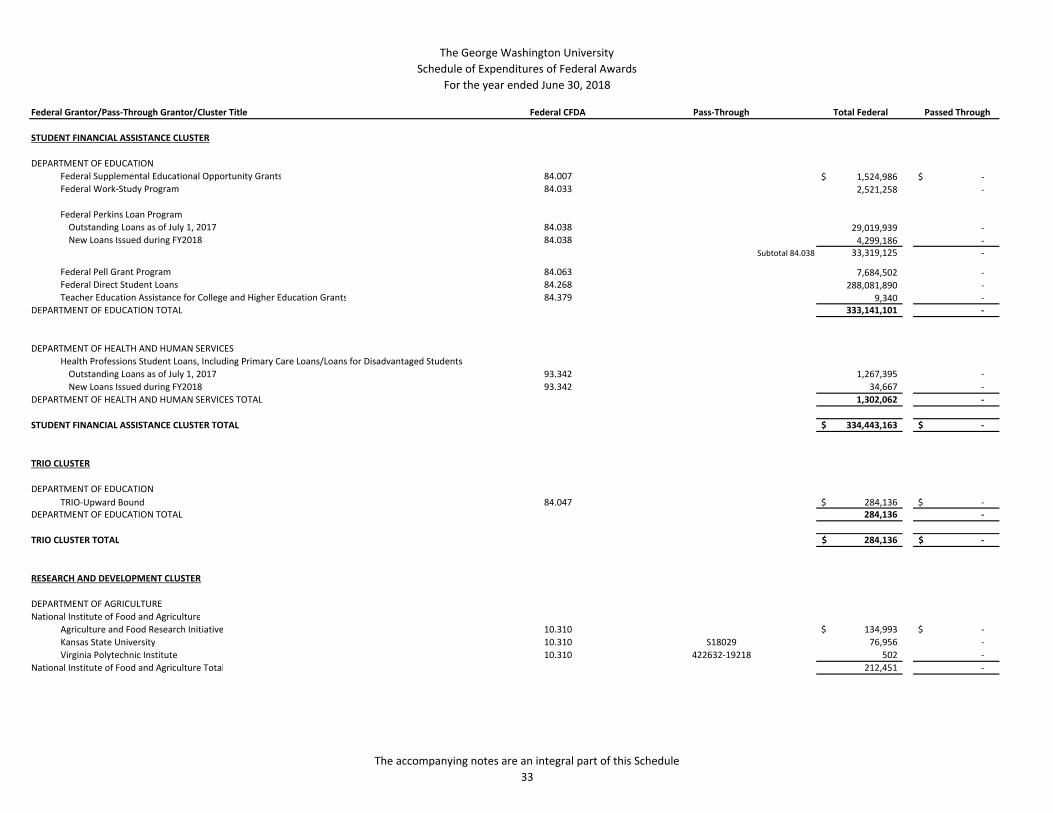
STUDENT FINANCIAL ASSISTANCE CLUSTER
DEPARTMENT OF EDUCATIONFederal Supplemental Educational Opportunity Grants 84.007 1,524,986$ ‐$ Federal Work‐Study Program 84.033 2,521,258 ‐
Federal Perkins Loan ProgramOutstanding Loans as of July 1, 2017 84.038 29,019,939 ‐ New Loans Issued during FY2018 84.038 4,299,186 ‐
Subtotal 84.038 33,319,125 ‐
Federal Pell Grant Program 84.063 7,684,502 ‐ Federal Direct Student Loans 84.268 288,081,890 ‐ Teacher Education Assistance for College and Higher Education Grants 84.379 9,340 ‐
DEPARTMENT OF EDUCATION TOTAL 333,141,101 ‐
DEPARTMENT OF HEALTH AND HUMAN SERVICESHealth Professions Student Loans, Including Primary Care Loans/Loans for Disadvantaged StudentsOutstanding Loans as of July 1, 2017 93.342 1,267,395 ‐ New Loans Issued during FY2018 93.342 34,667 ‐
DEPARTMENT OF HEALTH AND HUMAN SERVICES TOTAL 1,302,062 ‐
STUDENT FINANCIAL ASSISTANCE CLUSTER TOTAL 334,443,163$ ‐$
TRIO CLUSTER
DEPARTMENT OF EDUCATIONTRIO‐Upward Bound 84.047 284,136$ ‐$
DEPARTMENT OF EDUCATION TOTAL 284,136 ‐
TRIO CLUSTER TOTAL 284,136$ ‐$
RESEARCH AND DEVELOPMENT CLUSTER
DEPARTMENT OF AGRICULTURENational Institute of Food and Agriculture
Agriculture and Food Research Initiative 10.310 134,993$ ‐$ Kansas State University 10.310 S18029 76,956 ‐ Virginia Polytechnic Institute 10.310 422632‐19218 502 ‐
National Institute of Food and Agriculture Total 212,451 ‐
The accompanying notes are an integral part of this Schedule33

The George Washington UniversitySchedule of Expenditures of Federal Awards
For the year ended June 30, 2018
Federal Grantor/Pass‐Through Grantor/Cluster Title Federal CFDA Pass‐Through Total Federal Passed Through
Office of the Chief EconomistAgricultural Market and Economic Research 10.290 63,388$ ‐$
Office of the Chief Economist Total 63,388 ‐
DEPARTMENT OF AGRICULTURE TOTAL 275,839 ‐
DEPARTMENT OF COMMERCENational Oceanic and Atmospheric Administration
11.417 SA75281450‐M R/CR‐5 37,180 ‐ University of MarylandNational Oceanic and Atmospheric Administration Total 37,180 ‐
National Institute of Standards and TechnologyMeasurement and Engineering Research and Standards 11.609 528,747 96,461Science, Technology, Business and/or Education Outreach 11.620 91,439 ‐
National Institute of Standards and Technology Total 620,186 96,461
DEPARTMENT OF COMMERCE TOTAL 657,366 96,461
DEPARTMENT OF DEFENSEDefense Advanced Research Projects Agency
Columbia University 12.300 3(GG007783) 120,213 ‐ Basic Scientific Research 12.431 3,078,930 1,864,102 Columbia University 12.910 1(GG012336) 9,159 ‐ Columbia University 12.910 1(GG012336‐03) 22,242 ‐
Defense Advanced Research Projects Agency Total 3,230,544 1,864,102
Department of the Air Force, Materiel CommandAir Force Defense Research Sciences Program 12.800 467,961 47,285
12.800 RH411‐G1 64,562 ‐ Georgia Institute of TechnologyDepartment of the Air Force, Materiel Command Total 532,523 47,285
Department of the ArmyMilitary Medical Research and Development 12.420 17,490 ‐ Chicago Association for Research and Education in Science 12.420 PAPE‐0020S 104,914 ‐ Duke University 12.420 3130536 (204,692) ‐ Henry Jackson Foundation 12.420 3218 89,868 ‐ Icahn School of Medicine at Mount Sinai 12.420 0258‐1031‐4609 17,318 ‐
Department of the Army Total 24,898 ‐
Department of the Navy, Office of the Chief of Naval Research12.300 1,985,653 120,926
12.NRO00014‐C‐0335 99,199 ‐ Basic and Applied Scientific ResearchDepartment of the Navy, Office of the Chief of Naval Research Charles River Analytics 12.SC1602801 SC1602801 141,294 ‐
The accompanying notes are an integral part of this Schedule34
The George Washington UniversitySchedule of Expenditures of Federal Awards
For the year ended June 30, 2018
Federal Grantor/Pass‐Through Grantor/Cluster Title Federal CFDA Pass‐Through Total Federal Passed Through
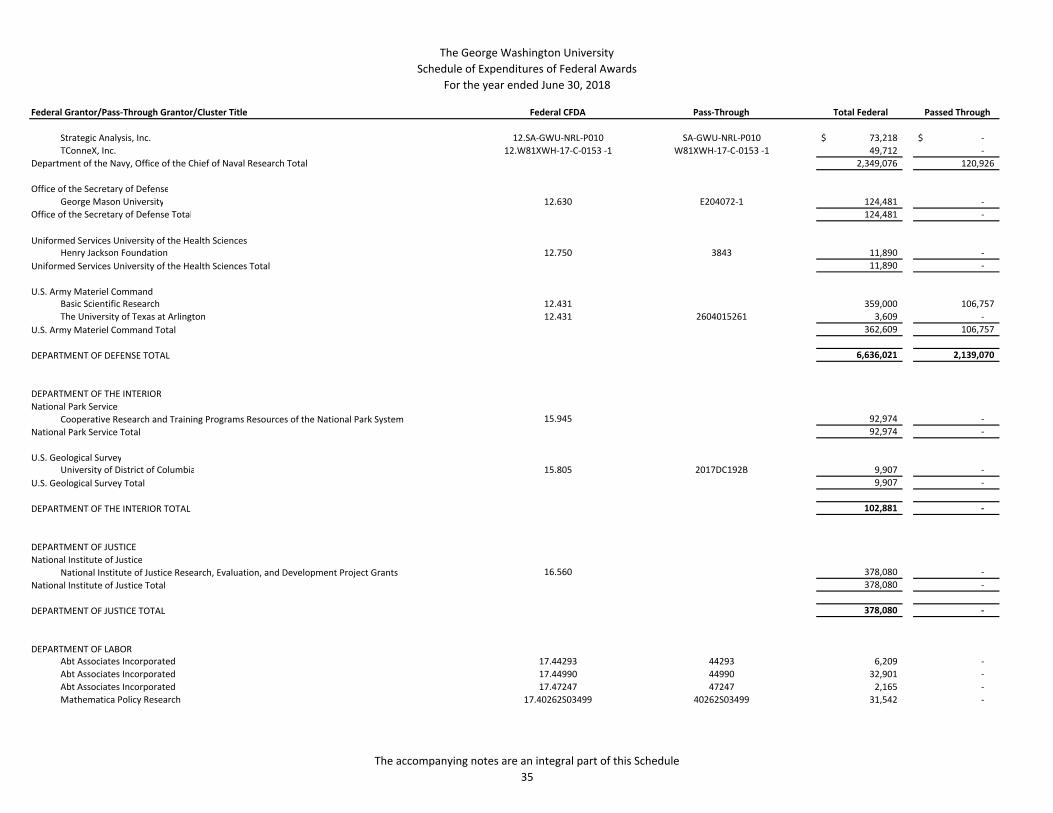
Strategic Analysis, Inc. 12.SA‐GWU‐NRL‐P010 SA‐GWU‐NRL‐P010 73,218$ ‐$ 12.W81XWH‐17‐C‐0153 ‐1 W81XWH‐17‐C‐0153 ‐1 49,712 ‐ TConneX, Inc.
Department of the Navy, Office of the Chief of Naval Research Total 2,349,076 120,926
Office of the Secretary of DefenseGeorge Mason University 12.630 E204072‐1 124,481 ‐
Office of the Secretary of Defense Total 124,481 ‐
Uniformed Services University of the Health Sciences12.750 3843 11,890 ‐ Henry Jackson Foundation
Uniformed Services University of the Health Sciences Total 11,890 ‐
U.S. Army Materiel CommandBasic Scientific Research 12.431 359,000 106,757The University of Texas at Arlington 12.431 2604015261 3,609 ‐
U.S. Army Materiel Command Total 362,609 106,757
DEPARTMENT OF DEFENSE TOTAL 6,636,021 2,139,070
DEPARTMENT OF THE INTERIORNational Park Service
15.945 92,974 ‐ Cooperative Research and Training Programs Resources of the National Park System National Park Service Total 92,974 ‐
U.S. Geological SurveyUniversity of District of Columbia 15.805 2017DC192B 9,907 ‐
U.S. Geological Survey Total 9,907 ‐
DEPARTMENT OF THE INTERIOR TOTAL 102,881 ‐
DEPARTMENT OF JUSTICENational Institute of Justice
16.560 378,080 ‐ National Institute of Justice Research, Evaluation, and Development Project Grants National Institute of Justice Total 378,080 ‐
DEPARTMENT OF JUSTICE TOTAL 378,080 ‐
DEPARTMENT OF LABORAbt Associates Incorporated 17.44293 44293 6,209 ‐ Abt Associates Incorporated 17.44990 44990 32,901 ‐ Abt Associates Incorporated 17.47247 47247 2,165 ‐ Mathematica Policy Research 17.40262S03499 40262S03499 31,542 ‐
The accompanying notes are an integral part of this Schedule35

The George Washington UniversitySchedule of Expenditures of Federal Awards
For the year ended June 30, 2018
Federal Grantor/Pass‐Through Grantor/Cluster Title Federal CFDA Pass‐Through Total Federal Passed Through
The Urban Institute 17.101552‐0001‐GWU‐01 101552‐0001‐GWU‐01 4,330$ ‐$ DEPARTMENT OF LABOR TOTAL 77,147 ‐
DEPARTMENT OF STATEBureau of International Security and Nonproliferation
Global Threat Reduction 19.033 25,315 25,315Bureau of International Security and Nonproliferation Total 25,315 25,315
Bureau of Population, Refugees and Migration19.522 179,869 ‐ Overseas Refugee Assistance Programs for Strategic Global Priorities
Bureau of Population, Refugees and Migration Total 179,869 ‐
DEPARTMENT OF STATE TOTAL 205,184 25,315
DEPARTMENT OF TRANSPORTATIONFederal Highway Administration
National Academy of Sciences 20.200 HR 12‐96 152,517 116,973Battelle Memorial Institute 20.527248 527248 29,152 ‐ Battelle Memorial Institute 20.601753 601753 40,539 ‐
Federal Highway Administration Total 222,208 116,973
DEPARTMENT OF TRANSPORTATION TOTAL 222,208 116,973
NATIONAL AERONAUTICS AND SPACE ADMINISTRATIONScience 43.001 695,993 ‐ Smithsonian Institution 43.001 AR8‐19008X 4,990 ‐ Smithsonian Institution 43.001 AR8‐19009B 2,239 ‐ Smithsonian Institution 43.001 GO8‐19061X 31,806 ‐ Smithsonian Institution 43.001 GO8‐19063X 8,956 ‐ Smithsonian Institution 43.001 TM8‐19005B 1,119 ‐
43.003 93,535 ‐ 43.007 42645‐Z6075001 96,135 ‐ 43.008 C16‐2B64‐GWU 38,499 ‐ 43.008 SUB2014‐027 67,093 ‐
ExplorationUniversity of MarylandThe National Institute of Aerospace Associates University of AlabamaUniversity of Illinois 43.012 088405‐16579 14,341 ‐ Space Telescope Science Institute 43.HST‐GO‐14183.003‐A HST‐GO‐14183.003‐A 4,665 ‐ Space Telescope Science Institute 43.HST‐GO‐14198.001‐A HST‐GO‐14198.001‐A 24,565 ‐ Space Telescope Science Institute 43.HST‐GO‐14787.010‐A HST‐GO‐14787.010‐A 33,989 ‐
NATIONAL AERONAUTICS AND SPACE ADMINISTRATION TOTAL 1,117,925 ‐
The accompanying notes are an integral part of this Schedule36

The George Washington UniversitySchedule of Expenditures of Federal Awards
For the year ended June 30, 2018
Federal Grantor/Pass‐Through Grantor/Cluster Title Federal CFDA Pass‐Through Total Federal Passed Through
NATIONAL ENDOWMENT FOR THE HUMANITIESPromotion of the Humanities Division of Preservation and Access 45.149 83,229$ ‐$ University of Delaware 45.161 42307 2,494 ‐
NATIONAL ENDOWMENT FOR THE HUMANITIES TOTAL 85,723 ‐
NATIONAL SCIENCE FOUNDATIONIPA ‐ National Science Foundation 47.IPA‐NSF 22,965 ‐ IPA ‐ National Science Foundation 47.IPA‐NSF 154,619 ‐ Engineering Grants 47.041 2,007,450 138,815University of Colorado 47.041 CMMI1333610 869 ‐ University of Maryland 47.041 41851‐Z4754001 348,544 ‐ University of Maryland 47.041 Z404201 106,323 ‐ University of Pennsylvania 47.041 567084 603 ‐ Mathematical and Physical Sciences 47.049 1,545,987 14,973American Physical Society 47.049 CWC‐017 10,449 ‐ Associated Universities, Inc./National Radio Astronomy Observatory 47.049 1519126 23,001 ‐ Indiana University 47.049 BL‐4848792‐GWU 17,513 ‐ Yale University 47.049 C14D11733(D01999) 49,612 ‐ Geosciences 47.050 493,172 139,307University of New Mexico 47.050 133660‐8721 217,853 ‐ University of Northern Iowa 47.050 S6180B 604 ‐ Computer and Information Science and Engineering 47.070 2,153,545 40,188Biological Sciences 47.074 1,425,574 ‐ The Curators of the University of Missouri 47.074 C00057952‐1 125,014 ‐ The Translational Genomics Research Institute 47.074 DEB‐124115 18,739 ‐ The Translational Genomics Research Institute 47.074 P‐14‐02 12,048 ‐ University of North Carolina 47.074 5‐37034 51,039 ‐ Social, Behavioral, and Economic Sciences 47.075 1,638,071 108,141University of California, San Diego 47.075 68013339 19,353 ‐ Education and Human Resources 47.076 2,529,724 176,120American Educational Research Association 47.076 DRL‐1749275 7,929 ‐ Cary Institute of Ecosystem Studies 47.076 3355/200201907 41,140 ‐ Purdue University 47.076 4101‐77569 10,568 ‐ SRI International 47.076 141‐000009 2,696 ‐ University of Washington 47.076 745542 33,772 ‐ Wayne State University 47.076 WSU17105 24,124 ‐ Polar Programs 47.078 133,342 ‐ Office of International Science and Engineering 47.079 407,067 45,858Office of Integrative Activities 47.083 114,881 76,225
NATIONAL SCIENCE FOUNDATION TOTAL 13,748,190 739,627
SMALL BUSINESS ADMINISTRATIONIncumetrics, Inc. 59.2018‐001 2018‐001 2,475 ‐
SMALL BUSINESS ADMINISTRATION TOTAL 2,475 ‐
The accompanying notes are an integral part of this Schedule37

The George Washington UniversitySchedule of Expenditures of Federal Awards
For the year ended June 30, 2018
Federal Grantor/Pass‐Through Grantor/Cluster Title Federal CFDA Pass‐Through Total Federal Passed Through
VETERANS AFFAIRS MEDICAL CENTERIPA ‐ Department of Veteran Affairs 64.IPA‐VA 36,415$ ‐$
VETERANS AFFAIRS MEDICAL CENTER TOTAL 36,415 ‐
ENVIRONMENTAL PROTECTION AGENCYIndustrial Economics, Inc. 66.8065‐GWU 8065‐GWU 9,291 ‐
ENVIRONMENTAL PROTECTION AGENCY TOTAL 9,291 ‐
DEPARTMENT OF ENERGYOffice of Science Financial Assistance Program 81.049 886,853 ‐ Carnegie Institution of Washington 81.049 4‐10114‐11B 360,163 ‐ MuPlus, Inc. 81.049 DE‐SC0017831 40,803 ‐ Tech‐X Corporation 81.049 7358‐003 27,640 ‐ The Curators of The University of Missouri 81.049 C00049155‐1 347,289 ‐ University of Notre Dame 81.049 202373GWU 9,071 ‐ Conservation Research and Development 81.086 221,773 ‐ University of California, Berkeley 81.113 9329 290,273 ‐ Nuclear Energy Research, Development and Demonstration 81.121 3,057 (796)North Carolina State University 81.121 2016‐1536‐02 235,739 ‐ Ohio State University 81.121 60046086 52,682 ‐ University of Michigan 81.121 3003302284 11,503 ‐ Advanced Research Projects Agency ‐ Energy 81.135 215,332 ‐ Donald Danforth Plant Science Center 81.135 22815‐G 111,380 ‐ Semprius, Inc. 81.135 DE‐AR0000624 (2,021) ‐ Wichita State University 81.135 CL15243 148,586 ‐ Battelle Energy Alliance, LLC 81.186604 186604 9,921 ‐ Jefferson Science Associates LLC 81.14‐C0252300 14‐C0252300 31,765 ‐ Jefferson Science Associates LLC 81.14‐C0252400 14‐C0252400 1,616 ‐ The Trustees of Princeton University 81.S013871‐U S013871‐U 30,852 ‐ The Trustees of Princeton University 81.S015107‐F S015107‐F 10,397 ‐ UT‐Battelle LLC 81.4000145175 4000145175 15,620 ‐
DEPARTMENT OF ENERGY TOTAL 3,060,294 (796)
DEPARTMENT OF EDUCATIONOffice of Elementary and Secondary Education
The Catholic University of America 84.367 407258 SUB 1 9,690 ‐ Office of Elementary and Secondary Education Total 9,690 ‐
Office of Innovation and ImprovementFund for the Improvement of Education 84.215 22,776 ‐
Office of Innovation and Improvement Total 22,776 ‐
DEPARTMENT OF EDUCATION TOTAL 32,466 ‐
The accompanying notes are an integral part of this Schedule38
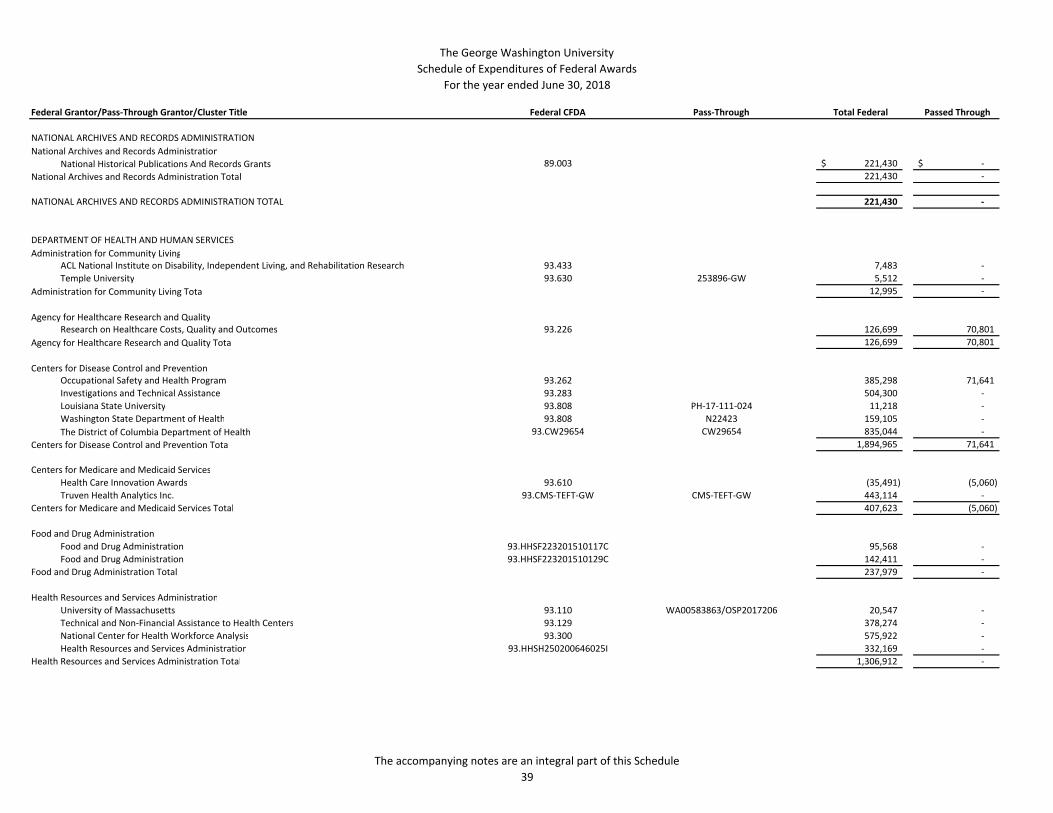
The George Washington UniversitySchedule of Expenditures of Federal Awards
For the year ended June 30, 2018
Federal Grantor/Pass‐Through Grantor/Cluster Title Federal CFDA Pass‐Through Total Federal Passed Through
NATIONAL ARCHIVES AND RECORDS ADMINISTRATIONNational Archives and Records Administration
89.003 221,430$ ‐$ National Historical Publications And Records Grants National Archives and Records Administration Total 221,430 ‐
NATIONAL ARCHIVES AND RECORDS ADMINISTRATION TOTAL 221,430 ‐
DEPARTMENT OF HEALTH AND HUMAN SERVICESAdministration for Community Living
ACL National Institute on Disability, Independent Living, and Rehabilitation Research 93.433 7,483 ‐ Temple University 93.630 253896‐GW 5,512 ‐
Administration for Community Living Total 12,995 ‐
Agency for Healthcare Research and QualityResearch on Healthcare Costs, Quality and Outcomes 93.226 126,699 70,801
Agency for Healthcare Research and Quality Total 126,699 70,801
Centers for Disease Control and PreventionOccupational Safety and Health Program 93.262 385,298 71,641Investigations and Technical Assistance 93.283 504,300 ‐ Louisiana State University 93.808 PH‐17‐111‐024 11,218 ‐ Washington State Department of Health 93.808 N22423 159,105 ‐ The District of Columbia Department of Health 93.CW29654 CW29654 835,044 ‐
Centers for Disease Control and Prevention Total 1,894,965 71,641
Centers for Medicare and Medicaid ServicesHealth Care Innovation Awards 93.610 (35,491) (5,060)Truven Health Analytics Inc. 93.CMS‐TEFT‐GW CMS‐TEFT‐GW 443,114 ‐
Centers for Medicare and Medicaid Services Total 407,623 (5,060)
Food and Drug AdministrationFood and Drug Administration 93.HHSF223201510117C 95,568 ‐ Food and Drug Administration 93.HHSF223201510129C 142,411 ‐
Food and Drug Administration Total 237,979 ‐
Health Resources and Services AdministrationUniversity of Massachusetts 93.110 WA00583863/OSP2017206 20,547 ‐ Technical and Non‐Financial Assistance to Health Centers 93.129 378,274 ‐ National Center for Health Workforce Analysis 93.300 575,922 ‐ Health Resources and Services Administration 93.HHSH250200646025I 332,169 ‐
Health Resources and Services Administration Total 1,306,912 ‐
The accompanying notes are an integral part of this Schedule39

The George Washington UniversitySchedule of Expenditures of Federal Awards
For the year ended June 30, 2018
Federal Grantor/Pass‐Through Grantor/Cluster Title Federal CFDA Pass‐Through Total Federal Passed Through
National Institutes of Health93.077 GWU DA036107 178,438$ ‐$ 93.113 128,595 ‐ 93.113 1019956 3,957 ‐ 93.121 75,322 67,43493.173 8,155 ‐ 93.173 SH_GWU_001 27,788 ‐ 93.213 12,194 ‐ 93.213 GR101634 (CON‐80001053) 14,057 ‐ 93.233 217735 26,676 ‐ 93.233 FP053428 10,239 ‐ 93.242 3,550,461 1,541,737 93.242 41943778 103,275 ‐ 93.242 9705SC 15,130 ‐ 93.242 M16A12423 (A09329) 1,708 ‐ 93.273 477,108 ‐ 93.279 88,780 ‐ 93.279 T855314 37,932 ‐ 93.279 7109834 9,907 ‐ 93.279 7016‐GWU 51,357 ‐ 93.286 665,797 61,81593.286 48206 26,285 ‐ 93.307 544,383 8,21893.307 1R41MD012294‐01 41,459 ‐ 93.307 60044820 GWASHU 369,432 ‐ 93.307 11272SUB (10,536) ‐ 93.307 571099 22,058 ‐ 93.310 481,438 15,37993.310 30003467‐01 77,629 ‐ 93.310 RR549‐600/S001540 384,178 ‐ 93.310 281210B 532,559 ‐
Pennsylvania State UniversityEnvironmental HealthPublic Health InstituteOral Diseases and Disorders ResearchResearch Related to Deafness and Communication DisordersSeeHear LLCResearch and Training in Complementary and Integrative HealthYale UniversityUniversity of ArizonaUniversity of ChicagoMental Health Research GrantsUniversity of California, San DiegoUniversity of California, San FranciscoYale UniversityAlcohol Research ProgramsDrug Abuse and Addiction Research ProgramsEmory UniversityThe Miriam HospitalTruth Initiative FoundationDiscovery and Applied Research for Technological Innovations to Improve Human Health University of ConnecticutMinority Health and Health Disparities Research Benten Technologies, Inc.Northwestern UniversitySeattle Children's Research InstituteUniversity of PennsylvaniaTrans‐NIH Research SupportChildren's Research InstituteUniversity of GeorgiaUniversity of OregonChildren's Research Institute 93.350 30003443‐01 191,568 ‐ Children's Research Institute 93.350 30003444‐01 91,806 ‐ Children's Research Institute 93.350 30003459‐01 107,979 ‐ Children's Research Institute 93.350 30003460‐01 67,560 ‐ Children's Research Institute 93.350 30003461‐01 459,960 ‐ Children's Research Institute 93.350 30003463‐01 56,464 ‐ Children's Research Institute 93.350 30003464‐01 99,645 ‐ Children's Research Institute 93.350 30003465‐01 43,244 ‐ Children's Research Institute 93.350 30003466‐01 18,537 ‐ Children's Research Institute 93.350 30003468‐01 22,372 ‐ Children's Research Institute 93.350 30003469‐01 202,095 ‐ Children's Research Institute 93.350 30003517‐01 93,145 ‐ Children's Research Institute 93.350 5UL1TR001876‐03 7,094 ‐ Research Infrastructure Programs 93.351 (75) ‐
The accompanying notes are an integral part of this Schedule40

The George Washington UniversitySchedule of Expenditures of Federal Awards
For the year ended June 30, 2018
Federal Grantor/Pass‐Through Grantor/Cluster Title Federal CFDA Pass‐Through Total Federal Passed Through
University of Wisconsin 93.353 769K613 19,474$ ‐$ Nursing Research 93.361 162,713 ‐ Cancer Cause and Prevention Research 93.393 1,840,314 631,234University of California, San Francisco 93.393 7850SC 982,618 ‐ University of Pennsylvania 93.393 565706 9,531 ‐ Yale University 93.393 GK000215 (CON‐0000564) 30,026 ‐ Yale University 93.393 M17A12511 (A10723) 1,524 ‐ Cancer Detection and Diagnosis Research 93.394 258,877 92,802Georgetown University 93.394 411283_GR409546‐GWU (160) ‐ Cancer Treatment Research 93.395 1,070,523 53,255ImmunoBlue, LLC 93.395 2018 9,523 ‐ Cancer Biology Research 93.396 1,778,182 473,866University of Maryland 93.396 61391‐Z0121201 17,020 ‐ H. Lee Moffitt Cancer Center and Research Institute 93.397 10‐17469‐04‐06.G2 10,740 ‐ H. Lee Moffitt Cancer Center and Research Institute 93.397 10‐17469‐04‐16.G2 8,521 ‐ H. Lee Moffitt Cancer Center and Research Institute 93.397 10‐17469‐05‐06.G2 235,970 ‐ Mayo Clinic Rochester 93.397 THE‐172888 17,824 ‐ Cardiovascular Diseases Research 93.837 3,193,327 395,319Georgetown University 93.837 412513_GR409546‐GWU 277,418 ‐ Johns Hopkins University 93.837 2002843557 165,651 ‐ Johns Hopkins University 93.837 2003286657 30,860 ‐ Nocturnal Product Development, LLC 93.837 2R42HL120511‐03 483,721 ‐ University of Virginia 93.837 GB10332 153331 27,774 ‐ University of Virginia 93.837 GB10332 155744 719,596 ‐ University of Virginia 93.837 GB10332 158826 4,801 ‐ Washington University 93.837 WU‐16‐300 3,325 ‐ Lung Diseases Research 93.838 1,326,255 557,385Children's Research Institute 93.839 30004447‐01 9,408 ‐ Diabetes, Digestive, and Kidney Diseases Extramural Research 93.847 46,622,643 33,174,599 Beckman Research Institute of the City of Hope 93.847 51990.2001413.669201 12,319 ‐ Case Western Reserve University 93.847 RES508522 69,325 ‐ Case Western Reserve University 93.847 RES508602 64,348 ‐ Case Western Reserve University 93.847 RES509456 88,578 ‐ Case Western Reserve University 93.847 RES510572 35,856 ‐ Case Western Reserve University 93.847 RES511775 985 ‐ Case Western Reserve University 93.847 RES512885 132,970 ‐ Massachusetts General Hospital 93.847 225209 69,781 ‐ NYU Winthrop Hospital 93.847 3500‐07429(GWU) 31,869 ‐
93.847 KS141‐GWU‐6 12,094 ‐ 93.847 KS141‐GWU‐7 235,856 ‐ 93.847 KS141‐S1‐GWU‐6 4,091 ‐ 93.847 KS141‐S2‐GWU‐6 357 ‐
Seattle Institute for Biomedical and Clinical Research Seattle Institute for Biomedical and Clinical Research Seattle Institute for Biomedical and Clinical Research Seattle Institute for Biomedical and Clinical Research Seattle Institute for Biomedical and Clinical Research 93.847 PJ115‐GWU‐1 5,300 ‐ The Research Foundation for State University of New York 93.847 1138946‐77867 5,187 ‐ University of Connecticut 93.847 182459 7,487 ‐
The accompanying notes are an integral part of this Schedule41

The George Washington UniversitySchedule of Expenditures of Federal Awards
For the year ended June 30, 2018
Federal Grantor/Pass‐Through Grantor/Cluster Title Federal CFDA Pass‐Through Total Federal Passed Through
93.847 3002760366 5,753$ ‐$ 93.847 UWSC9246 6,862 ‐ 93.847 WFUHS 113617 14,615 ‐ 93.853 1,116,301 246,54993.853 RES510437 112,542 ‐ 93.853 RES511380 1,790 ‐ 93.853 000377209‐054 30,358 ‐ 93.853 M17A12628 (A10847) 62,454 ‐ 93.855 19,339,980 8,924,283 93.855 ADI‐GWU 2017‐001 39,464 ‐ 93.855 ADI‐GWU 2018‐001 845 ‐ 93.855 117360 34,563 ‐ 93.855 01/2012 236 ‐ 93.855 30004046 17,886 ‐ 93.855 203‐7719 123,916 ‐
University of MichiganUniversity of WashingtonWake Forest UniversityExtramural Research Programs in the Neurosciences and Neurological Disorders Case Western Reserve UniversityCase Western Reserve UniversityUniversity of AlabamaYale UniversityAllergy and Infectious Diseases ResearchAntigen Discovery, Inc.Antigen Discovery, Inc.Brigham and Women's HospitalCentro De Pesquisas Rene RachouChildren's Research InstituteDuke UniversityEDJ Associates, Inc. 93.855 5UM1AI126617‐02 7,605 ‐ Emory University 93.855 T760417 24,086 ‐ Emory University 93.855 T842377 57,021 ‐ Emory University 93.855 T886653 47,711 ‐
93.855 HPTN‐MGA‐GWU‐1 690,711 66,64493.855 2003368362 38,083 ‐ 93.855 OOS030194‐01 248,730 ‐ 93.855 P50 AI098639 6,107 ‐ 93.855 5710004110 381,730 ‐ 93.855 F0504‐03 17,281 ‐ 93.855 R01‐Al101371 8,280 ‐ 93.855 W000834342 122,660 ‐ 93.855 91560036 57,120 ‐ 93.855 10270SC 33,610 ‐ 93.855 0054948 (129999‐1) 59,813 ‐ 93.855 WU‐16‐161 29,691 ‐ 93.856 WU‐16‐342 60,483 ‐ 93.859 958,098 297,77593.859 1(GG011515‐01) 49,382 ‐ 93.859 FAR0025511 36,457 ‐ 93.865 14,172,191 6,342,899 93.865 4500000971 13,085 ‐ 93.865 30003597‐01 38,646 ‐ 93.865 30003930‐01 22,991 ‐ 93.865 30004197‐01 25,175 ‐ 93.865 1(GG011042‐01) 105,658 ‐ 93.865 500900SG106 24,545 ‐ 93.865 GR‐K22 88,582 ‐ 93.865 9646 11,412 ‐
Family Health InternationalJohns Hopkins UniversityKaiser Foundation HospitalsKhon Kaen UniversityMassachusetts Institute of TechnologyNew York UniversityThe Translational Genomics Research InstituteThe University of IowaUniversity of California, San DiegoUniversity of California, San FranciscoUniversity of PittsburghWashington UniversityWashington UniversityBiomedical Research and Research TrainingColumbia UniversityNorth Dakota State UniversityChild Health and Human Development Extramural Research Boston UniversityChildren's Research InstituteChildren's Research InstituteChildren's Research InstituteColumbia UniversityDepaul UniversityFlorida Atlantic UniversityThe Regents of the University of CaliforniaTrustees of Boston College 93.865 5104821‐1 21,531 ‐
The accompanying notes are an integral part of this Schedule42

The George Washington UniversitySchedule of Expenditures of Federal Awards
For the year ended June 30, 2018
Federal Grantor/Pass‐Through Grantor/Cluster Title Federal CFDA Pass‐Through Total Federal Passed Through
Tufts University 93.865 100447‐00001 23,750$ ‐$ University of Maryland 93.865 1701118A 39,539 ‐ University of Michigan 93.865 3004152691 9,981 ‐ Yale University 93.865 M16A12585 (A10715) 36,772 ‐ Zansors, LLC 93.865 1R41HD088142‐01 24,571 ‐ Aging Research 93.866 661,040 172,557Boston University 93.866 4500001984 19,948 ‐ Brigham Young University 93.866 14‐0397 15,798 ‐ Vision Research 93.867 962,572 ‐ Thomas Jefferson University 93.867 080‐01000‐S04802 132,180 ‐ University of Illinois 93.867 7916 5,391 ‐ Medical Library Assistance 93.879 65,478 ‐ Baylor College of Medicine 93.7000000056 7000000056 142,864 ‐ Duke University 93.2036113 2036113 31,724 ‐ Duke University 93.2036628 2036628 50,988 ‐ Impaq International, LLC 93.2498 2498 83,448 ‐
National Institutes of Health Total 110,183,641 53,123,750
Office of Population AffairsNational Family Planning and Reproductive Health Association 93.974 1FPRPA006059‐01‐00 555 ‐
Office of Population Affairs Total 555 ‐
Office of the SecretaryAdvancing System Improvements for Key Issues in Women's Health 93.088 181,050 43,459
Office of the Secretary Total 181,050 43,459
Program Support CenterProgram Support Center 93.HHSP23320095635WC 79,009 ‐ LTG Associates, Inc. 93.HHSP233201500058IGWU HHSP233201500058IGWU 6,516 ‐ Mission Analytics Group, Inc. 93.HHSP233201500060I‐A HHSP233201500060I‐A 49,346 ‐
Program Support Center Total 134,871 ‐
DEPARTMENT OF HEALTH AND HUMAN SERVICES TOTAL 114,487,290 53,304,591
UNITED STATES AGENCY FOR INTERNATIONAL DEVELOPMENTUSAID Foreign Assistance for Programs Overseas 98.001 89,657 28,750Elizabeth Glaser Pediatric Aids Foundation 98.001 AID‐OAA‐A‐14‐00060 68,820 ‐ Elizabeth Glaser Pediatric Aids Foundation 98.001 APS‐OAA‐11‐000002 20,962 ‐ Massachusetts Institute of Technology 98.001 5710004082 94,623 ‐ Texas Tech University 98.001 212057‐01 29,173 ‐ The Regents of the University of California 98.001 20112145407 43,409 ‐
UNITED STATES AGENCY FOR INTERNATIONAL DEVELOPMENT TOTAL 346,644 28,750
The accompanying notes are an integral part of this Schedule43

The George Washington UniversitySchedule of Expenditures of Federal Awards
For the year ended June 30, 2018
Federal Grantor/Pass‐Through Grantor/Cluster Title Federal CFDA Pass‐Through Total Federal Passed Through
UNITED STATES POSTAL SERVICEUnited States Postal Service 99.2BFAAS‐17‐B‐0018 91,751$ ‐$
UNITED STATES POSTAL SERVICE TOTAL 91,751 ‐
RESEARCH AND DEVELOPMENT CLUSTER TOTAL 141,794,620$ 56,449,991$
ALL OTHER FEDERAL AWARDS
DEPARTMENT OF AGRICULTUREWholesale Farmers and Alternative Market Development 10.164 38,400$ ‐$
DEPARTMENT OF AGRICULTURE TOTAL 38,400 ‐
DEPARTMENT OF COMMERCEIPA ‐ Department of Commerce 11.IPA‐Commerce 125,597 ‐
DEPARTMENT OF COMMERCE TOTAL 125,597 ‐
DEPARTMENT OF DEFENSEIPA ‐ Department of Defense 12.IPA‐DOD 166,454 ‐ IPA ‐ Department of the Navy 12.IPA‐DOD 212,503 ‐
Chicago Association for Research and Education in Science 12.420 PAPE‐0024 11,343 ‐ Chicago Association for Research and Education in Science 12.420 PAPE‐CDMRP II 6,123 ‐
Subtotal 12.420 17,466 ‐
Basic Scientific Research 12.431 6,660 ‐ Institute of International Education 12.579 2603‐GWU‐30 627,291 ‐ Information Security Grants 12.902 70,594 ‐ GenCyber Grants Program 12.903 63,982 ‐ CyberSecurity Core Curriculum 12.905 99,966 ‐
DEPARTMENT OF DEFENSE TOTAL 1,264,916 ‐
DEPARTMENT OF THE INTERIORCooperative Research and Training Programs Resources of the National Park System 15.945 30,816 ‐
DEPARTMENT OF THE INTERIOR TOTAL 30,816 ‐
DEPARTMENT OF JUSTICERTI International 16.560 8‐321‐0215513‐52955L 33,887 ‐
DEPARTMENT OF JUSTICE TOTAL 33,887 ‐
The accompanying notes are an integral part of this Schedule44

The George Washington UniversitySchedule of Expenditures of Federal Awards
For the year ended June 30, 2018
Federal Grantor/Pass‐Through Grantor/Cluster Title Federal CFDA Pass‐Through Total Federal Passed Through
DEPARTMENT OF LABORThe Viscardi Center 17.720 1151888 97,950$ ‐$ The Viscardi Center 17.720 4019658 162,872 ‐
DEPARTMENT OF LABOR TOTAL 260,822 ‐
DEPARTMENT OF STATE19.400 3216_GWU_1.18.17 14,845 ‐ 19.501 (21,723) ‐
Institute of International EducationPublic Diplomacy Programs for Afghanistan and PakistanOverseas Refugee Assistance Programs for Strategic Global Priorities 19.522 149,744 ‐
DEPARTMENT OF STATE TOTAL 142,866 ‐
NATIONAL AERONAUTICS AND SPACE ADMINISTRATIONAmerican University 43.008 31377‐GWU‐16 40,399 ‐ ASRC Federal Technical Services, Inc. 43.AST2‐00004 AST2‐00004 19,822 ‐
NATIONAL AERONAUTICS AND SPACE ADMINISTRATION TOTAL 60,221 ‐
NATIONAL ENDOWMENT FOR THE HUMANITIES45.149 72,015 ‐ 45.161 7,291 ‐
Promotion of the Humanities Division of Preservation and Access Promotion of the Humanities ResearchPromotion of the Humanities Public Programs 45.164 4,959 ‐
NATIONAL ENDOWMENT FOR THE HUMANITIES TOTAL 84,265 ‐
INSTITUTE OF MUSEUM AND LIBRARY SERVICESMuseums for America 45.301 125,356 ‐
INSTITUTE OF MUSEUM AND LIBRARY SERVICES TOTAL 125,356 ‐
DEPARTMENT OF VETERANS AFFAIRSIPA ‐ Department of Veterans Affairs 64.IPA‐VA 261,821 ‐
DEPARTMENT OF VETERANS AFFAIRS TOTAL 261,821 ‐
DEPARTMENT OF ENERGYRenewable Energy Research and Development 81.087 183,626 35,499Carnegie Institution of Washington 81.112 4‐10469‐29 261,941 ‐ Battelle Memorial Institute 81.315389 315389 10,061 ‐
DEPARTMENT OF ENERGY TOTAL 455,628 35,499
The accompanying notes are an integral part of this Schedule45

The George Washington UniversitySchedule of Expenditures of Federal Awards
For the year ended June 30, 2018
Federal Grantor/Pass‐Through Grantor/Cluster Title Federal CFDA Pass‐Through Total Federal Passed Through
DEPARTMENT OF EDUCATIONNational Resource Centers Program for Foreign Language and Area Studies or Foreign Language and International Studies Program and Foreign Language and Area Studies Fellowship Program 84.015 818,588$ ‐$ Rehabilitation Long‐Term Training 84.129 546,857 ‐ Centers for International Business Education 84.220 221,076 ‐ The Virginia Department for Aging and Rehabilitative Services 84.235 16‐176 74,183 ‐
San Diego State University Research Foundation 84.264 SA0000491 952,672 324,519Southern University and A&M College 84.264 OSP‐02‐8300‐2016‐0015 97,185 ‐ Southern University and A&M College 84.264 OSP‐02‐8300‐2017‐0018 220,288 ‐
Subtotal 84.264 1,270,145 324,519
Special Education ‐ Personnel Development to Improve Services and Results for Children with Disabilities 84.325 372,903 ‐ Georgetown University 84.325 412691_GR412618‐GWU 23,758 ‐
Subtotal 84.325 396,661 ‐
English Language Acquisition State Grants 84.365 660,372 ‐ Prince George's County Public Schools 84.365 T365Z110202 24,961 ‐
Subtotal 84.365 685,333 ‐
DC Office of the State Superintendent of Education 84.370 84.370C 5,667 ‐ DEPARTMENT OF EDUCATION TOTAL 4,018,510 324,519
NATIONAL ARCHIVES AND RECORDS ADMINISTRATIONNational Historical Publications and Records Grants 89.003 8,787 ‐
NATIONAL ARCHIVES AND RECORDS ADMINISTRATION TOTAL 8,787 ‐
JAPAN U.S. FRIENDSHIP COMMISSIONJapan U.S. Friendship Commission Grants 90.300 19,415 ‐
JAPAN U.S. FRIENDSHIP COMMISSION TOTAL 19,415 ‐
DEPARTMENT OF HEALTH AND HUMAN SERVICES93.IPA‐DHHS 31,287 ‐ IPA ‐ Center for Disease Control and Prevention
IPA ‐ Office of the National Coordination for Health Information Technology 93.IPA‐DHHS 49,215 ‐
District of Columbia Government 93.071 GWU13C‐18 4,334 ‐ District of Columbia Government 93.071 GWU13E MIPPA‐17 14,427 ‐
Subtotal 93.071 18,761 ‐
American Psychiatric Association 93.243 SM060562‐05 12,695 ‐ Advanced Nursing Education Workforce Grant Program 93.247 92,970 ‐
The accompanying notes are an integral part of this Schedule46
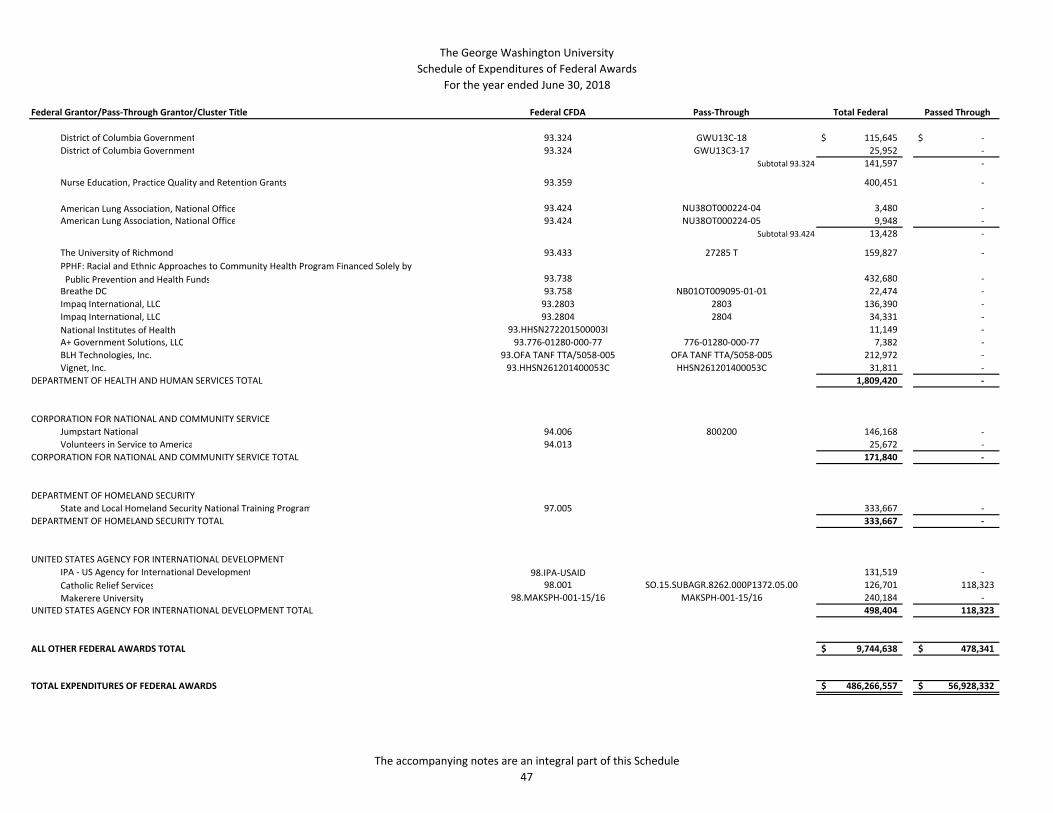
The George Washington UniversitySchedule of Expenditures of Federal Awards
For the year ended June 30, 2018
Federal Grantor/Pass‐Through Grantor/Cluster Title Federal CFDA Pass‐Through Total Federal Passed Through
District of Columbia Government 93.324 GWU13C‐18 115,645$ ‐$ District of Columbia Government 93.324 GWU13C3‐17 25,952 ‐
Subtotal 93.324 141,597 ‐
Nurse Education, Practice Quality and Retention Grants 93.359 400,451 ‐
American Lung Association, National Office 93.424 NU38OT000224‐04 3,480 ‐ American Lung Association, National Office 93.424 NU38OT000224‐05 9,948 ‐
Subtotal 93.424 13,428 ‐
The University of Richmond 93.433 27285 T 159,827 ‐ PPHF: Racial and Ethnic Approaches to Community Health Program Financed Solely by Public Prevention and Health Funds 93.738 432,680 ‐ Breathe DC 93.758 NB01OT009095‐01‐01 22,474 ‐ Impaq International, LLC 93.2803 2803 136,390 ‐ Impaq International, LLC 93.2804 2804 34,331 ‐ National Institutes of Health 93.HHSN272201500003I 11,149 ‐ A+ Government Solutions, LLC 93.776‐01280‐000‐77 776‐01280‐000‐77 7,382 ‐ BLH Technologies, Inc. 93.OFA TANF TTA/5058‐005 OFA TANF TTA/5058‐005 212,972 ‐ Vignet, Inc. 93.HHSN261201400053C HHSN261201400053C 31,811 ‐
DEPARTMENT OF HEALTH AND HUMAN SERVICES TOTAL 1,809,420 ‐
CORPORATION FOR NATIONAL AND COMMUNITY SERVICEJumpstart National 94.006 800200 146,168 ‐ Volunteers in Service to America 94.013 25,672 ‐
CORPORATION FOR NATIONAL AND COMMUNITY SERVICE TOTAL 171,840 ‐
DEPARTMENT OF HOMELAND SECURITYState and Local Homeland Security National Training Program 97.005 333,667 ‐
DEPARTMENT OF HOMELAND SECURITY TOTAL 333,667 ‐
UNITED STATES AGENCY FOR INTERNATIONAL DEVELOPMENTIPA ‐ US Agency for International Development 98.IPA‐USAID 131,519 ‐ Catholic Relief Services 98.001 SO.15.SUBAGR.8262.000P1372.05.00 126,701 118,323Makerere University 98.MAKSPH‐001‐15/16 MAKSPH‐001‐15/16 240,184 ‐
UNITED STATES AGENCY FOR INTERNATIONAL DEVELOPMENT TOTAL 498,404 118,323
ALL OTHER FEDERAL AWARDS TOTAL 9,744,638$ 478,341$
TOTAL EXPENDITURES OF FEDERAL AWARDS 486,266,557$ 56,928,332$
The accompanying notes are an integral part of this Schedule47

The George Washington University Notes to Schedule of Expenditures of Federal Awards For the year ended June 30, 2018
48
Note 1 – Basis of Presentation and Summary of Significant Accounting Policies
The accompanying Schedule of Expenditures of Federal Awards (the Schedule) includes the federal grant, contract and cooperative agreement activity of The George Washington University (the University or GW) and is presented on the accrual basis of accounting. The information in this Schedule is presented in accordance with requirements of Title 2 U.S. Code of Federal Regulations Part 200, Uniform Administrative Requirements, Cost Principles, and Audit Requirements for Federal Awards (Uniform Guidance). Therefore, some amounts presented in this Schedule may differ from amounts presented in, or used in the preparation of, the consolidated financial statements. Negative numbers in the Schedule represent adjustments to amounts previously reported in the normal course of business. Full CFDA and pass-through numbers are included in the Schedule when available. Expenditures are recognized following, as applicable, either the cost principles contained in OMB Circular A-21, Cost Principles for Educational Institutions, or the cost principles contained in the Uniform Guidance. Under these cost principles and administrative requirements, certain types of expenditures are not allowable or are limited to reimbursement.
Note 2 – Indirect Cost Rate
The University has a negotiated indirect cost rate agreement with Department of Health and Human Services as our cognizant agency for indirect costs. As such, the University is not eligible to use the 10 percent de minimis indirect cost rate allowed under the Uniform Guidance.
Note 3 – Federal Student Loan Programs
The University originates loans to eligible students under federal student loan programs.
Campus-based loan programs (Federal Perkins and Health Professions Student Loans, including Primary Care Loans and Loans for Disadvantaged Students) are administered directly by the University. Balances and transactions relating to these programs are included in the basic consolidated financial statements of the University. Loans outstanding at the beginning of the year and loans made during the year are included in the federal expenditures presented in the Schedule. The balances of loans outstanding at June 30, 2018 are summarized below:
Campus-Based Loan Programs: Federal Perkins (CFDA No. 84.038) $ 29,268,071Health Professions Student Loans (CFDA No. 93.342) 1,002,900
Total $ 30,270,971
The University is responsible only for the performance of certain administrative duties with respect to federal loans disbursed by the Department of Education to or on behalf of University students under the Federal Direct Student Loans program (Federal Stafford, Federal Parents Loans for Undergraduate and Graduate Students, and Unsubsidized Federal Stafford Loans, collectively CFDA No. 84.268). Loan disbursements under the Federal Direct Student Loans program are included in the federal expenditures presented in the Schedule. It is not practical to determine the balance of loans outstanding to students and former students of the University under these federally guaranteed loan programs at June 30, 2018.

PricewaterhouseCoopers LLP, 1800 Tysons Blvd., McLean, VA 22102-4261 T: (703) 918-3000, F: (703) 918-3100, www.pwc.com/us
Report of Independent Auditors on Internal Control Over Financial Reporting and on Compliance and Other Matters Based on an Audit of Financial Statements Performed in
Accordance with Government Auditing Standards
To the President and Board of Trustees of The George Washington University
We have audited, in accordance with auditing standards generally accepted in the United States of America and the standards applicable to financial audits contained in Government Auditing Standards issued by the Comptroller General of the United States, the consolidated financial statements of The George Washington University and its subsidiaries (“the University”), which comprise the consolidated statement of financial position as of June 30, 2018, and the related consolidated statement of unrestricted activities, consolidated statement of activities, and the consolidated statement of cash flows for the year then ended, and the related notes to the financial statements, and have issued our report thereon dated September 18, 2018.
Internal Control Over Financial Reporting
In planning and performing our audit of the financial statements, we considered the University’s internal control over financial reporting (“internal control”) to determine the audit procedures that are appropriate in the circumstances for the purpose of expressing our opinion on the financial statements, but not for the purpose of expressing an opinion on the effectiveness of the University’s internal control. Accordingly, we do not express an opinion on the effectiveness of the University’s internal control.
A deficiency in internal control exists when the design or operation of a control does not allow management or employees, in the normal course of performing their assigned functions, to prevent, or detect and correct, misstatements on a timely basis. A material weakness is a deficiency, or a combination of deficiencies, in internal control such that there is a reasonable possibility that a material misstatement of the entity's financial statements will not be prevented, or detected and corrected on a timely basis. A significant deficiency is a deficiency, or a combination of deficiencies, in internal control that is less severe than a material weakness, yet important enough to merit attention by those charged with governance.
Our consideration of internal control was for the limited purpose described in the first paragraph of this section and was not designed to identify all deficiencies in internal control that might be material weaknesses or significant deficiencies. Given these limitations, during our audit we did not identify any deficiencies in internal control that we consider to be material weaknesses. However, material weaknesses may exist that have not been identified.
Compliance and Other Matters
As part of obtaining reasonable assurance about whether the University’s financial statements are free from material misstatement, we performed tests of its compliance with certain provisions of laws, regulations, contracts and grant agreements, noncompliance with which could have a direct and material effect on the determination of financial statement amounts. However, providing an opinion on compliance with those provisions was not an objective of our audit, and accordingly, we do not express

50
such an opinion. The results of our tests disclosed no instances of noncompliance or other matters that are required to be reported under Government Auditing Standards.
Purpose of this Report
The purpose of this report is solely to describe the scope of our testing of internal control and compliance and the results of that testing, and not to provide an opinion on the effectiveness of the entity’s internal control or on compliance. This report is an integral part of an audit performed in accordance with Government Auditing Standards in considering the entity’s internal control and compliance. Accordingly, this communication is not suitable for any other purpose.
September 18, 2018 McLean, Virginia

PricewaterhouseCoopers LLP, 1800 Tysons Blvd., McLean, VA 22102-4261 T: (703) 918-3000, F: (703) 918-3100, www.pwc.com/us
Report of Independent Auditors on Compliance with Requirements That Could Have a Direct and Material Effect on Each Major Program and on Internal
Control Over Compliance in Accordance with the Uniform Guidance
To the President and Board of Trustees of The George Washington University
Report on Compliance for Each Major Federal Program
We have audited The George Washington University and its subsidiaries' (“the University’s”) compliance with the types of compliance requirements described in the OMB Compliance Supplement that could have a direct and material effect on each of the University’s major federal programs for the year ended June 30, 2018. The University’s major federal programs are identified in the summary of auditor's results section of the accompanying schedule of findings and questioned costs.
Management’s Responsibility
Management is responsible for compliance with federal statutes, regulations and the terms and conditions of its federal awards applicable to its federal programs.
Auditors’ Responsibility
Our responsibility is to express an opinion on compliance for each of the University’s major federal programs based on our audit of the types of compliance requirements referred to above. We conducted our audit of compliance in accordance with auditing standards generally accepted in the United States of America; the standards applicable to financial audits contained in Government Auditing Standards, issued by the Comptroller General of the United States; and the audit requirements of Title 2 U.S. Code of Federal Regulations Part 200, Uniform Administrative Requirements, Cost Principles, and Audit Requirements for Federal Awards (Uniform Guidance). Those standards and the Uniform Guidance require that we plan and perform the audit to obtain reasonable assurance about whether noncompliance with the types of compliance requirements referred to above that could have a direct and material effect on a major federal program occurred. An audit includes examining, on a test basis, evidence about the University’s compliance with those requirements and performing such other procedures as we considered necessary in the circumstances.
We believe that our audit provides a reasonable basis for our opinion on compliance for each major federal program. However, our audit does not provide a legal determination of the University’s compliance.
Opinion on Each Major Federal Program
In our opinion, the University complied, in all material respects, with the types of compliance requirements referred to above that could have a direct and material effect on each of its major federal programs for the year ended June 30, 2018.
52
Other Matters
The results of our auditing procedures disclosed two instances of noncompliance, which are required to be reported in accordance with the Uniform Guidance and which are described in the accompanying schedule of findings and questioned costs as items 2018-001 and 2018-002. Our opinion on each major federal program is not modified with respect to this matter.
The University’s response to the noncompliance findings identified in our audit is described in the accompanying Schedule of Findings and Questioned Costs. The University’s response was not subjected to the auditing procedures applied in the audit of compliance and, accordingly, we express no opinion on the response.
Report on Internal Control Over Compliance
Management of the University is responsible for establishing and maintaining effective internal control over compliance with the types of compliance requirements referred to above. In planning and performing our audit of compliance, we considered the University’s internal control over compliance with the types of requirements that could have a direct and material effect on each major federal program to determine the auditing procedures that are appropriate in the circumstances for the purpose of expressing an opinion on compliance for each major federal program and to test and report on internal control over compliance in accordance with the Uniform Guidance, but not for the purpose of expressing an opinion on the effectiveness of internal control over compliance. Accordingly, we do not express an opinion on the effectiveness of the University’s internal control over compliance.
A deficiency in internal control over compliance exists when the design or operation of a control over compliance does not allow management or employees, in the normal course of performing their assigned functions, to prevent, or detect and correct, noncompliance with a type of compliance requirement of a federal program on a timely basis. A material weakness in internal control over compliance is a deficiency, or combination of deficiencies, in internal control over compliance, such that there is a reasonable possibility that material noncompliance with a type of compliance requirement of a federal program will not be prevented, or detected and corrected, on a timely basis. A significant deficiency in internal control over compliance is a deficiency, or a combination of deficiencies, in internal control over compliance with a type of compliance requirement of a federal program that is less severe than a material weakness in internal control over compliance, yet important enough to merit attention by those charged with governance.
Our consideration of internal control over compliance was for the limited purpose described in the first paragraph of this section and was not designed to identify all deficiencies in internal control over compliance that might be material weaknesses or significant deficiencies. We did not identify any deficiencies in internal control over compliance that we consider to be material weaknesses. However, material weaknesses may exist that have not been identified.
The purpose of this report on internal control over compliance is solely to describe the scope of our testing of internal control over compliance and the results of that testing based on the requirements of the Uniform Guidance. Accordingly, this report is not suitable for any other purpose.
October 15, 2018 McLean, Virginia

Schedule of Findings

The George Washington University Schedule of FindingsFor the year ended June 30, 2018
53
Section I – Summary of Auditor’s Results
Financial Statements Type of auditor’s report issued: Unmodified
Internal control over financial reporting:
Material weakness(es) identified? _____ yes x no Significant deficiency(ies) identified that are not
considered to be material weaknesses? _____ yes x none reported
Noncompliance material to financial statements noted?
_____ yes x no
Federal Awards Internal control over major federal programs:
Material weakness(es) identified? _____ yes x no Significant deficiency(ies) identified that are not
considered to be material weaknesses? _____ yes x none reported
Type of auditor’s report issued on compliance for major federal programs: Unmodified
Any audit findings disclosed that are required to be reported in accordance with section 2 CFR 200.516(a)?
x yes no
Identification of major federal programs: CFDA Number(s):
Various
Various
84.264
Dollar threshold used to distinguish between type A and type B programs:
Name of Federal Program or Cluster:
Student Financial Assistance Cluster
Research and Development Cluster
Rehabilitation Training Continuing Education
$3,000,000
Auditee qualified as low-risk auditee? x yes ____ no
The George Washington University Schedule of Findings For the year ended June 30, 2018
54
Section II – Financial Statement Findings
There are no matters to be reported.
Section III – Federal Award Findings and Questioned Costs
Finding 2018-001: Special Tests and Provisions: Student Verification
Federal Agency: Department of Education
Program: Student Financial Aid
CFDA#: Various
Award Number(s): Various
Award Year(s): July 1, 2017 – June 30, 2018
Criteria 34 CFR sections 668.51 through 668.61, which sets forth standards for verifying financial aid applicant information.
Condition During our testing of compliance with special tests and provisions, specifically with regard to verification of key information submitted by financial aid applicants, we noted an exception related to the incorrect input of income tax information by the University into the student information system. This was not a new issue identified in the current year and therefore represents a repeat finding.
Cause The employee who was manually transferring the information from the tax return to the University’s student system incorrectly transcribed the income tax information.
Effect No over- or under-awards resulted from the incorrect input of income tax information.
Questioned Costs There are no questioned costs associated with this finding, as no over- or under-awards resulted from the incorrect input of the data.
Recommendation We recommend the University implement enhanced training for employees responsible for the manual input of student information into the system. Additionally, we recommend that a secondary review be implemented to ensure someone independent of the person who manually inputs the data reviews for accuracy and completeness. This should include ensuring reviewers have the appropriate experience and training to identify errors in the manual entry process.

The George Washington University Schedule of Findings For the year ended June 30, 2018
55
Management’s Views and Corrective Action Plan The University acknowledges and agrees with the finding. Office of Student Financial Assistance (OSFA) will continue to require annual training on the Free Application for Federal Student Aid process for all who review student records. OSFA will enhance the trainings and reinforce prior to the beginning of review for early decision students.
Finding 2018-002: Special Tests and Provisions: Return of Title IV Funds
Federal Agency: Department of Education
Program: Student Financial Aid
CFDA#: Various
Award Number(s): Various
Award Year(s): July 1, 2017 – June 30, 2018
Criteria 34 CFR section 668.22, which addresses the treatment of Title IV funds when a student withdraws.
Condition During our testing of compliance with special tests and provisions, specifically with regard to the return of Title IV Funds when a student withdraws, we noted that for 1 out of 25 students, the University returned more than the unearned portion of the student’s unsubsidized loans. This was a new issue identified during the current year.
Cause The manual nature of the Return of Title IV funds calculation performed and lack of secondary review led to the occurrence of transcription errors, which in turn resulted in the conditions noted.
Effect The University returned $73 more than it should have based upon the unearned portion of Title IV funds.
Questioned Costs There are no questioned costs associated with this finding, as the University’s refund exceeded the unearned portion of the student’s Title IV funds. An adjustment was subsequently made by the University to correct the student’s account.
Recommendation We recommend that a secondary review be implemented to ensure someone independent of the person who performed the Return of Title IV Funds calculations reviews the information for accuracy and completeness. This should include ensuring reviewers have the appropriate experience and training to identify errors.

The George Washington University Schedule of Findings For the year ended June 30, 2018
56
Management’s Views and Corrective Action Plan The University acknowledges and agrees with the finding. As noted above, the University made an adjustment to correct the student’s account. OSFA recently upgraded the Return of Title IV form to simplify the process. During the year, OSFA is planning to restructure the department. This will allow a different tier system that will allow for an initial review and a secondary review by a supervisor for the Return of Title IV. GW is in the process of exploring a new system for the Return of Title IV calculations.

Summary Schedule of Prior Year Audit Findings

The George Washington University Summary Schedule of Prior Year Audit Findings For the year ended June 30, 2018
57
2017-001 – Special Tests and Provisions: Student Verification
Program Student Financial Aid
Condition During PwC testing of compliance with special tests and provisions, specifically with regards to verification of key information submitted by financial aid applicants, PwC noted incorrect income tax information was input by the University into the student information system for 1 of 25 students of our sample selected for testing (representing an $800 over award out of a total sample amount of $380,911).
Current Year Status During fiscal year 2017, OSFA held required trainings on the Free Application for Federal Student Aid (FAFSA) process for all who review student records. Additional training sessions were held to review the data elements required on the FAFSA. This finding was not fully remediated as of June 30, 2018 and is part of finding 2018-001.

Digitally signed by Sharon L. Heinle DN: cn=Sharon L. Heinle, o=George Washington University, ou=Office of the Comptroller, [email protected], c=US Date: 2018.10.15 09:32:49 -04'00'
58