The Geography of International Portfolio Flows ...
51
The Geography of International Portfolio Flows, International CAPM, and the Role of Monetary Policy Frameworks ∗ Roberto A. De Santis European Central Bank Using bilateral data on international equity and bond flows, we find that (i) the prediction of the International Capital Asset Pricing Model is partially met and that global equity markets might be more integrated than global bond markets, and (ii) asset allocators engage in trend-chasing activities, par- ticularly in bond markets. Moreover, over the turbulent 1998– 2001 period characterized by an equity bubble and the subse- quent burst, we find evidence that investors preferred portfolio assets of countries where the central bank gave relative impor- tance to money. As for EMU, once controlling for diversifica- tion benefits and the elimination of the exchange rate risk, we show that cross-border portfolio flows among euro-area coun- tries have increased due to the catalyst effect of EMU. Coun- tries’ shares in the world market portfolio, home bias, initial degree of misallocation across countries, past returns, diversi- fication benefits, and EMU can explain 35–40 percent of the total variation in equity and bond asset flows. JEL Codes: C13, C21, F37, G11. 1. Introduction The International Capital Asset Pricing Model (IntCAPM) suggests that international investors should hold assets of each country in ∗ The views expressed in this paper are those of the author and do not nec- essarily reflect those of the European Central Bank or the Eurosystem. Author Contact: European Central Bank, Kaiserstrasse 29, 60311 Frankfurt am Main, Germany. E-mail: roberto.de [email protected]; Tel: +49-69 1344 6611. 147
Transcript of The Geography of International Portfolio Flows ...
The Geography of International PortfolioFlows, International CAPM, and the Role of
Monetary Policy Frameworks∗
Roberto A. De SantisEuropean Central Bank
Using bilateral data on international equity and bond flows,we find that (i) the prediction of the International CapitalAsset Pricing Model is partially met and that global equitymarkets might be more integrated than global bond markets,and (ii) asset allocators engage in trend-chasing activities, par-ticularly in bond markets. Moreover, over the turbulent 1998–2001 period characterized by an equity bubble and the subse-quent burst, we find evidence that investors preferred portfolioassets of countries where the central bank gave relative impor-tance to money. As for EMU, once controlling for diversifica-tion benefits and the elimination of the exchange rate risk, weshow that cross-border portfolio flows among euro-area coun-tries have increased due to the catalyst effect of EMU. Coun-tries’ shares in the world market portfolio, home bias, initialdegree of misallocation across countries, past returns, diversi-fication benefits, and EMU can explain 35–40 percent of thetotal variation in equity and bond asset flows.
JEL Codes: C13, C21, F37, G11.
1. Introduction
The International Capital Asset Pricing Model (IntCAPM) suggeststhat international investors should hold assets of each country in
∗The views expressed in this paper are those of the author and do not nec-essarily reflect those of the European Central Bank or the Eurosystem. AuthorContact: European Central Bank, Kaiserstrasse 29, 60311 Frankfurt am Main,Germany. E-mail: roberto.de [email protected]; Tel: +49-69 1344 6611.
147

148 International Journal of Central Banking June 2010
proportion to the country’s share in the world market portfolio.1
This implies that all countries, in a world without transaction andinformation costs, would hold the same portfolio and would diver-sify their investment in other countries in proportion to the size oftheir financial markets. In this respect, global indices such as thepopular Morgan Stanley Capital International (MCSI) All CountryWorld Index (ACWI), Datastream Global index, and Standard andPoor’s (S&P’s) Global index are widely used by investors as theirperformance benchmarks for the global asset portion of their equityportfolio. The first aim of this paper is to examine whether countriesallocate money according to the simple prediction of the IntCAPM.We also assess the empirical relevance of the IntCAPM for the bondmarket. In order to carry out this test, we employ the Lehman Broth-ers Multiverse index released in 2001 as the benchmark for the globalbond market.
It is useful to point out that recent studies have looked at the con-temporaneous link between the actual weight of country j in fundi’s equity portfolio and the optimal weight suggested by the Int-CAPM for emerging markets (Gelos and Wei 2005). We instead aimat investigating whether portfolio flows (divided by the size of theinvestors) and, therefore, the global reallocation of portfolio capitalacross twenty-three developed countries and seven emerging-marketeconomies are functions of the optimal weights at the beginning ofthe period as suggested by the IntCAPM.
In order to carry out such a study, we construct a database onbilateral cross-border equity and bond flows for thirty countries cov-ering in 2001 80 percent of world GDP, 84 percent of world inter-national investment in equity portfolios, and 71 percent of worldinternational investment in bonds and notes portfolios. Therefore,the thirty countries of the sample and the cross-section of 870 bilat-eral observations encompass all important international investmentdecisions (excluding official investments by monetary authorities).
Specifically, we construct measures of bilateral net asset flows ofequities and bonds mainly on the basis of the International Monetary
1The International Capital Asset Pricing Model and the Intertemporal AssetPricing Model are often referred to using the same label: I-CAPM. We useIntCAPM to avoid confusion.

Vol. 6 No. 2 The Geography of International Portfolio Flows 149
Fund (IMF) Coordinated Portfolio Investment Survey (CPIS) data-base, which reports bilateral holdings at end-1997 and end-2001. Wedefine net asset flows of equities and bonds as the purchases minusthe sales of country k’s equities and bonds by citizens of country c.The considered period was characterized by the sharp rise in cross-border capital flows globally, the increased percentage of householdsavings invested in capital markets, the boom and bust of the equitybubble, and the establishment of European Economic and MonetaryUnion (EMU) in January 1999. Looking at cumulated portfolio netasset flows over the four-year period 1998–2001 has the advantageof abstracting from short-run variations in international portfolioflows, which could be due to unexpected economic news and cyclicaldevelopments, as well as phenomena which are difficult to pin down.
The second aim of the paper is to assess whether, during thisturbulent period for asset markets, central banks’ monetary pol-icy frameworks across countries influenced the geography and sizeof international capital flows.2 As a consequence of the asset-priceshocks, international investors might have preferred to reallocatetheir portfolio assets toward countries that gave importance to spe-cific characteristics of monetary policy frameworks. Therefore, weemploy the results of a survey commissioned and coordinated by theBank of England in 1998 aiming at measuring several key charac-teristics of the monetary frameworks consistently across ninety-fourcentral banks (Mahadeva and Sterne 2000). Moreover, given the newmonetary policy framework, which came to light in Europe in Janu-ary 1999, we also look and control for the potential impact of EMUon global portfolio flows as found by Lane (2006) for fixed-incomeinvestments and by De Santis and Gerard (2009) for both equityand fixed-income investments.
International portfolio flows have skyrocketed in the last fifteenyears, and a large number of studies have tried to explain their
2A large body of the literature pointed to the importance of institutionalcharacteristics of the monetary policy framework—such as central banks’ inde-pendence, accountability, and transparency—to control inflationary expectationsand safeguard financial stability (i.e., Rogoff 1985; Alesina and Summers 1993).Several measures of central banking independence were also constructed andused to study the impact on inflation (Grilli, Masciandaro, and Tabellini 1991;Cukierman 1992; Jacome and Vazquez 2005).

150 International Journal of Central Banking June 2010
determinants. However, data limitations have meant that these con-tributions focused on country aggregates of net equity and debt flows(De Santis and Luhrmann 2009), on country aggregates of inflowsof equity capital—foreign direct investment plus portfolio equitysecurities—(Alfaro, Kalemli-Ozcan, and Volosovych 2007), or haveonly considered a single source country, most often the United Statesbeing the recipient or the source of the investment (Bohn and Tesar1996; Brennan and Cao 1997; Coval and Moskowitz 1999; Froot,O’Connell, and Seasholes 2001; Huberman 2001; Ahearne, Griever,and Warnock 2004). Portes and Rey (2005) is the only study thatlooks at bilateral cross-border equity flows between fourteen coun-tries pointing to the role played by information costs. De Santis andGerard (2009) is the only study looking at the determinants of bilat-eral changes in portfolio country weights in both equity securitiesand fixed income for a panel of thirty countries pointing to the roleplayed by the non-linear fully hedged diversification benefits, the ini-tial degree of misallocation, and the establishment of EMU. Anotherbranch of the literature has studied the determinants of bilateralbank and portfolio holdings using empirical methods borrowed fromthe traditional gravity models of international goods trade (Faruqee,Li, and Yan 2004; Lane 2006; Aviat and Coeurdacier 2007; Lane andMilesi-Ferretti 2008; Papaioannou 2009).
Our main contribution to the literature is that we find clear evi-dence that portfolio asset flows are influenced positively by the rela-tive size of the recipient countries’ financial markets. The predictionsof the IntCAPM are only partially met, as the estimated coefficienton the benchmarks is less than unity: 0.4 for the equity portfolioand 0.2 for the bond portfolio. Moreover, we find that asset alloca-tors engage in trend-chasing activities, particularly in bond markets.These results do not change when controlling for home bias and theinitial degree of underweight, which enters non-linearly, thereforepotentially proxying for initial direct and indirect costs.
We also find that, during the turbulent 1998–2001 period, inter-national investors in both equity and fixed-income markets had atendency to purchase assets issued by countries whose monetaryauthorities gave importance to money.
We estimate on a 95 percent confidence interval the potential cat-alyst effect of the euro within the euro area to amount to USD 22–47billion in equity securities and USD 32–76 billion in bonds and notes,

Vol. 6 No. 2 The Geography of International Portfolio Flows 151
which implies that EMU might have enhanced risk sharing amongeuro-area member states. The catalyst effect of the euro is esti-mated after controlling for the elimination of the exchange rate riskamong euro-area member states and the effect of being a memberof the European Union (EU). EMU boosted the cross-border invest-ment activity among euro-area member states due to the removal ofintra-area currency-matching rules, the sharing of common tradingplatforms, and the cross-border merger of the Amsterdam, Brussels,Lisbon, and Paris exchanges (Euronext).
The proportion of the total variation explained by our empiricalmodels amounts to 35–40 percent for both equity and bond flows.This is a valuable result given that we look at the geography ofinternational portfolio flows during a very difficult period for assetmanagement.
The remainder of the paper is organized as follows. Section 2discusses the key ideas. Section 3 describes the databases used forthe analysis. Section 4 outlines the empirical approach and teststhe IntCAPM. Section 5 assesses the role of monetary policy frame-works and estimates the potential impact of EMU on portfolio flows.Section 6 reports how robust the model specifications are when con-trolling for other variables, which could potentially affect portfolioflows. Section 7 concludes.
2. A Simple Theory
2.1 The IntCAPM
Consider a representative investor from a generic country c and letγc denote the investor’s degree of risk aversion. Also, indicate withμc the (N × 1)-vector of expected returns in excess of the risk-freerate on the N risky assets, and with Σc the expected (N × N)-covariance matrix for the risky assets, where the subscript c indi-cates that returns are measured in the currency of country c. If theinvestor faces no constraints on foreign holdings and financial mar-kets are perfectly integrated, mean-variance optimization implies thefollowing portfolio allocation:
w∗c,t =
1γc
Σ−1c,t μc,t,

152 International Journal of Central Banking June 2010
where w∗c,t is the (N × 1)-vector of optimal weights for the N risky
assets.The optimal weights are not observable. However, in a fully
integrated world where purchasing power parity (PPP) holds, Sol-nik (1974) and Sercu (1980) show that the international version ofthe simple CAPM of Sharpe (1964) and Lintner (1965) holds: themarket equilibrium is achieved when all investors hold the worldmarket portfolio, where each country portfolio is weighted by itsmarket capitalization. Therefore, an observable estimate of the opti-mal weight invested in each country k is equal to that country k’smarket capitalization weight in the world index portfolio, wBench
k,97 :
w∗c,t = wBench
k,t .
There exist several standard benchmarks for the equity portfolio,such as the popular MCSI ACWI, Datastream Global index, andS&P’s Global index, as they provide consistent data, have suffi-ciently long price history, and are widely used by global investors.We use the Datastream Global index and compare the results withS&P’s Global index, as both include the country coverage used inthis study.
To our knowledge, a similar benchmark for the bond portfoliofor such a number of countries was never used due to difficulty incompiling countries’ bond market capitalization at market value. InJanuary 2001, Lehman Brothers launched a new index (i.e., Multi-verse index), which provides a broad-based measure of the interna-tional fixed-income bond market, with index history dating back toJanuary 1999. Multiverse index provides information on the overallstatus of the global debt asset class and offers a means to comparethe entire global debt asset class across countries.
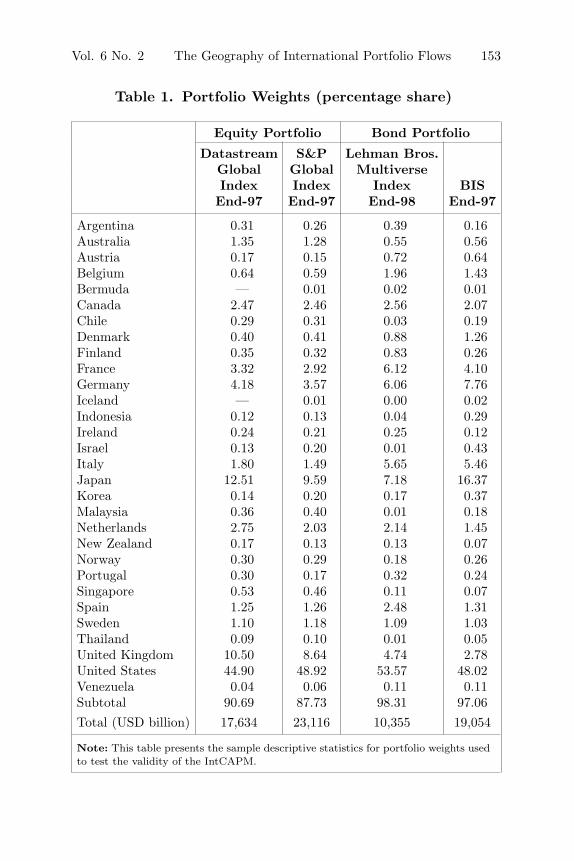
Table 1 provides the estimated market shares across countries inboth equity and bond markets, which will then be used to test theIntCAPM. The first and second columns report the equity portfolioweights computed using the market value of the Thomson Data-stream and S&P’s Global indices, respectively. The last two columnsreport, respectively, the bond portfolio weights computed using themarket value of the Lehman Brothers Multiverse index and the out-standing amount as reported by the Bank for International Settle-ments (BIS). The equity portfolio weights of Datastream and S&P
Vol. 6 No. 2 The Geography of International Portfolio Flows 153
Table 1. Portfolio Weights (percentage share)
Equity Portfolio Bond Portfolio
Datastream S&P Lehman Bros.Global Global MultiverseIndex Index Index BISEnd-97 End-97 End-98 End-97
Argentina 0.31 0.26 0.39 0.16Australia 1.35 1.28 0.55 0.56Austria 0.17 0.15 0.72 0.64Belgium 0.64 0.59 1.96 1.43Bermuda — 0.01 0.02 0.01Canada 2.47 2.46 2.56 2.07Chile 0.29 0.31 0.03 0.19Denmark 0.40 0.41 0.88 1.26Finland 0.35 0.32 0.83 0.26France 3.32 2.92 6.12 4.10Germany 4.18 3.57 6.06 7.76Iceland — 0.01 0.00 0.02Indonesia 0.12 0.13 0.04 0.29Ireland 0.24 0.21 0.25 0.12Israel 0.13 0.20 0.01 0.43Italy 1.80 1.49 5.65 5.46Japan 12.51 9.59 7.18 16.37Korea 0.14 0.20 0.17 0.37Malaysia 0.36 0.40 0.01 0.18Netherlands 2.75 2.03 2.14 1.45New Zealand 0.17 0.13 0.13 0.07Norway 0.30 0.29 0.18 0.26Portugal 0.30 0.17 0.32 0.24Singapore 0.53 0.46 0.11 0.07Spain 1.25 1.26 2.48 1.31Sweden 1.10 1.18 1.09 1.03Thailand 0.09 0.10 0.01 0.05United Kingdom 10.50 8.64 4.74 2.78United States 44.90 48.92 53.57 48.02Venezuela 0.04 0.06 0.11 0.11Subtotal 90.69 87.73 98.31 97.06Total (USD billion) 17,634 23,116 10,355 19,054
Note: This table presents the sample descriptive statistics for portfolio weights usedto test the validity of the IntCAPM.

154 International Journal of Central Banking June 2010
are very similar. Some small differences can be identified for the bondportfolio weights mainly due to the fact that the Lehman BrothersMultiverse index is evaluated at market value, while the BIS bondoutstanding is at face value.
The computations reported in table 1 indicate that accordingto the IntCAPM, almost 50 percent of world portfolio should beinvested in U.S. securities. As for the euro area (e.g., Luxembourgand Greece), approximately 14 percent of world portfolio should beinvested in euro-area equity securities and 25 percent in euro-areabonds.
We will report the empirical results using Datastream weights forequity portfolio and Lehman Brothers weights for bond portfolio.3
It is useful to point out that all the results remain invariant whenusing, respectively, S&P weights and BIS weights.
2.2 The Role of Central Banks
There is no doubt that capital flows are affected by the institutionsof a country (Alfaro, Kalemli-Ozcan, and Volosovych 2007; Coeur-dacier, De Santis, and Aviat 2009; De Santis and Luhrmann 2009).However, there is no empirical study looking at the role of centralbanking institutional setting. Surely, monetary policy influences thedecisions of international investors, but less obvious is understand-ing why specific central bank monetary policy characteristics shouldaffect international investment decisions. Moreover, at the turn ofthe century, as a consequence of the asset-price shocks, internationalinvestors might have preferred to reallocate their portfolio assetstoward countries that gave importance to specific characteristics ofmonetary policy frameworks.
Therefore, we employ the results of a comprehensive survey com-missioned by the Bank of England in 1998, because it aimed atmeasuring consistently the diversity in monetary frameworks acrossninety-four central banks with a coverage of characteristics thatstretched beyond previous studies (Mahadeva and Sterne 2000).Specifically, we look at the following characteristics: (i) short- and
3The employed portfolio weights for Bermuda and Iceland amount to 0.01percent as indicated by S&P’s Global index.

Vol. 6 No. 2 The Geography of International Portfolio Flows 155
medium-term policy focus—inflation, money, exchange rate, and dis-cretionary policy; (ii) institutional characteristics—independence,accountability, and transparency of policy explanations; and (iii)structural characteristics—importance given to financial stability inthe setting of monetary policy instruments.
Central bank independency is defined by a range of character-istics covering legal objectives, goal, instruments, finance of thegovernment deficit, and term of office of the governor.
The measure of accountability was constructed by assessing howfar the central bank has a legal or informal responsibility to explainand defend its policies to government and parliament and to involveparliament in monetary policy decisions. Therefore, the measurerelates to accountability to a specific target as well as to govern-mental and parliamentary monitoring of the central bank.
The measure of policy explanations is defined by the effortmade by the central bank in explaining policy decisions, assess-ment of the economy, and forecasts and forward-looking analy-sis. It can be interpreted as one aspect of transparency in thatdeeper explanations of policy, which allow us to understand itsgoal and the means by which policymakers react to changes in eco-nomic conditions, is one important manifestation of higher degree oftransparency.
As for the measures of monetary policy objectives, they aredefined and classified by the exchange rate, money growth, andinflation dimensions, rather than just one dimension, and give thedegree to which a country’s policy focused on a particular objective.Therefore, the survey is constructed to avoid a 100 percent commit-ment to a single objective, as in most cases definitions that focus onthe explicit variable targeted may not fully capture policy prefer-ences. The general measure of discretion is a non-linear combinationof the scores for exchange rate focus, money focus, and inflationfocus.
Finally, the importance of financial stability in the monetaryframework is defined by various financial stability issues, such asthe volatility of asset prices, domestic and overseas financial sectorinsolvency, and credit rationing.
The eight indices range between 0 and 100, where a high scoreimplies more independence, more accountability of central bank togovernment, more policy explanations to those outside the central
156 International Journal of Central Banking June 2010
bank, and a higher degree of importance given to policy objectivesand financial stability issues (see table 2).4
Some of these indices are also strongly correlated (see table 3).The focus on the exchange rate is strongly correlated with the focuson inflation and money, with the transparency index, and with theimportance given to financial stability; in turn, the focus on moneyis strongly correlated with the importance of financial stability.
Interestingly, independence and accountability are negativelycorrelated (−20 percent), which implies that explaining and defend-ing monetary policies to government and parliament and the involve-ment of parliament in monetary policy decisions might be partly seenby central banks as an infringement on their independence.
2.3 The Role of EMU
The establishment of EMU in January 1999 was a fundamentalinstitutional change in the world economy that has affected thedirection and the magnitude of global portfolio flows. Lane (2006)and De Santis and Gerard (2009) uncover evidence of euro-areainvestors having assigned a higher weight to portfolio investmentin euro-area countries, which implies that EMU has facilitatedportfolio market access, enhancing risk sharing and regional finan-cial integration. EMU boosted the cross-border investment activityamong euro-area member states due to the removal of intra-areacurrency-matching rules, the sharing of common trading platforms(such as the MTS model composed of several national Europeanmarkets for trading fixed-income securities),5 and the cross-bordermerger of the Amsterdam, Brussels, Lisbon, and Paris exchanges(Euronext).
In most countries, portfolio funds are often subject to someform of restriction on the level of their non-domestic investment.
4For a comprehensive analysis on the construction of all the indices measuringthe monetary policy frameworks across countries, refer to chapter 4 of Mahadevaand Sterne (2000). Bermuda and Venezuela are not included in the survey. There-fore, we use the U.S. characteristics for Bermuda, as the Bermuda dollar is atpar with the U.S. dollar, and we use the Uruguay characteristics for Venezuelagiven the similarities of the monetary policy frameworks of these two countries(see Jacome and Vazquez 2005).
5Detailed information can be found at http://www.mtsgroup.org/.

Vol. 6 No. 2 The Geography of International Portfolio Flows 157
Tab
le2.
Sam
ple
Des
crip
tive
Sta
tist
ics
for
the
Char
acte
rist
ics
ofth
eM
onet
ary
Pol
icy
Fra
mew
ork
Str
uct
ura
lPol
icy
Focu
sIn
stit
uti
onal
Fac
tors
Fac
tor
Exch
ange
Fin
anci
alIn
flat
ion
Mon
eyR
ate
Dis
cret
ion
Indep
enden
ceA
ccou
nta
bility
Tra
nsp
aren
cySta
bility
Arg
enti
na0
010
00
7910
053
58A
ustr
alia
940
06
7383
788
Aus
tria
00
8813
6867
2717
Bel
gium
00
946
7733
688
Ber
mud
a19
250
8492
8395
33C
anad
a88
06
1691
100
7933
Chi
le88
031
2893
1783
17D
enm
ark
00
946
8875
700
Fin
land
560
6366
9192
748
Fran
ce40
4658
8490
8353
50G
erm
any
1988
1329
9617
7033
Icel
and
190
7534
5992
658
Indo
nesi
a50
636
6656
8383
83Ir
elan
d19
075
3487
8378
8Is
rael
880
1319
6610
068
33It
aly
4444
5094
8858
8133
Japa
n50
00
5093
089
50K
orea
6375
659
7383
8858
(con
tinu
ed)

158 International Journal of Central Banking June 2010
Tab
le2.
(Con
tinued
)
Str
uct
ura
lPol
icy
Focu
sIn
stit
uti
onal
Fac
tors
Fac
tor
Exch
ange
Fin
anci
alIn
flat
ion
Mon
eyR
ate
Dis
cret
ion
Indep
enden
ceA
ccou
nta
bility
Tra
nsp
aren
cySta
bility
Mal
aysi
a44
038
7585
8371
67N
ethe
rlan
ds0
088
1391
8379
8N
ewZea
land
940
06
8910
092
8N
orw
ay0
069
3157
5089
17Por
tuga
l6
075
2885
8378
33Si
ngap
ore
190
5653
9025
4917
Spai
n56
063
6680
8359
33Sw
eden
100
013
697
8395
42T
haila
nd31
66
7582
5067
83U
nite
dK
ingd
om10
00
00
7710
094
16U
nite
dSt
ates
1925
084
9283
9533
Ven
ezue
la25
088
2570
834
17
Note
s:T
his
table
pre
sent
sth
esa
mple
des
crip
tive
stat
isti
csfo
rth
ech
arac
teri
stic
sof
the
mon
etar
ypol
icy
fram
ewor
k(s
eeM
ahad
eva
and
Ste
rne
2000
,pp.14
1–62
).T
he
eigh
tin
dic
esra
nge
bet
wee
n0
and
100,
wher
ea
hig
hsc
ore
implies
mor
ein
dep
enden
ce,m
ore
acco
unt
ability
togo
vern
men
ts,m
ore
pol
icy
expla
nat
ions
toth
ose
outs
ide
the
cent
ralban
k,an
da
hig
her
deg
ree
ofim
por
tance
give
nto
pol
icy
obje
ctiv
esan
dfinan
cial
stab
ility
issu
es.

Vol. 6 No. 2 The Geography of International Portfolio Flows 159
Tab
le3.
Cor
rela
tion
Mat
rix
ofth
eSta
teof
Dev
elop
men
t,Q
ual
ity
ofth
eIn
stitution
s,an
dM
onet
ary
Fra
mew
orks
Var
iable
s
Dev
elopm
ent
Qual
ity
ofth
eIn
stit
uti
ons
Monet
ary
Policy
Fra
mew
ork
s
GP
BC
RD
CL
LP
ICP
CIN
FM
ON
FX
DIS
IND
AC
CT
RA
FS
GP
1.00
BC
0.29
1.00
RD
0.66
0.32
1.00
CL
−0.
65−
0.09
−0.
451.
00LP
0.87
0.31
0.67
−0.
651.
00IC
0.78
0.08
0.42
−0.
540.
791.
00P
C0.
710.
020.
53−
0.58
0.85
0.77
1.00
INF
−0.
17−
0.08
0.18
−0.
01−
0.01
−0.
180.
151.
00M
ON
−0.
100.
030.
100.
17−
0.17
−0.
27−
0.35
−0.
051.
00FX
0.08
−0.
44−
0.24
−0.
070.
010.
300.
01−
0.68
−0.
321.
00D
IS−
0.15
0.32
−0.
090.
30−
0.20
−0.
22−
0.37
−0.
120.
44−
0.21
1.00
IND
0.21
0.39
0.29
−0.
240.
370.
400.
370.
120.
06−
0.21
0.16
1.00
AC
C−
0.10
−0.
37−
0.02
−0.
19−
0.04
−0.
230.
080.
26−
0.19
0.03
−0.
12−
0.20
1.00
TR
A0.
280.
370.
34−
0.31
0.31
0.12
0.27
0.37
0.12
−0.
600.
080.
280.
021.
00FS
−0.
580.
23−
0.26
0.56
−0.
61−
0.70
−0.
720.
090.
42−
0.38
0.49
−0.
02−
0.05
0.07
1.00
Note
s:T
heva
riab
lesof
this
tabl
ear
ela
bel
edas
follo
ws:
GP
=C
ount
ries
’GD
Pper
capi
tam
inus
the
GD
Pper
capi
taof
Nor
way
;BC
=B
ank
cred
itto
the
priv
ate
sect
or/G
DP
min
usw
orld
shar
e;R
D=
R&
Dex
pen
ditu
re/G
DP
min
usw
orld
shar
e;C
L=
Civ
illib
erti
esin
dex;
LP
=La
Por
tain
dex;
IC=
ICR
Gin
dex;
PC
=Per
ceiv
edco
rrup
tion
inde
x;IN
F=
Infla
tion
focu
sin
dex;
MO
N=
Mon
eyfo
cus
inde
x;FX
=E
xcha
nge
rate
focu
sin
dex;
DIS
=D
iscr
etio
nfo
cus
inde
x;IN
D=
Inde
pen
denc
ein
dex;
AC
C=
Acc
ount
abili
tyin
dex;
TR
A=
Tra
nspa
renc
yin
dex;
FS
=R
ole
offin
anci
alst
abili
tyin
dex.
160 International Journal of Central Banking June 2010
Currency-matching rules for portfolio funds, for example, are set toensure that foreign currency risk is reduced. Since the introductionof the euro in January 1999, the intra-euro-area currency-matchingrule has shifted from national currencies to the euro. The resultinggreater flexibility allowed individual euro-area country portfolios tosecure better diversification of investment risk by purchasing morenon-domestic euro-area assets.6
To control for the effect of EMU on global capital flows as wellas to measure its average impact, we include two sets of binary vari-ables. First we include a dummy which takes the value of 1 if thecountry receiving the investment belongs to the EMU. The coeffi-cient of this dummy measures the average portfolio asset flow intoindividual EMU countries for all investors. However, the effect of thesingle currency may be more pronounced on the investment decisionsof investor-residents in the euro area. To control for this differentialeffect, we include a dummy variable which takes the value of 1 whenboth investing and receiving countries belong to the EMU. The coef-ficient of this dummy measures the average portfolio asset flow intoindividual euro-area countries for all euro-area investors that comesin addition to the average flow observed for all investors. Accord-ingly, it quantifies the average financial integration effect of EMUfor the individual euro-area member state.7
6For example, Europe’s life insurance companies could not hold more than 20percent of their assets in foreign currencies unless they were matched by liabili-ties denominated in the same currency. As the vast majority of those liabilitieswere denominated in national currency, so were most of the assets. Quantitativerestrictions are also typical for pension funds. For a description of the restric-tions in the EU before EMU, see International Monetary Fund (1997, table 63,p. 213).
7A further complication comes from the role of the London market as a majorintermediary of foreign investments from and to the rest of the world. Due tothe large size and higher sophistication of the London markets, many investorschoose to make their foreign investments via the United Kingdom. For exam-ple, a Japanese investor may choose to select a British investment managerto invest in euro-area equities and bonds. The IMF data on portfolio holdingsreport an accurate country breakdown of bilateral investment, which tries to iden-tify the residence of the issuer. Nevertheless, since the city of London is a keyEuropean player, we control for that by including two additional dummies. Thefirst dummy takes a value of 1 if the receiving country is the United Kingdom.A second dummy takes the value of 1 if the investing country belongs to theEMU and the receiving country is the United Kingdom.

Vol. 6 No. 2 The Geography of International Portfolio Flows 161
3. Data: The Geography of International Portfolio Flows
The IMF Coordinated Portfolio Investment Survey (CPIS) databasereports the portfolio positions of international investors, excludingthe official holdings of monetary authorities disaggregated by regionsand instruments. More specifically, the CPIS data set provides ageographical breakdown of international portfolio holdings disag-gregated by three instruments—equity securities, long-term debtsecurities, and short-term debt securities—and includes virtually allmajor international investment, excluding foreign direct investment.An additional advantage of this data set is the consistency of thecompilation criteria:
• Participants undertake a benchmark portfolio asset survey atthe same time.
• Participants follow definitions and classifications that aremutually consistent by following the methodology set out inthe fifth edition of the IMF Balance of Payments Manual.
• All participants provide a breakdown of their stock of port-folio investment assets by the country of residency of thenon-resident issuer.
There are also several issues related to the CPIS database: (i)data on the rather poor countries is missing; (ii) coverage is incom-plete due to lack of important portfolio holders, such as Middle Eastcountries and China; (iii) several transactions are reported as con-fidential for offshore financial centers and emerging markets; (iv)liabilities are bigger than assets, pointing toward underreporting;and (v) collection methods differ from country to country, which isan issue particularly for identifying the nationality and/or institu-tional type of the investor. However, we focus the analysis on themost important countries, which have a long experience in com-piling balance of payments data and international investment posi-tions, while at the same time encompassing all important interna-tional investment decisions. The exclusion of Middle East countries,China, and monetary authorities is desired, as they have been pur-chasing securities to control developments in the exchange rate orstrategic assets. Both objectives are not related to the mean-varianceoptimization.

162 International Journal of Central Banking June 2010
The CPIS database for the year 1997 covers twenty-nine of thelargest economies in the world, nine of which belong to the euroarea—Austria, Belgium, Finland, France, Ireland, Italy, Nether-lands, Portugal, and Spain; the three old EU member states butnot members of the euro area—Denmark, Sweden, and the UnitedKingdom; another ten developed countries—Australia, Bermuda,Canada, Iceland, Israel, Japan, New Zealand, Norway, Singapore,and the United States; four Asian emerging markets—Indonesia,Korea, Malaysia, and Thailand; and three Latin American emergingmarkets—Argentina, Chile, and Venezuela. Germany did not reportdata in 1997, but did so in 2001. Since Germany is a key euro-areamember and its international portfolio holdings are substantial, weused an annual database on international investment positions fromthe Bundesbank to derive the geographical allocation of equities andbonds and notes positions abroad held by German residents at end-1997. Specifically, we use the Bundesbank 1997 and 2001 recordsand adjust all the 1997 positions consistently (including exchangerate movements) to make them comparable to the 2001 holdingsrecorded in the CPIS. In all, we employ a matrix formed by thirtycountries (that is 870 observations). However, we excluded from thedatabase the investing countries that allocated explicitly to specificreceiving countries less than 75 percent of their international port-folio either in 1997 or in 2001, or those countries that held less than100 million in U.S. dollars in their international portfolio in 1997or in 2001. In other words, we opted for excluding from the cross-section analysis economies that reported undetermined investmentpositions vis-a-vis the countries in the sample.8
The change in foreign holdings from end-1997 to end-2001 couldbe due to capital gains, exchange rate changes, portfolio trans-actions, and other adjustments (i.e., reclassification). Under thehypothesis that cross-border other adjustments are relatively neg-ligible, the actual portfolio flows from the investing country c tothe receiving country k over the period 1998–2001, Tck,t, can becomputed using the IMF data model widely employed in the field of
8We excluded the investment of Argentina, Indonesia, Israel, Thailand, andVenezuela from the equity holdings database and the investment of Iceland, Israel,and New Zealand from the long-term debt instrument holdings database. How-ever, in doing so, we simply lose, respectively, 0.05 percent and 0.20 percent ofallocated global equity and bond holdings.

Vol. 6 No. 2 The Geography of International Portfolio Flows 163
balance of payments, international investment positions, and exter-nal debt statistics:9
Tck,t =(
Invc,k,01
ek,01pk,01− Invc,k,97
ek,97pk,97
)ek,tpk,t
=[
Invc,k,01
(1 + xk,t) (1 + rk,t)− Invc,k,97
]ek,tpk,t
ek,97pk,97,
where Invc,k is the amount invested by country c in country k financialassets and held in country c currency; ek and pk are, respectively, theexchange rate (i.e., country c currency per unit of country k currency)and the asset price in country k financial assets at the end of 1997and at the end of 2001; xk,t and rk,t are, respectively, the change inthe exchange rate and the total asset return over the four-year period;and ek,t and pk,t are, respectively, the average exchange rate and theaverage asset price over the same period. This approach implies thattransactions are assumed to occur uniformly over the period 1998–2001. However, it facilitates the computation of the bilateral cross-border portfolio flows, as they do not depend on the choice of the priceindices’ base year.
As for the exchange rate adjustments, one should note that mostof the global portfolio allocation is in U.S. dollars and euros. Accord-ing to a subtotal of thirteen countries used in this study, 75 percentof equity portfolio and 80 percent of long-term debt portfolio are heldin these two currencies. International investors also held less than10 percent of their portfolios in British pounds and Japanese yen.Therefore, it would be a mistake to use local currencies in estimat-ing cross-border portfolio flows. Moreover, London is a key Europeanfinancial center generally issuing European assets in euros. Since theJapanese yen depreciated by only 1 percent against the U.S. dollarover the 1998–2001 period, and given the lack of a disaggregated cur-rency and geographical breakdown of portfolio holdings, a potentialalternative is to assume that all assets issued by European countriesare issued in euros, while all assets issued by non-European coun-tries are issued in U.S. dollars. This assumption finds its support inthe European Central Bank’s studies on the international role of theeuro, which point out that (i) the use of the euro in international
9See Committeri (2000) for a comprehensive analysis.

164 International Journal of Central Banking June 2010
markets has a strong regional dimension, as it is focused on countriesand financial centers geographically close to the euro area, and (ii)the city of London plays a pivotal role regarding the use of the eurooutside the euro area (European Central Bank 2003).
Table 4 reports the estimated cross-border portfolio flows aggre-gated for the thirty countries in the sample and the aggregate cumu-lated figures reported by the International Financial Statistics (IFS)of the IMF over the same period. The estimated flows and the IFSfigures are not directly comparable, as important countries such asoffshore centers and several Asian and Latin American countries arenot included in the CPIS database. Moreover, the cross-border flowsof debt instruments reported by the IFS include official flows frommonetary authorities and are the sum of bond and money marketinstrument flows. For example, the estimated foreign capital flows inU.S. long-term debt securities amount to USD 173 billion, while theU.S. debt liabilities reported by the IFS, which include the flows offoreign monetary authorities and offshore centers, amount to USD869 billion. However, it is useful to point out that the reserve assetsof Japan, China, and Southeast Asian countries increased by approx-imately USD 450 billion over the 1998–2001 period, and it is gener-ally agreed that the Asian monetary authorities purchased mostlyU.S. Treasury securities. It is also generally believed that monetaryauthorities might have a different profit-maximizing behavior thanprivate investors. Hence, the exclusion of their investment decisions,which is implicit when using the CPIS database, is cardinal to testthe IntCAPM.
Although differences for individual transactions clearly exist,the cross-section is acceptable. In fact, the correlation coefficientsbetween the estimated and the IFS figures amount to 95 percentand 88 percent on the asset side of equity and bond securities, andto 90 percent and 78 percent on their respective liability side.
The aggregate results for four country groupings show that port-folio flows of euro-area member states were substantially largercompared with other regions, particularly in the bond market (seetable 5). A deeper inspection of the data reveals, first, that allregions of the world purchased euro-area assets over the period 1998–2001 (see figure 1). Second, intra-euro-area allocation was extremelyhigh. The portfolio transactions among euro-area member statesamounted to USD 315 billion in equity securities and USD 754

Vol. 6 No. 2 The Geography of International Portfolio Flows 165
Tab
le4.
Est
imat
edan
dIF
SPor
tfol
ioFlo
ws
by
Cou
ntr
y,19
98–2
001
(USD
Million
s)
Est
imat
edU
sing
CP
IS(T
hir
tyC
ountr
ies)
IFS
(All
Countr
ies)
Equity
Bonds
Equity
Deb
tIn
stru
men
ts
Ass
etLia
bility
Ass
etLia
bility
Ass
etLia
bility
Ass
etLia
bility
Countr
ies
(1a)
(2a)
(3a)
(4a)
(1b)
(2b)
(3b)
(4b)
Arg
enti
na72
18−
1155
0−
156
−35
509
3057
−14
178
1894
9046
Aus
tral
ia26
894
−44
9742
10−
5550
2133
528
269
1391
934
153
Aus
tria
1694
6−
1668
2993
147
256
2591
220
3452
613
8933
0B
elgi
um32
027
1144
467
878
4369
4N
AN
AN
AN
AB
erm
uda
−28
958
5757
420
7724
9N
AN
AN
AN
AC
anad
a66
765
−11
080
−28
79−
2338
887
687
4631
810
347
7349
Chi
le17
39−
2394
1403
3372
6646
024
6043
58D
enm
ark
2310
5−
605
1212
6−
2865
2446
431
8423
611
2012
2Fin
land
1642
346
761
2649
3−
3564
1994
332
284
3017
682
33Fr
ance
9688
695
292
2045
0415
9606
9693
113
0205
3181
0128
6335
Ger
man
y16
8440
8782
316
6482
1963
1931
2046
1344
1131
7931
3735
99Ic
elan
d12
0212
461
1197
1340
6914
228
36In
done
sia
215
2845
6−
4435
NA
−57
320
−92
Irel
and
8789
444
127
1071
9926
771
1166
3724
8967
2273
3640
136
Isra
el11
1933
9729
9914
4814
3069
6635
86−
94It
aly
1031
3217
1214
2121
7951
1768
7172
1517
8246
2957
27Ja
pan
3070
310
8697
8991
8−
7570
7740
315
7815
3623
9413
3065
Sout
hK
orea
111
2226
0−
2066
−34
398
1201
3928
855
58−
5681
Mal
aysi
a−
401
−77
73−
9−
6245
NA
NA
028
3
(con
tinu
ed)

166 International Journal of Central Banking June 2010
Tab
le4.
(Con
tinued
)
Est
imat
edU
sing
CP
IS(T
hir
tyC
ountr
ies)
IFS
(All
Countr
ies)
Equity
Bonds
Equity
Deb
tIn
stru
men
ts
Ass
etLia
bility
Ass
etLia
bility
Ass
etLia
bility
Ass
etLia
bility
Countr
ies
(1a)
(2a)
(3a)
(4a)
(1b)
(2b)
(3b)
(4b)
Net
herl
ands
8077
180
545
1123
5518
3460
1255
7064
234
1648
4119
5377
New
Zea
land
2071
−33
2319
44−
1362
3482
−33
211
8715
34N
orw
ay31
222
2658
2908
393
1534
820
3296
3657
420
665
Por
tuga
l30
4137
4411
857
2483
550
8856
4220
095
2221
9Si
ngap
ore
9342
1591
630
799
8844
3446
127
3912
749
801
Spai
n40
517
2949
065
833
7951
863
973
4697
213
2118
1007
06Sw
eden
4350
3−
1246
319
732
−75
6259
076
1143
931
101
1182
1T
haila
nd−
7930
3320
8−
6708
NA
2486
505
−33
29U
nite
dK
ingd
om−
1075
334
4075
5939
873
361
1209
2239
1493
1885
4715
2808
Uni
ted
Stat
es28
4130
2331
16−
6828
017
3220
4315
0646
9311
3948
686
8766
Ven
ezue
la1
−12
50−
930
−13
873
1761
−17
863
2Tot
al11
3501
511
3501
510
9404
810
9404
818
6125
818
1491
421
7533
726
7070
5
Cor
r.C
oeffi
cien
t(1
):0.
95(2
):0.
91(3
):0.
88(4
):0.
78
Note
s:T
he
firs
tfo
ur
colu
mns
ofth
eta
ble
repor
tth
ere
sult
sof
the
esti
mat
ednet
asse
ttr
ansa
ctio
ns
over
the
cum
ula
ted
per
iod
1998
–200
1ag
greg
ated
for
the
thir
tyco
unt
ries
ofth
esa
mple
.T
he
last
four
colu
mns
repor
tth
eco
unt
ries
’eq
uity
and
deb
tflow
sov
erth
esa
me
per
iod
repor
ted
byth
eIF
Sdat
abas
eof
the
IMF.T
he
esti
mat
edan
dth
eIF
Sfigu
res
are
not
dir
ectl
yco
mpar
able
,as
offsh
ore
cent
ers,
seve
ralA
sian
and
Lat
inA
mer
ican
count
ries
,an
dth
eoffi
cial
flow
sof
mon
etar
yau
thor
itie
sar
enot
incl
uded
inth
eC
PIS
dat
abas
e.M
oreo
ver,
the
deb
tin
stru
men
tflow
sre
por
ted
byth
eIF
Sar
eth
esu
mof
bon
ds
and
mon
eym
arke
tin
stru
men
tflow
s.

Vol. 6 No. 2 The Geography of International Portfolio Flows 167
Tab
le5.
Est
imat
edan
dIF
SPor
tfol
ioFlo
ws
by
Reg
ions,
1998
–200
1(U
SD
Billion
s)
Est
imat
edfr
om
CP
IS(T
hir
tyC
ountr
ies)
IFS
(All
Countr
ies)
Equity
Bonds
Equity
Deb
tIn
stru
men
ts
Ass
etLia
bility
Ass
etLia
bility
Ass
etLia
bility
Ass
etLia
bility
Countr
ies
(1a)
(2a)
(3a)
(4a)
(1b)
(2b)
(3b)
(4b)
Ten
EM
U64
6.1
397.
691
4.0
975.
894
3.0
672.
014
41.5
1411
.7T
hree
Non
-EM
UE
U55
.933
1.0
91.3
62.9
204.
540
6.1
243.
318
4.8
Ten
Non
-EU
424.
540
2.6
89.9
156.
469
3.5
714.
548
0.4
1069
.1D
evel
oped
Seve
nE
mer
ging
8.6
3.9
−1.
1−
100.
111
.522
.410
.25.
2M
arke
tsTot
al11
35.0
1135
.010
94.0
1094
.018
61.3
1814
.918
05.1
2337
.6
Cor
r.C
oeffi
cien
t(1
):0.
99(2
):0.
96(3
):0.
97(4
):0.
84
Note
s:T
he
figu
res
repor
tth
epor
tfol
ioflow
sof
equity
and
fixe
d-inco
me
aggr
egat
edfo
rfo
ur
count
rygr
oupin
gs.T
he
ten
EM
Uco
unt
ries
are
Aust
ria,
Bel
gium
,Fin
land,
Fra
nce
,G
erm
any,
Irel
and,
Ital
y,N
ether
lands,
Por
tuga
l,an
dSpai
n.
The
thre
enon
-EM
UEU
count
ries
are
Den
-m
ark,
Sw
eden
,an
dth
eU
nit
edK
ingd
om.T
he
ten
non
-EU
dev
elop
edco
unt
ries
incl
ude
Aust
ralia,
Ber
muda,
Can
ada,
Icel
and,Is
rael
,Ja
pan
,N
ewZea
land,
Nor
way
,th
eU
nit
edSta
tes,
and
Sin
gapor
e.T
he
seve
nem
ergi
ng
mar
kets
are
Arg
enti
na,
Chile,
Indon
esia
,K
orea
,M
alay
sia,
Thai
land,
and
Ven
ezuel
a.T
he
firs
tfo
ur
colu
mns
ofth
eta
ble
repor
tth
ere
sult
sof
the
esti
mat
ednet
asse
ttr
ansa
ctio
ns
over
the
cum
ula
ted
per
iod
1998
–200
1ag
greg
ated
for
the
thir
tyco
unt
ries
ofth
esa
mple
.T
he
last
four
colu
mns
repor
tth
eco
unt
ries
’eq
uity
and
deb
tflow
sov
erth
esa
me
per
iod
repor
ted
byth
eIF
Sdat
abas
eof
the
IMF.T
he
esti
mat
edan
dth
eIF
Sfigu
res
are
not
dir
ectl
yco
mpar
able
,as
offsh
ore
cent
ers,
seve
ralA
sian
and
Lat
inA
mer
ican
count
ries
,an
dth
eoffi
cial
flow
sof
mon
etar
yau
thor
itie
sar
enot
incl
uded
inth
eC
PIS
dat
abas
e.M
oreo
ver,
the
deb
tin
stru
men
tflow
sre
por
ted
byth
eIF
Sar
eth
esu
mof
bon
dan
dm
oney
mar
ket
inst
rum
ent
flow
s.

168 International Journal of Central Banking June 2010
Figure 1. Changes in Non-Domestic Euro-AreaAssets by Region
Notes: Panel A reports the estimated portfolio net flows of EMU assets transactedby residents of region i over the period 1998–2001 aggregated for four country group-ings. Panel B reports the estimated flows relative to foreign assets held in region iover the average period 1998–2001. The ten EMU countries are Austria, Belgium,Finland, France, Germany, Ireland, Italy, Netherlands, Portugal, and Spain. Thethree non-EMU EU countries are Denmark, Sweden, and the United Kingdom.The ten non-EU developed countries include Australia, Bermuda, Canada, Iceland,Israel, Japan, New Zealand, Norway, Singapore, and the United States. The sevenemerging markets are Argentina, Chile, Indonesia, Korea, Malaysia, Thailand, andVenezuela.

Vol. 6 No. 2 The Geography of International Portfolio Flows 169
billion in bonds and notes (see figure 1A), which represent, respec-tively, 31 percent and 51 percent of the non-domestic equity andbond assets held on average by euro-area member states over theperiod 1998–2001 (see figure 1B).
Several transactions are not reported in the CPIS database. Thisimplies either a rational portfolio allocation decision of not investingor the desire of not reporting confidential transactions. Specifically,the zeros reported by countries with more than 75 percent of theirinternational portfolio allocated account for 6.7 percent and 16.6 per-cent in equity and bond portfolios, respectively. It is important tostress that the zero flows can still occur if there were no transactionsor if transactions just offset each other during the 1997–2001 period.Also, negative transactions can occur if countries disinvested in 2001relative to 1997. Such zero and negative flows are not truncated; theyremain part of the database. However, given the zero reporting forsome holding positions, we estimate the same model, excluding andincluding such transactions. As shown in various regressions, resultsare barely affected, partly suggesting that most of the zero holdingsare based on actual portfolio investment decisions.
4. The Empirical Approach: Testing the IntCAPM
In a fully integrated world where purchasing power parity (PPP)holds, Solnik (1974) and Sercu (1980) show that the internationalversion of the simple CAPM of Sharpe (1964) and Lintner (1965)holds. Moreover, the equilibrium is achieved when all investorshold the world market portfolio, where each country’s portfolio isweighted by its market capitalization. In this model, the optimalshare invested in each country k is equal to that country k’s marketcapitalization weight in the world index portfolio, wBench
k,97 .The IntCAPM predicts a coefficient on wBench
k,97 equal to unity.However, due to home bias, marginal and fixed transaction costs,asymmetric information, heterogeneous belief about market perfor-mance, and trend-chasing behavior, the prediction of the IntCAPMmight not hold. Therefore, first we regress bilateral portfolio flowsin equity and bond securities upon their respective benchmarks,wBench
k,97 . Next, we control for the degree of home bias, the non-lineardegree of misallocation at the beginning of the period, and assetperformance in the previous period. Specifically, we estimate thefollowing model:

170 International Journal of Central Banking June 2010
tck,t = α0 + α1wBenchk,97 + α2HBc,97 + α3ΔHBc,01
+ α4DW 3ck,97 + α5rk,t−1 + εt,
where tck,t denotes country c’s international transactions invested incountry k divided by country c’s average international holdings overthe 1998–2001 period; HBc,97 and ΔHBc,01 are country c’s degreeof home bias at the beginning of the period and its first differenceover the sample period; DWck,97 denotes the degree of underweightof country k assets in investor c’s portfolio at the beginning of theperiod; rk,t−1 is the total returns on country k’s market portfolioin the previous period; and εt is a well-behaved term for all otherdeterminants of portfolio asset flows.
Home bias on the part of an investor, HBc,t, is broadly definedas the tendency to invest more in domestic assets even though therisk is shared more effectively if foreign assets are held. We expectthat the higher the degree of home bias, the larger the benefits offurther cross-border investments and the stronger the incentives forinternational diversification. Hence, net portfolio flows should bepositively related to the degree of home bias at the beginning of theperiod (α2 > 0) and negatively related to its increase over the period(α3 < 0). An index that is generally used to measure home bias is 1minus the Foreign Asset Acceptance Ratio (FAAR).10 FAAR meas-ures the extent to which the share of foreign assets in an investor’sportfolio diverges from the share of foreign assets that would be heldin a “borderless” global portfolio. By this metric, home bias is higherthe lower FAAR is from unity. Specifically, FAAR is computed as theactual share of foreign assets in total country holdings, wf
c,t, dividedby the optimal share of foreign assets in the total country portfolio,1 − wBench
c,t . This implies that
HBc,t = 1 −wf
c,t
1 − wBenchc,t
.
Since this measure is investor specific, it also plays the role of countryc’s fixed effect.
10See, for example, International Monetary Fund (2005) and De Santis andGerard (2009).

Vol. 6 No. 2 The Geography of International Portfolio Flows 171
The degree of underweight, DWck, is defined as the differencebetween the optimal and actual share of country k assets in investorc’s portfolio. It is generally agreed that the higher the costs in a par-ticular foreign market, the more severely underweighted that countrywill be in the investor’s portfolio (Ahearne, Griever, and Warnock2004). Therefore, we use the initial degree of bilateral misallocationpartly to instrument the role played by direct and indirect costs andasymmetric information on bilateral cross-border asset transactions.The larger the initial difference between optimal and actual share,the stronger the incentive to learn about the country and to reducethe associated asset allocation costs in order to trade back to opti-mal weights, reducing the position when the actual weight exceedsthe optimal weight and increasing the investment in an asset whenit is underweighted. Since our data focus exclusively on the foreignholdings of each country, the optimal weight to be invested in coun-try k by country c is equal to country k’s market capitalization inthe world market index, excluding the investing country c. Then
DWck,97 = wBenchck,97 − wck,97,
where wBenchck,97 = wBench
k,97
1−wBenchc,97
and wck,97 = Invc,k,97∑k Invc,k,97
.Since rebalancing a portfolio entails both direct and indirect fixed
transaction costs, it is unlikely to take place when bilateral actualportfolio weights differ only slightly from bilateral optimal portfolioweights. Therefore, we introduce some non-linearities by taking thecube of this measure. We expect that the degree of underweight atthe beginning of the period affects non-linearly and positively thegeography of portfolio flows (α4 > 0).11
11Ahearne, Griever, and Warnock (2004) and Portes and Rey (2005) pointedout that direct and indirect costs, such as information costs, to trade assets ina particular foreign market are key reasons why that country is more severelyunderweighted in the investor’s portfolio. While these factors undoubtedly influ-ence firms’ decisions about where to invest, a comprehensive evaluation of thismotivation is well beyond the scope of this paper, because we do not have meas-ures of bilateral cross-border fixed costs on equity and bond allocation, whichoften take the form of legal barriers and restrictive regulations. However, oncecontrolling for home bias, the initial non-linear degree of bilateral misalloca-tion could proxy at least partly the initial fixed costs on cross-border portfolioallocation.

172 International Journal of Central Banking June 2010
If portfolio decisions are based partly on past returns, theninvestors might tend to underweight countries whose stock marketshave performed poorly. Bohn and Tesar (1996) found that inter-national portfolio flows co-move with lagged measures of expectedreturns. This suggests that international investors engage in positive-feedback trading, also called “trend chasing.” To capture this type of“returns-chasing” behavior a la Bohn and Tesar, we use past returnsand expect α5 to be positive.
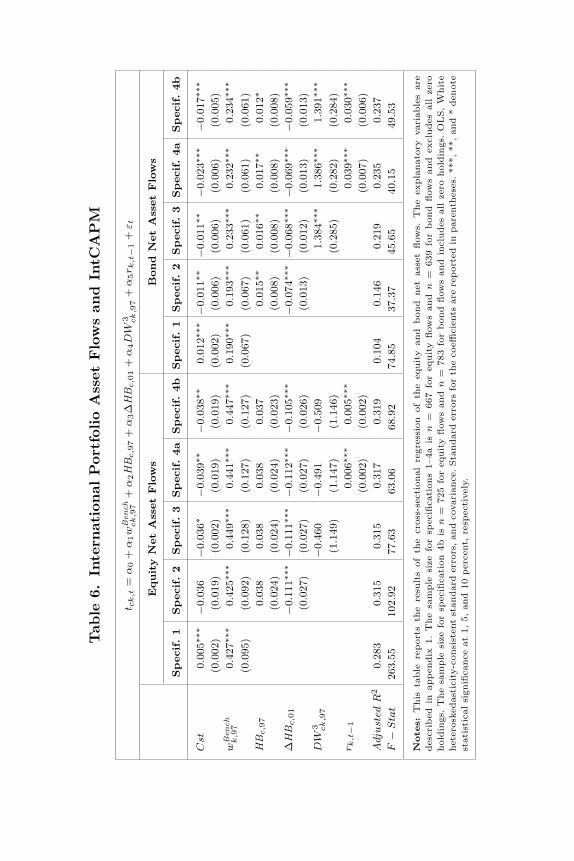
The results reported in table 6 indicate that wBenchk,97 is statisti-
cally significant, but its coefficient is less than unity: it is equal to0.4 for equities and 0.2 for bonds (see specification 1). A countrythat sees its market size increase by 1 percentage point relative tothe world market capitalization would attract international equity(bond) flows amounting to 0.4 percent (0.2 percent) of the equity(bond) assets held abroad by foreigners. The finding that the coeffi-cient on the bond benchmark is half that on the equity benchmarkmight imply that global equity markets are more integrated thanglobal bond markets.
The results do not change when we control for home bias (seespecification 2). On average, the decline in home bias in country cincreases international investment toward all destination countriesk in both models.
The results also do not change when we control for the non-lineardegree of underweight and past performance. Interestingly, the coef-ficient on DWck,97 is not statistically significant when taking thelinear measure (not reported). Conversely, it is strongly statisticallysignificant for the bond flow model when taking the non-linear meas-ure. One potential interpretation is the initial fixed-cost argumentdiscussed above. The willingness to close the initial gap betweenthe share of foreign assets that would be held in a “borderless”global portfolio and actual foreign investment weights is an impor-tant determinant of bond flows, as it raises the adjusted R2 by 7 per-centage points, from 14.6 percent in specification 2 to 21.9 percentin specification 3.
Finally, past performance in the destination country is statisti-cally significant for the equity and bond flow models (see specifi-cation 4a). While no prudent investor assumes future returns willmirror past returns, trend-chasing behaviors still characterize thegeography of international equity and bond flows in the long term.
Tab
le6.
Inte
rnat
ional
Por
tfol
ioA
sset
Flo
ws
and
IntC
AP
M
t ck
,t=
α0
+α
1w
Ben
chck
,97
+α
2H
Bc,9
7+
α3Δ
HB
c,0
1+
α4D
W3 ck
,97
+α
5r k
,t−
1+
ε t
Equity
Net
Ass
etFlo
ws
Bond
Net
Ass
etFlo
ws
Spec
if.1
Spec
if.2
Spec
if.3
Spec
if.4a
Spec
if.4b
Spec
if.1
Spec
if.2
Spec
if.3
Spec
if.4a
Spec
if.4b
Cst
0.00
5∗∗∗
−0.
036
−0.
036∗
−0.
039∗
∗−
0.03
8∗∗
0.01
2∗∗∗
−0.
011∗
∗−
0.01
1∗∗
−0.
023∗
∗∗−
0.01
7∗∗∗
(0.0
02)
(0.0
19)
(0.0
02)
(0.0
19)
(0.0
19)
(0.0
02)
(0.0
06)
(0.0
06)
(0.0
06)
(0.0
05)
wBen
chk
,97
0.42
7∗∗∗
0.42
5∗∗∗
0.44
9∗∗∗
0.44
1∗∗∗
0.44
7∗∗∗
0.19
0∗∗∗
0.19
3∗∗∗
0.23
3∗∗∗
0.23
2∗∗∗
0.23
4∗∗∗
(0.0
95)
(0.0
92)
(0.1
28)
(0.1
27)
(0.1
27)
(0.0
67)
(0.0
67)
(0.0
61)
(0.0
61)
(0.0
61)
HB
c,9
70.
038
0.03
80.
038
0.03
70.
015∗
∗0.
016∗
∗0.
017∗
∗0.
012∗
(0.0
24)
(0.0
24)
(0.0
24)
(0.0
23)
(0.0
08)
(0.0
08)
(0.0
08)
(0.0
08)
ΔH
Bc,0
1−
0.11
1∗∗∗
−0.
111∗
∗∗−
0.11
2∗∗∗
−0.
105∗
∗∗−
0.07
4∗∗∗
−0.
068∗
∗∗−
0.06
9∗∗∗
−0.
059∗
∗∗
(0.0
27)
(0.0
27)
(0.0
27)
(0.0
26)
(0.0
13)
(0.0
12)
(0.0
13)
(0.0
13)
DW
3 ck
,97
−0.
460
−0.
491
−0.
509
1.38
4∗∗∗
1.38
6∗∗∗
1.39
1∗∗∗
(1.1
49)
(1.1
47)
(1.1
46)
(0.2
85)
(0.2
82)
(0.2
84)
r k,t
−1
0.00
6∗∗∗
0.00
5∗∗∗
0.03
9∗∗∗
0.03
0∗∗∗
(0.0
02)
(0.0
02)
(0.0
07)
(0.0
06)
Adj
ust
edR
20.
283
0.31
50.
315
0.31
70.
319
0.10
40.
146
0.21
90.
235
0.23
7F
−S
tat
263.
5510
2.92
77.6
363
.06
68.9
274
.85
37.3
745
.65
40.1
549
.53
Note
s:T
his
table
repor
tsth
ere
sult
sof
the
cros
s-se
ctio
nal
regr
essi
onof
the
equity
and
bon
dnet
asse
tflow
s.T
he
expla
nat
ory
vari
able
sar
edes
crib
edin
appen
dix
1.T
he
sam
ple
size
for
spec
ifica
tion
s1–
4ais
n=
667
for
equity
flow
san
dn
=63
9fo
rbon
dflow
san
dex
cludes
all
zero
hol
din
gs.T
he
sam
ple
size
for
spec
ifica
tion
4bis
n=
725
for
equity
flow
san
dn
=78
3fo
rbon
dflow
san
din
cludes
allze
rohol
din
gs.O
LS,W
hit
ehet
eros
kedas
tici
ty-c
onsi
sten
tst
andar
der
rors
,an
dco
vari
ance
.Sta
ndar
der
rors
for
the
coeffi
cien
tsar
ere
por
ted
inpar
enth
eses
.**
*,**
,an
d*
den
ote
stat
isti
calsi
gnifi
cance
at1,
5,an
d10
per
cent
,re
spec
tive
ly.

174 International Journal of Central Banking June 2010
All in all, the proportion of the total variation explained by themodel is quite significant: 31.7 percent in equity flows and 23.5percent in bond flows.
The results are barely affected when treating the zero report-ing for some holding positions in the sample as actual portfolioinvestment decisions (see specification 4b).
5. Portfolio Flows, Monetary Policy Frameworks,and EMU
The second aim of the paper is to assess whether central banks’monetary policy frameworks across countries influenced the geog-raphy and size of international capital flows during the boom andbust of asset prices at the turn of the century. In this context wealso investigate the role of EMU on global portfolio reallocation.
5.1 The Impact of Monetary Policy Frameworks
We use the IntCAPM as our benchmark and add explanatory vari-ables describing key characteristics of monetary policy frameworksacross countries. Therefore, we estimate the following model:
tck,t = α0 + α1wBenchk,97 + α2HBc,97 + α3ΔHBc,01 + α4DW 3
ck,97
+ α5rk,t−1 + λ′Monk,t−1 + εt,
where the vector Monk,t−1 includes variables measuring the follow-ing characteristics of the monetary policy framework in country k:(i) the central bank’s objectives, such as the focus on inflation, onmoney, on the exchange rate, and on discretionary policy, (ii) thecentral bank’s institutional factors, such as independence, account-ability, and transparency, and (iii) the importance of financial stabil-ity in the setting of monetary policy instruments. Results reportedin table 7 are based on the sample that excludes the zero entrypositions. The results are the same when zero holding positions areincluded in the analysis (not reported; see also table 8).
Among the characteristics related to monetary policy, the focuson money played a significant and positive role in influencing thegeography of the portfolio flows. Given the link between asset pricesand credit growth (Borio and Lowe 2004; Detken and Smets 2004),

Vol. 6 No. 2 The Geography of International Portfolio Flows 175Tab
le7.
Inte
rnat
ional
Por
tfol
ioFlo
ws
and
Char
acte
rist
ics
ofM
onet
ary
Pol
icy
Fra
mew
orks
t ck,t
=α
0+
α1w
Ben
chk,9
7+
α2H
Bc,9
7+
α3Δ
HB
c,0
1+
α4D
W3 ck,9
7+
α5r k
,t−
1+
λ′ M
onk,t
−1
+ε t
Spec
if.
Expla
nat
ory
Equity
Flo
ws
Bon
dFlo
ws
Num
ber
Var
iable
Coeff
.s.
e.R
2C
oeff
.s.
e.R
2
Pol
icy
Focu
s
5In
flation
k,9
80.
004
(0.0
06)
0.31
7−
0.01
1∗∗
(0.0
04)
0.23
76
Mon
eyk,9
80.
021∗
∗∗(0
.007
)0.
322
0.06
2∗∗∗
(0.0
12)
0.28
67
Exc
hang
era
tek,9
8−
0.00
6(0
.006
)0.
309
0.00
5(0
.005
)0.
234
8D
iscr
etio
n k,9
80.
003
(0.0
07)
0.31
70.
010
(0.0
08)
0.23
6
Inst
itut
iona
lFa
ctor
s
9In
depe
nden
cek,9
80.
003
(0.0
14)
0.31
70.
046∗
∗∗(0
.016
)0.
240
10Acc
ount
abili
tyk,9
80.
006
(0.0
08)
0.31
7−
0.02
5∗∗∗
(0.0
09)
0.24
511
Tra
nspa
renc
y k,9
80.
006
(0.0
08)
0.31
7−
0.00
7(0
.006
)0.
234
Stru
ctur
alFa
ctor
sk
12Fin
anci
alSt
abili
tyk,9
80.
014
(0.0
09)
0.31
8−
0.00
6(0
.008
)0.
233
Pol
icy
Focu
sw
ith
Ger
man
yB
eing
the
Ben
chm
ark
for
Oth
erE
uro-
Are
aC
ount
ries
5aIn
flation
k,9
80.
003
(0.0
07)
0.31
7−
0.01
4∗∗∗
(0.0
04)
0.23
96a
Mon
eyk,9
80.
009∗
∗(0
.004
)0.
319
0.03
0∗∗∗
(0.0
04)
0.27
57a
Exc
hang
era
tek,9
8−
0.01
1∗∗∗
(0.0
04)
0.31
9−
0.01
8∗∗∗
(0.0
04)
0.24
08a
Dis
cret
ion k
,98
−0.
004
(0.0
14)
0.31
3−
0.01
6∗∗
(0.0
07)
0.23
6(c
ontinu
ed)

176 International Journal of Central Banking June 2010
Tab
le7.
(Con
tinued
)
Spec
if.
Expla
nat
ory
Equity
Flo
ws
Bon
dFlo
ws
Num
ber
Var
iable
Coeff
.s.
e.R
2C
oeff
.s.
e.R
2
Inst
itut
iona
lFa
ctor
sw
ith
Ger
man
yB
eing
the
Ben
chm
ark
for
Oth
erE
uro-
Are
aC
ount
ries
9aIn
depe
nden
cek,9
80.
003
(0.0
12)
0.31
70.
063∗
∗∗(0
.014
)0.
247
10a
Acc
ount
abili
tyk,9
8−
0.00
0(0
.006
)0.
317
−0.
029∗
∗∗(0
.005
)0.
261
11a
Tra
nspa
renc
y k,9
80.
012
(0.0
09)
0.31
8−
0.00
6(0
.007
)0.
234
Stru
ctur
alFa
ctor
sw
ith
Ger
man
yB
eing
the
Ben
chm
ark
for
Oth
erE
uro-
Are
aC
ount
ries
12a
Fin
anci
alSt
abili
tyk,9
80.
010
(0.0
09)
0.31
7−
0.00
6(0
.007
)0.
234
Note
s:T
his
table
repor
tsth
ere
sult
sof
the
cros
s-se
ctio
nal
regr
essi
onof
por
tfol
ionet
asse
tflow
s.Eac
hex
pla
nat
ory
vari
able
ofth
ista
ble
isad
ded
asan
addit
ional
regr
esso
rto
the
IntC
APM
repor
ted
insp
ecifi
cati
on4
ofta
ble
6.A
sfo
rth
ech
arac
teri
stic
sof
the
mon
etar
ypol
icy
fram
ewor
k,th
ein
dic
esra
nge
bet
wee
n0
and
1,an
da
hig
her
scor
eis
asso
ciat
edw
ith
the
hig
her
deg
ree
ofim
por
tance
give
nto
pol
icy
obje
ctiv
es,
toin
stit
uti
onal
char
acte
rist
ics,
and
tofinan
cial
stab
ility
issu
es.
The
expla
nat
ory
vari
able
sar
edes
crib
edin
appen
dix
1.T
he
sam
ple
size
isn
=66
7fo
req
uity
flow
san
dn
=63
9fo
rbon
dflow
san
dex
cludes
allze
rohol
din
gs.O
LS,W
hit
ehet
eros
kedas
tici
ty-c
onsi
sten
tst
andar
der
rors
,an
dco
vari
ance
.Sta
ndar
der
rors
for
the
coeffi
cien
tsar
ere
por
ted
inpar
enth
eses
.**
*,**
,an
d*
den
ote
stat
isti
calsi
gnifi
cance
at1,
5,an
d10
per
cent
,re
spec
tive
ly.
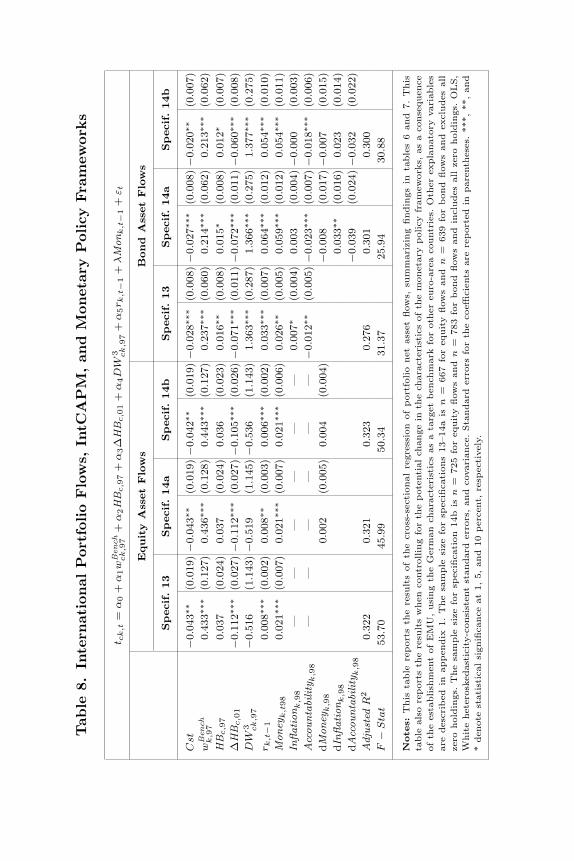
Tab
le8.
Inte
rnat
ional
Por
tfol
ioFlo
ws,
IntC
AP
M,an
dM
onet
ary
Pol
icy
Fra
mew
orks
t ck
,t=
α0
+α
1w
Ben
chck
,97
+α
2H
Bc,9
7+
α3Δ
HB
c,0
1+
α4D
W3 ck
,97
+α
5r k
,t−
1+
λM
onk
,t−
1+
ε t
Equity
Ass
etFlo
ws
Bond
Ass
etFlo
ws
Spec
if.13
Spec
if.14a
Spec
if.14b
Spec
if.13
Spec
if.14a
Spec
if.14b
Cst
−0.
043∗
∗(0
.019
)−
0.04
3∗∗
(0.0
19)
−0.
042∗
∗(0
.019
)−
0.02
8∗∗∗
(0.0
08)
−0.
027∗
∗∗(0
.008
)−
0.02
0∗∗
(0.0
07)
wBen
chk
,97
0.43
3∗∗∗
(0.1
27)
0.43
6∗∗∗
(0.1
28)
0.44
3∗∗∗
(0.1
27)
0.23
7∗∗∗
(0.0
60)
0.21
4∗∗∗
(0.0
62)
0.21
3∗∗∗
(0.0
62)
HB
c,9
70.
037
(0.0
24)
0.03
7(0
.024
)0.
036
(0.0
23)
0.01
6∗∗
(0.0
08)
0.01
5∗(0
.008
)0.
012∗
(0.0
07)
ΔH
Bc,0
1−
0.11
2∗∗∗
(0.0
27)
−0.
112∗
∗∗(0
.027
)−
0.10
5∗∗∗
(0.0
26)
−0.
071∗
∗∗(0
.011
)−
0.07
2∗∗∗
(0.0
11)
−0.
060∗
∗∗(0
.008
)D
W3 ck
,97
−0.
516
(1.1
43)
−0.
519
(1.1
45)
−0.
536
(1.1
43)
1.36
3∗∗∗
(0.2
87)
1.36
6∗∗∗
(0.2
75)
1.37
7∗∗∗
(0.2
75)
r k,t
−1
0.00
8∗∗∗
(0.0
02)
0.00
8∗∗
(0.0
03)
0.00
6∗∗∗
(0.0
02)
0.03
3∗∗∗
(0.0
07)
0.06
4∗∗∗
(0.0
12)
0.05
4∗∗∗
(0.0
10)
Mon
eyk
,t98
0.02
1∗∗∗
(0.0
07)
0.02
1∗∗∗
(0.0
07)
0.02
1∗∗∗
(0.0
06)
0.02
6∗∗
(0.0
05)
0.05
9∗∗∗
(0.0
12)
0.05
4∗∗∗
(0.0
11)
Inflat
ion k
,98
——
——
——
0.00
7∗(0
.004
)0.
003
(0.0
04)
−0.
000
(0.0
03)
Acc
ount
abili
tyk
,98
——
——
——
−0.
012∗
∗(0
.005
)−
0.02
3∗∗∗
(0.0
07)
−0.
018∗
∗∗(0
.006
)dM
oney
k,9
80.
002
(0.0
05)
0.00
4(0
.004
)−
0.00
8(0
.017
)−
0.00
7(0
.015
)dI
nflat
ion k
,98
0.03
3∗∗
(0.0
16)
0.02
3(0
.014
)dA
ccou
ntab
ility
k,9
8−
0.03
9(0
.024
)−
0.03
2(0
.022
)Adj
uste
dR
20.
322
0.32
10.
323
0.27
60.
301
0.30
0F
−S
tat
53.7
045
.99
50.3
431
.37
25.9
430
.88
Note
s:T
his
table
repor
tsth
ere
sult
sof
the
cros
s-se
ctio
nal
regr
essi
onof
por
tfol
ionet
asse
tflow
s,su
mm
ariz
ing
findin
gsin
table
s6
and
7.T
his
table
also
repor
tsth
ere
sult
sw
hen
cont
rollin
gfo
rth
epot
enti
alch
ange
inth
ech
arac
teri
stic
sof
the
mon
etar
ypol
icy
fram
ewor
ks,as
aco
nse
quen
ceof
the
esta
blish
men
tof
EM
U,usi
ng
the
Ger
man
char
acte
rist
ics
asa
targ
etben
chm
ark
for
other
euro
-are
aco
unt
ries
.O
ther
expla
nat
ory
vari
able
sar
edes
crib
edin
appen
dix
1.T
he
sam
ple
size
for
spec
ifica
tion
s13
–14a
isn
=66
7fo
req
uity
flow
san
dn
=63
9fo
rbon
dflow
san
dex
cludes
all
zero
hol
din
gs.T
he
sam
ple
size
for
spec
ifica
tion
14b
isn
=72
5fo
req
uity
flow
san
dn
=78
3fo
rbon
dflow
san
din
cludes
allze
rohol
din
gs.O
LS,
Whit
ehet
eros
kedas
tici
ty-c
onsi
sten
tst
andar
der
rors
,an
dco
vari
ance
.Sta
ndar
der
rors
for
the
coeffi
cien
tsar
ere
por
ted
inpar
enth
eses
.**
*,**
,an
d*
den
ote
stat
isti
calsi
gnifi
cance
at1,
5,an
d10
per
cent
,re
spec
tive
ly.

178 International Journal of Central Banking June 2010
global portfolio investors might have purchased assets of countrieswhere monetary analysis played a more prominent role.
If the focus on monetary aggregates, credit growth, and financialflows helps central banks identify inflated asset prices and financialimbalances, then portfolio investors would indeed give importance tothis characteristic. The empirical results on both equity and bondflows support this hypothesis. In particular, the R
2of the model
explaining the geography of bond flows increases from 23.5 percentin the benchmark model (see specification 4a of table 6) to 28.6percent when adding the focus on money by the recipient country’scentral bank (see specification 6 of table 7).
Among the characteristics related to the institutional factors,independence (specifications 9 and 9a of table 7) is found to be sig-nificant and with the expected sign only for bond flows, while beingaccountable is a push factor of bond flows (specifications 10 and10a). As already pointed out, independence and accountability arenegatively correlated, which implies that explaining and defendingmonetary policies to government and parliament and the involve-ment of parliament in monetary policy decisions might be seen byinternational investors as an infringement on central banks’ inde-pendence, putting at risk the price stability mandate, which is nowa typical mandate by monetary authorities across the globe.
Qualitatively similar results are obtained if we assume that thecharacteristics of the monetary policy frameworks of the euro-areamember states converged with those of Germany with the estab-lishment of EMU (see specifications 5a–12a of table 7). Under thishypothesis, the focus on the exchange rate becomes strongly neg-atively significant in both equity and bond flow specifications (seespecification 7a). This might imply that global asset allocators overthe period 1998–2001 reduced their investment vis-a-vis countrieswhose monetary authorities gave relative importance to exchangerate targets.
When pooling the indices, which are statistically significant inthe same model, independence is no longer significant in the bondflow specification, while the focus on inflation has the positivesign (see specification 13 of table 8). Given the establishment ofEMU in January 1999, we also control for the potential change inthe characteristics of the monetary policy frameworks of the euro-area member states using the German monetary framework as the

Vol. 6 No. 2 The Geography of International Portfolio Flows 179
benchmark. Results, which are reported in specifications 14a and14b of table 8, indicate that the focus on money and accountabil-ity continue to be robust. These will be the only variables that areconsistently significant when we study and control for the effect ofEMU.12
The fact that the focus on inflation or independence has not sys-tematically influenced international capital flows may be simply dueto the fact that the core objective of most of the central banks ofthe countries in the sample is to enforce price stability, with inde-pendence being key to control inflationary expectations. Most likely,foreign investors care about inflation only at relatively high levels.
5.2 The Impact of EMU
To control for the effect of EMU on global capital flows as wellas to measure its average impact, we include two sets of binaryvariables. However, the binary variables per se are not sufficientto study the catalyst effect of EMU, because portfolio capital couldhave been reallocated globally to better exploit the expected diversi-fication benefits and the elimination of the exchange rate risk amongeuro-area member states.
In 1998, the Maastricht process was well under way and investorswere keenly aware of the high likelihood that the intra-EMU cur-rency risk would disappear. Therefore, the expected volatility of theexchange rate is assumed to be zero among euro-area countries andequal to past volatility for the other cross-border transactions. Morespecifically, the expected volatility of the exchange rate among euro-area member states and other countries of the world is assumed toequal the past volatility of the rest of the world’s currencies vis-a-visthe deutsche mark.
As a measure of the expected diversification benefit, De San-tis and Gerard (2009) suggest to employ the marginal impact onportfolio risk of increasing or decreasing the investor’s position in aparticular asset. Recall that the foreign investment portfolio variancecan be computed as
σ2Pct = w′
c,tΣc,twc,t.
12We have also controlled for the average inflation rate over the ten-year period1992–2001, and the results do not vary.

180 International Journal of Central Banking June 2010
wc,t is the vector of weights for the N foreign assets and Σc thecovariance matrix of returns of the foreign assets, where the sub-script c indicates that the covariance and weight are computed fromthe investing country c’s perspective. Then, the decrease in portfoliovariance for a marginal increase in the weight invested in asset k canbe interpreted as a measure of the diversification benefit, DBc,t:
DBc,t = − ∂
∂wc,tσ2
Pct = − ∂
∂wc,t
[w′
c,tΣc,twc,t
]= −2Σc,twc,t.
That is,
DBck,t = − ∂
∂wck,t
[w′
c,tΣc,twc,t
]= −2
K∑l=1
wcl,tσlk,t,
where DBck,t measures the diversification benefit of adding asset k toinvestor c’s position. Therefore, we should expect it to be positivelyrelated to portfolio asset flows.
For an international investor, however, the return on any foreignasset varies not only because of asset-specific risk but also becauseof unpredictable fluctuations in exchange rates. Since the currency-risk exposure of asset portfolios can be hedged through derivativestransactions, it may be of interest to distinguish between the pureasset component and the currency-risk component of the diversifica-tion benefit motive of portfolio reallocation. Therefore, we considerthree measures of diversification benefits: (i) an aggregate measureof diversification benefits based on the investor’s foreign investmentsreturns denominated in his domestic currency, DBAgg
ck = DB(rck); (ii)
a measure of diversification benefits based on the investor’s foreigninvestments fully hedged returns, DBFH
ck = DB(rkk); and (iii) a meas-
ure of diversification benefits based on the currency component ofthe investor’s foreign investments, DBCurr
ck = DB(xck).
The first two measures of the diversification benefit are easy tocompute based on investor’s currency denominated asset returns andlocal currency denominated returns, respectively. Since rc
k = rkk +xc
k,where rc
k is the continuously compounded (or log) return on countryk’s portfolio denominated in currency c, and xc
k is the change in theexchange rate between currency k and currency c, the third measure,the currency component of the investor’s diversification benefits, isthen computed by taking the difference between the first two:

Vol. 6 No. 2 The Geography of International Portfolio Flows 181
DBCurrck = DBAgg
ck − DBFHck .
In our context currency risk is important also because the intro-duction of the euro eliminated a substantial component of currencyrisk for many international investments in our sample. Therefore,we would also like to disentangle the currency-risk effects of theadoption of the euro from the aggregate currency-risk effects of achange in portfolio allocation. We use the same methodology amplyexplained in De Santis and Gerard (2009) to construct the measureof diversification benefits based on currency components.
Since rebalancing a portfolio entails transaction costs, it isunlikely to take place when estimated marginal diversification ben-efits are of small magnitude. Therefore, to introduce some non-linearities, we take the cube of the estimated values of the diver-sification benefits.
The results point out that the coefficient on the expected volatil-ity of the exchange rate is not statistically significant for equity flowsand is only significant at 10 percent for bond flows, with the cor-rect sign in both cases (see specification 15 of tables 9 and 10). Asfor the diversification benefit, the aggregate marginal diversificationbenefit is not statistically significant (not reported), while the fullyhedged marginal diversification benefit is positive and statisticallysignificant, particularly for bond flows. The results contrast withthe findings of Portes and Rey (2005), who found weak supportfor the diversification motive, possibly because they use bilateralcovariances of returns in a common currency as a measure of riskdiversification. The impact of the volatility of the exchange rate andof the marginal diversification benefits arising from the currencycomponent are generally small. These findings imply that investorsmight have preferred to hedge against exchange rate risks over theperiod 1998–2001.
The econometric results summarized in tables 9 and 10 also sug-gest that, on top of the mere elimination of the exchange rate risk,EMU played a key role in the allocation of portfolio capital amongcountries worldwide as well as among euro-area member states,thereby enhancing regional financial integration and risk sharing.The catalyst effect of EMU—which is on top of the mere eliminationof the exchange rate risk and due to the reduction of legal barriers,such as the removal of intra-area currency-matching rules, and the

182 International Journal of Central Banking June 2010Tab
le9.
Inte
rnat
ional
Equity
Flo
ws,
IntC
AP
M,M
onet
ary
Pol
icy
Fra
mew
orks,
and
EM
U
t ck
,t=
α0
+α
1w
Ben
chck
,97
+α
2H
Bc,9
7+
α3Δ
HB
c,0
1+
α4D
W3 ck
,97
+α
5r k
,t−
1+
λM
onk
,t−
1
+γFX
vole c
k,t
−1
+β
1D
k⊂
EM
U+
β2D
k⊂
EM
U·D
c⊂
EM
U+
β3D
k⊂
UK
+β
4D
k⊂
EM
U·D
c⊂
UK
+β
5(D
k⊂
EU
−D
k⊂
EM
U)+
β6(D
k⊂
EU·D
c⊂
EU
−D
k⊂
EM
U·D
c⊂
EM
U)+
ϕD
B3 ck
,t−
1+
ε t
Spec
if.15
Spec
if.16
Spec
if.17
aSpec
if.17
b
Cst
−0.
046∗∗
(0.0
19)
−0.
046∗∗
(0.0
20)
−0.
046∗∗
(0.0
19)
−0.
046∗∗
(0.0
20)
wBen
chk
,97
0.42
2∗∗∗
(0.1
16)
0.45
6∗∗∗
(0.1
11)
0.42
8∗∗∗
(0.1
16)
0.42
5∗∗∗
(0.1
32)
HB
c,9
70.
045∗
(0.0
24)
0.04
5∗(0
.024
)0.
045∗
(0.0
24)
0.04
5∗(0
.023
)Δ
HB
c,0
1−
0.07
9∗∗∗
(0.0
24)
−0.
077∗∗
∗(0
.025
)−
0.07
6∗∗∗
(0.0
25)
−0.
072∗∗
∗(0
.025
)D
W3 ck
,97
−0.
348
(1.0
96)
−0.
491
(1.0
87)
−0.
343
(1.0
98)
−0.
311
(1.1
59)
r k,t
−1
0.00
5∗(0
.003
)0.
001
(0.0
03)
0.00
3(0
.003
)0.
003
(0.0
02)
Mon
eyk
,t−
10.
022∗∗
∗(0
.006
)0.
018∗∗
∗(0
.006
)0.
021∗∗
∗(0
.006
)0.
019∗∗
∗(0
.005
)FX
vole c
k,t
−1
−0.
068
(0.2
47)
−0.
087
(0.2
48)
−0.
064
(0.2
47)
−0.
011
(0.0
76)
Dc,E
MU
−0.
007
(0.0
05)
−0.
006
(0.0
06)
−0.
006
(0.0
05)
−0.
006
(0.0
04)
DEM
U,E
MU
0.03
3∗∗∗
(0.0
06)
0.03
8∗∗∗
(0.0
07)
0.03
6∗∗∗
(0.0
07)
0.03
5∗∗∗
(0.0
05)
Dc,U
K0.
013
(0.0
32)
——
0.00
9(0
.032
)0.
009
(0.0
34)
DEM
U,U
K0.
083∗∗
(0.0
40)
——
0.07
6∗(0
.039
)0.
077∗
(0.0
40)
Dc,E
U−
Dc,E
MU
——
0.01
4(0
.011
)0.
004
(0.0
06)
0.00
5(0
.006
)D
EU
,EU
−D
EM
U,E
MU
——
0.01
8∗∗(0
.009
)0.
010
(0.0
07)
0.01
0(0
.007
)D
BFX
3
ck
,t−
117
.14∗∗
(8.5
55)
20.1
7∗∗(8
.278
)17
.64∗∗
(8.4
99)
16.8
1∗(9
.011
)D
BEM
U3
ck
,t−
10.
971∗
(0.5
09)
0.58
8(0
.542
)0.
795
(0.5
19)
0.81
7(0
.503
)D
BX
−EM
U3
ck
,t−
10.
063
(0.0
49)
0.06
4(0
.049
)0.
062
(0.0
49)
0.04
5(0
.036
)Adj
uste
dR
20.
366
0.35
20.
366
0.36
8F
−St
at28
.48
26.8
525
.04
27.3
7
Note
s:T
his
table
repor
tsth
ere
sult
sof
the
cros
s-se
ctio
nal
regr
essi
onof
por
tfol
ioeq
uity
net
asse
tflow
s,su
mm
ariz
ing
findin
gsin
table
s6–
8.T
his
table
also
repor
tsth
ere
sult
sw
hen
cont
rollin
gfo
rth
epot
enti
aleff
ect
ofEM
Uan
dof
mar
ginal
div
ersi
fica
tion
ben
efits
.Exp
lanat
ory
vari
able
sar
edes
crib
edin
appen
dix
1.T
he
sam
ple
size
for
spec
ifica
tion
s15
–17a
,w
hic
hex
cludes
all
zero
hol
din
gs,
isn
=66
7.T
he
sam
ple
size
for
spec
ifica
tion
17b,w
hic
hin
cludes
allze
rohol
din
gs,is
n=
725.
OLS,W
hit
ehet
eros
kedas
tici
ty-c
onsi
sten
tst
andar
der
rors
,an
dco
vari
-an
ce.
Sta
ndar
der
rors
for
the
coeffi
cien
tsar
ere
por
ted
inpar
enth
eses
.**
*,**
,an
d*
den
ote
stat
isti
cal
sign
ifica
nce
at1,
5,an
d10
per
cent
,re
spec
tive
ly.

Vol. 6 No. 2 The Geography of International Portfolio Flows 183Tab
le10
.In
tern
atio
nal
Bon
dFlo
ws,
IntC
AP
M,M
onet
ary
Pol
icy
Fra
mew
orks,
and
EM
U
t ck
,t=
α0
+α
1w
Ben
chck
,97
+α
2H
Bc,9
7+
α3Δ
HB
c,0
1+
α4D
W3 ck
,97
+α
5r k
,t−
1+
λM
onk
,t−
1+
β1D
k⊂
EM
U+
γF
Xvo
le ck
,t−
1
+β
1D
k⊂
EM
U+
β2D
k⊂
EM
U·D
c⊂
EM
U+
β3D
k⊂
UK
+β
4D
k⊂
EM
U·D
c⊂
UK
+β
5(D
k⊂
EU
−D
k⊂
EM
U)
+β
6(D
k⊂
EU
·Dc⊂
EU
−D
k⊂
EM
U·D
c⊂
EM
U)+
ϕD
B3 ck
,t−
1+
ε t
Spec
if.15
Spec
if.16
Spec
if.17
aSpec
if.17
b
Cst
−0.
019∗∗
(0.0
07)
−0.
020∗∗
∗(0
.007
)−
0.01
9∗∗(0
.007
)−
0.01
6∗∗(0
.006
)w
Ben
chk
,97
0.21
2∗∗∗
(0.0
58)
0.21
5∗∗∗
(0.0
58)
0.21
3∗∗∗
(0.0
58)
0.21
8∗∗∗
(0.0
60)
HB
c,9
70.
012
(0.0
07)
0.01
2(0
.007
)0.
012
(0.0
07)
0.01
2∗(0
.007
)Δ
HB
c,0
1−
0.05
0∗∗∗
(0.0
10)
−0.
050∗∗
∗(0
.010
)−
0.05
1∗∗∗
(0.0
10)
−0.
036∗∗
∗(0
.008
)D
W3 ck
,97
1.35
4∗∗∗
(0.2
58)
1.36
0∗∗∗
(0.2
56)
1.35
4∗∗∗
(0.2
59)
1.38
3∗∗∗
(0.2
62)
r k,t
−1
0.04
2∗∗∗
(0.0
11)
0.04
0∗∗∗
(0.0
12)
0.04
1∗∗∗
(0.0
12)
0.03
4∗∗∗
(0.0
10)
Mon
eyk
,t−
10.
047∗∗
∗(0
.011
)0.
046∗∗
∗(0
.011
)0.
045∗∗
∗(0
.011
)0.
042∗∗
∗(0
.010
)Acc
ount
abili
tyk
,98
−0.
017∗∗
(0.0
07)
−0.
014∗∗
(0.0
07)
−0.
016∗∗
(0.0
07)
−0.
014∗∗
(0.0
06)
FX
vole c
k,t
−1
−0.
158∗
(0.0
92)
−0.
166∗
(0.0
92)
−0.
155∗
(0.0
93)
−0.
115∗
(0.0
64)
Dc,E
MU
0.00
9∗(0
.004
)0.
010∗∗
(0.0
05)
0.00
9∗∗(0
.005
)0.
006
(0.0
04)
DEM
U,E
MU
0.03
7∗∗∗
(0.0
08)
0.03
8∗∗∗
(0.0
08)
0.03
6∗∗∗
(0.0
08)
0.04
2∗∗∗
(0.0
08)
Dc,U
K0.
039∗∗
∗(0
.013
)—
—0.
037∗∗
∗(0
.013
)0.
038∗∗
∗(0
.012
)D
EM
U,U
K−
0.01
7(0
.019
)—
—−
0.01
6(0
.019
)−
0.01
7(0
.018
)D
c,E
U−
Dc,E
MU
——
0.01
5∗∗(0
.006
)0.
003
(0.0
06)
0.00
2(0
.005
)D
EU
,EU
−D
EM
U,E
MU
——
−0.
003
(0.0
06)
−0.
001
(0.0
05)
0.00
2(0
.005
)D
BF
X3
ck
,t−
137
283∗∗
∗(4
880)
3613
5∗∗∗
(492
5)37
244∗∗
∗(4
836.
8)38
729∗∗
∗(4
872.
7)D
BE
MU
3
ck
,t−
1−
12.3
67(8
2.86
)−
13.8
13(8
2.58
)−
11.9
69(8
2.93
)−
19.7
09(1
5.83
)D
BX
−E
MU
3
ck
,t−
1−
0.15
0(0
.100
)−
0.15
6(0
.100
)−
0.15
0(0
.100
)−
0.03
1(0
.015
)Adj
uste
dR
20.
366
0.35
90.
364
0.36
0F
−St
at25
.59
24.8
522
.52
26.8
3
Note
s:T
his
table
repor
tsth
ere
sult
sof
the
cros
s-se
ctio
nal
regr
essi
onof
bon
dnet
asse
tflow
s,su
mm
ariz
ing
findin
gsin
table
s6–
8.T
his
table
also
repor
tsth
ere
sult
sw
hen
cont
rollin
gfo
rth
epot
enti
aleff
ect
ofEM
Uan
dof
mar
ginal
div
ersi
fica
tion
ben
efits
.Exp
lanat
ory
vari
able
sar
edes
crib
edin
appen
dix
1.T
he
sam
ple
size
for
spec
ifica
tion
s15
–17a
,w
hic
hex
cludes
allze
rohol
din
gs,is
n=
639.
The
sam
ple
size
for
spec
ifi-
cati
on17
b,w
hic
hin
cludes
allze
rohol
din
gs,is
n=
783.
OLS,W
hit
ehet
eros
kedas
tici
ty-c
onsi
sten
tst
andar
der
rors
,an
dco
vari
ance
.Sta
ndar
der
rors
for
the
coeffi
cien
tsar
ere
por
ted
inpar
enth
eses
.**
*,**
,an
d*
den
ote
stat
isti
calsi
gnifi
cance
at1,
5,an
d10
per
cent
,re
spec
tive
ly.

184 International Journal of Central Banking June 2010
sharing of common platforms, such as Euronext—is the estimatedcoefficient on DEMU,EMU. It is positive and strongly statisticallysignificant for both equity and bond flows.
Unfortunately, the lack of back data on bilateral portfolio flowsdoes not allow us to verify whether the upward trend in intra-euro-area portfolio flows from 1998 onward already started before theestablishment of EMU. Indeed, we could have captured the processof financial integration in the EU, as a result of EU policies aimingat liberalizing cross-border portfolio allocation among EU memberstates in the 1990s. However, we can run a similar exercise includ-ing binary variables aiming at controlling for the EU effect. Giventhe strong correlation between the dummies capturing both the EUand the EMU effects, we subtract the EMU dummies from the EUdummies. The estimated coefficient on DEMU,EMU remains stronglystatistically significant in both equity and bond markets (see spec-ification 16 of tables 9 and 10). Moreover, the results reported inspecifications 16 and 17a of tables 9 and 10 indicate that the Euro-pean dummies are not statistically significant once we control forLondon as a major intermediary of euro-area foreign investmentsfrom and to the rest of the world.
Needless to say, the results remain invariant when we includethe zero holding positions in the sample and treat them as actualportfolio investment decisions (see specification 17b of tables 9and 10).
Therefore, there is evidence of a positive EMU effect on cross-border portfolio flows. On a 95 percent confidence level, the catalysteffect of the euro within the euro area over the cumulated period1998–2001 amounted to USD 22–47 billion in equity securities andUSD 32–76 billion in bonds and notes. On average, the impact onthe fixed-income market is larger possibly because European insti-tutional investors invested massively in domestic government debt.The adoption of the euro currency-matching rule allowed them torebalance into euro-denominated bonds issued by other EMU mem-ber states.
All in all, the link between international portfolio flows, the Int-CAPM, characteristics of monetary policy frameworks, and EMUis quite robust also in terms of adjusted R2, which is above 35percent in both models. This result is very important given thatthe analysis has been carried out in the middle of an equity bubble

Vol. 6 No. 2 The Geography of International Portfolio Flows 185
and burst, during therefore an extremely difficult period for globalasset management.
6. Adding Control Variables
The literature on portfolio flows has put forward a number of vari-ables potentially affecting the cross-border investment allocation.The aim of this section is to assess how robust the results are whenadding control variables to specification 15 of tables 9 and 10. Theresults reported in table 11 are obtained using the sample, exclud-ing the zero reporting for some holding positions. The results areinvariant when considering such zeros in the sample (not reported).
The “stages of development hypothesis” postulates an inverseU-shaped relationship between capital inflows and relative per capitaincome. Countries in the early stages of development tend to experi-ence capital inflows, which arise from building the infrastructure andexpanding domestic markets. In a subsequent phase, as new ideasare transformed into products and services and the country devel-ops some comparative advantages in specific industries, its per capitaincome rises and capital inflows decline. However, it is often arguedthat portfolio flows are particularly sizable among developed coun-tries, against the prediction of the “stages of development hypothe-sis” (Lucas 1990). Indeed, country k’s GDP per capita polynomial isnot statistically significant for the equity market and is even positivefor the bond market (see specification 18 of table 11).
Investment in research and development (R&D) is generally con-sidered a good policy to enhance the productivity of a country.If capital has a higher return in countries investing in R&D, theallocation of portfolios should also be partly affected. The imper-fection in international credit markets can affect the amount andthe direction of portfolio flows (Portes and Rey 2005).13 A struc-tural determinant of national savings is the demographic profile of acountry. Relatively high youth and old-age dependency ratios wouldbring about net capital inflows, as a relatively large population ofdependent young and old has a relatively lower savings rate (Ando
13R&D and bank credit to the private sectors are strongly correlated withthe GDP per capita (see table 3), because richer countries generally have moreresources to finance the private sector and the expenditure in R&D.

186 International Journal of Central Banking June 2010
Tab
le11
.In
tern
atio
nal
Por
tfol
ioFlo
ws,
Dev
elop
men
t,In
stitution
s,D
ista
ntn
ess,
and
Net
Issu
ance
Spec
if.
Expla
nat
ory
Equity
Flo
ws
Bon
dFlo
ws
Num
ber
Var
iable
Coeff
.s.
e.R
2C
oeff
.s.
e.R
2
Deg
ree
ofE
cono
mic
Dev
elop
men
t
pcG
DP
k,9
7−
0.00
0(0
.001
)0.
002∗
∗∗(0
.001
)18
pcG
DP
2 k,9
70.
002
(0.0
20)
0.36
40.
055∗
∗(0
.025
)0.
367
19Ban
kcr
edit/G
DP
k,9
70.
002
(0.0
05)
0.36
5−
0.00
3(0
.002
)0.
366
20R
&D
/G
DP
k,9
70.
081
(0.2
24)
0.36
5−
0.10
2(0
.158
)0.
366
You
ngk,9
70.
031
(0.0
21)
0.00
5(0
.032
)21
Old
k,9
70.
028
(0.0
52)
0.36
50.
007
(0.0
60)
0.36
4so
phc,9
80.
001
(0.0
02)
0.00
1(0
.002
)so
phk,9
80.
000
(0.0
02)
0.00
5∗∗∗
(0.0
02)
22ds
oph k
,t−
0.00
3(0
.007
)0.
364
0.00
9∗∗
(0.0
05)
0.36
7
Inst
itut
ion
Qua
lity
23Lib
erties
k,9
70.
006
(0.0
07)
0.36
50.
008
(0.0
05)
0.36
624
LaPor
tak,9
7−
0.00
4(0
.014
)0.
365
0.01
4(0
.019
)0.
366
25IC
RG
k,9
7−
0.03
8(0
.035
)0.
365
0.00
8(0
.021
)0.
366
26C
orru
ptio
n k,9
7−
0.00
3(0
.007
)0.
365
0.00
9(0
.007
)0.
366
(con
tinu
ed)

Vol. 6 No. 2 The Geography of International Portfolio Flows 187
Tab
le11
.(C
ontinued
)
Spec
if.
Expla
nat
ory
Equity
Flo
ws
Bon
dFlo
ws
Num
ber
Var
iable
Coeff
.s.
e.R
2C
oeff
.s.
e.R
2
Dis
tant
ness
27D
ista
nce c
k,9
7−
0.00
4(0
.003
)0.
367
0.00
1(0
.002
)0.
366
28Tra
deck,9
70.
043∗
(0.0
26)
0.36
80.
002
(0.0
46)
0.36
629
Tel
ck,9
8−
0.00
7(0
.007
)0.
366
0.00
2(0
.008
)0.
366
30La
ngua
geck,9
7−
0.00
0(0
.009
)0.
365
0.01
5∗∗
(0.0
07)
0.37
1
Eco
nom
icG
row
th
31Δ
GD
Pk,t
−1
0.00
1(0
.027
)0.
365
−0.
039∗
∗(0
.017
)0.
368
Net
New
Issu
ance
32Is
sues
k,t
0.03
2∗(0
.017
)0.
366
0.02
2∗∗∗
(0.0
06)
0.37
2
Note
s:T
his
table
repor
tsth
ere
sult
sof
acr
oss-
sect
ional
regr
essi
onof
por
tfol
ionet
asse
tflow
s.Eac
hex
pla
nat
ory
vari
able
ofth
ista
ble
isad
ded
asan
addit
ional
regr
esso
rto
the
mod
elsp
ecifi
cati
ons
15of
table
s9
and
10.T
he
expla
nat
ory
vari
able
sar
edes
crib
edin
appen
dix
1.T
he
sam
ple
size
isn
=66
7fo
req
uity
flow
san
dn
=63
9fo
rbon
dflow
san
dex
cludes
allze
rohol
din
gs.O
LS,W
hit
ehet
eros
kedas
tici
ty-c
onsi
sten
tst
andar
der
rors
,an
dco
vari
ance
.Sta
ndar
der
rors
for
the
coeffi
cien
tsar
ere
por
ted
inpar
enth
eses
.**
*,**
,an
d*
den
ote
stat
isti
calsi
gnifi
cance
at1,
5,an
d10
per
cent
,re
spec
tive
ly.

188 International Journal of Central Banking June 2010
and Modigliani 1963). All these variables are not statistically signif-icant (see specifications 19–21 of table 11). Let us stress that theseresults are based upon a cross-section analysis, where most of thecountries share similar characteristics.
Portes and Rey (1995) argue that the sophistication of finan-cial markets is an important determinant of equity flows. However,our results do not support this hypothesis. At the same time, thesophistication of financial markets in the recipient country and itsdevelopment over time are statistically significant for bond flows (seespecification 22).
Several studies argue that institutions matter in shaping thenet flow of capital across countries (Alfaro, Kalemli-Ozcan, andVolosovych 2007; Coeurdacier, De Santis, and Aviat 2009; De Santisand Luhrmann 2009). International investment decisions are affectedby risks as well as by the countries’ institutional framework, as tur-moil, violence, instability, rule of law, property rights, and freedominfluence economic market sentiment. We expect that countries withbetter institutions should attract portfolio flows. To assess the roleof the quality of the institutions, we look at standard indices suchas the degree of civil liberties; the degree of political, financial, andeconomic risks; the degree of perceived corruption; and the degree ofcontract repudiation and expropriation risks.14 The results are gen-erally weak (see specifications 23–26), possibly because most of thebilateral transactions in this study occur across developed countries,which generally have an adequate institutional setting.
To assess the role of distantness, we consider geographical dis-tance, bilateral trade intensity, phone-traffic volume, and commonlanguage. The phone-traffic volume can be interpreted as a proxy forinformation flows (Portes and Rey 2005), while common languagecan be interpreted as a proxy for cultural similarities.15 Trade in
14All indices proxying for the quality of the institutions are strongly correlatedamong them as well as vis-a-vis the GDP per capita, in that richer countries havebetter institutions (see table 3).
15Common language is a dummy that takes the value of 1 if receiving andinvesting countries share the same language. The language groupings are as fol-lows: English (Australia, Bermuda, Canada, Ireland, New Zealand, Singapore, theUnited Kingdom, and the United States); Spanish (Argentina, Chile, Spain, andVenezuela); French (Belgium, Canada, and France); German (Austria and Ger-many); Dutch (Belgium and Netherlands); and Scandinavian (Denmark, Norway,and Sweden).

Vol. 6 No. 2 The Geography of International Portfolio Flows 189
goods and services could facilitate the information flow across tradepartners, increasing the willingness to conduct cross-border portfoliotransactions. However, trade costs can also explain the equity port-folio home bias (Obstfeld and Rogoff 2001). In both interpretations,the deeper the trade relationship between countries, the deeper theirasset trade flow. There is some mild evidence for the trade variableaffecting equity flows (see specification 28) and for common languagehaving an impact on bond flows (see specification 30).
Finally, we also control for economic growth in the destinationcountry. Negative economic growth performance in the destinationcountry over the previous four years affects positively the subse-quent bond flows, possibly because a rebound in GDP growth mightbe expected (see specification 31).
The analysis so far presented focused on changes in demand.However, could important shifts occurring also on the supply sideaffect the results? The Maastricht Accord imposed tight restrictionson government debt. The effects of this were not symmetric acrosscountries and may have had a significant impact on the compositionof fixed-income securities available to investors. To assess whetherthe results remain robust to changes on the supply side, we useBIS data to compute the net new international equity and bondissues (the difference between completed issues and redemptions ina given period) over the period 1998–2001, which permit us to meas-ure the amount of new funds raised on the international markets.The net issuance of each individual country is then scaled by thetotal country portfolio. The results indicate that portfolio flows werealso affected by the new funds raised on the international marketsby the destination country (see specification 32).
All the results on the other regressors presented in tables 9and 10 remain unaltered when controlling for the effects of all thesevariables, as implicitly suggested by reporting the adjusted R2 intable 11.
7. Conclusions
It is generally believed that the predictions of the InternationalCapital Asset Pricing Model (IntCAPM) do not hold because of

190 International Journal of Central Banking June 2010
home bias, transaction costs, asymmetric information, speculativebehaviors of investors, etc. We have presented a simple modelingframework showing that the geography of international portfolioflows is only partly influenced by the IntCAPM. Using bilateral dataon international equity and bond flows, we find clear evidence thatinvestors do not hold assets of each country in proportion to thecountry’s share in the world market portfolio. However, the pre-dictions of the IntCAPM are partially met because the estimatedcoefficient, rather than being 1, is 0.4 for equity flows and 0.2 forbond flows. A country that sees its market size increase by 1 percent-age point relative to the world market capitalization would attractinternational equity (bond) flows amounting to 0.4 percent (0.2 per-cent) of the equity (bond) assets held abroad by foreigners. Thismight also imply that global equity markets are more integratedthan global bond markets and that there is still room for furtherintegration in both markets. The results remain invariant when con-trolling for home bias, the initial degree of misallocation, and pastreturns.
Additional findings suggest that (i) a decline in home bias gener-ates portfolio outflows vis-a-vis all countries; (ii) the higher the ini-tial non-linear degree of misallocation, which might be due to higherfixed transaction costs and information asymmetries, the greater theincentive to reduce them and, consequently, the larger the subse-quent bond flows; and (iii) asset allocators engage in trend-chasingactivities, particularly in bond markets.
We have also investigated whether characteristics of the mone-tary policy frameworks and the establishment of EMU influencedportfolio asset flows over the turbulent 1998–2001 period for theasset markets. We find clear evidence that investors preferred port-folio assets of countries where the central bank gave relative impor-tance to money. With consumer price inflation well anchored, mon-etary analysis might have provided a framework for monitoringand assessing developments in asset prices and financial imbalances,cardinal to international investors when forming expectations onfuture risk-adjusted asset returns. As for EMU, once controlling fordiversification benefits and the elimination of the exchange rate risk,we show that cross-border portfolio flows among euro-area countrieshave increased due to the catalyst effect of EMU (i.e., reductionof legal barriers, sharing of common platforms, and simplification

Vol. 6 No. 2 The Geography of International Portfolio Flows 191
of cross-border regulations). Therefore, we can safely say that EMUhas enhanced regional financial integration among euro-area memberstates in both equity and bond markets.
All in all, countries’ shares in the world market portfolio, homebias, initial degree of misallocation across countries, past returns,diversification benefits, monetary policy frameworks, and EMU canexplain 35–40 percent of the total variation in equity and bondportfolios over the turbulent 1998–2001 period, characterized by anequity bubble and the subsequent burst.
Appendix 1. Definitions of Variables
Variables Definitions
tck,t International transactions invested in countryk divided by country c’s average internationalholdings
wBenchk,97 Country’s share in the world market portfolio
HBc,97 Home bias of investing country c in 1997ΔHBc,97 HBc,01 − HBc,97
DWck,97 Difference between optimal and actual weights in1997
Retk,t−1 Total market return of receiving country k
end-1993 to end-1997Inflationk,98 Inflation focus index in country k in 1998: 0
(lowest importance) and 1 (highest importance)Moneyk,98 Money focus index in country k in 1998: 0
(lowest importance) and 1 (highest importance)Exchange ratek,98 Exchange rate focus index in country k in
1998: 0 (lowest importance) and 1 (highestimportance)
Discretionk,98 Discretion focus index in country k in 1998: 0(lowest importance) and 1 (highest importance)
Independencek,98 Independence index in country k in 1998: 0(lowest importance) and 1 (highest importance)
(continued)

192 International Journal of Central Banking June 2010
Variables Definitions
Accountabilityk,98 Accountability index in country k in 1998: 0(lowest importance) and 1 (highest importance)
Transparencyk,98 Transparency index in country k in 1998: 0(lowest importance) and 1 (highest importance)
Financial Financial stability role index in country k inStabilityk,98 1998: 0 (lowest importance) and 1 (highest
importance)FXvoleck,t−1 Standard deviation of the bilateral exchange rate
change from 1993 to 1997 with deutsche markbeing the EMU currency
Dc,EMU Dummy is 1 if receiving country belongs to theeuro area
DEMU,EMU Dummy is 1 if receiving and investing countriesbelong to the euro area
Dc,UK Dummy is 1 if receiving country belongs to theUnited Kingdom
DEMU,UK Dummy is 1 if investing country belongs to EMUand receiving country to the United Kingdom
Dc,EU Dummy is 1 if receiving country belongs to theEU
DEU,EU Dummy is 1 if receiving and investing countriesbelong to the EU
DBFHck,t−1 Expected diversification benefits—fully hedged
returnsDBEMU
ck,t−1 Expected diversification benefits—internal EMUcurrency exposure
DBX−EMUck,t−1 Expected diversification benefits—external EMU
currency exposurepcGDPk,97 Country k GDP per capita minus the GDP per
capita of Norway in 1997 (2000 internationalPPP—$1,000)
pcGDP2k,97 The square of country k GDP per capita minus
the GDP per capita of Norway in 1997 dividedby 1,000
(continued)

Vol. 6 No. 2 The Geography of International Portfolio Flows 193
Variables Definitions
Bank creditk,97 Bank credit to the private sector as a ratio to GDPof country k in 1997 minus the world average
R&Dk,97 R&D expenditure as a ratio to GDP of country k in1997 minus the world average
Youngk,97 Young dependents to working-age population incountry k relative to the world average in 1997
Oldk,97 Old dependents to working-age population incountry k relative to the world average in 1997
sophc,98 Sophistication of financial markets in country c in1998
sophk,98 Sophistication of financial markets in country k in1998
dsophk,t Change in the sophistication of financial markets incountry k, 1998 to 2001
Libertiesk,97 Civil liberties index in country k in 1997:0 (highest degree of freedom) and 1 (lowest degree offreedom)
La Portak,97 La Porta et al. (1998) index in country k in 1997: 0(highest risk) and 1 (lowest risk)
ICRGk,97 International Country Risk Guide rating in countryk in 1997: 0 (highest risk) and 1 (lowest risk)
Corruptionk,97 Perceived corruption index in country k in 1997: 0(highest risk) and 1 (lowest risk)
Distanceck,97 Logarithm of physical distance between capital citiesTradeck,97 Country k’s export share in country c plus country
c’s export share in country k in 1997Telck,97 Phone traffic (minutes per 1,000 subscribers)
between investing and receiving markets in 1997Languageck,97 Dummy is 1 if receiving and investing countries
share the same languageΔGDPk,t−1 Log-difference of the receiving country’s GDP in
USD at constant prices from 1993 to 1997Issuesk,t Net new issuance (completed issues minus redemp-
tions) from 1998 to 2001 divided by total country k
portfolio in 1997

194 International Journal of Central Banking June 2010A
ppen
dix
2.D
ata
Sou
rces
Dat
aP
rim
ary
Sou
rces
Sec
ondar
ySou
rces
Inte
rnat
iona
lPor
tfol
ioH
oldi
ngs
IMF-C
PIS
1997
,200
1G
erm
any:
Bun
desb
ank,
1997
Rea
l,N
omin
al,an
dPer
Cap
ita
Wor
dB
ank—
WD
IG
DP
Equ
ity
Mar
ket
Cap
ital
izat
ion
Tho
mso
nD
atas
trea
m/S
&P
Ber
mud
aSt
ock
Exc
hang
eB
ond
Mar
ket
Cap
ital
izat
ion
Leh
man
Bro
ther
sD
omes
tic
Bon
dsO
utst
andi
ngB
ISE
quity
Mar
kets
Tot
alR
etur
nsT
hom
son
Dat
astr
eam
Ber
mud
aSt
ock
Exc
hang
eB
ond
Mar
kets
Tot
alR
etur
nsJP
Mor
gan
Exc
hang
eR
ates
Tho
mso
nD
atas
trea
mP
hone
-Tra
ffic
Vol
ume
Wor
ldB
ank—
WD
IA
geD
epen
denc
yR
atio
sU
NW
orld
Pop
ulat
ion
Pro
spec
tsTra
deV
alue
sIM
FB
erm
uda
and
Isra
el:O
EC
DB
ank
Cre
dit
toth
eP
riva
teW
orld
Ban
k—W
DI
Sect
orR
&D
Exp
endi
ture
Wor
ldB
ank—
WD
IC
ivil
Lib
erti
esIn
dex
Free
dom
Hou
seLa
Por
taIn
dex
La
Por
taet
al.(
1998
)IC
RG
Inde
xIn
tern
atio
nalC
ount
ryR
isk
Gui
deC
orru
ptio
nIn
dex
Tra
nspa
renc
yIn
tern
atio
nal
Mon
etar
yPol
icy
Fram
ewor
ksM
ahad
eva
and
Ster
ne(2
000)
Soph
isti
cati
onof
Fin
anci
alW
orld
Eco
nom
icFo
rum
Mar
kets
Net
New
Issu
ance
BIS

Vol. 6 No. 2 The Geography of International Portfolio Flows 195
References
Ahearne, A. G., W. L. Griever, and F. E. Warnock. 2004. “Infor-mation Costs and the Home Bias: An Analysis of US Holdingsof Foreign Equities.” Journal of International Economics 62 (2):313–36.
Alesina, A., and L. H. Summers. 1993. “Central Bank Indepen-dence and Macroeconomic Performance: Some ComparativeEvidence.” Journal of Money, Credit, and Banking 25 (2):151–62.
Alfaro, L., S. Kalemli-Ozcan, and V. Volosovych. 2007. “Capi-tal Flows in a Globalized World: The Role of Policies andInstitutions.” In Capital Controls and Capital Flows in Emerg-ing Economies: Policies, Practices, and Consequences, ed. S.Edwards. National Bureau of Economic Research ConferenceReport. University of Chicago Press.
Ando, A., and F. Modigliani. 1963. “The ‘Life Cycle’ Hypothesis ofSaving: Aggregate Implications and Tests.” American EconomicReview 53 (1): 55–84.
Aviat, A., and N. Coeurdacier. 2007. “The Geography of Trade inGoods and Asset Holdings.” Journal of International Economics71 (1): 22–51.
Bohn, H., and L. L. Tesar. 1996. “U.S. Equity Investment in ForeignMarkets: Portfolio Rebalancing or Return Chasing?” AmericanEconomic Review 86 (2): 77–81.
Borio, C. E. V., and P. Lowe. 2004. “Securing Sustainable PriceStability: Should Credit Come Back from the Wilderness?” BISWorking Paper No. 157.
Brennan, M. J., and H. H. Cao. 1997. “International Portfolio Invest-ment Flows.” Journal of Finance 52 (5): 1851–80.
Coeurdacier, N., R. A. De Santis, and A. Aviat. 2009. “Cross-BorderMergers and Acquisitions and European Integration.” EconomicPolicy 24 (57): 55–106.
Committeri, M. 2000. “Effects of Volatile Asset Prices on Balanceof Payments and International Investment Position Data.” IMFWorking Paper No. 191.
Coval, J. D., and T. J. Moskowitz. 1999. “Home Bias at Home: LocalEquity Preference in Domestic Portfolios.” Journal of Finance54 (6): 2045–73.

196 International Journal of Central Banking June 2010
Cukierman, A. 1992. Central Bank Strategy, Credibility, and Inde-pendence: Theory and Evidence. Cambridge, MA: MIT Press.
De Santis, R. A., and B. Gerard. 2009. “International PortfolioReallocation: Diversification Benefits and European MonetaryUnion.” European Economic Review 53 (8): 1010–27.
De Santis, R. A., and M. Luhrmann. 2009. “On the Determinants ofNet International Portfolio Flows: A Global Perspective.” Jour-nal of International Money and Finance 28 (5): 880–901.
Detken, C., and F. Smets. 2004. “Asset Price Booms and MonetaryPolicy.” In Macroeconomic Policies in the World Economy, ed.Horst Siebert. Berlin: Springer.
European Central Bank. 2003. Review of the International Role ofthe Euro. Frankfurt am Main: European Central Bank.
Faruqee, H., S. Li, and I. K. Yan. 2004. “The Determinants of Inter-national Portfolio Holdings and Home Bias.” IMF Working PaperNo. 34.
Froot, K. A., P. G. O’Connell, and M. S. Seasholes. 2001. “ThePortfolio Flows of International Investors.” Journal of FinancialEconomics 59 (2): 151–93.
Gelos, R. G., and S.-J. Wei. 2005. “Transparency and InternationalPortfolio Holdings.” Journal of Finance 60 (6): 2987–3020.
Grilli, V., D. Masciandaro, and G. Tabellini. 1991. “Political andMonetary Institutions and Public Financial Policies in the Indus-trial Countries.” Economic Policy 6: 342–91.
Huberman, G. 2001. “Familiarity Breeds Investment.” Review ofFinancial Studies 14 (3): 659–80.
International Monetary Fund. 1997. International Capital Markets,Developments, Prospects, and Key Policy Issues. Washington,DC: International Monetary Fund.
———. 2005. Global Financial Stability Report. Washington, DC:International Monetary Fund.
Jacome, L. I., and F. F. Vazquez. 2005. “Any Link Between LegalCentral Bank Independence and Inflation? Evidence from LatinAmerica and the Caribbean.” IMF Working Paper No. 75.
Lane, P. R. 2006. “Global Bond Portfolios and EMU.” InternationalJournal of Central Banking 2 (2): 1–23.
Lane, P. R., and G. M. Milesi-Ferretti. 2008. “International Invest-ment Patterns.” Review of Economics and Statistics 90 (3): 538–49.
Vol. 6 No. 2 The Geography of International Portfolio Flows 197
La Porta, R., F. Lopez-de-Silanes, A. Shleifer, and R. W. Vishny.1998. “Law and Finance.” Journal of Political Economy 106 (6):1113–55.
Lintner, J. 1965. “The Valuation of Risk Assets and the Selectionof Risky Investments in Stock Portfolios and Capital Budgets.”Review of Economics and Statistics 47 (1): 13–37.
Lucas, R. E. 1990. “Why Doesn’t Capital Flow from Rich to PoorCountries?” American Economic Review 80 (2): 92–96.
Mahadeva, L., and G. Sterne. 2000. Monetary Policy Frameworks ina Global Context. London: Routledge.
Obstfeld, M., and K. Rogoff. 2001. “The Six Major Puzzles inInternational Macroeoconomics: Is There a Common Cause?”In NBER Macroeconomics Annual 2000, ed. B. S. Bernanke andK. Rogoff, 339–90. Cambridge, MA: MIT Press.
Papaioannou, E. 2009. “What Drives International Bank Flows? Pol-itics, Institutions and Other Determinants.” Journal of Develop-ment Economics 88 (2): 269–81.
Portes, R., and H. Rey. 2005. “The Determinants of Cross-BorderEquity Flows.” Journal of International Economics 65 (2): 269–96.
Rogoff, K. 1985. “The Optimal Degree of Commitment to an Inter-mediate Monetary Target.” Quarterly Journal of Economics 100(4): 1169–90.
Sercu, P. 1980. “A Generalization of the International Asset PricingModel.” Revue de l’Association Francaise de Finance 1: 91–135.
Sharpe, W. F. 1964. “Capital Asset Prices: A Theory of MarketEquilibrium under Conditions of Risk.” Journal of Finance 19(3): 425–42.
Solnik, B. H. 1974. “An Equilibrium Model of the InternationalCapital Market.” Journal of Economic Theory 8 (4): 500–24.