The Genomic Landscape of the Ewing Sarcoma Family of ... · may represent distinct small round blue...
13
The Genomic Landscape of the Ewing Sarcoma Family of Tumors Reveals Recurrent STAG2 Mutation Andrew S. Brohl 1,2 , David A. Solomon 3 , Wendy Chang 1 , Jianjun Wang 1 , Young Song 1 , Sivasish Sindiri 1 , Rajesh Patidar 1 , Laura Hurd 1 , Li Chen 1 , Jack F. Shern 1 , Hongling Liao 1 , Xinyu Wen 1 , Julia Gerard 4 , Jung- Sik Kim 4 , Jose Antonio Lopez Guerrero 5 , Isidro Machado 5 , Daniel H. Wai 6 , Piero Picci 7 , Timothy Triche 6 , Andrew E. Horvai 3 , Markku Miettinen 8 , Jun S. Wei 1 , Daniel Catchpool 4 , Antonio Llombart-Bosch 5 , Todd Waldman 9 , Javed Khan 1 * 1 Oncogenomics Section, Pediatric Oncology Branch, Center for Cancer Research, National Cancer Institute, National Institutes of Health, Bethesda, Maryland, United States of America, 2 Department of Genetics and Genomic Sciences, Icahn School of Medicine at Mount Sinai, New York, New York, United States of America, 3 Department of Pathology, University of California, San Francisco, San Francisco, California, United States of America, 4 The Tumour Bank, The Children’s Cancer Research Unit, The Children’s Hospital at Westmead, Westmead, New South Wales, Australia, 5 Department of Pathology, University of Valencia, Valencia, Spain, 6 Center for Personalized Medicine, Children’s Hospital Los Angeles, University of Southern California Los Angeles, Los Angeles, California, United States of America, 7 Laboratory of Experimental Oncology, Rizzoli Institute, Bologna, Italy, 8 Laboratory of Pathology, Center for Cancer Research, National Cancer Institute, Bethesda, Maryland, United States of America, 9 Department of Oncology, Lombardi Comprehensive Cancer Center, Georgetown University School of Medicine, Washington, District of Columbia, United States of America Abstract The Ewing sarcoma family of tumors (EFT) is a group of highly malignant small round blue cell tumors occurring in children and young adults. We report here the largest genomic survey to date of 101 EFT (65 tumors and 36 cell lines). Using a combination of whole genome sequencing and targeted sequencing approaches, we discover that EFT has a very low mutational burden (0.15 mutations/Mb) but frequent deleterious mutations in the cohesin complex subunit STAG2 (21.5% tumors, 44.4% cell lines), homozygous deletion of CDKN2A (13.8% and 50%) and mutations of TP53 (6.2% and 71.9%). We additionally note an increased prevalence of the BRCA2 K3326X polymorphism in EFT patient samples (7.3%) compared to population data (OR 7.1, p = 0.006). Using whole transcriptome sequencing, we find that 11% of tumors pathologically diagnosed as EFT lack a typical EWSR1 fusion oncogene and that these tumors do not have a characteristic Ewing sarcoma gene expression signature. We identify samples harboring novel fusion genes including FUS-NCATc2 and CIC-FOXO4 that may represent distinct small round blue cell tumor variants. In an independent EFT tissue microarray cohort, we show that STAG2 loss as detected by immunohistochemistry may be associated with more advanced disease (p = 0.15) and a modest decrease in overall survival (p = 0.10). These results significantly advance our understanding of the genomic and molecular underpinnings of Ewing sarcoma and provide a foundation towards further efforts to improve diagnosis, prognosis, and precision therapeutics testing. Citation: Brohl AS, Solomon DA, Chang W, Wang J, Song Y, et al. (2014) The Genomic Landscape of the Ewing Sarcoma Family of Tumors Reveals Recurrent STAG2 Mutation. PLoS Genet 10(7): e1004475. doi:10.1371/journal.pgen.1004475 Editor: Marshall S. Horwitz, University of Washington, United States of America Received April 9, 2014; Accepted May 15, 2014; Published July 10, 2014 This is an open-access article, free of all copyright, and may be freely reproduced, distributed, transmitted, modified, built upon, or otherwise used by anyone for any lawful purpose. The work is made available under the Creative Commons CC0 public domain dedication. Data Availability: All data underlying the findings are fully available for general research use to applicants whose data access request is approved by the dbGaP Data Access Committee (dbGaP accession number phs000768.v1.p1). Because of confidentiality issues associated with human subject data, they cannot be made available without restriction. Funding: WC, JW, YS, SS, RP, LH, LC, JFS, HL, XW, JSW, and JK are supported by the Intramural Research Program of the NIH, National Cancer Institute, Center for Cancer Research. The funders had no role in study design, data collection and analysis, decision to publish, or preparation of the manuscript. Competing Interests: The authors have declared that no competing interests exist. * Email: [email protected] Introduction The Ewing sarcoma family of tumors (EFT) is a group of malignant small round blue cell tumors that arise in bone or soft tissue. Ewing sarcoma (ES) is the second most common type of primary bone tumor to affect children and adolescents and accounts for 2.9% of all childhood cancers [1]. Despite advances in multidisciplinary treatment leading to improved outcomes over time for localized disease, long term survival remains poor for patients with metastatic or relapsed disease [2,3]. The pathological diagnosis of Ewing sarcoma is based on the finding of a small round blue cell tumor (SRBCT) that stains for MIC2 (CD99) but has absence of markers that characterize the other pathologically defined SRBCT variants. In larger centers an EWSR1 break-apart probe is used to detect a fusion event involving this gene, but in most cases this test is not required for a diagnosis of Ewing sarcoma. In previous case series, most EFT cases express one of several reciprocal translocations, most commonly t(11;22)(q24;q12) between the amino terminus of the EWSR1 gene and the carboxy terminus of the FLI1 gene found in 85–90% of cases [4,5]. A number of variant translocations between an alternate member of the TET family of RNA-binding proteins and/or an alternate member of the ETS family of transcription factors have also been described [6]. Additional structural chromosomal changes are PLOS Genetics | www.plosgenetics.org 1 July 2014 | Volume 10 | Issue 7 | e1004475
Transcript of The Genomic Landscape of the Ewing Sarcoma Family of ... · may represent distinct small round blue...

The Genomic Landscape of the Ewing Sarcoma Family ofTumors Reveals Recurrent STAG2 MutationAndrew S. Brohl1,2, David A. Solomon3, Wendy Chang1, Jianjun Wang1, Young Song1, Sivasish Sindiri1,
Rajesh Patidar1, Laura Hurd1, Li Chen1, Jack F. Shern1, Hongling Liao1, Xinyu Wen1, Julia Gerard4, Jung-
Sik Kim4, Jose Antonio Lopez Guerrero5, Isidro Machado5, Daniel H. Wai6, Piero Picci7, Timothy Triche6,
Andrew E. Horvai3, Markku Miettinen8, Jun S. Wei1, Daniel Catchpool4, Antonio Llombart-Bosch5,
Todd Waldman9, Javed Khan1*
1 Oncogenomics Section, Pediatric Oncology Branch, Center for Cancer Research, National Cancer Institute, National Institutes of Health, Bethesda, Maryland, United
States of America, 2 Department of Genetics and Genomic Sciences, Icahn School of Medicine at Mount Sinai, New York, New York, United States of America,
3 Department of Pathology, University of California, San Francisco, San Francisco, California, United States of America, 4 The Tumour Bank, The Children’s Cancer Research
Unit, The Children’s Hospital at Westmead, Westmead, New South Wales, Australia, 5 Department of Pathology, University of Valencia, Valencia, Spain, 6 Center for
Personalized Medicine, Children’s Hospital Los Angeles, University of Southern California Los Angeles, Los Angeles, California, United States of America, 7 Laboratory of
Experimental Oncology, Rizzoli Institute, Bologna, Italy, 8 Laboratory of Pathology, Center for Cancer Research, National Cancer Institute, Bethesda, Maryland, United
States of America, 9 Department of Oncology, Lombardi Comprehensive Cancer Center, Georgetown University School of Medicine, Washington, District of Columbia,
United States of America
Abstract
The Ewing sarcoma family of tumors (EFT) is a group of highly malignant small round blue cell tumors occurring in childrenand young adults. We report here the largest genomic survey to date of 101 EFT (65 tumors and 36 cell lines). Using acombination of whole genome sequencing and targeted sequencing approaches, we discover that EFT has a very lowmutational burden (0.15 mutations/Mb) but frequent deleterious mutations in the cohesin complex subunit STAG2 (21.5%tumors, 44.4% cell lines), homozygous deletion of CDKN2A (13.8% and 50%) and mutations of TP53 (6.2% and 71.9%). Weadditionally note an increased prevalence of the BRCA2 K3326X polymorphism in EFT patient samples (7.3%) compared topopulation data (OR 7.1, p = 0.006). Using whole transcriptome sequencing, we find that 11% of tumors pathologicallydiagnosed as EFT lack a typical EWSR1 fusion oncogene and that these tumors do not have a characteristic Ewing sarcomagene expression signature. We identify samples harboring novel fusion genes including FUS-NCATc2 and CIC-FOXO4 thatmay represent distinct small round blue cell tumor variants. In an independent EFT tissue microarray cohort, we show thatSTAG2 loss as detected by immunohistochemistry may be associated with more advanced disease (p = 0.15) and a modestdecrease in overall survival (p = 0.10). These results significantly advance our understanding of the genomic and molecularunderpinnings of Ewing sarcoma and provide a foundation towards further efforts to improve diagnosis, prognosis, andprecision therapeutics testing.
Citation: Brohl AS, Solomon DA, Chang W, Wang J, Song Y, et al. (2014) The Genomic Landscape of the Ewing Sarcoma Family of Tumors Reveals RecurrentSTAG2 Mutation. PLoS Genet 10(7): e1004475. doi:10.1371/journal.pgen.1004475
Editor: Marshall S. Horwitz, University of Washington, United States of America
Received April 9, 2014; Accepted May 15, 2014; Published July 10, 2014
This is an open-access article, free of all copyright, and may be freely reproduced, distributed, transmitted, modified, built upon, or otherwise used by anyone forany lawful purpose. The work is made available under the Creative Commons CC0 public domain dedication.
Data Availability: All data underlying the findings are fully available for general research use to applicants whose data access request is approved by the dbGaPData Access Committee (dbGaP accession number phs000768.v1.p1). Because of confidentiality issues associated with human subject data, they cannot be madeavailable without restriction.
Funding: WC, JW, YS, SS, RP, LH, LC, JFS, HL, XW, JSW, and JK are supported by the Intramural Research Program of the NIH, National Cancer Institute, Center forCancer Research. The funders had no role in study design, data collection and analysis, decision to publish, or preparation of the manuscript.
Competing Interests: The authors have declared that no competing interests exist.
* Email: [email protected]
Introduction
The Ewing sarcoma family of tumors (EFT) is a group of
malignant small round blue cell tumors that arise in bone or soft
tissue. Ewing sarcoma (ES) is the second most common type of
primary bone tumor to affect children and adolescents and
accounts for 2.9% of all childhood cancers [1]. Despite advances
in multidisciplinary treatment leading to improved outcomes over
time for localized disease, long term survival remains poor for
patients with metastatic or relapsed disease [2,3]. The pathological
diagnosis of Ewing sarcoma is based on the finding of a small
round blue cell tumor (SRBCT) that stains for MIC2 (CD99) but
has absence of markers that characterize the other pathologically
defined SRBCT variants. In larger centers an EWSR1 break-apart
probe is used to detect a fusion event involving this gene, but in
most cases this test is not required for a diagnosis of Ewing
sarcoma. In previous case series, most EFT cases express one of
several reciprocal translocations, most commonly t(11;22)(q24;q12)
between the amino terminus of the EWSR1 gene and the carboxy
terminus of the FLI1 gene found in 85–90% of cases [4,5]. A
number of variant translocations between an alternate member of
the TET family of RNA-binding proteins and/or an alternate
member of the ETS family of transcription factors have also been
described [6]. Additional structural chromosomal changes are
PLOS Genetics | www.plosgenetics.org 1 July 2014 | Volume 10 | Issue 7 | e1004475

frequently found in EFT, including gain of chromosome 1q, 2, 8,
and 12, and losses of 9p and 16q [7–9]. Recurrent mutations in
known tumor suppressor genes have also been described, though
with lower frequency. Most notably, homozygous deletions of
CDKN2A (which encodes p16INK4a) have been detected in 10 to
30 percent of cases and TP53 mutations in 3 to 14 percent of cases
[10–19]. Unfortunately, increased understanding of these molec-
ular alterations has yet to produce successful targeted therapies.
We therefore performed next generation sequencing on a panel of
Ewing sarcoma family tumors and cell lines to identify additional
molecular alterations associated with this aggressive cancer.
Results
To gain insight into the genetic landscape of EFT, we first
performed whole genome paired-end sequencing of six Ewing
sarcoma family tumors and paired constitutional DNA purified
from peripheral blood. Sequencing generated an average of
375 Gb of mapped reads per sample to a mean depth of 119X,
which allowed for high quality calls covering 97.7% of the
genome. Additional sequencing statistics verified that the coverage
and parameters used were sufficient to detect most of the
sequencing variants in these samples (Table S1). To extend our
findings from the whole-genome sequencing cohort, we performed
targeted genomic sequencing and/or whole-transcriptome se-
quencing on a total of 101 EFT samples including 65 tumors and
36 cell lines, with both technologies being utilized in the majority
of samples (Table S2).
Ewing sarcoma family tumors have a low density ofsomatic mutation and structural variation
In the whole genome sequenced samples, we detected an
average of 361 somatic mutations per tumor in non-repetitive
regions and an average of 6 somatic mutations per tumor in
protein coding regions (0.15 mutations/Mb of coding sequence),
placing EFT at the low end of the mutation rate spectrum
compared to previously reported malignancies [20]. There were
no recurrent somatic small variants at the gene level within the 6
samples (Table S3). Somatic structural variants in this cohort were
assessed using analysis of paired-end clones with discordant ends
plus sequence coverage data from the whole genome sequencing
data. Structural variants that involved a copy number change were
verified using high-density SNP arrays with high degree of
concordance (33/35 = 94.3%). Significant findings include previ-
ously reported alterations such as the characteristic EWSR1-FLI1gene fusion detected in all 6 samples, CDKN2A homozygous
deletion in 2 samples, and frequent chromosomal gains and losses.
Novel findings include multiple focal areas of loss of heterozygos-
ity, several out-of-frame gene fusions, and a tandem-duplication
within the STAG2 gene in one sample (Table S4). There was an
average of 17 structural variations per sample and no areas
containing a high-density of structural variations (i.e. chromo-
thripsis) were discovered. This number of structural variants is
comparatively low relative to other pediatric tumors that have
been evaluated by similar methods [21,22]. In summary, WGS of
6 EFTs revealed the characteristic EWSR1 fusion genes, low
mutational burden and structural variations, but two tumors had
loss of STAG2 (frameshift variant in EWS2017 and focal tandem
duplication in EWS2020), and two had deletion of CDKN2A(EWS2009 and EWS2020) (Figure 1, Figure S1).
Tumors lacking a EWSR1-ETS fusion have distinctmolecular characteristics from the remaining majorityEwing sarcoma family tumors
In all 31 cell lines in which RNA sequencing was performed, an
EWSR1-ETS family fusion transcript was detected (Table S5). In
62 tumor samples analyzed by RNA sequencing, 55 contained an
EWSR1-ETS family fusion including 28 EWSR1-FLI1 type I
(51%), 11 EWSR1-FLI1 type II (20%), 11 other EWSR1-FLI1variants (20%), 3 EWSR1-ERG (5%), and 2 EWSR1-FEV fusions
(4%) (Table S5). Of the 7 tumors remaining without a EWSR1-
ETS fusion, one sample was found to have a novel FUS-NCATc2fusion (Figure S2A). Another EWSR1-ETS negative sample
contained a novel CIC-FOXO4 fusion (Figure S2B). Both of these
novel fusions are in-frame and contain the functional domains of
the associated genes important for oncogenic potential. A third
sample contained an ETV6-NTRK3 fusion (Figure S2C), an
alteration previously reported in association with infantile fibro-
sarcoma, congenital mesoblastic nephromas, secretory carcinoma
of breast, mammary analogue secretory carcinoma of salivary
gland, and radiation-associated thyroid cancer [23–27]. Hierar-
chical clustering based on RNA expression show that the 7 tumor
samples without a TET-ETS fusion, including the 3 with the
above alternate fusions, cluster separately from the vast majority of
EWS-ETS fusion-positive samples (Figure 2A). Additionally, these
7 samples show low expression of a collection of EWSR1-FLI1
target genes as well as low expression of a Ewing sarcoma gene
signature previously reported by our group [28] (Figure 2B, Figure
S3). We therefore consider these samples to be molecularly distinct
from EFT and omitted them for the purposes of mutational
frequency calculation. The patients with alternate fusions were
noted to be clinically aggressive and to have slightly atypical
histologic features, also suggesting a difference from classic Ewing
sarcoma (Text S1).
Recurrent mutation in tumor suppressor genes STAG2,CDKN2A, and TP53
Through WGS and targeted sequencing we identified recur-
rent inactivating mutations of STAG2. To extend our genomic
analysis we performed capillary sequencing of the 33 coding
exons of STAG2 in our tumor panel and in an expanded cell line
panel to confirm our sequencing findings and to evaluate for
Author Summary
The Ewing sarcoma family of tumors is a group ofaggressive cancers that primarily affects the pediatricand young adult population. Increasingly, genomics arebeing used to better define the disease biology and toidentify targets for therapy in many cancer types. Here, wereport one of the first and largest genomic studies to datein the Ewing sarcoma family of tumors. Using a combina-tion of modern sequencing techniques in .100 samples,we discover that Ewing sarcomas have a genome that isless complex compared to most cancer types previouslysurveyed. We find that this cancer is frequently affected bymutations in STAG2, a gene that has recently gainedattention due to its importance in the biology of severalcancer types. We show that Ewing sarcoma patients whosetumors are affected by STAG2 loss may have a worseprognosis. Additionally, we identify a subset of tumors thatwere diagnosed as Ewing sarcoma that appear to bedistinct from the majority based on genetic and molecularcharacteristics. Our findings help to define the geneticlandscape of Ewing sarcoma and provide a starting pointfor improving individualization of diagnosis, prognosis andtreatment in this cancer.
The Genomic Landscape of Ewing Sarcoma
PLOS Genetics | www.plosgenetics.org 2 July 2014 | Volume 10 | Issue 7 | e1004475
additional mutations. In total, we discovered STAG2 alterations
in 30 of 101 (29.7%) of EFT samples including 14 of 65 (21.5%)
clinical tumor samples and 16 of 36 (44.4%) cell lines (Table 1,
Table S5). Four of these cell lines had previously been reported to
harbor STAG2 mutations [29]. Mutations were confirmed to be
somatic in all tumor samples in which germline DNA from the
same patient was available for comparison (7 tumors). The vast
majority of the STAG2 variants are loss of function mutations,
including 10 nonsense, 8 frameshift, 3 splice-site, and 5 structural
variants, as well as a 59 deletion previously found to cause absent
protein expression (Figure 3A, Table S5) [29]. The remaining
three mutations of unclear functional consequence include a
tumor with point mutation in the 39 untranslated (UTR) region, a
cell line with a missense mutation, and a cell line with a complex
in-frame insertion (1 bp deletion replaced by a 7 bp insertion).
Interestingly, 5 samples (4 tumors and 1 cell line) contained the
same nonsense mutation, R216X. Mutations of STAG2 (located
on the X chromosome) were always heterozygous in samples with
female genotype. In all STAG2 mutated cell lines in which RNA
sequencing data was available, the altered allele was exclusively
expressed (15 cell lines), indicating in the case of female samples
that the X chromosome harboring the wild type STAG2 allele
was silenced. In tumor samples, all evaluable STAG2 mutated
samples showed preferential RNA expression of the mutant allele
with varying amounts of wild type allele (median variant allele
frequency 0.78), likely due to varying amounts of normal tissue
contamination. STAG2 mRNA expression was significantly lower
in samples with truncating mutations, likely due to nonsense-
mediated decay (Figure S4). Seven additional EFT samples (five
tumors and two cell lines) in which STAG2 mutation was not
identified by our methods also had very low STAG2 expression
comparable to samples with a truncating mutation in STAG2(Figure S4). Immunohistochemistry (IHC) analysis with an
antibody that binds to an epitope at the C-terminus of the
STAG2 protein confirmed that EFT tumors with truncating
STAG2 mutations have absent STAG2 protein expression, while
the admixed non-neoplastic stromal and endothelial cells had
robust expression (Figure 4). Tumors with wild-type STAG2 had
robust expression of STAG2 protein specifically in cell nuclei as
expected (Figure 4). Tissue microarrays (TMA) from an
independent cohort of genetically confirmed Ewing sarcoma
cases [30] were evaluated for STAG2 expression by IHC. In 210
evaluable cases, loss of STAG2 expression was found in 30
tumors (14.3%), 28 of which demonstrated complete absence of
STAG2 protein and 2 of which demonstrated mosaic loss of
STAG2 (Figure S5). Western blots performed on the EFT cell
line panel demonstrated complete absence of STAG2 protein in
13 cell lines and altered protein in 3 cell lines, concordant with all
14 samples with inactivating mutations and the 2 samples with
low RNA expression but no identified mutation (Figure 5, Table
S6).
We identified TP53 mutation in 4 of 65 (6.2%) EFT tumor
samples and in 23 of 32 (71.9%) EFT cell lines tested. Almost all of
the TP53 mutations we discovered are previously reported
pathologic variants and/or are truncating mutations (nonsense,
splice site, or frameshift) (Figure 3B, Table S5). RNA expression
analysis showed that there were 4 additional EFT samples (2
tumors, 2 cell lines) in which TP53 mutation was not identified but
had low TP53 expression similar to those with a truncating
mutation (Figure S6).
CDKN2A deletion was detected in 9 of 65 (13.8%) EFT tumors
and in 16 of 32 (50%) EFT cell lines tested based on DNA and/or
RNA sequencing coverage (Figure S7, Figure S8A). The semi-
quantitative nature of the PCR reactions combined with varying
amounts of normal contamination potentially results in a
decreased sensitivity to detect this finding in our tumor samples.
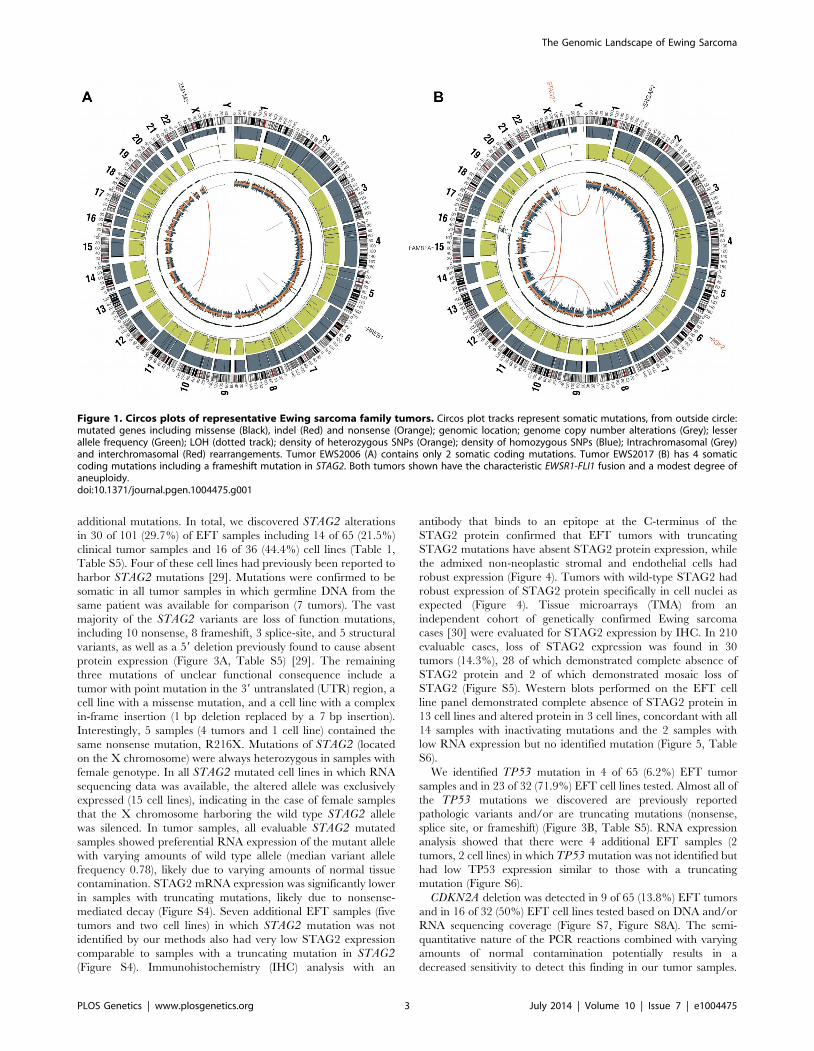
Figure 1. Circos plots of representative Ewing sarcoma family tumors. Circos plot tracks represent somatic mutations, from outside circle:mutated genes including missense (Black), indel (Red) and nonsense (Orange); genomic location; genome copy number alterations (Grey); lesserallele frequency (Green); LOH (dotted track); density of heterozygous SNPs (Orange); density of homozygous SNPs (Blue); Intrachromasomal (Grey)and interchromasomal (Red) rearrangements. Tumor EWS2006 (A) contains only 2 somatic coding mutations. Tumor EWS2017 (B) has 4 somaticcoding mutations including a frameshift mutation in STAG2. Both tumors shown have the characteristic EWSR1-FLI1 fusion and a modest degree ofaneuploidy.doi:10.1371/journal.pgen.1004475.g001
The Genomic Landscape of Ewing Sarcoma
PLOS Genetics | www.plosgenetics.org 3 July 2014 | Volume 10 | Issue 7 | e1004475

Figure 2. Molecular profiling of Ewing sarcoma family tumors using RNA sequencing data. EFT clinical samples that lack an EWSR1-fusionhave a distinct profile. A) Hierarchical clustering based on RNA expressional profile shows the fusion negative (blue) and alternate fusion (red)samples to separate from the majority of EWSR1-fusion positive EFTs. B) Expression profile of Ewing sarcoma signature genes (top) and genescorrelating with EWSR1-FLI1 target NROB1 (bottom) in normal tissues and EFT cohort demonstrating the lack of typical expressional profile in EWSR1-fusion negative samples (Alt).doi:10.1371/journal.pgen.1004475.g002
The Genomic Landscape of Ewing Sarcoma
PLOS Genetics | www.plosgenetics.org 4 July 2014 | Volume 10 | Issue 7 | e1004475

Western blots performed on the EFT cell lines demonstrated
complete absence of p16INK4A expression in all cell lines in which
deletion was detected (Figure 5, Table S6).
In summary, we found that STAG2, TP53 or CDKN2A was
altered in 57 of 97 (58.7%) of EFT samples (excluding tumors
lacking an EWSR1-ETS fusion) in which these 3 genes were
sequenced by at least one technology (Figure 6). This count
includes 26 of 65 (40.0%) clinical tumor samples and 31 of 32
(96.9%) cell lines. In the clinical tumor samples, these alterations
were typically mutually exclusive in 19 of 26 (65.5%) although
several samples had STAG2 mutations in association with TP53mutations or CDKN2A deletions (Figure 6).
Table 1. Mutational frequency of recurrently altered genes in Ewing sarcoma family tumors and cell lines.
STAG2 TP53 CDKN2A
Tumors (65) 14 (21.5%) 4 (6.2%) 9 (13.8%)
Cell Lines (36*) 16 (44.4%) 23 (71.9%) 16 (50%)
*4 cell lines were tested only for STAG2 mutation but not TP53 nor CDKN2A.doi:10.1371/journal.pgen.1004475.t001
Figure 3. Mutational spectrum in STAG2 (A) and TP53 (B) on linear protein models. Exonic point mutations and small indels are shown inrelation to the functional domains of these genes. Larger structural mutations and non-exonic mutations in STAG2 are not pictured and include multi-exon intragenic deletions (3), intronic splice site mutations (3), intragenic duplication events (2), 59 (1) and 39 UTR (1) mutations.doi:10.1371/journal.pgen.1004475.g003
The Genomic Landscape of Ewing Sarcoma
PLOS Genetics | www.plosgenetics.org 5 July 2014 | Volume 10 | Issue 7 | e1004475
High prevalence of the BRCA2 K3326X polymorphismIn addition to the targeted gene panel that was sequenced, we
examined variants in all genes from our RNA sequencing data to
look for other potentially oncogenic mutations (Table S7). We
discovered several well-established cancer mutations in single
samples, including a BRAF V600E mutation (cell line A673), a
PI3KCA mutation (cell line ES4) that has been recurrently found
in multiple cancer types, and a RAD51 alteration (tumor
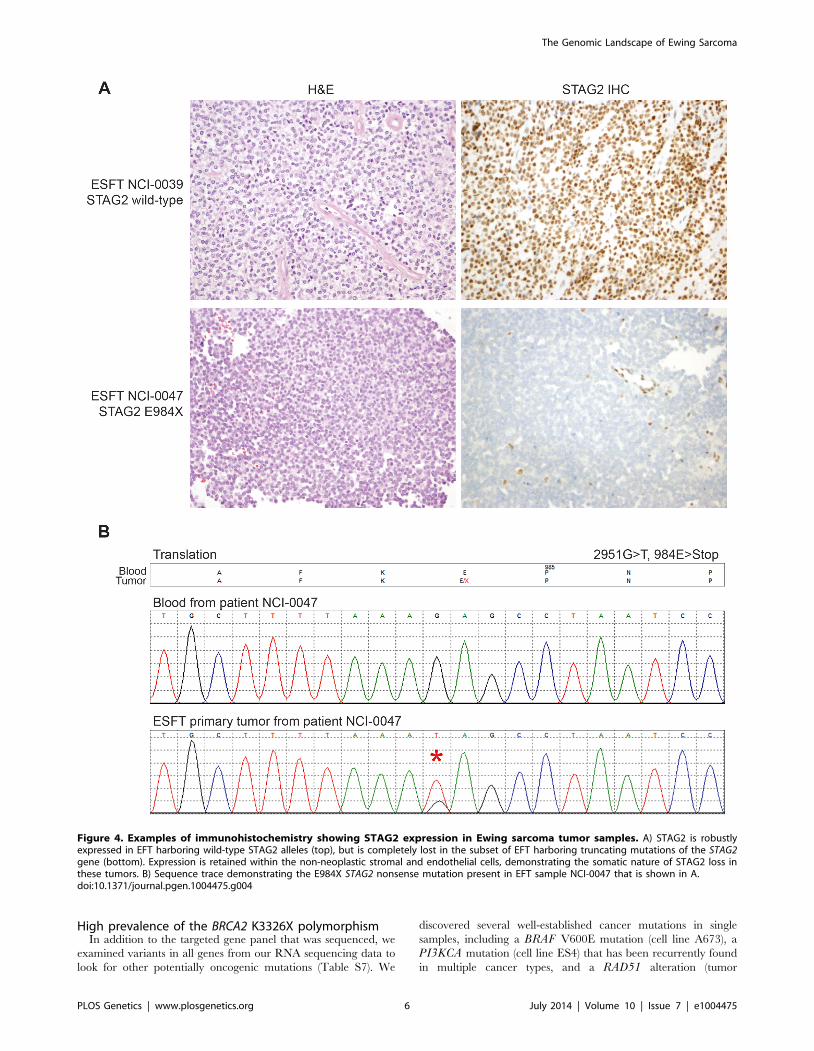
Figure 4. Examples of immunohistochemistry showing STAG2 expression in Ewing sarcoma tumor samples. A) STAG2 is robustlyexpressed in EFT harboring wild-type STAG2 alleles (top), but is completely lost in the subset of EFT harboring truncating mutations of the STAG2gene (bottom). Expression is retained within the non-neoplastic stromal and endothelial cells, demonstrating the somatic nature of STAG2 loss inthese tumors. B) Sequence trace demonstrating the E984X STAG2 nonsense mutation present in EFT sample NCI-0047 that is shown in A.doi:10.1371/journal.pgen.1004475.g004
The Genomic Landscape of Ewing Sarcoma
PLOS Genetics | www.plosgenetics.org 6 July 2014 | Volume 10 | Issue 7 | e1004475

EWS101) associated with familial breast cancer [31]. In addition
we discovered the BRCA2 K3326X polymorphism in 5 samples, 4
from patient tumors and one in a cell line (TC-106). The patient
frequency of 4 of 55 (7.3%) EFT tumor samples tested with this
finding is statistically higher than expected given the population
frequency of 12 of 1094 controls having this polymorphism in the
1000 genomes database (OR 7.1, p = 0.006). In our tumor
samples, this polymorphism was mutually exclusive with STAG2,
CDKN2A, and TP53 mutations, though overlapped with STAG2expression loss in one case (Figure 6, Table S5). Germline material
was not available to assess whether these findings represent
germline or somatic changes in our patients. We discovered one
additional BRCA2 missense mutation (S2186T) that is previously
unreported in dbSNP and is of uncertain clinical significance
(Table S7). We did not identify additional altered genes in our
sequencing that were predicted driver mutations.
STAG2 mutation is associated with alterations in the TP53signaling pathway
A significant relationship was noted between STAG2 loss and
TP53 mutational status in the EFT cell lines. In the 16 cell lines
with deleterious STAG2 alterations (inactivating mutation or loss
of expression), there were 14 (87.5%) with TP53 mutations, all
missense. In the 20 remaining cell lines with intact STAG2, only 9
Figure 5. Western blots analysis of STAG2, TP53, p21WAF1/CIP1, and p16INK4a on a panel of 36 unique EFT cell lines. 13 of 36 cell lineshave complete absence of STAG2 protein, an additional two cell lines (6647 and TC-215) have STAG2 isoforms with altered molecular weight due tolarge intragenic in-frame insertions or deletions, one additional cell line (ES-7) has intact STAG2 expression despite a frameshift mutation occurring atamino acid residue 1212 that is C-terminal to the epitope recognized by the antibody, and two additional cell lines have intact STAG2 expression butharbor a small in-frame insertion (CHLA-9) and a missense mutation (ES-6). Absence of p16INK4a protein is seen in 25/36 cell lines including all 16with identified CDKN2A deletion.doi:10.1371/journal.pgen.1004475.g005
Figure 6. Summary of sequencing findings in EFT tumors (red) and cell lines (dark blue) highlighting recurrent alterations. There arefrequent alterations in STAG2, TP53, and CDKN2A in EFT tumors and cell lines. 57/97 (58.7%) of samples containing an EWSR1-ETS fusion have asecondary mutation in one of these three tumor suppressor genes. Notable variants in BRAF, PI3KCA, RAD51 and BRCA2 are also shown.doi:10.1371/journal.pgen.1004475.g006
The Genomic Landscape of Ewing Sarcoma
PLOS Genetics | www.plosgenetics.org 7 July 2014 | Volume 10 | Issue 7 | e1004475

of the 16 (56.3%) evaluated by sequencing contained a TP53mutation, 5 of which were truncating and 4 of which were
missense. Western blots demonstrated that 11 of 16 cell lines with
deleterious STAG2 alteration had overexpression of p53 protein
(Figure 5, Table S6). Conversely, only 2 of 20 STAG2-intact cell
lines had detectable p53. Congruent with these findings, TP53transcript levels from RNA sequencing were approximately 4-fold
higher in cell lines with deleterious STAG2 alteration (log2 FPKM
5.26 vs. 3.47, p = 0.0023) (Figure S9A). To assess the functional
consequence of TP53 overexpression related to STAG2 mutation,
we assessed the RNA expression levels of CDKN1A (which
encodes p21WAF1/CIP1) as a marker of p53 activity. As expected,
cell lines with TP53 mutation or expression loss showed lower
levels of CDKN1A transcript than TP53 wild type cell lines (log2
FPKM 0.09 vs 4.85, p = 0.0005). STAG2 mutation in the EFT cell
lines similarly predicted for decreased CDKN1A transcript
expression compared to samples without a detected mutation
(log2 FPKM 20.20 vs 2.31, p = 0.018) (Figure S9B). Despite a
much lower rate of concordant TP53 mutation, there was also a
significant association between STAG2 mutation and decreased
CDKN1A transcript expression in the tumor cohort (log2 FPKM
4.08 vs 5.18, p = 0.039) (Figure S9C) and a trend towards
increased TP53 expression (log2 FPKM 5.51 vs. 5.38, p = 0.19). In
summary, STAG2 mutation was associated with higher TP53 and
lower CDKN1A expression in both tumors and cell lines and
associated with more frequent missense TP53 mutations in cell
lines.
STAG2 loss and clinical outcome in EFT patientsClinical characteristics of the tissue microarray cohort were
evaluated in relation to STAG2 IHC status. The 210 evaluable
cases included 154 primary tumors, 46 recurrent/metastatic
samples, and 10 tumors with limited clinical information (Table
S8). STAG2 expression loss was more common in recurrent/
metastatic samples than primary samples, though this difference
did not reach statistical significance (21.7% vs. 12.3%, p = 0.15). In
110 primary tumor samples in which clinical outcomes data was
available, there was a trend towards a modest decrease in overall
survival in patients whose tumors had STAG2 loss (p = 0.10); this
evaluation was limited, however, by small numbers of patients with
STAG2 negative tumors in the analysis (Figure S10). Clinical
information from the sequencing cohort was also analyzed, though
survival information was not available. We found no significant
differences in age, gender, stage, or primary tumor site (extremity
vs. non-extremity) between STAG2 mutated and wild-type
samples, though numbers were small in these comparisons (Table
S9).
Discussion
To our knowledge, this is the first and largest report to utilize
next-generation sequencing technology to characterize the geno-
mic landscape of Ewing sarcoma family of tumors and evaluate for
recurrent mutations. We find a very low somatic mutational rate in
EFT compared to most previously reported tumor types. We
hypothesize this to be the case for multiple reasons. First, it
appears that a number of pediatric tumor subtypes tend to have
lower mutation rates than those reported in adult cancer [21,32–
34]. This may be due in part to the shorter amount of time that the
precursor cell has to accumulate passenger mutations during
normal cell division but may also represent a fundamental
difference common to pediatric cancers. For example, it is possible
that pediatric cancers may be more epigenetically driven
compared to adult cancers and therefore require a lesser
genetic-level contribution to oncogenesis. Second, the low
mutation rate of Ewing sarcoma even amongst several reported
pediatric cancer types may reflect a fundamental characteristic of
fusion-driven cancers. This is in keeping with differences noted
between fusion-positive and fusion-negative rhabdomyosarcomas
reported by our group and others [22,35].
Interestingly, we found by RNA sequencing that a significant
number (11%) of our tumor samples that were pathologically
diagnosed as Ewing sarcoma family tumors lacked a characteristic
TET-ETS fusion and appeared to be molecularly distinct from
EFT by expression profile. Within this group, we report two novel
fusions, FUS-NCATc2 and CIC-FOXO4, that are in-frame and
may be oncogenic based on available literature regarding the
function of the genes involved. NCATc2 is a non-ETS family
transcription factor that has recently been described as an
alternate fusion partner to EWSR1 in a small series of ‘‘Ewing
sarcoma-like’’ tumors [36], but has not previously been reported to
partner with the alternate TET family member FUS. CIC gene
rearrangements, particularly CIC-DUX4 fusions, have been
described in a group of aggressive undifferentiated small blue
round cell sarcomas thought to be distinct from Ewing sarcoma
[37]. FOXO4, a forkhead family transcription factor, has been
described as an uncommon fusion partner to MLL in acute
leukemias [38] and as a rare PAX-gene fusion partner in
rhabdomyosarcoma [39]. We discovered one additional fusion,
ETV6-NTRK3, which has been reported in other cancer types but
not in EFT [23–27]. Whether these tumors should be considered
as a variant of EFT or a distinct entity is debatable. Our RNA data
suggests that these alternate fusion samples, as well as the other
TET-ETS fusion negative samples, have a distinct expression
pattern from the other EFT tumors and do not match well to a
previously reported EFT expression signature [28]. Practically, the
rarity of these variants amongst an already uncommon disease will
make clinical distinction difficult.
In our survey for genetic alterations, we discovered STAG2mutations in 21.5% of Ewing sarcoma family tumor samples and
44.4% of EFT cell lines tested, the vast majority of which are
inactivating mutations. STAG2 protein detection by IHC in an
independent tumor cohort showed STAG2 loss in 14.3% of
tumors. While immunohistochemistry will identify all tumors with
homozygous deletions and truncating mutations, it will not detect
tumors harboring missense mutations, in-frame insertions or
deletions, or duplication events. This may help to explain the
small discrepancy between our sequencing and immunohisto-
chemical analyses. STAG2 mutation has previously been reported
in one Ewing sarcoma tumor and in multiple EFT cell lines [29]
and has additionally been reported as a recurrently mutated tumor
suppressor gene in other tumor types including glioblastoma,
urothelial carcinoma, and acute myeloid leukemia [29,40–44].
Mutations in TP53 and CDKN2A were found in frequencies
similar to that previously reported [10–19]. In total we found that
40% of EFT clinical tumors and 97% of EFT cell lines have
disruption of STAG2, TP53 or CDKN2A. The striking difference
in mutational frequencies between tumors and cell lines, partic-
ularly in TP53, may be a result of culture conditions and the
process of immortalization. Despite these frequency differences,
the increased molecular characterization of a large selection of
EFT cell lines evaluated in this study provides an invaluable
resource for further study.
In addition to the recurrent mutations in STAG2, TP53 and
CDKN2A, we found a high prevalence of the BRCA2 K3326X
polymorphism, seen in 7.3% of our clinical tumor samples.
Occurring in approximately 1% of the general population, this
premature stop codon has not been shown to confer an increased
The Genomic Landscape of Ewing Sarcoma
PLOS Genetics | www.plosgenetics.org 8 July 2014 | Volume 10 | Issue 7 | e1004475

risk of breast or ovarian cancer [45] and is classified as a benign
variant by the International Agency for Research on Cancer
Unclassified Genetic Variants Working Group [46]. In contrast,
groups studying lung [47], pancreatic [48], and squamous
esophageal cancers [49] have all reported a significantly increased
rate of this polymorphism in the germline DNA of patients with
these cancer types. In our cohort, as only tumor material was
evaluated for this finding, we could not distinguish whether this
was a germline or somatic change. Further study is warranted to
clarify this aspect and to confirm the association.
STAG2 encodes a subunit of cohesin, a structural protein
complex involved in chromosomal organization and so named due
to its function of creating ‘‘cohesion’’ between sister chromatids
after DNA replication. In addition to STAG2, other recurrent
alterations in subunits of this complex have been reported across a
number of cancer types [42,50,51]. Potentially, the oncologic
mechanism for cohesin mutation is disrupted chromosomal
segregation during mitosis leading to accumulation of structural
mutations and aneuploidy [29]. Though we find EFT to have a
low rate of aneuploidy overall in our comprehensively character-
ized WGS cohort, further work is indicated to clarify whether or
not a STAG2 mutation is linked to increased aneuploidy in this
tumor histology. Cohesin is also known to play a regulatory role in
transcription [52] and is essential for recombinant-based DNA
repair mechanisms [53], though it remains to be seen if and how
much each of these essential cellular processes are responsible for
the oncologic transformation resulting from cohesin deficit. In our
evaluation of the cellular impact of STAG2 in EFT, we note a
significant intersection of STAG2 mutation with alteration of the
TP53 pathway. We find a strong correlation between STAG2 loss
and overexpression of p53 in EFT cell lines. We note that this
overexpressed p53 protein very frequently contains a pathogenic
missense mutation. STAG2 mutated samples also had low RNA
expressional levels of CDKN1A (encoding p21WAF1/CIP1), a well-
established mediator of p53 tumor suppressor activity [54]. Taken
together these data suggest that transcriptional dysregulation of the
p53-p21 axis may play a role in STAG2-mediated oncogenesis, at
least in EFT cell lines. Though there was less overlap between
STAG2 mutation and TP53 mutation in the sequenced tumor
cohort, we noted the same pattern of decreased CDKN1Aexpression in STAG2 mutant samples.
We found STAG2 loss to be more common in cell lines than
tumors, more frequent in metastatic or recurrent disease than
primary tumors, and to be associated with a trend towards
modestly decreased survival. Given the significant percentage of
tumors harboring a STAG2 mutation in this cancer type, further
investigation into the oncogenic mechanism, clinical consequence,
as well as strategies for directed therapy are warranted. For
example, preclinical data suggest that cohesin deficiency may
increase sensitivity to poly(ADP–ribose) polymerase (PARP)
inhibition [55], a drug class that has also been identified by
systematic screening to be effective in Ewing sarcoma cell lines
[56], and that is undergoing clinical testing in this tumor type.
Additionally, future sequencing efforts should be extended to
evaluate for alternate routes to cohesin deficiency in EFT.
This study demonstrates that at least a subset of Ewing’s
sarcoma is not a single hit disease driven solely by a EWS-ETS
fusion gene, but rather is a genetically complex disease which
harbors additional recurrent genetic alterations that likely
contribute to the pathogenesis of EFT. Further studies will be
needed to determine if the presence of these additional genetic
aberrations will impact the sensitivity/resistance to small molecule
inhibitors of EWS-FLI1 or PARP that are currently in develop-
ment and early phase clinical trials.
Materials and Methods
Tissue processingAll specimens for sequencing were obtained from patients with
appropriate consent from the local institutional review board in
accordance with the Children’s Oncology Group and the National
Cancer Institute. Clinical samples were obtained from collabora-
tions with the Cooperative Human Tissue Network, the Children’s
Hospital of Westmead, Australia, the Children’s Oncology Group,
and the National Institutes of Health Clinical Center. Tumors were
classified as a Ewing sarcoma family tumor by a sarcoma pathologist
and the host institution using standing histological techniques. Fifty-
two tumors were from the primary disease site and had not been
exposed to previous treatment. Fifteen tumors were from recurrent/
metastatic sites and for five tumors we lacked this clinical
information. Clinical and pathological data for the sequencing
cohort are summarized in Table S9. Tumor samples were evaluated
by a pathologist for the presence of more than 70% tumor content
before DNA/RNA extraction and sequencing. DNA was extracted
from qualifying tumor samples and matched blood using either
AllPrep Mini (Qiagen) or Agencourt Genefind v2 (Beckman
Coulter) DNA extraction kits. RNA was extracted using the
RNeasy Micro Kits according to the manufacturer’s protocol
(Quiagen). Genotyping confirmed independence of these samples.
EFT cell linesAll EFT cell lines used in the study underwent short tandem
repeat (STR) profiling for independence testing and all were
confirmed to have a unique profile. This characterization is
described in detail in Table S10.
EFT tissue microarrayTissue microarrays were obtained from an independent cohort
of genetically confirmed Ewing sarcoma cases [30]. The associated
clinical information is summarized in Table S8.
Whole genome sequencingWhole genome paired-end sequencing was performed using the
Complete Genomics platform. Data analysis was accomplished
using the CGA tools package v2.0 [57], ANNOVAR v2012-05-25
[58], and Circos v0.52 [59] in build hg19. Somatic variants were
determined first by comparison to the matched normal DNA. To
remove artifacts specific to the sequencing platform, we eliminated
any somatic variants also found in normal samples [50 in-house
samples and 69 Complete Genomics samples (http://www.
completegenomics.com/public-data/69-Genomes/)]. The Somat-
ic Score (http://media.completegenomics.com/documents/
DataFileFormats+Cancer+Pipeline+2.0.pdf) is based on a Bayes-
ian model and takes account of read depth, base call quality,
mapping/alignment probabilities, and measured priors on se-
quencing error rate for both the germline and tumor variants.
Verification by Sanger sequencing was performed on all high-
confidence somatic variant calls (by default Somatic Score. = 2
10) affecting protein coding or a splice site (SNVs, substitutions,
insertions, deletions), including 55 SNVs. We determined that
more stringent somatic score cut-off was required in our cohort to
achieve adequate positive predictive value of variants calls, likely
due to the low mutation rate in our tumor type. Relative to all
high-confidence variant calls we established a sensitivity of 86.7%
and specificity of 90.7% for a Somatic Score cut-off of 3. Somatic
mutations at or above this score and all verified mutations with
lower scores were used for further analysis.
The Complete Genomics somatic copy number segmentation is
based on 2-kb windows and utilizes coverage in the matched
The Genomic Landscape of Ewing Sarcoma
PLOS Genetics | www.plosgenetics.org 9 July 2014 | Volume 10 | Issue 7 | e1004475

germline sample for normalization of the tumor sample coverage.
Lesser allele fraction (LAF) calculations are based on allele read
counts in the tumor at loci that are called heterozygous in the
matched germline sample. In addition to default filtering done by
the Complete Genomics segmentation algorithm, copy number
variants were considered high-confidence if they were either large
(. = 10 kb AND containing . = 10 heterozygous SNPs for LAF
calculation) OR highly altered (homozygous deletions and focal
amplifications . = 5 copies) OR supported by somatic junction(s)
(ex: junction detected spanning both ends of a region of LOH).
Somatic junctions were called using CGAtools and junctions were
filtered by footprints smaller than 70 bases, less than 10 discordant
mate pairs, under-represented repeats, and presence in the
baseline set of 69 Complete Genomics genomes. We additionally
filtered junctions that were present in 50 in-house germline DNA
samples that were sequenced on the same platform.
Targeted genomic sequencingGenomic sequencing was performed using a custom multiplex
PCR designed to include the entire coding sequence of the majority
of altered genes in the whole-genome sequencing discovery cohort
as well as TP53 and in total encompassing 106.3 kB of target region
(Table S11). Primers for the targeted sequencing were designed
using the Ion Ampliseq designer (Life Technologies) and sequencing
was performed on the IonTorrent PGM (Life Technologies). PGM
sequencing data was analyzed using Torrent Suite software v3.2
(Life Technologies) and ANNOVAR. Genomic sequencing was
performed to an average mean coverage of 3116and variants were
called using high-confidence thresholds and filtered to include only
those that are protein altering and unreported or rare (population
allele frequency ,0.005) in the dbSNP and 1000 genomes
databases. Mutations of interest were verified by capillary sequenc-
ing with a ,5% false positive rate. Sequence coverage data was
calculated at a position, exon and gene levels to look for structural
alterations of the recurrently mutated genes (Figure S8). Coverage
data was visualized using the Integrated Genomics Viewer.
RNA sequencingPolyA selected RNA libraries were prepared for sequencing on
the Illumina HiSeq2000 using TruSeq v3 chemistry according to
the manufacturer’s protocol (Illumina). RNA sequencing was
performed with an average yield of 18.6 Gb per sample. Raw
reads were mapped using to ENSEMBL reference (hg19) using
TopHat2.0 [60]. Fusion analysis was done using TopHat 2.0 and
DeFuse 0.6 [61]. The 3 alternated fusions described were
confirmed using RT-PCR using flanking primers and Sanger
sequencing of the resultant product.
Expression FPKM results were obtained at both gene and
transcript level using CuffLinks 2.1 [62]. The log2 FPKM
expression results from TopHat mapping were median-normalized
using in-house data from 63 normal tissue samples. Exon level
expression was calculated using the formula RPKM = (r * 109)/(f *
R), with r being the number of reads mapped to an exon, f being
the exon length, and R being the total read count of the sample.
Hierarchical clustering was performed on normalized log2 FPKM
expression values at the gene level using Euclidean distance and
Ward agglomeration method.
For variant detection, samtools (http://samtools.sourceforge.
net/) is used to count the number of reads uniquely mapped to a
position found as variant in DNA sequencing of the same sample
or a position of interest based on a mutation being present in the
TCGA (http://cancergenome.nih.gov/) or compared to the
reference genome hg19 in genes of interest. If there are reads
supporting a variant base then the total reads supporting it are
counted and variant allele frequency is calculated.
SNP arraySNP arrays were performed on the 6 tumor whole genome
sequencing cohort to confirm copy number findings. SNP array
analysis was conducted on HumanOmni2.5 or HumanOmni5
arrays (Illumina) and the data were analyzed with GenomeStudio
(Illumina) and Nexus Copy Number v7 (Biodiscovery Inc.). Copy
number state and allelic ratio was manually assessed in all areas of
copy number variation and structural variation predicted by WGS
and was concordant with WGS prediction in 33/35 (94%).
Sanger sequencing of STAG2 geneIndividual exons of STAG2 were PCR amplified from genomic
DNA using the conditions and primer pairs previously described
[29]. PCR products were purified using the Exo/SAP method
followed by a Sephadex spin column. Sequencing reactions were
performed using BigDye v3.1 (Applied Biosystems) using an M13F
primer and were analyzed on an Applied Biosystems 37306l
capillary sequencer. Sequences were analyzed using Mutation
Surveyor (SoftGenetics). Traces with putative mutations were
reamplified and sequenced from both tumor and matched normal
DNA from blood when available.
STAG2 immunohistochemistryA mouse monoclonal antibody to STAG2 from Santa Cruz
Biotechnology (clone J-12, sc-81852) was used at a dilution of
1:100. Immunostaining was performed in an automated immu-
nostainer (Leica Bond-Max) following heat-induced antigen
retrieval for 30 min in high pH epitope retrieval buffer (Bond-
Max). Primary antibody was applied for 30 min, and Bond-Max
polymer was applied for 15 min. Diaminobenzidine was used as
the chromogen, and samples were counterstained with hematox-
ylin. Samples in which both the tumor and normal cells failed to
stain for STAG2 were considered antigenically non-viable and
were excluded from the analysis.
Western blot analysisPrimary antibodies used were STAG2 clone J-12 (Santa Cruz
Biotechnology), p53 clone 7F5 (Cell Signaling), p16 (BD Pharmin-
gen #554079), p21 clone DCS60 (Cell Signaling), and a-tubulin
Ab-2 clone DM1A (Neomarkers). Protein was isolated from EFT
cell lines in RIPA buffer, resolved by SDS-PAGE, and immuno-
blotted following standard biochemical techniques.
Statistical testingFor the BRCA2 K3326X polymorphism, a two-tailed Fisher
Exact Test was used to calculate p-value for the Odds Ratio
significantly different from 1. For RNA expressional analysis, a
two-tailed student T Test assuming unequal variances was used to
calculate a p-value for difference in population means. For tissue
microarrays, the p-value for differences in frequency of STAG2
mutation in primary and recurrent/metastatic samples was
calculated using two-tailed Fischer Exact Test. P-value for
association of STAG2 expression with overall survival was
calculated using univariate analysis.
Supporting Information
Figure S1 Circos plots of remaining whole genome sequencing
cohort. Circos plot tracks represent somatic mutations, from outside
circle: mutated genes including missense (Black), indel (Red) and
nonsense (Orange); genomic location; genome copy number
The Genomic Landscape of Ewing Sarcoma
PLOS Genetics | www.plosgenetics.org 10 July 2014 | Volume 10 | Issue 7 | e1004475

alterations (Grey); lesser allele frequency (Green); LOH (dotted
track); density of heterozygous SNPs (Orange); density of homozy-
gous SNPs (Blue); Intrachromasomal (Grey) and interchromasomal
(Red) rearrangements. Tumors EWS2008 (A), EWS2009 (B),
EWS2012 (C) and EWS2020 (D) all demonstrate low numbers of
coding mutations and modest amounts of structural variation.
(PDF)
Figure S2 RNA sequencing reads highlighting novel fusions. A)
FUS-NFATc2 fusion in sample EWS102. RNA sequencing
generated 65 high-quality reads spanning this junction. The
resulting transcript is an in-frame fusion joining exon 6 of FUSand exon 9 of NFATc2. B) CIC-FOXO4 fusion in sample
NCI0165. RNA sequencing generated 355 high-quality reads
spanning this junction. The resulting transcript is an in-frame
fusion joining exon 20 of CIC and exon 2 of FOXO4. C) ETV6-
NTRK3 fusion in sample NCI0021. RNA sequencing generated
64 high-quality reads spanning this junction. The resulting
transcript is an in-frame fusion joining exon 5 of ETV6 and exon
13 of NTRK3. All three junctions were verified by RT-PCR
followed by Sanger sequencing.
(PDF)
Figure S3 Detailed expression profile of Ewing sarcoma signature
genes (top, starred) and genes correlating with EWSR1-FLI1 target
NROB1 (bottom) in normal tissues and EFT cohort demonstrating
the lack of typical expressional profile in EWSR1-fusion negative
samples (right) **Indicates gene is both part of Ewing sarcoma gene
signature and correlates with NROB1.
(PDF)
Figure S4 Exon-level RNA expression of STAG2 in Ewing
sarcoma family tumors (A) and cell lines (B) shown by median
normalized z-score. Samples with truncating mutation correlate
with low levels of expression. Cell lines 6647 and TC-4C show
distinct pattern of contiguous multi-exon expression loss consistent
with deletion of these exons. Tumor samples EWS108, EWS112,
EWS135 and NCI0198 and cell lines SK-NEP-1 and TC-138 have
low expressional levels comparable to samples with truncating
mutation despite absence of identifiable genetic alteration.
(PDF)
Figure S5 STAG2 immunohistochemistry in Ewing sarcoma
tissue microarrays. STAG2 is robustly expressed in the majority of
samples (left) but expression is completely lost in a subset of tumors
(right). In STAG2 negative samples, expression is retained within
the non-neoplastic stromal and endothelial cells, demonstrating
the somatic nature of STAG2 loss in these tumors.
(PDF)
Figure S6 Exon-level RNA expression of TP53 in Ewing sarcoma
family tumors (A) and cell lines (B) shown by median normalized z-
score. Samples with a truncating mutation show low levels of
expression. Tumor samples EWS109 and NCI0071 and cell lines
ES-6 also have low expressional levels comparable to those samples
with a truncating mutation despite absence of identifiable genetic
alteration. Cell line SK-N-MC has loss of expression of contiguous
exons, suggesting deletion affecting that region.
(PDF)
Figure S7 Exon-level RNA expression of CDKN2A in Ewing
sarcoma family tumors (A) and cell lines (B) shown by median
normalized z-score. Homozygous deletion of CDKN2A is
demonstrated by near-zero expression of this gene across all
exons. Tumor EWS125 and cell lines 6647 and CHLA-9 have
focal loss of expression of a single exon.
(PDF)
Figure S8 DNA sequencing coverage from the targeted
sequencing approach was used to detect copy number
alterations in recurrently mutated genes. A) Coverage in
CDKN2A relative to average sequencing coverage in the same
sample shows outlier samples predicted to have homozygous
deletion of the gene. In a subset of samples, copy number status
was assessed by SNP array to verify that CDKN2A was correctly
predicted as deleted (green) or wild type (red). B–D) Copy
number alterations seen in STAG2 based on normalized
sequencing coverage plotted against genomic position on the
X chromosome. B) Cell line 6647 contains a heterozygous
deletion containing the 1st–11th coding exons of STAG2. C) Cell
line TC-4C has a hemizygous deletion in the 5th–12th coding
exons of STAG2. D) Cell line TC-215 has an intragenic
duplication event as evidenced by doubling of copy number
across contiguous exons.
(PDF)
Figure S9 Box and whisker plots showing range and percentiles
of RNA expression (log2 FPKM) in subgroups determined by
STAG2 status. A) EFT cell lines with STAG2 loss have increased
TP53 expression. B–C) EFT cell lines (B) and tumors (C) with
STAG2 mutation have decreased CDKN1A expression.
(PDF)
Figure S10 Cumulative overall survival of patients with primary,
non-metastatic tumors in the TMA cohort stratified by STAG2
IHC status. This analysis demonstrates a trend towards decreased
survival in patients whose tumors have loss of STAG2 expression.
(PDF)
Table S1 Sequencing statistics for whole genome sequencing
cohort.
(XLSX)
Table S2 Overview of sequencing studies performed.
(XLSX)
Table S3 Confirmed somatic mutations in whole genome
sequencing cohort.
(XLSX)
Table S4 High confidence structural variants in whole genome
sequencing cohort.
(XLSX)
Table S5 Overview of mutational findings and fusion status in
sequencing cohort.
(XLSX)
Table S6 Summary of Western blot experiments in 36 EFT cell
lines with comparison to genomic findings.
(XLSX)
Table S7 Selected variants from RNA sequencing analysis,
including the BRCA2 K3326X polymorphism.
(XLSX)
Table S8 STAG2 expressional status in tissue microarray cohort
as determined by immunohistochemistry.
(XLSX)
Table S9 Clinical characteristics of sequencing cohort.
(XLSX)
Table S10 STR profiles of cell lines in analysis.
(XLSX)
Table S11 Primers used for targeted sequencing approach.
(XLSX)
The Genomic Landscape of Ewing Sarcoma
PLOS Genetics | www.plosgenetics.org 11 July 2014 | Volume 10 | Issue 7 | e1004475

Text S1 Clinical course and pathological description of tumors
that harbor an alternate fusion.
(DOCX)
Acknowledgments
This study utilized the high-performance computational capabilities of the
Biowulf Linux cluster at the National Institutes of Health (http://biowulf.
nih.gov).
DisclaimerThe content of this publication does not necessarily reflect the views or
policies of the Department of Health and Human Services, nor does
mention of trade names, commercial products, or organizations imply
endorsement by the U.S. government.
Author Contributions
Conceived and designed the experiments: ASB DAS JSW TW JK.
Performed the experiments: ASB DAS WC YS LH HL JG DHW JSK.
Analyzed the data: ASB DAS JW SS RP XW LC JFS AEH MM TW JK.
Contributed reagents/materials/analysis tools: JALG IM PP TT DC ALB
TW JK. Contributed to the writing of the manuscript: ASB DAS WC JFS
JSW JK.
References
1. Howlader N, Noone A, Krapcho M, Garshell J, Neyman N, et al. (2013) SEERCancer Statistics Review (1975–2010). Available: http://seer.cancer.gov/csr/
1975_2010/. Accessed 11 June 2014.
2. Barker LM, Pendergrass TW, Sanders JE, Hawkins DS (2005) Survival after
recurrence of Ewing’s sarcoma family of tumors. J Clin Oncol 23: 4354–4362.
3. Esiashvili N, Goodman M, Marcus RB, Jr. (2008) Changes in incidence andsurvival of Ewing sarcoma patients over the past 3 decades: Surveillance
Epidemiology and End Results data. J Pediatr Hematol Oncol 30: 425–430.
4. Delattre O, Zucman J, Melot T, Garau XS, Zucker JM, et al. (1994) The Ewingfamily of tumors–a subgroup of small-round-cell tumors defined by specific
chimeric transcripts. N Engl J Med 331: 294–299.
5. Turc-Carel C, Aurias A, Mugneret F, Lizard S, Sidaner I, et al. (1988)Chromosomes in Ewing’s sarcoma. I. An evaluation of 85 cases of remarkable
consistency of t(11;22)(q24;q12). Cancer Genet Cytogenet 32: 229–238.
6. Sankar S, Lessnick SL (2011) Promiscuous partnerships in Ewing’s sarcoma.
Cancer Genet 204: 351–365.
7. Armengol G, Tarkkanen M, Virolainen M, Forus A, Valle J, et al. (1997)Recurrent gains of 1q, 8 and 12 in the Ewing family of tumours by comparative
genomic hybridization. Br J Cancer 75: 1403–1409.
8. Savola S, Klami A, Tripathi A, Niini T, Serra M, et al. (2009) Combined use ofexpression and CGH arrays pinpoints novel candidate genes in Ewing sarcoma
family of tumors. BMC Cancer 9: 17.
9. Hattinger CM, Rumpler S, Strehl S, Ambros IM, Zoubek A, et al. (1999)
Prognostic impact of deletions at 1p36 and numerical aberrations in Ewing
tumors. Genes Chromosomes Cancer 24: 243–254.
10. Hamelin R, Zucman J, Melot T, Delattre O, Thomas G (1994) p53 mutations in
human tumors with chimeric EWS/FLI-1 genes. Int J Cancer 57: 336–340.
11. Kovar H, Auinger A, Jug G, Aryee D, Zoubek A, et al. (1993) Narrow spectrumof infrequent p53 mutations and absence of MDM2 amplification in Ewing
tumours. Oncogene 8: 2683–2690.
12. Kovar H, Jug G, Aryee DN, Zoubek A, Ambros P, et al. (1997) Among genesinvolved in the RB dependent cell cycle regulatory cascade, the p16 tumor
suppressor gene is frequently lost in the Ewing family of tumors. Oncogene 15:2225–2232.
13. Brownhill SC, Taylor C, Burchill SA (2007) Chromosome 9p21 gene copy
number and prognostic significance of p16 in ESFT. Br J Cancer 96: 1914–1923.
14. Huang HY, Illei PB, Zhao Z, Mazumdar M, Huvos AG, et al. (2005) Ewingsarcomas with p53 mutation or p16/p14ARF homozygous deletion: a highly
lethal subset associated with poor chemoresponse. J Clin Oncol 23: 548–558.
15. Lopez-Guerrero JA, Pellin A, Noguera R, Carda C, Llombart-Bosch A (2001)Molecular analysis of the 9p21 locus and p53 genes in Ewing family tumors. Lab
Invest 81: 803–814.
16. Wei G, Antonescu CR, de Alava E, Leung D, Huvos AG, et al. (2000)Prognostic impact of INK4A deletion in Ewing sarcoma. Cancer 89: 793–799.
17. Tsuchiya T, Sekine K, Hinohara S, Namiki T, Nobori T, et al. (2000) Analysis
of the p16INK4, p14ARF, p15, TP53, and MDM2 genes and their prognosticimplications in osteosarcoma and Ewing sarcoma. Cancer Genet Cytogenet 120:
91–98.
18. Park YK, Chi SG, Kim YW, Park HR, Unni KK (2001) P53 mutations in
Ewing’s sarcoma. Oncol Rep 8: 533–537.
19. Komuro H, Hayashi Y, Kawamura M, Hayashi K, Kaneko Y, et al. (1993)Mutations of the p53 gene are involved in Ewing’s sarcomas but not in
neuroblastomas. Cancer Res 53: 5284–5288.
20. Kan Z, Jaiswal BS, Stinson J, Janakiraman V, Bhatt D, et al. (2010) Diversesomatic mutation patterns and pathway alterations in human cancers. Nature
466: 869–873.
21. Molenaar JJ, Koster J, Zwijnenburg DA, van Sluis P, Valentijn LJ, et al. (2012)
Sequencing of neuroblastoma identifies chromothripsis and defects in neur-
itogenesis genes. Nature 483: 589–593.
22. Shern JF, Chen L, Chmielecki J, Wei JS, Patidar R, et al. (2014) Comprehensive
genomic analysis of rhabdomyosarcoma reveals a landscape of alterations
affecting a common genetic axis in fusion-positive and fusion-negative tumors.Cancer Discov 4: 216–231.
23. Knezevich SR, McFadden DE, Tao W, Lim JF, Sorensen PH (1998) A novelETV6-NTRK3 gene fusion in congenital fibrosarcoma. Nat Genet 18: 184–187.
24. Rubin BP, Chen CJ, Morgan TW, Xiao S, Grier HE, et al. (1998) Congenitalmesoblastic nephroma t(12;15) is associated with ETV6-NTRK3 gene fusion:
cytogenetic and molecular relationship to congenital (infantile) fibrosarcoma.
Am J Pathol 153: 1451–1458.
25. Tognon C, Knezevich SR, Huntsman D, Roskelley CD, Melnyk N, et al. (2002)Expression of the ETV6-NTRK3 gene fusion as a primary event in human
secretory breast carcinoma. Cancer Cell 2: 367–376.
26. Skalova A, Vanecek T, Sima R, Laco J, Weinreb I, et al. (2010) Mammary
analogue secretory carcinoma of salivary glands, containing the ETV6-NTRK3fusion gene: a hitherto undescribed salivary gland tumor entity. Am J Surg
Pathol 34: 599–608.
27. Leeman-Neill RJ, Kelly LM, Liu P, Brenner AV, Little MP, et al. (2013) ETV6-NTRK3 is a common chromosomal rearrangement in radiation-associated
thyroid cancer. Cancer 120: 799–807
28. Chen QR, Vansant G, Oades K, Pickering M, Wei JS, et al. (2007) Diagnosis of
the small round blue cell tumors using multiplex polymerase chain reaction.J Mol Diagn 9: 80–88.
29. Solomon DA, Kim T, Diaz-Martinez LA, Fair J, Elkahloun AG, et al. (2011)
Mutational inactivation of STAG2 causes aneuploidy in human cancer. Science
333: 1039–1043.
30. Lopez-Guerrero JA, Machado I, Scotlandi K, Noguera R, Pellin A, et al. (2011)Clinicopathological significance of cell cycle regulation markers in a large series
of genetically confirmed Ewing’s sarcoma family of tumors. Int J Cancer 128:1139–1150.
31. Kato M, Yano K, Matsuo F, Saito H, Katagiri T, et al. (2000) Identification ofRad51 alteration in patients with bilateral breast cancer. J Hum Genet 45: 133–
137.
32. Zhang J, Benavente CA, McEvoy J, Flores-Otero J, Ding L, et al. (2012) A novelretinoblastoma therapy from genomic and epigenetic analyses. Nature 481: 329–
334.
33. Lee RS, Stewart C, Carter SL, Ambrogio L, Cibulskis K, et al. (2012) A
remarkably simple genome underlies highly malignant pediatric rhabdoidcancers. J Clin Invest 122: 2983–2988.
34. Hasselblatt M, Isken S, Linge A, Eikmeier K, Jeibmann A, et al. (2013) High-
resolution genomic analysis suggests the absence of recurrent genomic
alterations other than SMARCB1 aberrations in atypical teratoid/rhabdoidtumors. Genes Chromosomes Cancer 52: 185–190.
35. Chen X, Stewart E, Shelat AA, Qu C, Bahrami A, et al. (2013) Targeting
oxidative stress in embryonal rhabdomyosarcoma. Cancer Cell 24: 710–724.
36. Szuhai K, Ijszenga M, de Jong D, Karseladze A, Tanke HJ, et al. (2009) The
NFATc2 gene is involved in a novel cloned translocation in a Ewing sarcomavariant that couples its function in immunology to oncology. Clin Cancer Res
15: 2259–2268.
37. Italiano A, Sung YS, Zhang L, Singer S, Maki RG, et al. (2012) High prevalence
of CIC fusion with double-homeobox (DUX4) transcription factors in EWSR1-negative undifferentiated small blue round cell sarcomas. Genes Chromosomes
Cancer 51: 207–218.
38. Borkhardt A, Repp R, Haas OA, Leis T, Harbott J, et al. (1997) Cloning andcharacterization of AFX, the gene that fuses to MLL in acute leukemias with a
t(X;11)(q13;q23). Oncogene 14: 195–202.
39. Barr FG, Qualman SJ, Macris MH, Melnyk N, Lawlor ER, et al. (2002) Genetic
heterogeneity in the alveolar rhabdomyosarcoma subset without typical genefusions. Cancer Res 62: 4704–4710.
40. Walter MJ, Shen D, Shao J, Ding L, White BS, et al. (2013) Clonal diversity of
recurrently mutated genes in myelodysplastic syndromes. Leukemia 27: 1275–
1282.
41. Solomon DA, Kim JS, Bondaruk J, Shariat SF, Wang ZF, et al. (2013) Frequenttruncating mutations of STAG2 in bladder cancer. Nat Genet 45: 1428–1430.
42. Kon A, Shih LY, Minamino M, Sanada M, Shiraishi Y, et al. (2013) Recurrent
mutations in multiple components of the cohesin complex in myeloid neoplasms.
Nat Genet 45: 1232–1237.
43. Balbas-Martinez C, Sagrera A, Carrillo-de-Santa-Pau E, Earl J, Marquez M, etal. (2013) Recurrent inactivation of STAG2 in bladder cancer is not associated
with aneuploidy. Nat Genet 45: 1464–1469.
44. Guo G, Sun X, Chen C, Wu S, Huang P, et al. (2013) Whole-genome and
whole-exome sequencing of bladder cancer identifies frequent alterations in
The Genomic Landscape of Ewing Sarcoma
PLOS Genetics | www.plosgenetics.org 12 July 2014 | Volume 10 | Issue 7 | e1004475

genes involved in sister chromatid cohesion and segregation. Nat Genet 45:
1459–1463.45. Mazoyer S, Dunning AM, Serova O, Dearden J, Puget N, et al. (1996) A
polymorphic stop codon in BRCA2. Nat Genet 14: 253–254.
46. Plon SE, Eccles DM, Easton D, Foulkes WD, Genuardi M, et al. (2008)Sequence variant classification and reporting: recommendations for improving
the interpretation of cancer susceptibility genetic test results. Hum Mutat 29:1282–1291.
47. Rudd MF, Webb EL, Matakidou A, Sellick GS, Williams RD, et al. (2006)
Variants in the GH-IGF axis confer susceptibility to lung cancer. Genome Res16: 693–701.
48. Martin ST, Matsubayashi H, Rogers CD, Philips J, Couch FJ, et al. (2005)Increased prevalence of the BRCA2 polymorphic stop codon K3326X among
individuals with familial pancreatic cancer. Oncogene 24: 3652–3656.49. Akbari MR, Malekzadeh R, Nasrollahzadeh D, Amanian D, Islami F, et al.
(2008) Germline BRCA2 mutations and the risk of esophageal squamous cell
carcinoma. Oncogene 27: 1290–1296.50. Cancer Genome Atlas Research N (2013) Genomic and epigenomic landscapes
of adult de novo acute myeloid leukemia. N Engl J Med 368: 2059–2074.51. Kim MS, An CH, Yoo NJ, Lee SH (2013) Frameshift mutations of chromosome
cohesion-related genes SGOL1 and PDS5B in gastric and colorectal cancers
with high microsatellite instability. Hum Pathol 44: 2234–2240.52. Cuadrado A, Remeseiro S, Gomez-Lopez G, Pisano DG, Losada A (2012) The
specific contributions of cohesin-SA1 to cohesion and gene expression:implications for cancer and development. Cell Cycle 11: 2233–2238.
53. Bauerschmidt C, Arrichiello C, Burdak-Rothkamm S, Woodcock M, Hill MA,et al. (2010) Cohesin promotes the repair of ionizing radiation-induced DNA
double-strand breaks in replicated chromatin. Nucleic Acids Res 38: 477–487.
54. el-Deiry WS, Tokino T, Velculescu VE, Levy DB, Parsons R, et al. (1993)
WAF1, a potential mediator of p53 tumor suppression. Cell 75: 817–825.
55. McLellan JL, O’Neil NJ, Barrett I, Ferree E, van Pel DM, et al. (2012) Synthetic
lethality of cohesins with PARPs and replication fork mediators. PLoS Genet 8:
e1002574.
56. Garnett MJ, Edelman EJ, Heidorn SJ, Greenman CD, Dastur A, et al. (2012)
Systematic identification of genomic markers of drug sensitivity in cancer cells.
Nature 483: 570–575.
57. Drmanac R, Sparks AB, Callow MJ, Halpern AL, Burns NL, et al. (2010)
Human genome sequencing using unchained base reads on self-assembling DNA
nanoarrays. Science 327: 78–81.
58. Wang K, Li M, Hakonarson H (2010) ANNOVAR: functional annotation of
genetic variants from high-throughput sequencing data. Nucleic Acids Res 38:
e164.
59. Krzywinski M, Schein J, Birol I, Connors J, Gascoyne R, et al. (2009) Circos: an
information aesthetic for comparative genomics. Genome Res 19: 1639–1645.
60. Kim D, Salzberg SL (2011) TopHat-Fusion: an algorithm for discovery of novel
fusion transcripts. Genome Biol 12: R72.
61. McPherson A, Hormozdiari F, Zayed A, Giuliany R, Ha G, et al. (2011) deFuse:
an algorithm for gene fusion discovery in tumor RNA-Seq data. PLoS Comput
Biol 7: e1001138.
62. Trapnell C, Williams BA, Pertea G, Mortazavi A, Kwan G, et al. (2010)
Transcript assembly and quantification by RNA-Seq reveals unannotated
transcripts and isoform switching during cell differentiation. Nat Biotechnol 28:
511–515.
The Genomic Landscape of Ewing Sarcoma
PLOS Genetics | www.plosgenetics.org 13 July 2014 | Volume 10 | Issue 7 | e1004475