The Genetics of Splicing in Neuroblastoma · Cancer Genetics Program, Center for Advanced...
17
The Genetics of Splicing in Neuroblastoma Justin Chen 1,2,3 , Christopher S. Hackett 2,3 , Shile Zhang 4,5 , Young K. Song 5 , Robert J.A. Bell 1,6 , Annette M. Molinaro 2,3,6,7 , David A. Quigley 6,8 , Allan Balmain 6 , Jun S. Song 7,9,10 , Joseph F. Costello 6 , W. Clay Gustafson 11 , Terry Van Dyke 12 , Pui-Yan Kwok 13,14,15 , Javed Khan 5 , and William A. Weiss 2,3,11 RESEARCH ARTICLE on July 23, 2020. © 2015 American Association for Cancer Research. cancerdiscovery.aacrjournals.org Downloaded from Published OnlineFirst January 30, 2015; DOI: 10.1158/2159-8290.CD-14-0892
Transcript of The Genetics of Splicing in Neuroblastoma · Cancer Genetics Program, Center for Advanced...

The Genetics of Splicing in Neuroblastoma Justin Chen 1,2,3 , Christopher S. Hackett 2,3 , Shile Zhang 4,5 , Young K. Song 5 , Robert J.A. Bell 1,6 , Annette M. Molinaro 2,3,6,7 , David A. Quigley 6,8 , Allan Balmain 6 , Jun S. Song 7,9,10 , Joseph F. Costello 6 , W. Clay Gustafson 11 , Terry Van Dyke 12 , Pui-Yan Kwok 13,14,15 , Javed Khan 5 , and William A. Weiss 2,3,11
RESEARCH ARTICLE
on July 23, 2020. © 2015 American Association for Cancer Research. cancerdiscovery.aacrjournals.org Downloaded from
Published OnlineFirst January 30, 2015; DOI: 10.1158/2159-8290.CD-14-0892

APRIL 2015�CANCER DISCOVERY | 381
1 Biomedical Sciences Graduate Program, University of California, San Francisco, San Francisco, California. 2 Department of Neurology, University of California, San Francisco, San Francisco, California. 3 Department of Neurosurgery, University of California, San Francisco, San Francisco, California. 4 Program in Bioinformatics, Boston University, Boston, Massachusetts. 5 Onco-genomics Section, Pediatric Oncology Branch, National Cancer Institute, Bethesda, Maryland. 6 Helen Diller Family Comprehensive Cancer Center, University of California, San Francisco, San Francisco, California. 7 Depart-ment of Epidemiology and Biostatistics, University of California, San Francisco, San Francisco, California. 8 Institute for Cancer Research, Oslo, Norway. 9 Department of Bioengineering, University of Illinois, Urbana-Champaign, Urbana, Illinois. 10 Department of Physics, University of Illi-nois, Urbana-Champaign, Urbana, Illinois. 11 Department of Pediatrics, University of California, San Francisco, San Francisco, California. 12 Mouse Cancer Genetics Program, Center for Advanced Preclinical Research, National Cancer Institute, Frederick, Maryland. 13 Institute for Human Genetics, University of California, San Francisco, San Francisco, Califor-nia. 14 Department of Dermatology, University of California, San Francisco, San Francisco, California. 15 Cardiovascular Research Institute, University of California, San Francisco, San Francisco, California.
Note: Supplementary data for this article are available at Cancer Discovery Online (http://cancerdiscovery.aacrjournals.org/).
doi: 10.1158/2159-8290.CD-14-0892
Corresponding Author: William A. Weiss, University of California, San Francisco, 1450 Third Street, HD-220, Room 277, MC 0520, San Francisco, CA 94158. Phone: 415-502-1694; Fax: 415-476-0133; E-mail: [email protected]
©2015 American Association for Cancer Research.
ABSTRACT Regulation of mRNA splicing, a critical and tightly regulated cellular function,
underlies the majority of proteomic diversity and is frequently disrupted in disease.
Using an integrative genomics approach, we combined both genomic data and exon-level transcriptome
data in two somatic tissues (cerebella and peripheral ganglia) from a transgenic mouse model of neu-
roblastoma, a tumor that arises from the peripheral neural crest. Here, we describe splicing quantita-
tive trait loci associated with differential splicing across the genome that we use to identify genes
with previously unknown functions within the splicing pathway and to defi ne de novo intronic splicing
motifs that infl uence splicing from hundreds of bases away. Our results show that these splicing motifs
represent sites for functional recurrent mutations and highlight novel candidate genes in human cancers,
including childhood neuroblastoma.
SIGNIFICANCE: Somatic mutations with predictable downstream effects are largely relegated to cod-
ing regions, which comprise less than 2% of the human genome. Using an unbiased in vivo analysis of a
mouse model of neuroblastoma, we have identifi ed intronic splicing motifs that translate into sites for
recurrent somatic mutations in human cancers. Cancer Discov; 5(4); 380–95. ©2015 AACR.
INTRODUCTION Alternative splicing of mRNA is a highly conserved process
that is subject to both genetic regulation and heritability ( 1 ).
Some of these regulatory systems act in cis within the primary
sequence of the pre-mRNA transcript, whereas others act in
trans via genetically distant factors recruited to the splice site
( 2 ). Alternative splicing may be particularly important to can-
cer, as the unique cancer environment selects for novel splice
isoforms that promote tumor growth, metastasis, or response
to treatment ( 3 ). In addition, recurrent somatic mutations in
known splicing factors, including U2AF1 ( 4 ) and SF3B1 ( 5 ),
implicate functional contributions of this pathway in cancer
and have led to interest in these factors as targets for cancer
therapy ( 6 ).
Neuroblastoma is the most common cancer of infancy
and the most common extracranial solid tumor of child-
hood. Extensive whole-genome and whole-exome studies,
including sequencing analyses of over 300 tumors, have iden-
tifi ed point mutations in genetic drivers of neuroblastoma
(e.g., MYCN , ALK , PHOX2B , ARID1A, ARID1B, and ATRX )
in only a minority of patients ( 7 ). Genome-wide association
studies of high-risk neuroblastoma, however, have identi-
fi ed a robust signal at the BARD1 locus where the risk allele
is associated with functional effects of BARD1 splicing ( 8 ).
Coupled with the identifi cation of differences in splicing
between stage I and stage IV disease in patients with neu-
roblastoma ( 9 ), alternative splicing has the potential to be a
major contributor to this disease.
We used an integrative genomics approach to survey
alternative splicing in neuroblastoma, combining both
genome and transcriptome data into a single analysis. Link-
age mapping, by identifying associations between geno-
types and phenotypes in a genetically controlled cohort,
can identify genomic regions with functional importance.
This type of approach, when adapted to high-throughput
technologies and used to query expression quantitative trait
loci (eQTL), represents a powerful tool to discover genetic
mechanisms governing gene expression ( 10 ). We applied an
extension of this concept, a splicing quantitative trait locus
(sQTL) analysis ( 11–16 ), in a defi ned backcrossed mouse
system using a genetically engineered model of neuroblas-
toma ( 17 ). By comparing two somatic neural tissues, our
sQTL analysis uncovered a complex genome-wide splicing
landscape, including the identifi cation of novel trans -acting
splicing-related genes. Coupled with available whole-
genome sequencing (WGS ) data of the parental strains, we
also identifi ed novel candidate intronic splicing motifs. We
found that these motifs serve as sites for recurrent somatic
mutations in human cancer that lead to functional changes
in alternative splicing. We also identify a strain-specifi c trip-
let splicing preference within FUBP1 that leads to upregu-
lation of MYC, with functional consequences in human
neuroblastoma.
on July 23, 2020. © 2015 American Association for Cancer Research. cancerdiscovery.aacrjournals.org Downloaded from
Published OnlineFirst January 30, 2015; DOI: 10.1158/2159-8290.CD-14-0892

382 | CANCER DISCOVERY�APRIL 2015 www.aacrjournals.org
Chen et al.RESEARCH ARTICLE
RESULTS sQTL Distribute throughout the Genome
FVB/NJ TH-MYCN transgenic mice were backcrossed to
wild-type 129/SVJ mice, and the N1 generation ( n = 102)
was profi led on Affymetrix Exon Arrays and genotyped at
349 SNP and microsatellite markers. We identifi ed 1,664
and 1,751 sQTL (defi ned here as a paired alternative splicing
event associated with a marker, as markers may have mul-
tiple associations; see Methods) in cerebellum and superior
cervical ganglia (SCG), representing brain- and peripheral
neural crest–derived tissues, respectively ( Fig. 1A and B ; 5%
false detection rate). The low density of our genotyping panel
refl ects the controlled genetic heterogeneity of our back-
crossed cohort and was not intended to identify causative
polymorphisms. Instead, the resulting genetic map allowed
us to distinguish splicing events with local cis effects from
those with distal trans effects. The majority of sQTL was
within 50 Mb of the spliced transcript, and thus defi ned to
be cis (90.3% in cerebellum and 92.5% in SCG; Supplementary
Tables S1 and S2). Of these cis -sQTL, 874 refl ected similar
splicing events in both cerebellum and SCG, whereas only
fi ve trans -sQTL (mapping at least 50 Mb away from the
spliced transcript or to a different chromosome) overlapped
between tissues ( Fig. 1C and Supplementary Table S3). The
polymorphisms of both of these types of sQTL associate with
strain-specifi c alternative splicing events, suggesting differ-
ent possible functional roles. Trans -sQTL could represent
polymorphisms within genes that infl uence the splicing path-
way, which can then affect the splicing of other transcripts
derived from a distal genomic region. Conversely, cis -sQTL
represent polymorphisms at or near the gene being spliced
that can directly alter canonical splice sites or create novel
transcriptional start sites, cryptic splice sites, and polyade-
nylation signals. These cis -sQTL polymorphisms could also
reside in functional regions where they can affect the ability
of intronic splicing enhancers (ISE), intronic splicing silenc-
ers (ISS), and their exonic counterparts, ESEs/ESSs, to recruit
accessory splicing factors to mediate alternative splicing.
Trans -sQTL Identify Genes That Infl uence Splicing Trans -eQTL have become powerful tools to identify tran-
scription factors ( 18 ) and other functional elements ( 19 ), as
these function in trans to regulate the transcription or trans-
lation of other genes. We therefore looked at putative trans -
sQTL to identify novel regulators that could affect splicing
of distant genes. If master regulators of splicing were subject
to genetic control, we would expect to fi nd a high degree
of colocalization, whereby the majority of trans -sQTL (with
alternatively spliced exons spread throughout the genome)
would associate with just a few genomic loci. Instead, we
found that trans -sQTL were scattered throughout the genome
( Fig. 2A ), with little overlap at any individual genomic locus.
We observed a maximum of eight colocalizing trans -sQTL
and only a few “hotspots,” or individual loci linked to sev-
eral splicing events (≥4; Fig. 2B ). We focused on two of these
hotspots to simplify our efforts to validate genes that infl u-
ence splicing. Specifi cally, we focused on the fi ve trans -sQTL
linked to the marker rs29347557 on chromosome 10 in SCG
and the eight trans -sQTL linked to the marker rs33477935 on
the X chromosome in cerebellum.
Candidate genes in these regions were identifi ed by exam-
ining differential transcript expression between SCG and
cerebellum ( Fig. 2B ). Given the overwhelming tissue-specifi c
nature of the trans -sQTL, we hypothesized their origin to be
from tissue-specifi c regulation of putative splicing-related
genes in these regions. The minimal overlapping 95% con-
fi dence interval for sQTL mapping to rs29347557 in SCG
encompassed the range between markers rs13480474 and
rs38621064 on chromosome 10. This region spans over
13 Mb and contains 66 known genes, of which 30 were differ-
entially expressed between cerebellum and SCG (Supplemen-
tary Table S4). Almost all of these genes had known functions.
Among these, Sf3b5 encodes a splicing factor subunit ( 20 ) and
was the only gene known to function within the splicing path-
way, supporting the idea that differentially expressed splicing
machinery would reside in these loci ( Fig. 2B ). The sQTL
mapping to rs33477935 in cerebellum possessed 95% confi -
dence intervals that minimally overlapped from rs33478059
to rs13483805 on the X chromosome. This region spans over
77 Mb and contains 489 known genes, 123 of which were
differentially expressed (Supplementary Table S5). Two of
these genes, Hnrnpa3 and Rbm10 , encode known splicing
factors (21, 22). Others, such as Rbmx , are also implicated in
the splicing pathway. We identifi ed putative candidate genes
Rbmx2 , which contains an RNA-binding motif, and Ddx26b ,
which encodes a protein containing a DEAD-box domain.
Both of these genes are relatively uncharacterized ( Fig. 2B ).
To examine the role these genes could play within the
splicing pathway and to extend these results into a human
setting, we used siRNA to knockdown DDX26B and RBMX2
in HEK293T cells (Supplementary Fig. S1A) and looked for
splicing differences in the orthologous human genes associ-
ated with the colocalized trans -sQTL, by reverse-transcription
PCR (RT-PCR). We looked specifi cally for alternative products
by eliminating amplifi cation of the canonical isoform. Clon-
ing and sequencing of RT-PCR products from fi ve of these
eight targets did not support any changes in splicing pat-
terns (i.e., Ccnb2 , Cdc123 , Fbxl13 , Ndufv2 , and Saps2 ; data not
shown), whereas C5 (orthologous to AI182371 ) and FBXW12
(orthologous to Fbxw15 ) indicated changes in splicing follow-
ing knockdown (Supplementary Table S4 and Supplemen-
tary Fig. S1B; we were unable to investigate the fi nal target
due to the lack of annotation). Although it appeared that
knockdown of DDX26B and RBMX2 both affected the RT-
PCR profi le of C5 , we examined all potential alternative prod-
ucts and discarded those arising from nonspecifi c priming.
Specifi cally in the presence of siRNA directed toward RBMX2 ,
we identifi ed a novel splice isoform of C5 lacking six internal
exons (Supplementary Fig. S1C). Similarly, a previously unde-
scribed splice isoform of FBXW12 lacking an internal exon
was expressed only when DDX26B was knocked down (Sup-
plementary Fig. S1D). These isoforms were undetected in the
presence of nontargeting control siRNA. These data support
functional roles for DDX26B and RBMX2 within the splicing
pathway. We did not identify a statistically signifi cant differ-
ence in Ddx26b or Rbmx2 expression between the parental
mouse strains (Supplementary Fig. S1E), suggesting that the
on July 23, 2020. © 2015 American Association for Cancer Research. cancerdiscovery.aacrjournals.org Downloaded from
Published OnlineFirst January 30, 2015; DOI: 10.1158/2159-8290.CD-14-0892

APRIL 2015�CANCER DISCOVERY | 383
The Genetics of Splicing in Neuroblastoma RESEARCH ARTICLE
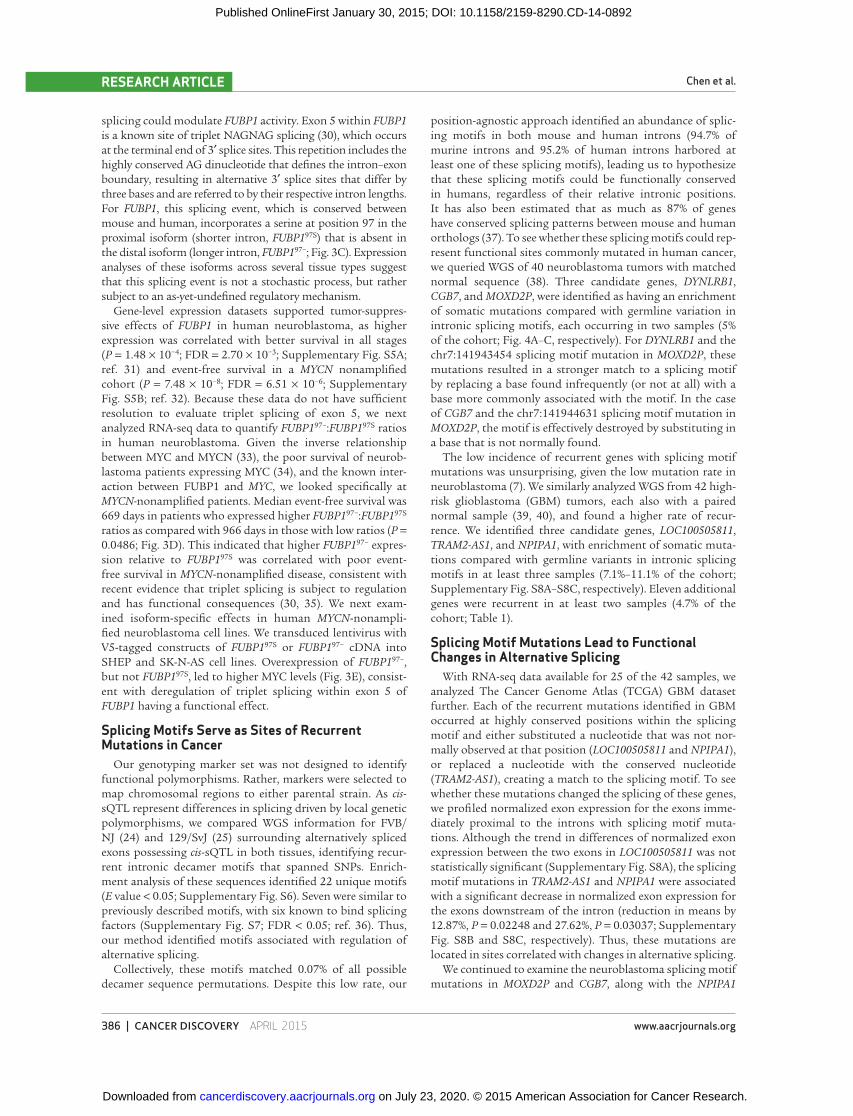
Figure 1. Genomic distribution of sQTL. sQTL are distributed throughout the genome similarly in cerebellum (CB; A) and SCG (B). The x -axis indicates the location of each SNP, and the y -axis indicates the level of signifi cance of an associated sQTL. The horizontal red line is drawn to mark an estimation of genome-wide signifi cance at an FDR < 0.05. C, cis -sQTL were more abundant than trans -sQTL, and a majority were shared between both tissues. In contrast, trans -sQTL were largely tissue specifi c.
A
B
C
1 2 3 4 5 6 7 8 9 10 11 12 13 14 15 16 17 1819 X
1 2 3 4 5 6 7 8 9 10 11 12 13 14 15 16 17 18 19 X
–lo
g10(P
)–lo
g10(P
)
Chromosome
Chromosome
010
20
30
40
50
010
20
30
40
50
60
200
400
600
800
TransCissQTL type
sQ
TL
(n
)
874
746
628
157126
5
Tissue
CB unique
SCG unique
Shared
on July 23, 2020. © 2015 American Association for Cancer Research. cancerdiscovery.aacrjournals.org Downloaded from
Published OnlineFirst January 30, 2015; DOI: 10.1158/2159-8290.CD-14-0892

384 | CANCER DISCOVERY�APRIL 2015 www.aacrjournals.org
Chen et al.RESEARCH ARTICLE
Figure 2. Trans -sQTL in the cerebellum (CB) and SCG. A, Circos plot of 162 cerebellum and 131 SCG trans -sQTL identifi ed at an FDR < 0.05. Mouse chromosomes are plotted on the outer ring, with locations of SNPs with sQTL indicated in black on the fi rst inner ring. Locations of spliced exons are identifi ed in blue on the second inner ring. Each trans -sQTL (paired association between SNP and alternatively spliced exon) is depicted by a line that links the exon and the SNP in SCG (purple), and cerebellum (green), with sQTL shared between both tissues drawn in black. The histogram outside of the chromosomes indicates the number of sQTL (on a scale of 1–8) that colocalize at any given genomic locus. B, Circos plot of sQTL hotspots, where four or more colocalized. An additional data track between the chromosome ideograms and SNP loci indicates differentially expressed genes at the transcript level (purple = higher expression in SCG; green = higher expression in cerebellum). Five SCG-specifi c trans -sQTL mapped to rs29347557 on chromo-some 10. This region included differential expression of Sf3b5 , encoding a splicing factor subunit. Eight cerebellum-specifi c trans -sQTL mapped to rs33477935 on the X chromosome. Shown are the locations of the candidate genes that are differentially expressed at this locus.
A
B
1
2
3
4
5
6
7
89
10
11
12
13
14
15
16
17
18
19
X 8
1
CBSCG
SNPSpliced
exon
1516
17
18
19
X
1
2
3
45
6
7
8
9
10
11
12
13
148
1
Chr
10
Sf3b5
Chr X
Hnrnpa3
Ddx26b
Rbm10
Rbmx
Rbmx2
on July 23, 2020. © 2015 American Association for Cancer Research. cancerdiscovery.aacrjournals.org Downloaded from
Published OnlineFirst January 30, 2015; DOI: 10.1158/2159-8290.CD-14-0892

APRIL 2015�CANCER DISCOVERY | 385
The Genetics of Splicing in Neuroblastoma RESEARCH ARTICLE
difference in their abilities to affect splicing does not lie at the
transcriptional level.
Cis -sQTL Identify Strain-Specifi c Isoforms In both cerebellum and SCG, a cis -sQTL identifi ed strain-
specifi c isoform expression of fi fth exon within the Astro actin
2 ( Astn2 ) gene. This was associated with a logarithm of odds
(LOD) score of 65.1 at rs13477756 (Supplementary Fig. S2A
and S2B), the highest observed in cerebellum. Astn2 may func-
tion in neuronal migration, and exonic deletions have been
identifi ed in patients with schizophrenia ( 23 ). RT-PCR on
cDNA derived from cerebellum in both parental strains con-
fi rmed that 129/SvJ mice specifi cally expressed a transcript
resulting from exon skipping of the fi fth exon (Supplemen-
tary Fig. S2C and S2D).
We examined WGS information for parental FVB/NJ ( 24 )
and 129/SvJ ( 25 ) at the Astn2 locus, which revealed a lack of
coverage throughout exon 5 specifi cally in 129/SvJ, leading
us to hypothesize that this alternative isoform could result
from structural variation between the two strains. Indeed,
an approximately 30-kb deletion present in 129/SvJ, but
not in FVB/NJ, colocalized with Astn2 and encompassed the
entirety of exon 5 (Supplementary Fig. S2E). After exclud-
ing the X chromosome due to the mixed source for the
129/SvJ WGS, we further identifi ed 1,324 somatic copy
number variations (SCNV) in 129/SvJ mice and 1,802 SCNVs
in FVB/NJ compared with the reference genome (Supple-
mentary Fig. S3A and S3B). Fifty-fi ve of these colocalized
with cis -sQTL–identifi ed alternative splicing events in 129/
SvJ and 58 colocalized in FVB/NJ, with 38 shared between
strains (Supplementary Table S6). Expression of the alterna-
tive isoform in 129/SvJ is thus a result of genomic structural
variation closely linked to the rs13477756 marker. Despite
this alternative mechanism, this sensitive detection of strain-
specifi c exon usage in Astn2 by a SNP marker residing over 2
Mb away from the gene itself is a clear proof-of-principle for
our sQTL method.
The highest LOD score observed in SCG (LOD = 73.9)
belonged to the FUSE-binding protein 1 ( Fubp1 ) gene
( Fig. 3A ). FUBP1 is a transcription factor that binds the Far
Upstream Element (FUSE), thereby regulating transcription
of Myc ( 26, 27 ). Given the identifi cation of cancer-associated
somatic mutations in FUBP1 ( 28 ) and the known importance
of MYC proteins in neuroblastoma ( 29 ), we further explored
Fubp1 . Although array data indicated a strain-specifi c splic-
ing difference at the fi fth exon ( Fig. 3B ), complete skipping
of this exon was not detected by RT-PCR (Supplementary
Fig. S4). We therefore explored other models through which
Figure 3. Fubp1 possesses a cis -sQTL. A, the sQTL for Fubp1 has a LOD score of 73.9 on chromosome 3 where the gene is located, indicating a cis effect. B, normalized exon expression (NEE) levels for Fubp1 exon 5 show loss of expression associated with the homozygous 129/SvJ allele. C, exon 5 of FUBP1 is a site of triplet splicing. The distal isoform leads to incorpora-tion of a serine at position 97 ( FUBP1 97S ), whereas the proxi-mal isoform lacks the serine ( FUBP1 97− ). D, MYCN -nonampli-fi ed neuroblastoma patients with high FUBP1 97− : FUBP1 97S ratios (red; n = 52) had a reduced event-free survival when compared with those with low FUBP1 97− : FUBP1 97S ratios (blue; n = 52, log-rank, P = 0.0486). There was not a signifi cant difference in survival across all patients with neuroblastoma (data not shown; n = 134). E, Western blot analysis of human neuro-blastoma cell lines transduced with GFP control, FUBP1 97S , or FUBP1 97− lentivirus tagged with V5. MYC is upregulated in both SHEP and SK-N-AS lines in the presence of high FUBP1 97− levels.
A B
C
D E
GFP
FUB
P197S (
V5)
FUB
P197– (
V5)
GFP
FUB
P197S (
V5)
FUB
P197– (
V5)
SK-N-ASSHEP
GAPDH
C-MYC
V5 (FUBP1)
0
20
40
60
1 2 3 4 5 6 7 8 9 10 11 12 13 14 15 16 17 18 19 X
LO
D
Chromosome
0.0
0.2
0.4
0.6
0.8
1.0
1.2
1.4
D3MIT147
AA AB
NE
E f
or
Fu
bp
1 E
xo
n 5
Genotype
Perc
en
t even
t-fr
ee s
urv
ival
FUBP197–:FUBP197S Low
FUBP197–:FUBP197S High
(n = 52)
(n = 52)P = 0.0486
...NAGNAG
...PPMHQQQ-RSVMTEE... (Distal)
...PPMHQQQSRSVMTEE...
100
80
60
40
20
00 1,000 2,000 3,000 4,000
(Proximal)
97S
97-
NAG
(Distal)
(Proximal)
Time (days)
on July 23, 2020. © 2015 American Association for Cancer Research. cancerdiscovery.aacrjournals.org Downloaded from
Published OnlineFirst January 30, 2015; DOI: 10.1158/2159-8290.CD-14-0892
386 | CANCER DISCOVERY�APRIL 2015 www.aacrjournals.org
Chen et al.RESEARCH ARTICLE
splicing could modulate FUBP1 activity. Exon 5 within FUBP1
is a known site of triplet NAGNAG splicing ( 30 ), which occurs
at the terminal end of 3′ splice sites. This repetition includes the
highly conserved AG dinucleotide that defi nes the intron–exon
boundary, resulting in alternative 3′ splice sites that differ by
three bases and are referred to by their respective intron lengths.
For FUBP1 , this splicing event, which is conserved between
mouse and human, incorporates a serine at position 97 in the
proximal isoform (shorter intron, FUBP1 97S ) that is absent in
the distal isoform (longer intron, FUBP1 97− ; Fig. 3C ). Expression
analyses of these isoforms across several tissue types suggest
that this splicing event is not a stochastic process, but rather
subject to an as-yet-undefi ned regulatory mechanism.
Gene-level expression datasets supported tumor-suppres-
sive effects of FUBP1 in human neuroblastoma, as higher
expression was correlated with better survival in all stages
( P = 1.48 × 10 −4 ; FDR = 2.70 × 10 −3 ; Supplementary Fig. S5A;
ref. 31 ) and event-free survival in a MYCN nonamplifi ed
cohort ( P = 7.48 × 10 −8 ; FDR = 6.51 × 10 −6 ; Supplementary
Fig. S5B; ref. 32 ). Because these data do not have suffi cient
resolution to evaluate triplet splicing of exon 5, we next
analyzed RNA-seq data to quantify FUBP1 97− : FUBP1 97S ratios
in human neuroblastoma. Given the inverse relationship
between MYC and MYCN ( 33 ), the poor survival of neurob-
lastoma patients expressing MYC ( 34 ), and the known inter-
action between FUBP1 and MYC , we looked specifi cally at
MYCN- nonamplifi ed patients. Median event-free survival was
669 days in patients who expressed higher FUBP1 97− : FUBP1 97S
ratios as compared with 966 days in those with low ratios ( P =
0.0486; Fig. 3D ). This indicated that higher FUBP1 97− expres-
sion relative to FUBP1 97S was correlated with poor event-
free survival in MYCN -nonamplifi ed disease, consistent with
recent evidence that triplet splicing is subject to regulation
and has functional consequences ( 30 , 35 ). We next exam-
ined isoform-specifi c effects in human MYCN -nonampli-
fi ed neuroblastoma cell lines. We transduced lentivirus with
V5-tagged constructs of FUBP1 97S or FUBP1 97− cDNA into
SHEP and SK-N-AS cell lines. Overexpression of FUBP1 97− ,
but not FUBP1 97S , led to higher MYC levels ( Fig. 3E ), consist-
ent with deregulation of triplet splicing within exon 5 of
FUBP1 having a functional effect.
Splicing Motifs Serve as Sites of Recurrent Mutations in Cancer
Our genotyping marker set was not designed to identify
functional polymorphisms. Rather, markers were selected to
map chromosomal regions to either parental strain. As cis -
sQTL represent differences in splicing driven by local genetic
polymorphisms, we compared WGS information for FVB/
NJ ( 24 ) and 129/SvJ ( 25 ) surrounding alternatively spliced
exons possessing cis -sQTL in both tissues, identifying recur-
rent intronic decamer motifs that spanned SNPs. Enrich-
ment analysis of these sequences identifi ed 22 unique motifs
( E value < 0.05; Supplementary Fig. S6). Seven were similar to
previously described motifs, with six known to bind splicing
factors (Supplementary Fig. S7; FDR < 0.05; ref. 36 ). Thus,
our method identifi ed motifs associated with regulation of
alternative splicing.
Collectively, these motifs matched 0.07% of all possible
decamer sequence permutations. Despite this low rate, our
position-agnostic approach identifi ed an abundance of splic-
ing motifs in both mouse and human introns (94.7% of
murine introns and 95.2% of human introns harbored at
least one of these splicing motifs), leading us to hypothesize
that these splicing motifs could be functionally conserved
in humans, regardless of their relative intronic positions.
It has also been estimated that as much as 87% of genes
have conserved splicing patterns between mouse and human
orthologs ( 37 ). To see whether these splicing motifs could rep-
resent functional sites commonly mutated in human cancer,
we queried WGS of 40 neuroblastoma tumors with matched
normal sequence ( 38 ). Three candidate genes, DYNLRB1 ,
CGB7 , and MOXD2P , were identifi ed as having an enrichment
of somatic mutations compared with germline variation in
intronic splicing motifs, each occurring in two samples (5%
of the cohort; Fig. 4A–C , respectively). For DYNLRB1 and the
chr7:141943454 splicing motif mutation in MOXD2P , these
mutations resulted in a stronger match to a splicing motif
by replacing a base found infrequently (or not at all) with a
base more commonly associated with the motif. In the case
of CGB7 and the chr7:141944631 splicing motif mutation in
MOXD2P , the motif is effectively destroyed by substituting in
a base that is not normally found.
The low incidence of recurrent genes with splicing motif
mutations was unsurprising, given the low mutation rate in
neuroblastoma ( 7 ). We similarly analyzed WGS from 42 high-
risk glioblastoma (GBM) tumors, each also with a paired
normal sample ( 39, 40 ), and found a higher rate of recur-
rence. We identifi ed three candidate genes, LOC100505811 ,
TRAM2-AS1 , and NPIPA1 , with enrichment of somatic muta-
tions compared with germline variants in intronic splicing
motifs in at least three samples (7.1%–11.1% of the cohort;
Supplementary Fig. S8A–S8C, respectively). Eleven additional
genes were recurrent in at least two samples (4.7% of the
cohort; Table 1 ).
Splicing Motif Mutations Lead to Functional Changes in Alternative Splicing
With RNA-seq data available for 25 of the 42 samples, we
analyzed The Cancer Genome Atlas (TCGA) GBM dataset
further. Each of the recurrent mutations identifi ed in GBM
occurred at highly conserved positions within the splicing
motif and either substituted a nucleotide that was not nor-
mally observed at that position ( LOC100505811 and NPIPA1 ),
or replaced a nucleotide with the conserved nucleotide
( TRAM2-AS1 ), creating a match to the splicing motif. To see
whether these mutations changed the splicing of these genes,
we profi led normalized exon expression for the exons imme-
diately proximal to the introns with splicing motif muta-
tions. Although the trend in differences of normalized exon
expression between the two exons in LOC100505811 was not
statistically signifi cant (Supplementary Fig. S8A), the splicing
motif mutations in TRAM2-AS1 and NPIPA1 were associated
with a signifi cant decrease in normalized exon expression for
the exons downstream of the intron (reduction in means by
12.87%, P = 0.02248 and 27.62%, P = 0.03037; Supplementary
Fig. S8B and S8C, respectively). Thus, these mutations are
located in sites correlated with changes in alternative splicing.
We continued to examine the neuroblastoma splicing motif
mutations in MOXD2P and CGB7 , along with the NPIPA1
on July 23, 2020. © 2015 American Association for Cancer Research. cancerdiscovery.aacrjournals.org Downloaded from
Published OnlineFirst January 30, 2015; DOI: 10.1158/2159-8290.CD-14-0892

APRIL 2015�CANCER DISCOVERY | 387
The Genetics of Splicing in Neuroblastoma RESEARCH ARTICLE
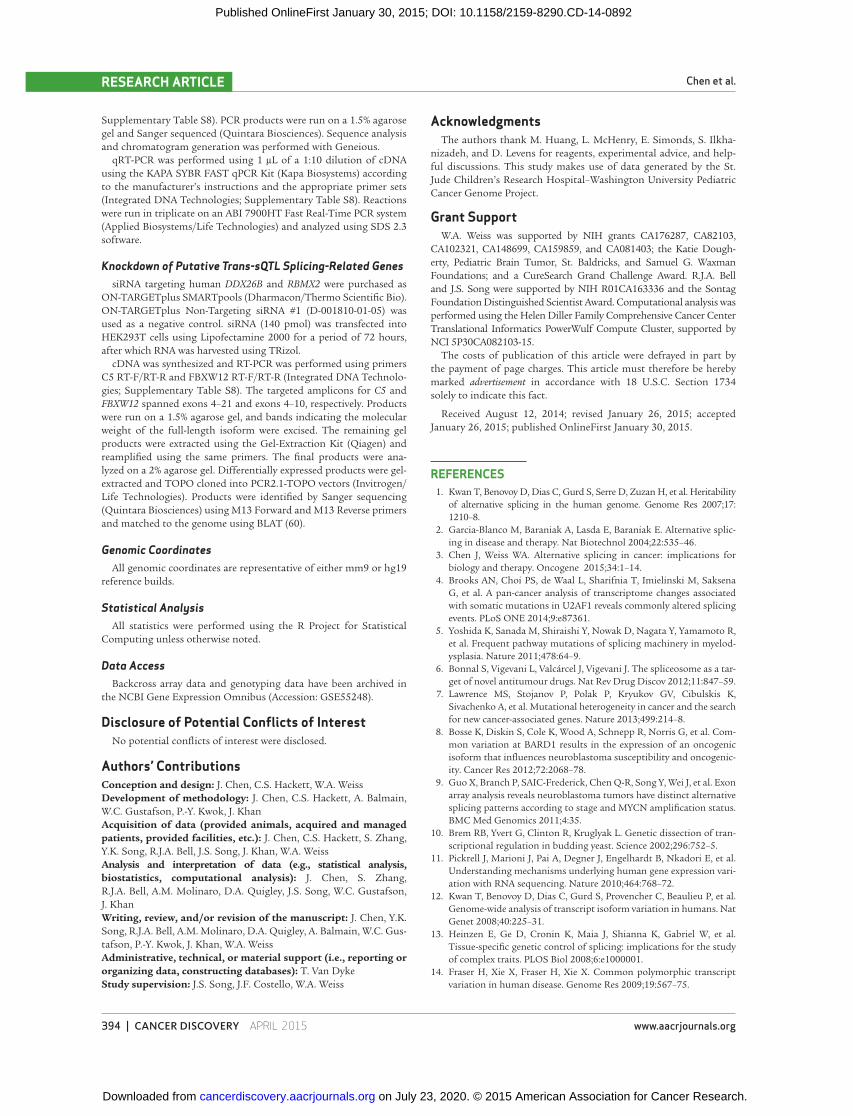
Figure 4. Recurrent somatic mutations occur in intronic splicing motifs in neuroblastoma. Analysis of 40 neuroblastoma samples reveals enrichment of somatic mutations in splicing motifs in DYNLRB1 (A), CGB7 (B), and MOXD2P (C). Germline variants (GV) and somatic mutations (SM) were identifi ed by MuTect. MAST was used to examine the sequence immediately surrounding both intronic GVs and intronic SMs for a match to any of the 22 splicing motifs (sequence-level match, P < 0.0001). The sequence logo of the splicing motif is drawn linked to the physical genomic location of the somatic mutation (black line). The total height of each nucleotide position is the information content in bits and represents the level of conservation for that position. The height of each nucleotide letter represents the ratio that they are found to occupy that position. The gene structures of known isoforms are depicted in red with arrows indicating the direction of transcription. The reference sequence (black) is given directly beneath the sequence logo with the position and nucleotide of the mutant allele shown in red. Red silhouettes indicate the number of tumor samples with that particular mutation. A black silhouette indicates the allele was found in a normal sample. A, two neuro-blastoma samples (5%) had a recurrent C>T mutation within DYNLRB1 at chr20:33,121,706. This mutation created a stronger match to a splicing motif by substi-tuting a base found infrequently to a base more com-monly associated with the motif. B, two tumor samples had a recurrent G>C mutation at chr19:49,558,080 within CGB7 ; another neuroblastoma germline sample was also found to be G/C heterozygous at the same position. The splicing motif matched here was the same as observed in the DYNLRB1 mutation, and when analyzed in the orientation of the corresponding transcript, this mutation effectively destroyed the match to the motif. C, two neuroblastoma samples were identifi ed with distinct splicing motif mutations at chr7:141,944,631 (C>T) and chr7:141,943,454 (A>C) in MOXD2P . When analyzed in the orientation of the corresponding transcript, the mutation at chr7:141,944,631 destroyed a splicing motif match, whereas the chr7:141,943,454 mutation resulted in creating a match to the splicing motif.
Chromosome 20
33.11 Mb
33.125 Mb
5’ 3’3’ 5’
DY
NL
RB
1D
YN
LR
B1
GGAGGC GAG5’ 3’ (+) Strand
Chromosome 19
49.555 Mb 49.565 Mb5’ 3’3’ 5’
CG
B7
G C GGGGGCC GGG5’ 3’ (-) Strand
Chromosome 7
141.941 Mb
141.946 Mb
5’ 3’3’ 5’
MO
XD
2P
GCT GGCT G T5’ 3’ 5’ 3’ (-) Strand
GCAG GC T T G
A
B
C
chr7:141,943,454 chr7:141,944,631
chr20:33,121,706
chr19:49,558,080
(chr16:15040359) and TRAM2-AS1 splicing motif mutations
identifi ed in GBM. We cloned these introns containing the
mutations into the pGINT splicing reporter where the introns
separated the eGFP coding sequence into two exons, and
we used quantitative RT-PCR to empirically assess canonical
splicing effi ciencies in SHEP human neuroblastoma cells after
a 16-hour transfection. We compared introns containing the
wild-type allele, the splicing motif mutation, and a control
mutation that converted the AG dinucleotide at the 3′ splice
site to a GG dinucleotide. We hypothesized that introduction
of the mutant allele in the splicing motif would alter the abil-
ity of the cells to effi ciently splice the eGFP exons, with the
control mutation eliminating canonical splicing altogether.
The MOXD2P splicing motif mutations at chr7:141943454
(A>C) and chr7:141944631 (C>T) are located 47 bp and
149 bp from the nearest intron–exon boundary, respectively.
on July 23, 2020. © 2015 American Association for Cancer Research. cancerdiscovery.aacrjournals.org Downloaded from
Published OnlineFirst January 30, 2015; DOI: 10.1158/2159-8290.CD-14-0892

388 | CANCER DISCOVERY�APRIL 2015 www.aacrjournals.org
Chen et al.RESEARCH ARTICLE
Table 1. Recurrent genes with enriched splicing motif mutations
Gene name GBM splicing motif GVs GBM splicing motif SMs
Neuroblastoma splicing
motif GVs
Neuroblastoma splicing
motif SMs
MOXD2P 0 0 0 1-chr7:141944631 C>T
1-chr7:141943454 A>C
CGB7 0 0 1-chr19:49558080 G/C 2-chr19:49558080 G>C
DYNLRB1 1-chr20:33104296 C/G 2-chr20:33121706 C>T 0 2-chr20:33121706 C>T
NPIPA1 1-chr16:15040359 G/A 4-chr16:15040359 G>A 0 1-chr16:15040359 G>A
1-chr16:15031765 G>C
LOC100505811 0 3 chr5:117618623 C>T 0 0
TRAM2-AS1 0 3 chr6:52445058 T>G 0 0
AIMP1 0 2-chr4:107260426 G>T 0 1- chr4:107260426 G>T
PRDM12 0 2-chr9:133545135 G>A 0 0
TIGD7 0 2-chr16:3353982 A>G 0 0
FBXO45 0 2-chr3:196310237 C>T 0 0
SLC4A1 0 2-chr17:42342896 C>A 0 0
ARHGAP29 1-chr1:94677742 G/C 2-chr1:94678897 G>A 0 0
LOC100128006 1-chr17:12681207 G/A 1-chr17:12679656 T>G 0 0
1-chr17:12673734 C>T
LOC440896 1-chr9:69180408 G/A 1-chr9:69179798 T>C 0 0
1-chr9:69180519 C>G
STXBP5 1-chr6:147648825 G/C 2-chr6:147693778 T>C 0 0
TNNI2 1-chr11:1860346 T/G 1-chr11:1860346 T>G 0 0
1-chr11:1862029 G>A
NOTE: Enrichment was identifi ed by taking the ratio of samples with somatic mutations (SM) within splicing motifs to samples with
germline variants (GV) within splicing motifs.
These mutant alleles led to 3- and 2-fold increases in splicing
effi ciency, respectively, when compared with the wild-type
alleles ( P = 0.0317 and P = 0.0015; Fig. 5A and B ). The CGB7
splicing motif mutation at chr19:49558080 (G>C), however,
did not lead to a statistically signifi cant change in splicing
effi ciency, despite residing only 18 bp away from the nearest
intron–exon boundary ( Fig. 5C ).
The G>A mutation at chr16:15040359 within NPIPA1
resides 520 bp away from the nearest intron–exon bound-
ary in an intron approximately 3 kb in total length. This
mutation led to a 14% increase of canonical splicing effi -
ciency when compared with the wild-type allele ( P = 0.0478;
Fig. 5D ). Similarly, the T>G mutation at chr6:52445058
within TRAM2-AS1 is located 650 bp away from the nearest
intron–exon boundary in a 3.3-kb intron. The mutant allele
led to a decrease in splicing effi ciency, resulting in 56% of the
splicing effi ciency of wild-type allele ( P = 0.0375; Fig. 5E ). All
splicing reporters with a splice-site mutation had undetect-
able eGFP expression. These results confi rm that splicing
motifs, even when located beyond immediate exon–intron
boundaries, can function to infl uence alternative splicing.
It should be noted that enhancement or reduction in splic-
ing effi ciency was not associated directionally with either
gain-of-function or loss-of-function mutations; this can be
attributed to the creation of a match to a splicing motif that
could increase the affi nity for either splicing silencers or splic-
ing enhancers. Similarly, a mutation that destroys a match to
a splicing motif could decrease the affi nity for either silencers
or enhancers, leading to unpredictable splicing effects.
Recurrent Splicing Motif Mutations Identify Novel Genes of Interest in Neuroblastoma
Given the genome-wide somatic mutation rates in these
WGS cohorts (2.685/Mb and 6.082/Mb for neuroblastoma
and GBM, respectively), the nucleotide-level recurrence of
splicing motif mutations suggests a high degree of selec-
tion, whereby these altered splicing profi les contribute to
the development of disease. Three genes ( NPIPA1 , DYNLRB1 ,
and AIMP1 ) had enriched splicing motif mutations in both
neuroblastoma and GBM ( Table 1 ), but evidence establishing
their involvement in either disease is lacking, highlighting the
need for further investigation.
Although the function of nuclear pore complex interacting
protein family–member A1 (NPIPA1) is unknown, both DYN-
LRB1 and AIMP1 encode proteins implicated in the patho-
genesis of other cancers. Dynein light chain roadblock-type
I (DYNLRB1) interacts with TGFβ signaling and is mutated
in human ovarian, colorectal, and gastric cancers ( 41 ). Inter-
estingly, in ovarian cancer, novel splice isoforms have been
identifi ed, the products of which result in a reduction in
on July 23, 2020. © 2015 American Association for Cancer Research. cancerdiscovery.aacrjournals.org Downloaded from
Published OnlineFirst January 30, 2015; DOI: 10.1158/2159-8290.CD-14-0892

APRIL 2015�CANCER DISCOVERY | 389
The Genetics of Splicing in Neuroblastoma RESEARCH ARTICLE
Figure 5. Recurrent somatic mutations in intronic splicing motifs affect splicing effi ciency. A, the mutant splicing motif allele within MOXD2P at chr7:141943454 led to a >3-fold increase in splicing effi ciency (213.8%) compared with the wild-type allele ( P = 0.0317). B, the mutant splicing motif allele within MOXD2P at chr7:141944631 led to an increase in splicing effi -ciency (93.9%) compared with the wild-type allele ( P = 0.0015). C, no changes were detected between the mutant and wild-type splicing motif allele in the CGB7 intron. D, the mutant splicing motif allele within NPIPA1 at chr16:15040359 led to a 14% increase in splicing effi ciency compared with the wild-type allele ( P = 0.0478). E, the mutant splicing motif allele at chr6:52445058 within TRAM2-AS1 resulted in a decrease to 56% splicing effi ciency compared with the wild-type allele ( P = 0.0375). Splicing effi ciency was measured as the relative expression of the canonical eGFP transcript compared with the expression of plasmid Neomycin resistance marker. Shown are representative means from at least three inde-pendent experiments. Error bars represent SEM. N.D., not detected. Signifi cance was assessed by the Student t test.
NPIPA1 intron
N.D.
A
C D
E
MOXD2P intron
Wild
-type
Splicing
mot
if
mut
ant
Splice-
site
mut
ant
Wild
-type
Splicing
mot
if
mut
ant
Splice-
site
mut
ant
Wild
-type
Splicing
mot
if
mut
ant
Splice-
site
mut
ant
N.D.Sp
licin
g e
ffic
ien
cy
0 0.0
0.5
1.0
1.5
2.0
2.5
1
2
3
4
Sp
lic
ing
eff
icie
ncy
0.0
0.5
1.0
1.5
Wild
-type
Splicing
mot
if
mut
ant
Splice-
site
mut
ant
Sp
licin
g e
ffic
ien
cy
0.0
0.5
1.0
1.5
Wild
-type
Splicing
mot
if
mut
ant
Splice-
site
mut
ant
Sp
licin
g e
ffic
ien
cy
0.0
0.5
1.0
1.5
(chr7:141,943,310–141,943,501)B MOXD2P intron
N.D.Sp
licin
g e
ffic
ien
cy
(chr7:141,943,964–141,944,779)
CGB7 intron
N.D.
(chr19:49,557,863–49,558,097)
TRAM2-AS1 intron
N.D.
(chr6:52,444,408–52,447,660)
(chr16:15,039,839–15,042,786)
*
*
***
TGFβ signaling ( 42 ). Functional studies also implicate a role
for DYNLRB1 in cell migration. Aminoacyl tRNA synthetase
complex-interacting multifunctional protein 1 (AIMP1) is an
intracellular protein that is subject to proteolytic cleavage
when present at the cell surface. Upon cleavage, the released
22-kDa peptide induces apoptosis, antagonizes angiogenesis,
and can stimulate an infl ammatory response in the tumor
microenvironment. In contrast, at high intracellular concen-
trations, AIMP1 induces cell migration ( 43 ).
Although we can examine the genomic effects of these
mutations with regard to splicing motifs, we cannot categori-
cally defi ne these as gain-of-function or loss-of-function at the
gene or protein level. As the results from our splicing reporter
assays suggest, both the creation and destruction of splicing
motifs could facilitate and impair splicing, depending on
the binding of splicing enhancers or splicing silencers. The
introns containing the splicing motif mutations in DYNLRB1
and AIMP1 spanned over 8 kb and 10 kb, respectively, making
them unamenable to in vitro splicing reporter assays. In addi-
tion, any specifi c effects on splicing are not necessarily pre-
dictive of downstream gene function, as alternatively spliced
variants could have no function or are immediately degraded
by nonsense-mediated decay (possibly leading to no effect or
haploinsuffi ciency), act as a dominant negative, or even show
constitutive activity.
To investigate the relevance of these genes in neuroblas-
toma, we examined gene expression and survival across two
publicly available neuroblastoma datasets containing either
87 untreated primary neuroblastoma tumors across all stages
( 31 ) or 102 untreated MYCN -nonamplifi ed primary neurob-
lastoma tumors ( 32 ). Across both datasets, higher DYNLRB1
expression correlated with better overall survival and
on July 23, 2020. © 2015 American Association for Cancer Research. cancerdiscovery.aacrjournals.org Downloaded from
Published OnlineFirst January 30, 2015; DOI: 10.1158/2159-8290.CD-14-0892

390 | CANCER DISCOVERY�APRIL 2015 www.aacrjournals.org
Chen et al.RESEARCH ARTICLE
event-free survival ( P = 8.40 × 10 −3 , FDR = 9.97 × 10 −3 , and P =
4.49 × 10 −5 , FDR = 6.83 × 10 −4 , respectively; Fig. 6A and B ),
suggesting a tumor-suppressive effect, whereas higher AIMP1
expression correlated with worse overall survival and event-
free survival ( P = 5.62 × 10 −4 , FDR = 0.0157, and P = 3.16 ×
10 −4 , FDR = 2.49 × 10 −3 , respectively; Fig. 6C and D ), indi-
cating an oncogenic effect. Higher NPIPA1 expression was
associated with better event-free survival in neuroblastoma as
well, statistically signifi cant only in the MYCN -nonamplifi ed
dataset ( P = 2.10 × 10 −3 , FDR = 3.49 × 10 −3 , Fig. 6E ; P = N.S.,
Fig. 6F ). These data suggest that splicing motif mutations
undergo selection in genes with clinical relevance and can be
useful to identify novel targets in disease.
DISCUSSION
In this study, we leveraged a mouse genetic system to decode
and map genetic regulation of splicing. We identifi ed over
2,500 putative sQTL, consistent with alternative splicing being
subject to a greater degree of genetic control ( 16 ) than indi-
cated by the earliest studies (<400 sQTL; refs. 11–14 ). Further-
more, by using the TH-MYCN neuroblastoma mouse model,
we were able to examine splicing in somatic tissue during the
course of neuroblastoma development and oncogenic overex-
pression. Although several splicing factors are known direct
targets of MYC, we have observed no changes in transgene
expression between the parental strains, suggesting genetic
Figure 6. DYNLRB1 , AIMP1 , and NPIPA1 expression correlate with survival in neuroblastoma. Kaplan–Meier analysis of two datasets, one contain-ing all stages of neuroblastoma and the other containing only MYCN -nonamplifi ed neuroblastoma, reveals that low expression of DYNLRB1 correlates with poor overall and event-free survival compared with high expression (A and B; P = 8.40 × 10 −3 and P = 4.49 × 10 −3 ). High AIMP1 expression correlates with poor overall and event-free survival compared with low expression in both datasets (C and D; P = 5.62 × 10 −4 and P = 3.16 × 10 −4 ). Low expression of NPIPA1 correlates with poor event-free survival compared with high expression, but is only signifi cant in the MYCN -nonamplifi ed cohort (E and F; P = 2.10 × 10 −3 and P = N.S.). FDRs are given for the identifi cation of the high and low expression groups. Signifi cance was assessed by the log-rank test.
(n = 86)
(n = 16)
(n = 35)
(n = 67)
(n = 76)
(n = 12)
P = N.S.
(n = 34)
(n = 54)
P = 8.40 × 10⁻³; FDR = 9.97 × 10⁻³
P = 2.10 × 10⁻³; FDR = 3.49 × 10⁻³
P = 5.62 × 10⁻⁴; FDR = 0.0157
DYNLRB1 (high)
DYNLRB1 (low)
00 50 100 150 200 250
20
40
60
80
100DYNLRB1 (high)
DYNLRB1 (low)
AIMP1 (high)
AIMP1 (low)
NPIPA1 (high)
NPIPA1 (low)
NPIPA1 (high)
NPIPA1 (low)
AIMP1 (high)
AIMP1 (low)
(n = 57)
(n = 31)
A B
C D
E F
Perc
en
t o
vera
ll s
urv
ival
P = 4.49 × 10⁻³; FDR = 6.83 × 10⁻⁴
P = 3.16 × 10⁻⁴; FDR = 2.49 × 10⁻³
(n = 23)
(n = 79)
DYNLRB1: All stages DYNLRB1: MYCN-nonamplified
AIMP1: MYCN-nonamplifiedAIMP1: All stages
NPIPA1: All stagesNPIPA1: MYCN-nonamplified
Time (months)
00 50 100 150 200 250
20
40
60
80
100
00 50 100 150 200
20
40
60
80
100
Time (months)
Perc
en
t even
t-fr
ee s
urv
ival
00 50 100 150 200
20
40
60
80
100
Perc
en
t even
t-fr
ee s
urv
ival
Time (months)
00 50 100 150 200
20
40
60
80
100
00 50 100 150 250200
20
40
60
80
100
Perc
en
t o
vera
ll s
urv
ival
Time (months)
Perc
en
t o
vera
ll s
urv
ival
Time (months)
Perc
en
t even
t-fr
ee s
urv
ival
Time (months)
on July 23, 2020. © 2015 American Association for Cancer Research. cancerdiscovery.aacrjournals.org Downloaded from
Published OnlineFirst January 30, 2015; DOI: 10.1158/2159-8290.CD-14-0892

APRIL 2015�CANCER DISCOVERY | 391
The Genetics of Splicing in Neuroblastoma RESEARCH ARTICLE
differences between strains are the primary drivers of the sQTL.
As the conservation of splicing between mouse and human has
been estimated to be up to 87% ( 37 ), we looked to see whether
our results could have relevance in a human setting.
With the growing appreciation that alternative splicing can
play functional roles in cancer, splicing factors have garnered
considerable interest as potential targets for therapy ( 6 ). In
this regard, our analysis enabled us to focus on only a few
genes in each region. Although this analysis was limited by
relatively large 95% confi dence intervals stemming from the
backcrossed nature of our cohort, we were nevertheless able
to use this approach to identify critical loci harboring genes
previously not known to affect splicing. We did not fi nd a
high degree of trans -sQTL colocalization, sites that might be
indicative of splicing master regulators. This could refl ect a
rarity of such trans -sQTL overall, or might alternatively be
attributed to a limitation within our system, as polymor-
phisms in such a critical component of the splicing process
might not be tolerated in either strain. Our analysis reveals an
abundance of trans -acting genes that infl uence splicing and
act in a limited gene-to-gene scope in a highly tissue-specifi c
fashion. Although the genes we have identifi ed could act as
bona fi de splicing factors and bind directly to RNA or the
spliceosome, they could also act indirectly by affecting the
expression or activity of other splicing factors. Nevertheless,
these data suggest a greater complexity to the splicing path-
way than what has already been defi ned by mass spectrometry
experiments focused on the spliceosome ( 44 ). It should be
noted that our trans -sQTL analysis is not comprehensive; by
specifi cally examining genes within the confi dence interval
that are differentially expressed between tissues, we were not
able to identify genes with activities that are modifi ed by
posttranslational modifi cations and microRNAs that could
regulate the expression of other splicing factors.
FUBP1 has been reported to be a tumor suppressor ( 28 )
and an oncoprotein ( 45 ) with the ability to both activate
and repress MYC transcription ( 46 ). The strain-specifi c splic-
ing we observe suggests distinct functions for alternatively
spliced FUBP1 isoforms. Of the two triplet splicing prod-
ucts, FUBP1 97− led to an increase of MYC, whereas FUBP1 97S
reduced MYC levels. Our RNA-seq–based survival analysis
( Fig. 3D ) represented an interim analysis of the TARGET
program and is currently under-powered to examine the rela-
tionship between isoform expression and disease stage. These
data raise the possibility that FUBP1 mutations observed in
cancers, such as oligodendroglioma, are not strictly loss-of-
function, but may act in a dominant-negative fashion akin to
FUBP1 97− . Despite the relationship between MYC and FUBP1
and the critical importance of MYC proteins in neuroblas-
toma tumorigenesis ( 29 , 34 ), extensive genomic sequence
analysis in neuroblastoma tumors has yet to show recurrent
mutations in FUBP1 or MYC . In the absence of recurrent
mutation, our analysis reveals splicing differences in FUBP1 ,
not detectable by conventional expression analysis, which
associate with risk.
Although lacking in whole-exome sequencing analyses,
intronic mutations in key regulatory motifs are potentially
just as disruptive as mutations in coding regions. Our analy-
sis identifi ed novel splicing motifs that reside along the
length of the intron. Previous splicing analyses have focused
on exonic splicing motifs, using methods such as analyzing
evolutionary conservation or systematic evolution of ligands
by exponential enrichment (SELEX) on known and purifi ed
splicing factors. Until now, the most defi nitive analysis of
ISEs used a splicing reporter construct to test the effects of
random decamers inserted into the intron ( 47 ). Our unbiased
analysis is the fi rst of which we are aware to identify recurrent
intronic splicing motifs in vivo .
We identifi ed and established relevance for these splic-
ing motifs by analyzing WGS from two different human
tumor types, identifying novel candidate genes with func-
tional implications in the process. The TCGA WGS cohort
provided us with additional insights into the effects of these
mutations, as a portion of the samples were accompanied by
RNA-seq data. Despite this, not all samples had both tran-
scriptomic and genomic data available, limiting our analysis
of normalized exon expression for the NPIPA1 splicing motif
mutation to just three tumors. Nevertheless, four out of fi ve
in vitro splicing reporters containing these introns with splic-
ing motif mutations confi rm functional signifi cance, show-
ing that even single-nucleotide changes hundreds of bases
away from the nearest intron–exon boundary could affect
mRNA splicing. These splicing motifs may function to bind
accessory splicing factors to promote exon skipping, enhance
exon inclusion, or even drive truncated transcripts through
intron-retention or alternative polyadenylation. They may
also alter splicing by changing the transcript’s secondary
structure; without highly accurate RNA folding predictions,
this analysis remains challenging and uncertain. It is also
possible that these splicing motifs reside in noncoding RNA,
which could in turn regulate expression of splicing factors.
The recurrent somatic mutations we identifi ed in neuro-
blastoma and GBM might be easily dismissed because of
their intronic nature, but our analysis extends understanding
of the cancer genome by identifying functional ramifi cations
for these intronic sites. The somatic mutations we identify
within splicing motifs represent just one avenue whereby
cancers may benefi t from the deregulation of these gene
products. Our analysis also broadens the applicability of
these data beyond the limited individuals who possess these
specifi c mutations by identifying novel candidate tumor sup-
pressors and oncogenes in neuroblastoma.
METHODS Generation of a Heterogeneous Cohort of Backcrossed Mice
Mice were obtained from The Jackson Laboratory and were housed
and treated following the guidelines of the University of California,
San Francisco (UCSF; San Francisco, CA) Institutional Animal Care
and Use Committee (IACUC ). FVB/NJ TH-MYCN transgenic mice
were bred to wild-type 129/SvJ mice. Transgenic animals from the
resulting F1 generation were identical genetically, possessing an
allele for each gene from both parental strains. F1 mice were then
backcrossed to 129/SvJ mice to generate the N1 generation used in
this analysis. SCG and cerebellum were surgically isolated and snap-
frozen in liquid nitrogen ( n = 102).
Genotyping DNA was isolated from spleen tissue using a proteinase K lysis fol-
lowed by phenol chloroform extraction. Microsatellite marker genotyp-
ing was carried out by the Marshfi eld Clinic (Marshfi eld, WI) and the
on July 23, 2020. © 2015 American Association for Cancer Research. cancerdiscovery.aacrjournals.org Downloaded from
Published OnlineFirst January 30, 2015; DOI: 10.1158/2159-8290.CD-14-0892
392 | CANCER DISCOVERY�APRIL 2015 www.aacrjournals.org
Chen et al.RESEARCH ARTICLE
Center for Inherited Disease Research (Baltimore, MD). SNP genotyp-
ing was performed using template-directed primer extension with fl uo-
rescence polarization detection (FP-TDI, Acycloprime II; PerkinElmer)
and SNPStream 48-plex (Beckman Coulter). Markers and map posi-
tions are shown in Supplementary Table S7. The marker set had an
average spacing of 8 Mb genome-wide (excluding the high density of
markers on chromosome 10).
RNA Isolation RNA was isolated from SCG using the RNeasy kit (Qiagen). All
other RNA isolations used TRizol (Invitrogen/Life Technologies) for
phase separation before purifi cation with the RNeasy kit.
Expression Arrays One microgram of RNA was used as a starting template for
RiboMinus rRNA subtraction (Invitrogen/Life Technologies) fol-
lowed by the ST labeling protocol (Affymetrix). Labeled samples were
hybridized to Affymetrix Mouse Exon 1.0 arrays. Arrays were normal-
ized using RMA in the XPS Bioconductor package within R at both
the exon level and the transcript level using core probes. Differential
expression between tissue types at the transcript level was examined
using signifi cance analysis of microarrays (SAM; ref. 48 ).
sQTL Analysis Exon expression was normalized to gene expression by calculat-
ing normalized exon expression, a ratio of exon expression to gene
expression (both values determined using the XPS Bioconductor
package). sQTL were calculated using normalized exon expression
as a quantitative trait in eQTL software as previously described ( 49 ).
Briefl y, linkage between normalized exon expression and loci was
assessed by linear regression with genome-wide signifi cance deter-
mined using an FDR < 0.05. Because of the ability of exonic poly-
morphisms to function as ESEs or ESSs, we did not exclude exons
that harbored SNPs between the two strains. Trans -sQTL were drawn
using Circos ( 50 ). LOD scores and related confi dence intervals were
drawn and calculated using the R-QTL package within R.
Mouse WGS Analysis FVB/NJ and 129/SvJ WGS data were downloaded from the Euro-
pean Nucleotide Archive (Accession: ERP000687) and Sequence Read
Archive (Accession: SRX205921), respectively, as raw FASTQ fi les.
Reads were mapped to the reference genome (mm9) using Bowtie2
(v. 2.1.0) using the “—fast-local” preset. Genotypes were called using
the GATK Unifi ed Genotyper package (v. 2.4-9). SNPs were compared
using the VCFtools package (v. 1.10). Consensus sequences for both
strains were generated using the samtools mpileup function. Copy
number was assessed using FREEC (v. 6.3; ref. 51 ) with a 5-kb window
at 1-kb intervals and a breakpoint threshold of 0.4. Results from the
X chromosome in 129/SvJ were discarded as WGS was performed on
a mixed pool of 6 mice.
Splicing Motifs Spliced exons were identifi ed as possessing a cis -sQTL in both tissues,
and the direction of splicing in each strain was noted. 19-mer sequences
surrounding polymorphic nucleotides and their positions relative to the
spliced exon were acquired in the direction of transcription from con-
sensus FASTA sequences generated from strain-specifi c WGS. Sequences
were trimmed to exclude exonic bases, and regions where either strain
returned a poly(N) motif indicative of a lack of sequencing coverage were
discarded. Extracted sequences were binned on the basis of the direction
of the associated splicing and their origin (5′ intron or 3′ intron).
MEME ( 52 ) was used to identify recurrent motifs with a width of
at least 10 bases in these bins using a background guanine-cytosine
content of 42%. Motifs with an E value of <0.05 and derived from at
least 20 sequences were reported as signifi cant. Redundant motifs
were identifi ed as those that shared a Pearson correlation coeffi cient
> 0.60, and the representative motif was chosen with the lowest E
value. TOMTOM ( 52 ) was used to compare sets of identifi ed motifs
at an FDR < 0.05 using Pearson correlation coeffi cients and requiring
a minimum overlap of fi ve bases. Cumulative matching of splicing
motifs was determined by generating a multi-FASTA fi le consisting of
1,048,576 possible decamer permuations. Seven hundred forty-three,
or 0.07%, of these sequences matched the splicing motifs when com-
pared with this fi le using MAST ( 52 ) at a sequence P value threshold
of 0.0001. Introns containing splicing motif matches were calculated
by extracting unique RefSeq introns from the University of California,
Santa Cruz (UCSC) hg19 build ( n = 195,956) and mm9 assemblies of
FVB/NJ and 129/SvJ ( n = 184,637) created in this study. Splicing motif
matches were determined using FIMO ( 52 ) at a P value of 0.0001. The
number of unique intron matches found in FVB/NJ (174,842) and
129/SvJ (174,746) was averaged when representing the percentage of
murine introns containing at least a single splicing motif.
Analysis of Splicing Motif Mutations in Primary Neuroblastoma and GBM
Primary neuroblastoma and patient-matched normal DNA
WGS data for 40 patients from the St. Jude Children’s Hospital—
Washington University Pediatric Cancer Genome Project were down-
loaded from the European Genome–Phenome Archive (Dataset ID:
EGAD00001000135). Primary GBM and patient-matched normal
DNA WGS data for 42 patients were downloaded from the TCGA
project’s Cancer Genomics Hub ( www.cghub.ucsc.edu ; dbGAP Study
Accession number: phs000178; refs. 39, 40 ).
Single-nucleotide variants (SNV) were detected with MuTect, a
Bayesian framework for the detection of somatic mutations ( 53 ).
Somatic and germline SNVs were fi ltered according to MuTect
defaults [germline variants were kept at a LOD(N) threshold of 2.3].
SNVs for TCGA GBM samples aligned to hg18 were converted to
hg19 coordinates using the UCSC liftover tool ( 54 ). For technical rea-
sons, one GBM sample had SNV calls only from chromosomes 1–7,
and another GBM sample had SNV calls only from chromosomes
1–12. The overall somatic mutation rates were calculated by dividing
the total number of somatic mutations by the total number of “calla-
ble bases” identifi ed by MuTect. The GBM samples with missing SNV
calls were omitted from the calculation of somatic mutation rates.
Intronic sequences were extracted from the hg19 reference genome
encompassing 9 bp upstream and downstream of the identifi ed SNVs
in the 5′–3′ direction of transcription. Reference sequences in addi-
tion to sequences containing the alternative allele were analyzed for
splicing motif occurrences using MAST at a sequence P value thresh-
old of 0.0001, recording the best motif match to either the reference
or alternative sequence as determined by the lowest sequence P value.
GBM RNA-Seq Analysis Open-access level 3 RNA-Seq data for 25 samples that overlapped
with the 42 WGS GBM samples were downloaded through the
TCGA Data Portal ( 55 ). In the absence of transcript expression lev-
els, normalized exon expression was calculated by taking the ratio of
individual exon expression (RPKM) to the maximally expressed exon
within the gene. Signifi cance was determined by the Student t test.
Neuroblastoma RNA-Seq and Survival Analysis RNA-Seq was performed on samples collected for the TARGET
program (currently unpublished) and represent an interim analysis
of these data. The cohort consisted of all high-risk and stage IVS
tumors ( n = 20), and included stage III tumors ( n = 2) that had similar
tumor aggressiveness to stage IV.
Total RNA was extracted from the fresh-frozen tumor samples
by the TRizol/RNeasy kit protocol described previously ( 56 ). Whole
transcriptome libraries for Illumina HiSeq 2000 were prepared
on July 23, 2020. © 2015 American Association for Cancer Research. cancerdiscovery.aacrjournals.org Downloaded from
Published OnlineFirst January 30, 2015; DOI: 10.1158/2159-8290.CD-14-0892

APRIL 2015�CANCER DISCOVERY | 393
The Genetics of Splicing in Neuroblastoma RESEARCH ARTICLE
according to the TruSeq RNA protocol, in which poly-A mRNA is
purifi ed from total RNA at the initial step. Two indexed samples
were pooled and sequenced on an Illumina HiSeq 2000 with 100-bp
paired end. Quality of RNA and library was assessed by an Agilent
BioAnalyzer.
Hundred-base pair paired end reads were fi rst aligned to the refer-
ence human genome (hg19) using spliced read mapper Tophat 2.0.8
( 57 ). We then used Cuffl inks 2.1.1 ( 58 ) for gene abundance estima-
tion. Abundances in fragments per kilobase of exon per million frag-
ments mapped (FPKM) were calculated for each annotated RefSeq
gene. The Kaplan–Meier analysis was performed using GraphPad
Prism. High and low distal:proximal isoform ratios were determined
by a median split. Signifi cance was determined by the log-rank test.
Splicing Reporters The region of interest from NPIPA1 was PCR-amplifi ed using
AccuPrime Taq High Fidelity (Invitrogen/Life Technologies) from
genomic DNA obtained from HEK293T cells using gNPIPA1,
gTRAM2-AS1, gMOXD2P, gCGB7 Cloning-F and Cloning-R primers
(Integrated DNA Technologies; Supplementary Table S8) and TOPO-
cloned into the PCR2.1-TOPO vector (Invitrogen/Life Technologies).
The pGINT fl uorescent splicing reporter was obtained from Addgene
(Plasmid 24217) and used as a template for PCR amplifi cation of
the GFP exons using the GFPEX1-F/R and GFPEX2-F/R prim-
ers (Integrated DNA Technologies) and Phusion High-Fidelity PCR
Master Mix (Thermo Scientifi c) according to the manufacturer’s
instructions. GFP fragments containing specifi c introns were gener-
ated via PCR using the GFPEX1-F, GFPEX2-R, and the appropriate
Intron-F/R primer pair (Integrated DNA Technologies). The GFP
fragment containing the second MOXD2P intron (containing the
chr7:141944631 mutation) was generated through PCR amplifi ca-
tion of the MOXD2P-2 gBLOCK (Integrated DNA Technologies) and
GFP Exon 2, using the GFPEX1-F, GFPEX2-R, and the Phusion High-
Fidelity PCR Master Mix. The GFP inserts were cloned into the Not I
and Xho I restriction sites in the pGINT plasmid, replacing the modi-
fi ed adenovirus intron, using the Quick Ligation Kit (New England
Biolabs) according to the manufacturer’s instructions. Mutant alleles
were obtained using the QuikChange II XL Site-Directed Mutagen-
esis Kit (Stratagene/Agilent Technologies) and the appropriate SDM-
F/R primers (Integrated DNA Technologies). Plasmids were verifi ed
using Sanger sequencing (Quintara Biosciences).
One microgram of each splicing reporter was transfected into
SHEP cells with 2 μL of Lipofectamine 2000 (Invitrogen/Life Tech-
nologies) in individual wells of 24-well plates according to the
manufacturer’s instructions. RNA was harvested after 16 hours
using TRizol (Invitrogen/Life Technologies) and the RNeasy Mini
Kit (Qiagen). RNA (500 ng) was used as input for cDNA synthesis.
Gene expression on fi ve-times diluted cDNA was measured through
quantitative RT-PCR (qRT-PCR) using 5′ nuclease assays with the
GINT and NeoR qPCR primers/probes (Integrated DNA Technolo-
gies; Supplementary Table S8) and the KAPA PROBE FAST qPCR
Kit (Kapa Biosciences). Reactions were run in triplicate on an ABI
7900HT Fast Real-Time PCR system (Applied Biosystems/Life Tech-
nologies) and analyzed using SDS 2.3 software. Splicing effi ciency
was calculated using the ΔΔ C T method, comparing GFP expression
with the expression of the Neomycin resistance gene included on the
pGINT plasmid to control for plasmid copy number.
Tissue Culture All cell lines were obtained from the UCSF Cell Culture Facility but
not reauthenticated by the authors. SHEP cells were grown in RPMI-
1640 supplemented with 10% FBS. SK-N-AS and HEK293T cells were
grown in DMEM supplemented with 10% FBS, nonessential amino
acids, and sodium pyruvate. All cell lines were maintained at 37°C
with 5% CO 2 and tested for Mycoplasma contamination by PCR.
Lentiviral Transduction Human FUBP1 97− cDNA was obtained from the IMAGE consor-
tium (Accession: BC017247) and PCR-cloned into the pENTR-D/
TOPO gateway vector (Invitrogen/Life Technologies) using the FUBP1
Cloning-F and FUBP1 Cloning-R primers (Integrated DNA Technolo-
gies; Supplementary Table S8) to add the directional TOPO motif
and exclude a stop codon. This entry clone was used as a substrate
to create an FUBP1 97S entry vector using the QuikChange II XL Site-
Directed Mutagenesis Kit (Stratagene/Agilent Technologies) and Site-
Directed Mutagenesis Primers FUBP197S SDM-F/FUBP197S SDM-R
(Integrated DNA Technologies; Supplementary Table S8). Plasmid
sequences were verifi ed using Sanger sequencing (Quintara Bio-
sciences). Lentiviral constructs were made by LR recombination
(Invitrogen/Life Technologies) with the pLenti 6.3 destination vector
(Invitrogen/Life Technologies). Virus was packaged in HEK293T
cells using the ViraPower lentiviral packaging plasmid mix and Lipo-
fectamine 2000 (Invitrogen/Life Technologies) over the course of
72 hours. Viral supernatant was harvested and fi ltered through a
0.45 micron syringe fi lter and used to directly transduce neuroblas-
toma cells for 24 hours. Stably transduced cells were selected with
10 μg/mL blasticidin (Invitrogen/Life Technologies).
Neuroblastoma Expression Profi ling and Survival Analysis Survival data were obtained from two datasets on the R2: microar-
ray analysis and visualization platform ( 59 ). The Versteeg dataset
(GEO Accession ID: GSE16476; ref. 31 ) spanned all neuroblastoma
stages and included 88 samples profi led on Affymetrix U133P2
expression arrays. The Seeger dataset (GEO Accession ID: GSE3446;
ref. 32 ) included 102 primary untreated neuroblastoma tumors
without MYCN gene amplifi cation profi led on Affymetrix HG-U133A
and HG-U133B platforms. Expression data for both datasets were
calculated using the MAS 5.0 algorithm. FUBP1 , DYNLRB1 , AIMP1 ,
and NPIPA1 expression were assayed using the following probes:
214093_s_at, 217918_at, 202542_s_at, and 214870_x_at. High and
low expression groups were separated by scanning along the cohort
with a minimum size of 8. Signifi cance was assessed by the log-rank
test. The FDR was determined by the associated Q -value.
Western Blotting Cell lysate was harvested using Cell Lysis Buffer (Cell Signaling
Technology) supplemented with protease inhibitor (Roche) and 1%
SDS. Protein was quantitated with the BCA assay kit (Pierce Biotech-
nology). Equal amounts of total protein were loaded and run on 4%
to 12% SDS-polyacrylamide gels (Invitrogen/Life Technologies) and
transferred to polyvinylidene difl uoride (PVDF ) membranes using the
iBlot (Invitrogen/Life Technologies). After blocking (1 hour at room
temperature, 5% nonfat milk in TBS-T), membranes were incubated
overnight (4°C, 5% BSA in TBS-T) with V5-specifi c antibody (1:5,000;
Invitrogen/Life Technologies), GAPDH-specifi c antibody (1:10,000;
Millipore), or c-MYC-specifi c antibody (XRP, 1:1,000; Cell Signaling
Technology). Antibodies were detected with horseradish peroxidase
(HRP )–linked mouse or rabbit (Calbiochem/Millipore) secondary anti-
bodies followed by enhanced chemilluminescence (Amersham/GE).
cDNA Synthesis and RT-PCR cDNA synthesis was performed using SuperScript VILO Master-
Mix (Invitrogen/Life Technologies) according to the manufacturer’s
instructions. One microgram of total RNA was used as starting mate-
rial in the reverse transcriptase reaction.
RT-PCR to determine retention of Fubp1 exon 5 and validate
the alternative Astn2 isoform was performed using GoTaq Green
MasterMix (Promega) in 25-μL reactions according to the manufac-
turer’s instructions using 1 μL of cDNA and FUBP1-1F/FUBP1-7R
or Astn2-F/R primers, respectively (Integrated DNA Technologies;
on July 23, 2020. © 2015 American Association for Cancer Research. cancerdiscovery.aacrjournals.org Downloaded from
Published OnlineFirst January 30, 2015; DOI: 10.1158/2159-8290.CD-14-0892
394 | CANCER DISCOVERY�APRIL 2015 www.aacrjournals.org
Chen et al.RESEARCH ARTICLE
Supplementary Table S8). PCR products were run on a 1.5% agarose
gel and Sanger sequenced (Quintara Biosciences). Sequence analysis
and chromatogram generation was performed with Geneious.
qRT-PCR was performed using 1 μL of a 1:10 dilution of cDNA
using the KAPA SYBR FAST qPCR Kit (Kapa Biosystems) according
to the manufacturer’s instructions and the appropriate primer sets
(Integrated DNA Technologies; Supplementary Table S8). Reactions
were run in triplicate on an ABI 7900HT Fast Real-Time PCR system
(Applied Biosystems/Life Technologies) and analyzed using SDS 2.3
software.
Knockdown of Putative Trans-sQTL Splicing-Related Genes siRNA targeting human DDX26B and RBMX2 were purchased as
ON-TARGETplus SMARTpools (Dharmacon/Thermo Scientifi c Bio).
ON-TARGETplus Non-Targeting siRNA #1 (D-001810-01-05) was
used as a negative control. siRNA (140 pmol) was transfected into
HEK293T cells using Lipofectamine 2000 for a period of 72 hours,
after which RNA was harvested using TRizol.
cDNA was synthesized and RT-PCR was performed using primers
C5 RT-F/RT-R and FBXW12 RT-F/RT-R (Integrated DNA Technolo-
gies; Supplementary Table S8). The targeted amplicons for C5 and
FBXW12 spanned exons 4–21 and exons 4–10, respectively. Products
were run on a 1.5% agarose gel, and bands indicating the molecular
weight of the full-length isoform were excised. The remaining gel
products were extracted using the Gel-Extraction Kit (Qiagen) and
reamplifi ed using the same primers. The fi nal products were ana-
lyzed on a 2% agarose gel. Differentially expressed products were gel-
extracted and TOPO cloned into PCR2.1-TOPO vectors (Invitrogen/
Life Technologies). Products were identifi ed by Sanger sequencing
(Quintara Biosciences) using M13 Forward and M13 Reverse primers
and matched to the genome using BLAT ( 60 ).
Genomic Coordinates All genomic coordinates are representative of either mm9 or hg19
reference builds.
Statistical Analysis All statistics were performed using the R Project for Statistical
Computing unless otherwise noted.
Data Access Backcross array data and genotyping data have been archived in
the NCBI Gene Expression Omnibus (Accession: GSE55248).
Disclosure of Potential Confl icts of Interest No potential confl icts of interest were disclosed.
Authors’ Contributions Conception and design: J. Chen, C.S. Hackett, W.A. Weiss
Development of methodology: J. Chen, C.S. Hackett, A. Balmain,
W.C. Gustafson, P.-Y. Kwok, J. Khan
Acquisition of data (provided animals, acquired and managed
patients, provided facilities, etc.): J. Chen, C.S. Hackett, S. Zhang,
Y.K. Song, R.J.A. Bell, J.S. Song, J. Khan, W.A. Weiss
Analysis and interpretation of data (e.g., statistical analysis,
biostatistics, computational analysis): J. Chen, S. Zhang,
R.J.A. Bell, A.M. Molinaro, D.A. Quigley, J.S. Song, W.C. Gustafson,
J. Khan
Writing, review, and/or revision of the manuscript: J. Chen, Y.K.
Song, R.J.A. Bell, A.M. Molinaro, D.A. Quigley, A. Balmain, W.C. Gus-
tafson, P.-Y. Kwok, J. Khan, W.A. Weiss
Administrative, technical, or material support (i.e., reporting or
organizing data, constructing databases): T. Van Dyke
Study supervision: J.S. Song, J.F. Costello, W.A. Weiss
Acknowledgments The authors thank M. Huang, L. McHenry, E. Simonds, S. Ilkha-
nizadeh, and D. Levens for reagents, experimental advice, and help-
ful discussions. This study makes use of data generated by the St.
Jude Children’s Research Hospital–Washington University Pediatric
Cancer Genome Project.
Grant Support W.A. Weiss was supported by NIH grants CA176287, CA82103,
CA102321, CA148699, CA159859, and CA081403; the Katie Dough-
erty, Pediatric Brain Tumor, St. Baldricks, and Samuel G. Waxman
Foundations; and a CureSearch Grand Challenge Award. R.J.A. Bell
and J.S. Song were supported by NIH R01CA163336 and the Sontag
Foundation Distinguished Scientist Award. Computational analysis was
performed using the Helen Diller Family Comprehensive Cancer Center
Translational Informatics PowerWulf Compute Cluster , supported by
NCI 5P30CA082103-15.
The costs of publication of this article were defrayed in part by
the payment of page charges. This article must therefore be hereby
marked advertisement in accordance with 18 U.S.C. Section 1734
solely to indicate this fact.
Received August 12, 2014; revised January 26, 2015; accepted
January 26, 2015; published OnlineFirst January 30, 2015.
REFERENCES 1. Kwan T , Benovoy D , Dias C , Gurd S , Serre D , Zuzan H , et al. Heritability
of alternative splicing in the human genome . Genome Res 2007 ; 17 :
1210 – 8 .
2. Garcia-Blanco M , Baraniak A , Lasda E , Baraniak E . Alternative splic-
ing in disease and therapy . Nat Biotechnol 2004 ; 22 : 535 – 46 .
3. Chen J , Weiss WA . Alternative splicing in cancer: implications for
biology and therapy . Oncogene 2015;34:1–14 .
4. Brooks AN , Choi PS , de Waal L , Sharifnia T , Imielinski M , Saksena
G , et al. A pan-cancer analysis of transcriptome changes associated
with somatic mutations in U2AF1 reveals commonly altered splicing
events . PLoS ONE 2014 ; 9 : e87361 .
5. Yoshida K , Sanada M , Shiraishi Y , Nowak D , Nagata Y , Yamamoto R ,
et al. Frequent pathway mutations of splicing machinery in myelod-
ysplasia . Nature 2011 ; 478 : 64 – 9 .
6. Bonnal S , Vigevani L , Valcárcel J , Vigevani J . The spliceosome as a tar-
get of novel antitumour drugs . Nat Rev Drug Discov 2012 ; 11 : 847 – 59 .
7. Lawrence MS , Stojanov P , Polak P , Kryukov GV , Cibulskis K ,
Sivachenko A , et al. Mutational heterogeneity in cancer and the search
for new cancer-associated genes . Nature 2013 ; 499 : 214 – 8 .
8. Bosse K , Diskin S , Cole K , Wood A , Schnepp R , Norris G , et al. Com-
mon variation at BARD1 results in the expression of an oncogenic
isoform that infl uences neuroblastoma susceptibility and oncogenic-
ity . Cancer Res 2012 ; 72 : 2068 – 78 .
9. Guo X , Branch P , SAIC-Frederick , Chen Q-R , Song Y , Wei J , et al. Exon
array analysis reveals neuroblastoma tumors have distinct alternative
splicing patterns according to stage and MYCN amplifi cation status .
BMC Med Genomics 2011 ; 4 : 35 .
10. Brem RB , Yvert G , Clinton R , Kruglyak L . Genetic dissection of tran-
scriptional regulation in budding yeast . Science 2002 ; 296 : 752 – 5 .
11. Pickrell J , Marioni J , Pai A , Degner J , Engelhardt B , Nkadori E , et al.
Understanding mechanisms underlying human gene expression vari-
ation with RNA sequencing . Nature 2010 ; 464 : 768 – 72 .
12. Kwan T , Benovoy D , Dias C , Gurd S , Provencher C , Beaulieu P , et al.
Genome-wide analysis of transcript isoform variation in humans . Nat
Genet 2008 ; 40 : 225 – 31 .
13. Heinzen E , Ge D , Cronin K , Maia J , Shianna K , Gabriel W , et al.
Tissue-specifi c genetic control of splicing: implications for the study
of complex traits . PLOS Biol 2008 ; 6 : e1000001 .
14. Fraser H , Xie X , Fraser H , Xie X . Common polymorphic transcript
variation in human disease . Genome Res 2009;19:567–75.
on July 23, 2020. © 2015 American Association for Cancer Research. cancerdiscovery.aacrjournals.org Downloaded from
Published OnlineFirst January 30, 2015; DOI: 10.1158/2159-8290.CD-14-0892

APRIL 2015�CANCER DISCOVERY | 395
The Genetics of Splicing in Neuroblastoma RESEARCH ARTICLE
15. Montgomery S , Sammeth M , Gutierrez-Arcelus M , Lach R , Ingle
C , Nisbett J , et al. Transcriptome genetics using second generation
sequencing in a Caucasian population . Nature 2010 ; 464 : 773 – 7 .
16. Battle A , Mostafavi S , Zhu X , Potash JB , Weissman MM , McCormick C ,
et al. Characterizing the genetic basis of transcriptome diversity through
RNA-sequencing of 922 individuals . Genome Res 2014 ; 24 : 14 – 24 .
17. Weiss WA , Aldape K , Mohapatra G , Feuerstein BG , Bishop JM . Tar-
geted expression of MYCN causes neuroblastoma in transgenic mice .
EMBO J 1997 ; 16 : 2985 – 95 .
18. Small KS , Hedman AK , Grundberg E , Nica AC , Thorleifsson G , Kong A ,
et al. Identifi cation of an imprinted master trans regulator at the KLF14
locus related to multiple metabolic phenotypes . Nat Genet 2011 ; 43 : 561 – 4 .
19. Westra H-J , Peters MJ , Esko T , Yaghootkar H , Schurmann C , Ket-
tunen J , et al. Systematic identifi cation of trans eQTLs as putative
drivers of known disease associations . Nat Genet 2013 ; 45 : 1238 – 43 .
20. Will CL . Characterization of novel SF3b and 17S U2 snRNP proteins,
including a human Prp5p homologue and an SF3b DEAD-box pro-
tein . EMBO J 2002 ; 21 : 4978 – 88 .
21. Jurica MS , Licklider LJ , Gygi SR , Grigorieff N , Moore MJ . Purifi ca-
tion and characterization of native spliceosomes suitable for three-
dimensional structural analysis . RNA 2002 ; 8 : 426 – 39 .
22. Inoue A , Yamamoto N , Kimura M , Nishio K , Yamane H , Nakajima K .
RBM10 regulates alternative splicing . FEBS Lett 2014;588:942–7 .
23. Vrijenhoek T , Buizer-Voskamp J , Stelt I , Strengman E , Sabatti C , Kessel
A , et al. Recurrent CNVs disrupt three candidate genes in schizophre-
nia patients . Am J Hum Genet 2008 ; 83 : 504 – 10 .
24. Wong K , Bumpstead S , Weyden L , Reinholdt L , Wilming L , Adams D ,
et al. Sequencing and characterization of the FVB/NJ mouse genome .
Genome Biol 2012 ; 13 : R72 .
25. Wartman L , Larson D , Xiang Z , Ding L , Chen K , Lin L , et al. Sequencing
a mouse acute promyelocytic leukemia genome reveals genetic events
relevant for disease progression . J Clin Invest 2011 ;121:1445–55.
26. Duncan R , Bazar L , Michelotti G , Tomonaga T , Krutzsch H , Avigan
M , et al. A sequence-specifi c, single-strand binding protein activates
the far upstream element of c-myc and defi nes a new DNA-binding
motif . Genes Dev 1994 ; 8 : 465 – 80 .
27. Braddock DT , Louis JM , Baber JL , Levens D , Clore GM . Structure and
dynamics of KH domains from FBP bound to single-stranded DNA .
Nature 2002 ; 415 : 1 – 6 .
28. Bettegowda C , Agrawal N , Jiao Y , Sausen M , Wood LD , Hruban RH ,
et al. Mutations in CIC and FUBP1 contribute to human oligoden-
droglioma . Science 2011 ; 333 : 1453 – 5 .
29. Huang M , Weiss WA . Neuroblastoma and MYCN . Cold Spring Harb
Perspect Med 2013 ; 3 : a014415 .
30. Bradley R , Merkin J , Lambert N , Burge C , Cambridge M . Alternative
splicing of RNA triplets is often regulated and accelerates proteome
evolution . PLOS Biol 2012 ; 10 : e1001229 .
31. Molenaar JJ , Koster J , Zwijnenburg DA , Sluis P , Valentijn LJ , Ploeg
I , et al. Sequencing of neuroblastoma identifi es chromothripsis and
defects in neuritogenesis genes . Nature 2012 ; 483 : 589 – 93 .
32. Asgharzadeh S , Pique-Regi R , Sposto R , Wang H , Yang Y , Shimada H ,
et al. Prognostic signifi cance of gene expression profi les of metastatic
neuroblastomas lacking MYCN gene amplifi cation . J Natl Cancer Inst
2006 ; 98 : 1193 – 203 .
33. Breit S , Schwab M . Suppression of MYC by high expression of NMYC
in human neuroblastoma cells . J Neurosci Res 1989 ; 24 : 21 – 8 .
34. Wang LL , Suganuma R , Ikegaki N , Tang X , Naranjo A , McGrady P , et al.
Neuroblastoma of undifferentiated subtype, prognostic signifi cance of
prominent nucleolar formation, and MYC/MYCN protein expression: a
report from the Children’s Oncology Group . Cancer 2013 ; 119 : 3718 – 26 .
35. Hiller M , Huse K , Szafranski K , Jahn N , Hampe J , Schreiber S , et al.
Widespread occurrence of alternative splicing at NAGNAG acceptors
contributes to proteome plasticity . Nat Genet 2004 ; 36 : 1255 – 7 .
36. Ray D , Kazan H , Cook KB , Weirauch MT , Najafabadi HS , Li X , et al.
A compendium of RNA-binding motifs for decoding gene regulation .
Nature 2013 ; 499 : 172 – 7 .
37. Zambelli F , Pavesi G , Gissi C , Horner DS , Pesole G . Assessment of
orthologous splicing isoforms in human and mouse orthologous
genes . BMC Genomics 2010 ; 11 : 534 .
38. Cheung N-K , Zhang J , Lu C , Parker M , Bahrami A , Tickoo S , et al.
Association of age at diagnosis and genetic mutations in patients
with neuroblastoma . JAMA 2012 ; 307 : 1062 .
39. Brennan CW , Verhaak RGW , McKenna A , Campos B , Noushmehr H ,
Salama SR , et al. The somatic genomic landscape of glioblastoma .
Cell 2013 ; 155 : 462 – 77 .
40. TCGA Network TCGAR . Comprehensive genomic characterization
defi nes human glioblastoma genes and core pathways . Nature 2008 ;
455 : 1061 – 8 .
41. Tang Q , Staub CM , Gao G , Jin Q , Wang Z , Ding W , et al. A novel trans-
forming growth factor-beta receptor-interacting protein that is also a
light chain of the motor protein dynein . Mol Biol Cell 2002 ; 13 : 4484 – 96 .
42. Ding W , Tang Q , Espina V , Liotta LA , Mauger DT , Mulder KM . A trans-
forming growth factor-beta receptor-interacting protein frequently
mutated in human ovarian cancer . Cancer Res 2005 ; 65 : 6526 – 33 .
43. Schwarz MA , Thornton J , Xu H , Awasthi N , Schwarz RE . Cell
proliferation and migration are modulated by Cdk-1-phosphor-
ylated endothelial-monocyte activating polypeptide II . PLoS ONE
2012 ; 7 : e33101 .
44. Zhou Z , Licklider L , Gygi S , Reed R . Comprehensive proteomic analy-
sis of the human spliceosome . Nature 2002 ; 419 : 182 – 5 .
45. Malz M , Weber A , Singer S , Riehmer V , Bissinger M , Riener M-O ,
et al. Overexpression of far upstream element binding proteins: a
mechanism regulating proliferation and migration in liver cancer
cells . Hepatology 2009 ; 50 : 1130 – 9 .
46. Chung H-J , Liu J , Dundr M , Nie Z , Sanford S , Levens D . FBPs are
calibrated molecular tools to adjust gene expression . Mol Cell Biol
2006 ; 26 : 1 – 15 .
47. Wang Y , Ma M , Xiao X , Wang Z . Intronic splicing enhancers, cognate
splicing factors and context-dependent regulation rules . Nat Struct
Mol Biol 2012 ; 19 : 1044 – 52 .
48. Tusher G , Tibshirani R , Chu G . Signifi cance analysis of microar-
rays applied to the ionizing radiation response . Proc Natl Acad Sci
2001 ; 98 : 5116 – 21 .
49. Quigley D , To M , Pérez-Losada J , Pelorosso F , Mao J-H , Nagase H ,
et al. Genetic architecture of mouse skin infl ammation and tumour
susceptibility . Nature 2009 ; 458 : 505 – 8 .
50. Krzywinski M , Schein J , Birol I , Connors J , Gascoyne R , Horsman
D , et al. Circos: an information aesthetic for comparative genomics .
Genome Res 2009 ; 19 : 1639 – 45 .
51. Boeva V , Popova T , Bleakley K , Chiche P , Cappo J , Schleiermacher
G , et al. Control-FREEC: a tool for assessing copy number and
allelic content using next-generation sequencing data . Bioinformatics
2012 ; 28 : 423 – 5 .
52. Bailey TL , Boden M , Buske FA , Frith M , Grant CE , Clementi L , et al.
MEME SUITE: tools for motif discovery and searching . Nucleic Acids
Res 2009 ; 37 : W202 – 8 .
53. Cibulskis K , Lawrence MS , Carter SL , Sivachenko A , Jaffe D , Sougnez
C , et al. Sensitive detection of somatic point mutations in impure and
heterogeneous cancer samples . Nat Biotechnol 2013 ; 31 : 213 – 9 .
54. UCSC LiftOver Tool [Internet] . Available from : http://genome.ucsc.
edu/cgi-bin/hgLiftOver . Accessed December 8, 2014.
55. TCGA Data Portal [Internet] . Available from : https://tcga-data.nci.
nih.gov/tcga/ . Accessed December 8, 2014.
56. Wei J , Khan J . Purifi cation of total RNA from mammalian cells and
tissues . In: Bowtell D , Sambrook J , editors . DNA microarrays a Mol
clonging Man . Cold Spring Harbor, New York : Cold Spring Harbor
Laboratory Press ; 2002 . p. 110 – 9 .
57. Trapnell C , Roberts A , Goff L , Pertea G , Kim D , Kelley DR , et al. Dif-
ferential gene and transcript expression analysis of RNA-seq experi-
ments with TopHat and Cuffl inks . Nat Protoc 2012 ; 7 : 562 – 78 .
58. Trapnell C , Williams BA , Pertea G , Mortazavi A , Kwan G , van Baren
MJ , et al. Transcript assembly and quantifi cation by RNA-Seq reveals
unannotated transcripts and isoform switching during cell differen-
tiation . Nat Biotechnol 2010 ; 28 : 511 – 5 .
59. R2: microarray analysis and visualization platform [Internet] . Avail-
able from : http://r2.amc.nl . Accessed December 8, 2014.
60. UCSC BLAT [Internet] . Available from : https://genome.ucsc.edu/cgi-
bin/hgBlat . Accessed December 8, 2014.
on July 23, 2020. © 2015 American Association for Cancer Research. cancerdiscovery.aacrjournals.org Downloaded from
Published OnlineFirst January 30, 2015; DOI: 10.1158/2159-8290.CD-14-0892

2015;5:380-395. Published OnlineFirst January 30, 2015.Cancer Discovery Justin Chen, Christopher S. Hackett, Shile Zhang, et al. The Genetics of Splicing in Neuroblastoma
Updated version
10.1158/2159-8290.CD-14-0892doi:
Access the most recent version of this article at:
Material
Supplementary
http://cancerdiscovery.aacrjournals.org/content/suppl/2015/01/30/2159-8290.CD-14-0892.DC1
Access the most recent supplemental material at:
Cited articles
http://cancerdiscovery.aacrjournals.org/content/5/4/380.full#ref-list-1
This article cites 55 articles, 16 of which you can access for free at:
Citing articles
http://cancerdiscovery.aacrjournals.org/content/5/4/380.full#related-urls
This article has been cited by 4 HighWire-hosted articles. Access the articles at:
E-mail alerts related to this article or journal.Sign up to receive free email-alerts
Subscriptions
Reprints and
To order reprints of this article or to subscribe to the journal, contact the AACR Publications Department at
Permissions
Rightslink site. Click on "Request Permissions" which will take you to the Copyright Clearance Center's (CCC)
.http://cancerdiscovery.aacrjournals.org/content/5/4/380To request permission to re-use all or part of this article, use this link
on July 23, 2020. © 2015 American Association for Cancer Research. cancerdiscovery.aacrjournals.org Downloaded from
Published OnlineFirst January 30, 2015; DOI: 10.1158/2159-8290.CD-14-0892