THE FUTURE OF NUCLEAR POWER IN THE U.S. Paul L....
27
THE FUTURE OF NUCLEAR POWER IN THE U.S. Paul L. Joskow January 15, 2007
Transcript of THE FUTURE OF NUCLEAR POWER IN THE U.S. Paul L....

THE FUTURE OF NUCLEAR POWER IN THE U.S.
Paul L. Joskow
January 15, 2007

NUCLEAR POWER IN THE U.S.• U.S. has 100 GW of nuclear capacity (20% of U.S. electricity
generation --- 50% coal, 19% natural gas, 3% oil, 9% renewable)• Performance has improved dramatically over time in all dimensions• It is economical to extend the life of the existing fleet and “uprate”
some units to increase capacity (3+ GW more)• Growing interest in the U.S. in promoting investments in new nuclear
capacity but economics, waste disposal, and public acceptance are uncertain
• Changes in licensing process and efforts to resolve waste disposal issues support new investment
• 2005 Energy Act contains financial incentives (production tax credits, other subsidies) to encourage “first-movers” to build new plants
• 12 (9 subsidized+ 3) GW of nuclear capacity additions plus 3.2Gwuprates forecast between 2015 and 2030 by EIA (2007 early release)– 311 Gw total generating capacity additions forecast by 2030 (EIA 2006)– 34 Gw of new nuclear in “low construction cost” sensitivity case– 70 Gw of new nuclear in “vendor cost goals” sensitivity case
• Several companies have announced that they will start the licensing process for new plants but no firm orders have been made yet

Source: Nuclear Energy Institute

BACKGROUND CONSIDERATIONS• Need to distinguish existing fleet of plants from
investments in new plants• Economics is only one consideration for viability
of investment in new nuclear plants– Public and political acceptance– Effectiveness of new licensing process– Waste disposal policies
• CO2 policies, natural gas prices, coal prices, government subsidies and competitive/contractual/regulatory framework are important drivers of comparative economics of investments in new nuclear plants for private sector investors

Prospects for Expanding/Extending Capacity of Existing U.S. Fleet
• License renewals/extensions (as of September 1, 2006)– 44 units approved– 8 units under review– 26 letters of intent (multiple units)
• Power uprates– Additional 3.2 GW forecast by EIA
• Refurbishment:– Browns Ferry 1 on track for 2007– 1,280 MW plant
• Capacity factors:– Further improvement will be difficult

Without New Investments U.S. Nuclear Capacity Declines Quickly After 2030
Capacity With and Without License Renewal
0
20000
40000
60000
80000
100000
120000
1960
1963
1966
1969
1972
1975
1978
1981
1984
1987
1990
1993
1996
1999
2002
2005
2008
2011
2014
2017
2020
2023
2026
2029
2032
2035
2038
2041
2044
2047
2050
2053
Capa
city
(MW
)
Capacity with 100% license renewalCurrent licensed capacity
Source: Dominion Resources, 2005

WHAT IS NEEDED TO STIMULATE SIGNIFICANT NUCLEAR INVESTMENT IN
THE U.S.?• Stable regulatory, competitive and commercial
framework that will support capital intensive projects with relatively long construction expenditure cycles
• Stable and efficient nuclear plant licensing framework
• Achieve credible $1500/kW ($2002) (or $1700/kW in $2006) overnight cost including all relevant owner’s costs, 5-year construction period and >85% life-time capacity factor
• Placing a significant “price” on carbon emissions helps a lot
• Realize credible and economic nuclear waste disposal policy

CONSTRUCTION AND FINANCING COSTS
• No new nuclear plants completed in the U.S. for over 10 years
• There are few new nuclear plants under construction in the world– Mostly in less developed countries
• Recent credible construction and cost data are limited
• Competitive, regulatory and contractual environment is very uncertain and varies widely across the U.S. (and the world)
• The U.S. has not (yet) adopted policies to place a price on CO2 emissions

CONSTRUCTION COST ESTIMATES
• Construction cost estimates should include all costs, including engineering, construction management and owner’s costs (~ 20%)
• The best estimates are drawn from actual experience rather than engineering cost models
• Construction cost estimates for PC and CCGT can be verified from actual experience
• Publicly available data on recent nuclear plants completed suggest that $2,000/Kw ($2002) or $2,300/kW ($2006), including all owner’s costs, with a 5-year construction period is a good base case cost estimate
• Competitive power markets induce truthful revelation of costs and associated uncertainties– Need to convince investors not me

RECENT CONSTRUCTION COST EXPERIENCE ($2002)
Genkai 3 $2,818/kW (overnight)Genkai 4 $2,288/kW (overnight)Onagawa $2,409/kW (overnight)KK6 $2,020/kW (overnight)KK7 $1,790/kW (overnight)Yonggwang 5&6 $1,800/kW (overnight)
Browns Ferry RESTART $1,280/kW (overnight estimate)
Finland EPR (AREVA-Seimens contract only)$2,300/kW (nominal estimate 2005)(before cost of delays)
Bruce RESTART $1,425/kW (nominal estimate 2005)
Flammanville 3 (EDF) $2,600/Kw (nominal estimate 2006)
Source: MIT and Trade Press

FINLAND• Teollisuuden Voima Oy (TVO) is building
Olkiluoto 3– EUR 3 billion fixed-price contract with Areva and Siemens (~$2300/kw)
[unspecified cost overruns due to delays and cost increases to date but TVO is insulated from them]
– 1600 MWe– Permit application in 2000, construction started September 2005 and
commercial operation now forecast for start 2011 [2 delays announced]
• Ownership and Long Term Contract Shares
0.10%Graninge Suomi Oy (energy co. in forestry/energy group)6.50%Etala-Pohjanmaan Voima Oy (distr cos in NW coast of Finland)8.10%Oy Mankala Ab (city of Helsinki)
25.00%Fortum Power & Heat (government controlled power corp)25.18%others (forestry products via PVO energy company)
9.39%Stora Enso Oyj (forestry products via PVO energy company)25.63%UPM-Kymmene (forestry products via PVO energy company)

COMPARATIVE BASE LOAD COSTS(MIT REPORT)
($2002 cents/kWh)
Base Case ($2000/kW) 6.7 5.2
Reduce Construction Costs25% ($1500/kW) 5.5 4.4
Reduce Constructiontime by 12 months 5.3 4.3
Reduce cost of capital (financing cost) 4.2 3.6
Coal-PC 4.2 3.5Gas-Low ($3.77/MCF) 3.8 3.6Gas-Moderate ($4.42/MCF) 4.1 4.0Gas-High ($6.72/MCF) 5.6 5.7
Merchant Traditional

Electricity Generating Costs:High Discount Rate ($2005)
28%–32% capacity factor
0123456789
Nuclearhigh
Nuclearlow
CCGT Coalsteam
IGCC Windonshore
US ce
nts pe
r kW
h
Capital Operation & maintenance Fuel
Source: IEA WEO 2006

Electricity Generating Costs:Low Discount Rate ($2005)
28%–32% capacity factor
01234567
Nuclearhigh
Nuclearlow
CCGT Coalsteam
IGCC Windonshore
US ce
nts pe
r kW
h
Capital Operation & maintenance Fuel
Source: IEA WEO 2006
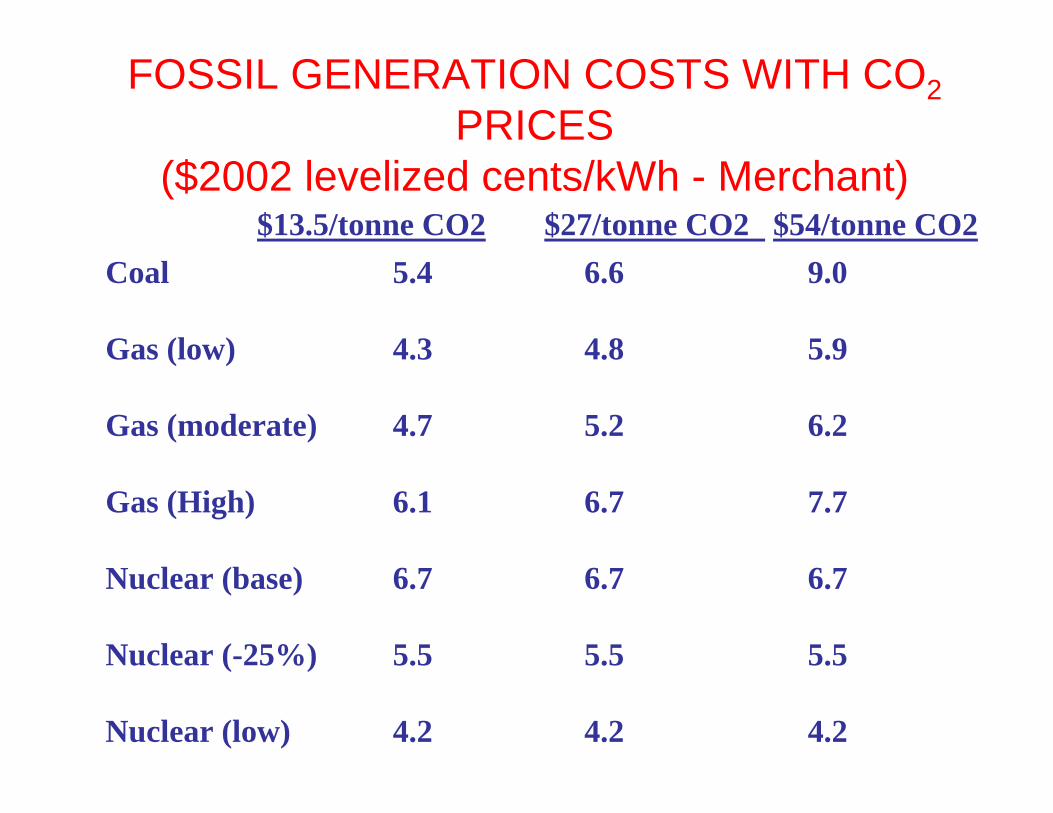
FOSSIL GENERATION COSTS WITH CO2PRICES
($2002 levelized cents/kWh - Merchant)$13.5/tonne CO2 $27/tonne CO2 $54/tonne CO2
Coal 5.4 6.6 9.0
Gas (low) 4.3 4.8 5.9
Gas (moderate) 4.7 5.2 6.2
Gas (High) 6.1 6.7 7.7
Nuclear (base) 6.7 6.7 6.7
Nuclear (-25%) 5.5 5.5 5.5
Nuclear (low) 4.2 4.2 4.2

Impact of CO2 Penalty on Competitiveness of Nuclear Power
Comparative Generating Costs ($2005)
Low cost + lowdiscount rate
High cost +lowdiscount rate
0123456789
CCGT Coal steam IGCC
US ce
nts pe
r kW
h
No carbon price Carbon price $10/tCO2Carbon price $20/tCO2 Carbon price $30/tCO2
High Cost + high discount rate


WHAT IS THE U.S. DOING TO ENCOURAGE INVESTMENT IN
NUCLEAR?
• Streamline licensing process• “First mover” financial incentives• Resolve waste disposal deadlock• “Moral support” for nuclear investment


NEI (2006)

Energy Policy Act of 2005 • Loan guarantees for up to 80% of project cost
– Valid for all GHG-free technologies– Higher leverage, lower debt cost reduces overall project
cost• Production tax credit of $18 per MWh for 8 years for new
nuclear capacity through 2021, subject to 2 limitations:– $125 million per 1,000-MW per year– 6,000-MW eligible, allocated among available capacity
• Insurance protection against delays during construction and until commercial operation caused by factors beyond private sector’s control– Coverage: $500 million apiece for first two plants, $250
million for next four– Covered delays: NRC licensing delays, litigation delays

The Energy Policy Act of 2005 Reduces Costs for First Movers
$44
$49
$54
$59
$64
$69
$46
$50
$55
$59
$64
$43 $44
$35$38
$41$44
$47$50
$0
$10
$20
$30
$40
$50
$60
$70
$80
1,000 $/kW 1,200 $/kW 1,400 $/kW 1,600 $/kW 1,800 $/kW 2,000 $/kW 4.00$/MMBtu
4.50$/MMBtu
5.00$/MMBtu
5.50$/MMBtu
6.00$/MMBtu
Coal Steam IGCC
Advanced Nuclear (Overnight Costs) Natural Gas Combined Cycle (Gas Cost) Coal
$/M
Wh
No PolicyProduction Tax CreditLoan GuaranteeLG + PTC
Source: Berger and Parsons (MIT CEEPR 2005)

NEW NUCLEAR PLANTS UNDER CONSIDERATION
Source: Nuclear Energy Institute
Company Site Early Site Permit Design File Construction/Operating License
Dominion North Anna Under Review ESBWR Pending (2007)
TVA (NuStart) Bellefonte N/A AP1000 (2) Pending (2007)
Entergy (NuStart) Grand Gulf Under Review ESBWR Pending (2007)
Entergy River Bend N/A ESBWR Pending (2008)
Southern Vogtle Submitted AP1000 Pending (2008)
Progress Energy Harris + TBD N/A AP1000 (2) Pending (2007/08)
SCE&G Summer N/A AP1000 (2) Pending (2007)
Duke South Carolina N/A AP1000 (2) Pending (2007)

NEW NUCLEAR PLANTS UNDER CONSIDERATION
Source: Nuclear Energy Institute
Company Site Early Site Permit Design File Construction/Operating License
Exelon Clinton Under Review ND ND
Constellation(Unistar) Calvert Cliffs or N/A EPR (5) Pending (Q4-07)
Nine Mile Point
FP&L Florida (TBD) N/A ND ND
Duke North Carolina ND ND ND
Duke South Carolina ND ND ND
NRG South Texas Proj N/A ABWR(2) 2007
TXU ND N/A ND 2008

ATTRIBUTES OF ACTIVE U.S. PROJECTS
• Companies with good nuclear operating experience (consolidation in the U.S.)
• First movers are likely to be on existing sites• Energy Policy Act subsidies have stimulated a
lot more interest• Projects are primarily in states that have not
deregulated– What will the regulatory framework be?– Construction cost caps and operating performance incentive
mechanisms are likely• No firm financial commitments have yet been
made to build a new plant– Companies are buying options at the moment– Uncertainty about the competitive, regulatory, and contractual
framework continue to be major issues

U.S. OUTLOOK• EIA 2007 Reference Case for 2030
• + 3 GW of uprates of existing plants• + 9 GW of new plants stimulated by federal financial
incentives (shared)• + 3.5 GW in later years without financial subsidies• - 2.6 GW of retirements of older plants• Nuclear generation share falls from 19% to 15%• Lower construction costs required to stimulate more nuclear
investment absent CO2 emissions prices• Some of the most attractive economics are in
states where new nuclear plants will be opposed by local authorities (California, New England, New York)
• Realistic best case scenario would have first new nuclear plant in operation in 2015 on an existing site