
Major Project Report Submitted Towards the Partial Fulfillment Of
The Future of Fulfillment Report

On behalf of Blue Yonder, Researchscape International conducted an online survey of 300 senior executives in omni-channel retail and e-commerce firms with responsibility for logistics and fulfillment. The survey was fielded from October 6 to 13, 2020.
Retailers surveyed saw e-commerce revenue increase by 33% from before the COVID-19 lockdowns, to today. This led to fulfillment challenges including out of stocks (51%), difficulty maintaining mandated social distancing practices or safety protocols (36%), and worker scarcity (34%). Inventory accuracy is critical, along with the ability to view enterprise and third-party vendor inventory across locations and suppliers. In addition, social distancing has propelled traditional brick and mortar retailers to adapt by offering curbside, pickup and contactless shopping experiences.
While the vast majority of executives (81%) believe their order management solution meets their omni-channel fulfillment requirements, only three out of 10 (29%) rate those solutions as excellent.
Given the growth in e-commerce, the automation of fulfillment networks continues as well, with 14% having automation across their networks today. The typical logistic network has 2-4 fulfillment centers:
• This has increased since March for 27% of firms, remained steady for 66% of firms, and decreased for 7%.
• For those organizations that increased the size of their network, the main reason was to respond to increased demand (71%), while nearly half needed to be closer to the consumer (46%) to reduce cost to fulfill and enable delivery speed and convenience. Only a quarter were worried about meeting omni-channel needs (24%).
• The median proportion of online orders filled in full is 90-95%, while just under half (42%) indicated that over 95% of their orders are filled in full as received
online.
• Most of the responding organizations were founded on or after 2000 (59%), with 17% being startups (in business for fewer than five years).
Other Questions• Which of the following fulfillment options do you
have in your network today? In-Store fulfillment (BOPIS, Ship from Store) (64%), E-commerce fulfillment centers E- (49%), Micro-fulfillment centers (15%).
• Which of these delivery options do you offer to your customers today? Standard delivery (74%), Ship-from store (49%), Buy Online / Pickup in Store (BOPIS) (46%).
Challenges• Regional chains are more likely (24% vs. 14%) to
answer No to Does your existing Order Management System fulfill your omni-channel fulfillment requirements?
• Companies with one fulfillment center are also more likely (26% vs. 15%-18%) to have an issue with their existing order management solution fulfilling their omni-channel fulfillment requirements.
• What challenges are you facing when it comes to the last mile of the supply chain? Increasing delivery costs (54%), Reliable order fulfilment (35%), Lack of warehouse workers (25%).
• What extent of your fulfillment locations are automated today? Some (22%), None (29%).
• Almost half (47%) of respondents who indicated “All sales are from e-commerce” note that they have no automation in their fulfillment locations.
• What extent of your fulfillment locations do you plan to have automated 12 months from now? All
Executive Summary

(21%), Most (23%).
• Some respondents (40%) who indicated “All sales are from e-commerce” note that they have no plans in the next 12 months to add automation in their fulfillment locations.
• What e-commerce fulfillment challenges has your organization faced as a result of the COVID-19 pandemic? Out of stocks (51%), Maintaining mandated social distancing practices or safety protocols (36%), Worker scarcity (34%).
• Companies with only one fulfillment center in their logistics network are almost three times more likely to indicate no e-commerce fulfillment challenges as a result of the COVID-19 pandemic.
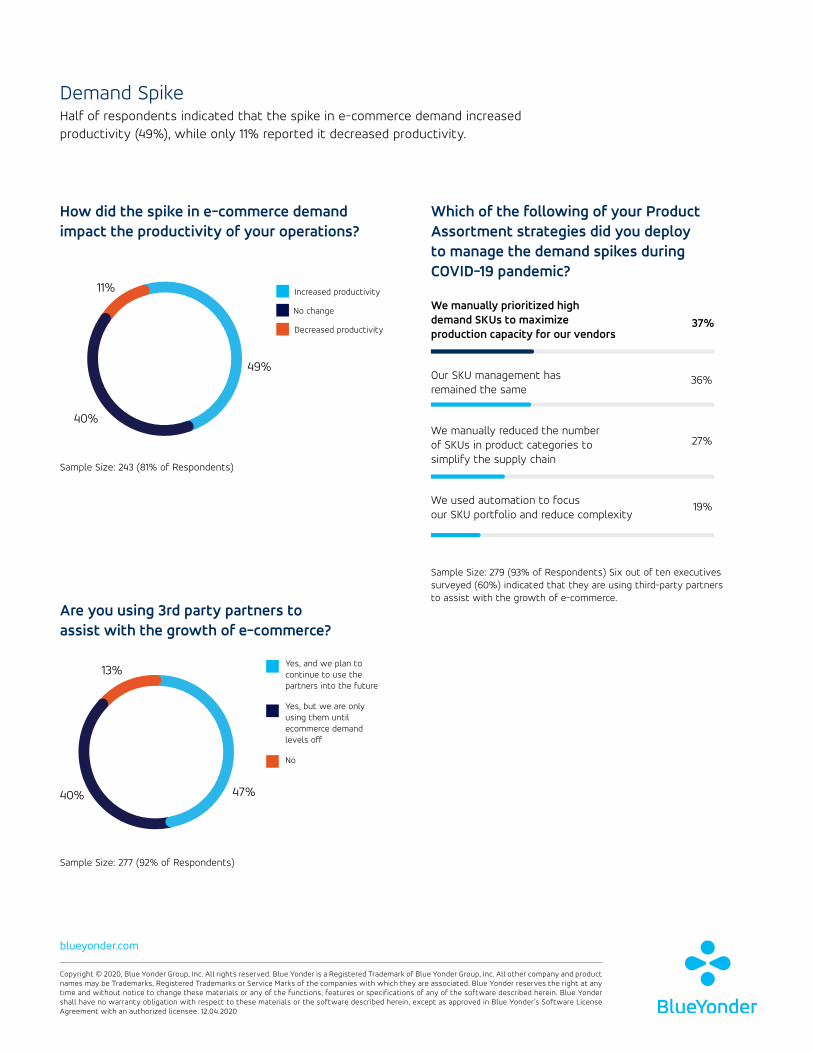
Demand Spikes• How did the spike in e-commerce demand impact
the productivity of your operations? Increased productivity (49%), No change (40%), Decreased productivity (11%).
• Which of the following of your Product Assortment strategies did you deploy to manage the demand spikes during COVID-19 pandemic? We manually prioritized high demand SKUs to maximize production capacity for our vendors (37%), Our SKU management has remained the same (36%), We manually reduced the number of SKUs in product categories to simplify the supply chain (27%).
What is your headcount?
1-9 employees 27%
10-99 employees 19%
100-999 employees 16%
10,000+ employees 15%
1,000-9,999 employees 14%
0 employees 10%
Firmographics
Which, if any, of these product categories are sold by your company?
Retail – Hard Goods 54%
General Merchandise 49%
Retail – Soft Goods 39%
2000 to 2015 43%
1999 or earlier 41%
2016 or later 17%
When was your organization founded?
Other 30%
Director or manager of e-commerce 20%
Senior manager of logistics + e-commerce 18%
What is your title?

Grocery Findings• Significance found in offering the following delivery
options:
- Buy Online / Pickup in Store: 61%- Curbside pickup: 54%
• 66% reported out-of-stocks
• Somewhat more likely to have increased their number of fulfillment centers. 40% indicated an increase vs. 53% reporting “Stayed the same.” Next to the highest reporting which was “Drug Store/Health & Beauty” at 41%. This allows them to meet e-commerce needs and maintain a consistent customer and brand experience.
• Dark stores were selected as being in their current network at a significant level.
• Biggest reported challenge faced when it comes to the last mile of the supply chain was “Increasing delivery costs” but significance was found in the choice “Reliable order fulfillment” at 45% vs. 32-42% of other respondents.
Regional chains vs. National chains• Regional chains are more likely to fulfill orders in
full: 53% vs. 39% (National) reported 95% or higher fulfillment.
• Regional chains are more likely to have only one fulfillment center: 56% vs. 31%
• National chains are more likely to have E-Com Fulfillment Centers as an option in their fulfillment network: 58% vs. 39% (Regional)
• Regional chains are less likely to select “Yes” to the question Does your existing Order Management System fulfill your omni-channel fulfillment requirements? 76% vs. 86% for National chains
• Regional chains are more likely to have none of their fulfillment centers automated: 41% vs. 16% of National chains reporting similarly.
• Regional chains reported less e-commerce fulfillment challenges with worker scarcity (27% vs. 42% for national chains) and out of stocks (43% vs. 59%)
• Regional chains manually reduced the number of SKUs in product categories to simplify the supply chain at a lesser rate (22%) than National chains (34%)
• National chains indicated that they plan to continue to use 3rd party partners to assist with the growth of e-commerce into the future at 55% vs. 40% of Regional chains
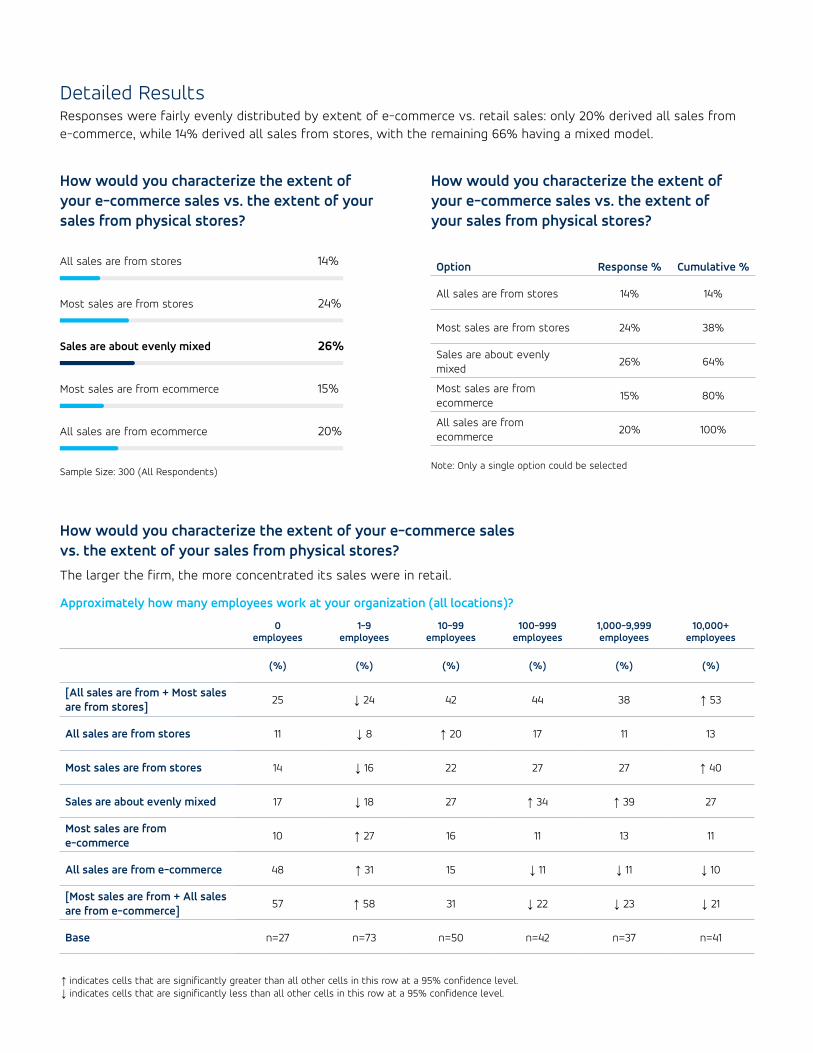
Detailed ResultsResponses were fairly evenly distributed by extent of e-commerce vs. retail sales: only 20% derived all sales from e-commerce, while 14% derived all sales from stores, with the remaining 66% having a mixed model.
All sales are from stores 14%
Most sales are from stores 24%
Sales are about evenly mixed 26%
Most sales are from ecommerce 15%
All sales are from ecommerce 20%
How would you characterize the extent of your e-commerce sales vs. the extent of your sales from physical stores?
Option Response % Cumulative %
All sales are from stores 14% 14%
Most sales are from stores 24% 38%
Sales are about evenly mixed
26% 64%
Most sales are from ecommerce
15% 80%
All sales are from ecommerce
20% 100%
Sample Size: 300 (All Respondents)Note: Only a single option could be selected
How would you characterize the extent of your e-commerce sales vs. the extent of your sales from physical stores?
How would you characterize the extent of your e-commerce sales vs. the extent of your sales from physical stores?
The larger the firm, the more concentrated its sales were in retail.
Approximately how many employees work at your organization (all locations)?
0 employees
1-9 employees
10-99 employees
100-999employees
1,000-9,999 employees
10,000+ employees
(%) (%) (%) (%) (%) (%)
[All sales are from + Most sales are from stores]
25 ↓ 24 42 44 38 ↑ 53
All sales are from stores 11 ↓ 8 ↑ 20 17 11 13
Most sales are from stores 14 ↓ 16 22 27 27 ↑ 40
Sales are about evenly mixed 17 ↓ 18 27 ↑ 34 ↑ 39 27
Most sales are from e-commerce
10 ↑ 27 16 11 13 11
All sales are from e-commerce 48 ↑ 31 15 ↓ 11 ↓ 11 ↓ 10
[Most sales are from + All sales are from e-commerce]
57 ↑ 58 31 ↓ 22 ↓ 23 ↓ 21
Base n=27 n=73 n=50 n=42 n=37 n=41
↑ indicates cells that are significantly greater than all other cells in this row at a 95% confidence level.↓ indicates cells that are significantly less than all other cells in this row at a 95% confidence level.

All sales are to consumers 37%
Most sales are to consumers 40%
Sales are about evenly mixed 23%
Most sales are to businesses
All sales are to businesses
Over 95% 42%
90-95% 18%
80-89% 21%
Less than 80% 10%
Don’t know 9%
Sample Size: 300 (All Respondents) Sample Size: 255 (85% of Respondents)
What extent of your sales are to businesses as opposed to consumers?
To qualify for the survey, respondents had to derive half or more of their sales from consumers rather than businesses; over a third (37%) only sold to consumers.
Prior to the COVID-19 pandemic, e-commerce accounted for approximately what percentage of your organization’s total revenue?
Today, e-commerce accounts for approximately what percentage of your organization’s total revenue?
Minimum 10th Percentile Average Median 90th Percentile MaximumStandard Deviation
Sample Size
0% 10% 52% 45% 100% 100% 32.6% 257
Minimum 10th Percentile Average Median 90th Percentile MaximumStandard Deviation
Sample Size
0% 20% 63.4% 60% 100% 100% 30.2% 257
Sample Size: 257 (86% of Respondents)
Sample Size: 257 (86% of Respondents)
The median proportion of online orders filled in full is 90-95%, while just under half (42%) indicated that over 95% of their orders are filled in full as received online.
What is the proportion of orders that are filled in full as received online?
Retailers’ e-commerce revenue increased by 33% amidst the pandemic.

0
1 43%
2-4 30%
5-9 14%
10 or more 13%
In-Store fulfillment (BOPIS, Ship from Store) 64%
E-Com Fulfillment Centers 49%
Micro-Fulfillment Centers 15%
Pop-up Distribution Centers 12%
Dark Stores 6%
Other (please specify) 2%
None of the above 8%
To respond to increased demand 71%
To be closer to the consumer 46%
To meet omni-channel needs 24%
Other (please specify)
Sample Size: 295 (98% of Respondents)
Sample Size: 286 (95% of Respondents)
Sample Size: 76 (25% of Respondents)
Sample Size: 286 (95% of Respondents)
Stayed the same
Increased
Decreased
How many fulfillment centers currently exist in your logistics network?
Which of the following fulfillment options do you have in your network today?
Why did you expand the number of fulfillment centers?
How has this changed since March?
66%
7%
27%

In-Store fulfillment (BOPIS, Ship from Store) 59%
E-Com Fulfillment Centers 51%
Micro-Fulfillment Centers 27%
Pop-up Distribution Centers 26%
Dark Stores 12%
Other (please specify) 3%
None of the above 9%
Standard delivery 74%
Ship-from store 49%
Buy Online / Pickup in Store (BOPIS) 46%
Curbside pickup 39%
Same-day delivery 34%
Vendor drop ship 19%
Sample Size: 286 (95% of Respondents)
Sample Size: 286 (95% of Respondents)
Which of the following fulfillment options do you plan to have in the next 2-3 years?
Which of these delivery options do you offer to your customers today?
ChallengesFour out of five executives (81%) report that their existing Order Management System meets their omni-channel fulfillment requirements.
Increasing delivery costs 54%
Reliable order fulfilment 35%
Lack of warehouse workers 25%
Not enough warehouse space 23%
Other (please specify) 1%
None of the above 13%
All 14%
Most 23%
Half 13%
Some 22%
None 29%
Sample Size: 286 (95% of Respondents)
Sample Size: 281 (94% of Respondents)
What challenges are you facing when it comes to the last mile of the supply chain?
What extent of your fulfillment locations are automated today?

All 21%
Most 23%
Half 15%
Some 19%
None 23%
Out of stocks 51%
Maintaining mandated social distancing practices or safety protocols
Worker scarcity 34%
Store closures 27%
Lack of visibility into inventory and orders 24%
None of the above 29%Sample Size: 281 (94% of Respondents)
Sample Size: 281 (94% of Respondents)
What extent of your fulfillment locations do you plan to have automated 12 months from now?
What e-commerce fulfillment challenges has your organization faced as a result of the COVID-19 pandemic?
36%
Sample Size: 281 (94% of Respondents)
Does your existing Order Management System fulfill your omni-channel fulfillment requirements?
How would you rate your existing Order Management System for fulfilling your omni-channel fulfillment requirements?
Yes
No
81%
19% Excellent 29%
Good 52%
Acceptable 16%
Poor 2%
Terrible 2%
Sample Size: 281 (94% of Respondents)
We manually prioritized high demand SKUs to maximize production capacity for our vendors
Our SKU management has remained the same
We manually reduced the number of SKUs in product categories to simplify the supply chain
We used automation to focus our SKU portfolio and reduce complexity
Sample Size: 243 (81% of Respondents)
Sample Size: 277 (92% of Respondents)
Sample Size: 279 (93% of Respondents) Six out of ten executives surveyed (60%) indicated that they are using third-party partners to assist with the growth of e-commerce.
How did the spike in e-commerce demand impact the productivity of your operations?
Are you using 3rd party partners to assist with the growth of e-commerce?
Which of the following of your Product Assortment strategies did you deploy to manage the demand spikes during COVID-19 pandemic?
Demand SpikeHalf of respondents indicated that the spike in e-commerce demand increased productivity (49%), while only 11% reported it decreased productivity.
Increased productivity
No change
Decreased productivity37%
36%
27%
19%
11%
40%
49%
13%
40% 47%
Yes, and we plan to continue to use the partners into the future
Yes, but we are only using them until ecommerce demand levels off
No
blueyonder.com
Copyright © 2020, Blue Yonder Group, Inc. All rights reserved. Blue Yonder is a Registered Trademark of Blue Yonder Group, Inc. All other company and product names may be Trademarks, Registered Trademarks or Service Marks of the companies with which they are associated. Blue Yonder reserves the right at any time and without notice to change these materials or any of the functions, features or specifications of any of the software described herein. Blue Yonder shall have no warranty obligation with respect to these materials or the software described herein, except as approved in Blue Yonder’s Software License Agreement with an authorized licensee. 12.04.2020


