The future of European Migration: Aging, Channel of...
31
Alessandra Venturini, University of Turin, MPC, Florence T.wai-CICIR Workshop agenda October 19-2015 The future of European Migration: Aging, Channel of entrance and Welfare 26/04/2016 MPC - www.migrationpolicycentre.eu 1
Transcript of The future of European Migration: Aging, Channel of...
Alessandra Venturini, University of Turin, MPC, Florence
T.wai-CICIR Workshop agenda
October 19-2015
The future of European Migration:Aging, Channel of entrance and Welfare
26/04/2016 MPC - www.migrationpolicycentre.eu 1
www.migrationpolicycentre.eu MPC
• Europe is aging• Composition
• Increasing share of the elderly
• Old age dependency ratio (65+/20-64) appropriate for pension studies
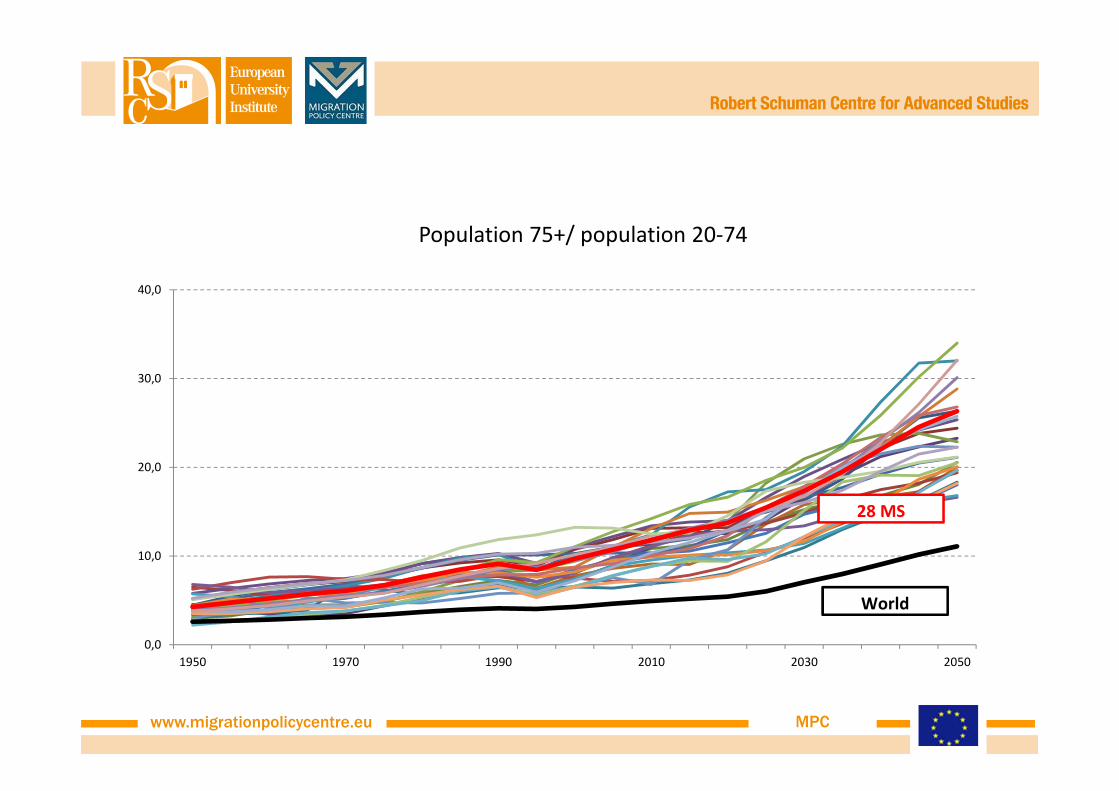
• Super Old age dependency ratio (75+/20-74)
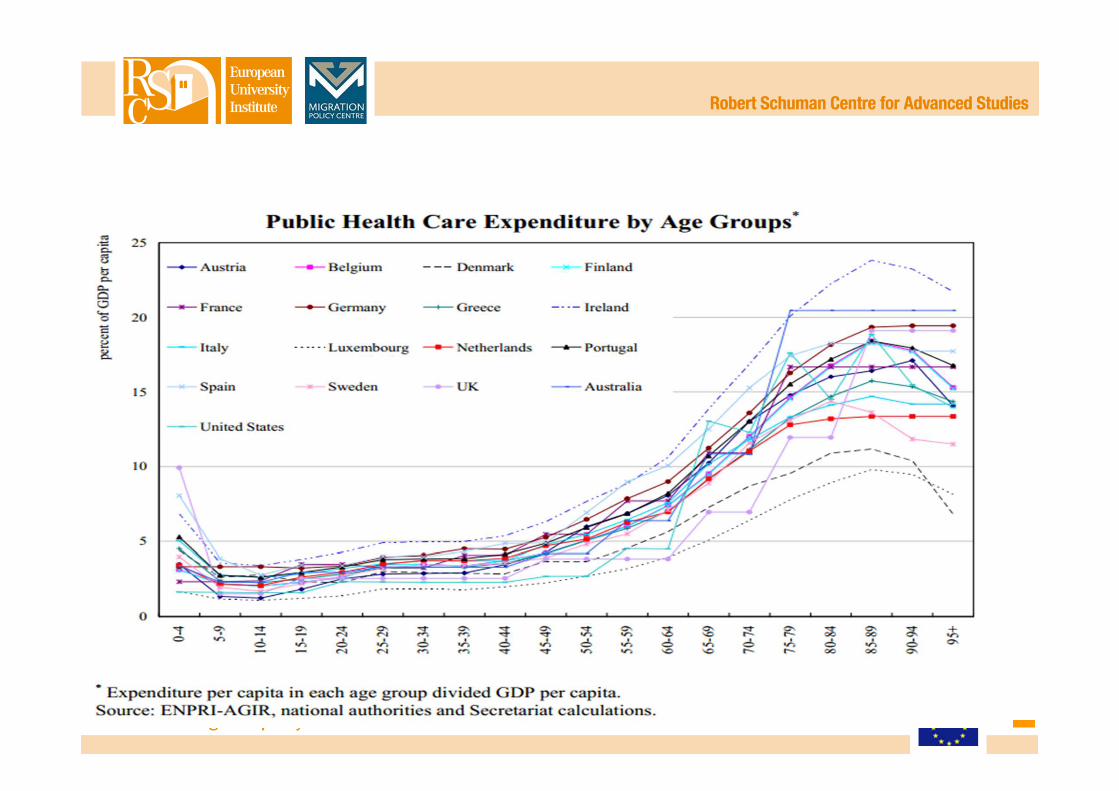
• Impact on the welfare cost and on the long term care needs of the elderly
326/04/2016 MPC - www.migrationpolicycentre.eu
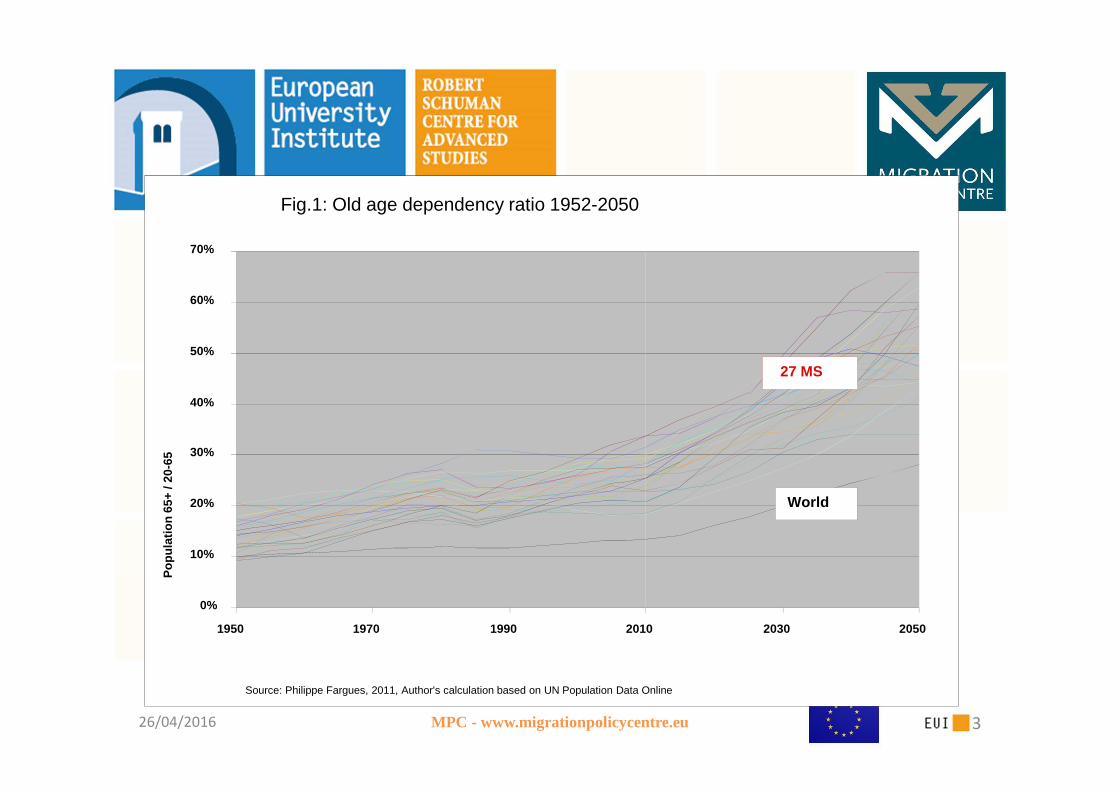
Fig.1: Old age dependency ratio 1952-2050
0%
10%
20%
30%
40%
50%
60%
70%
1950 1970 1990 2010 2030 2050
Po
pu
lati
on
65+
/ 20
-65
World
27 MS
Source: Philippe Fargues, 2011, Author's calculation based on UN Population Data Online
www.migrationpolicycentre.eu MPC
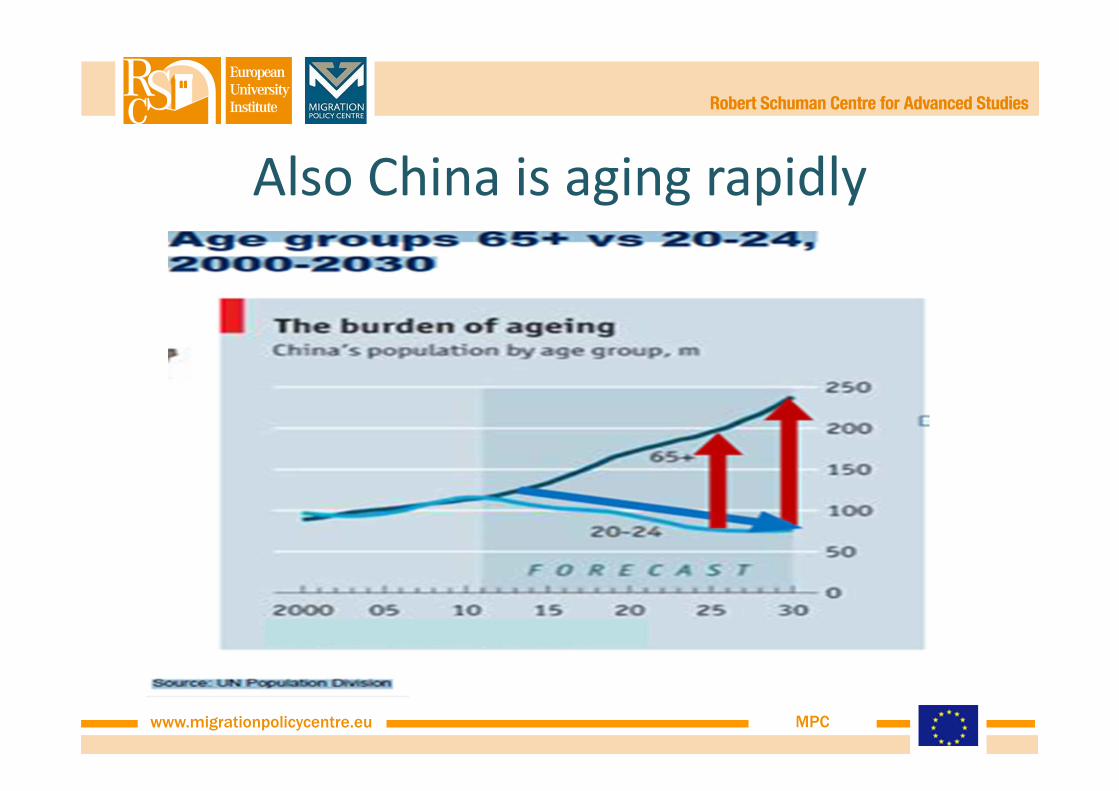
Also China is aging rapidly
www.migrationpolicycentre.eu MPC
www.migrationpolicycentre.eu MPC
Population 75+/ population 20-74
0,0
10,0
20,0
30,0
40,0
1950 1970 1990 2010 2030 2050
28 MS
World
www.migrationpolicycentre.eu MPC
www.migrationpolicycentre.eu MPC
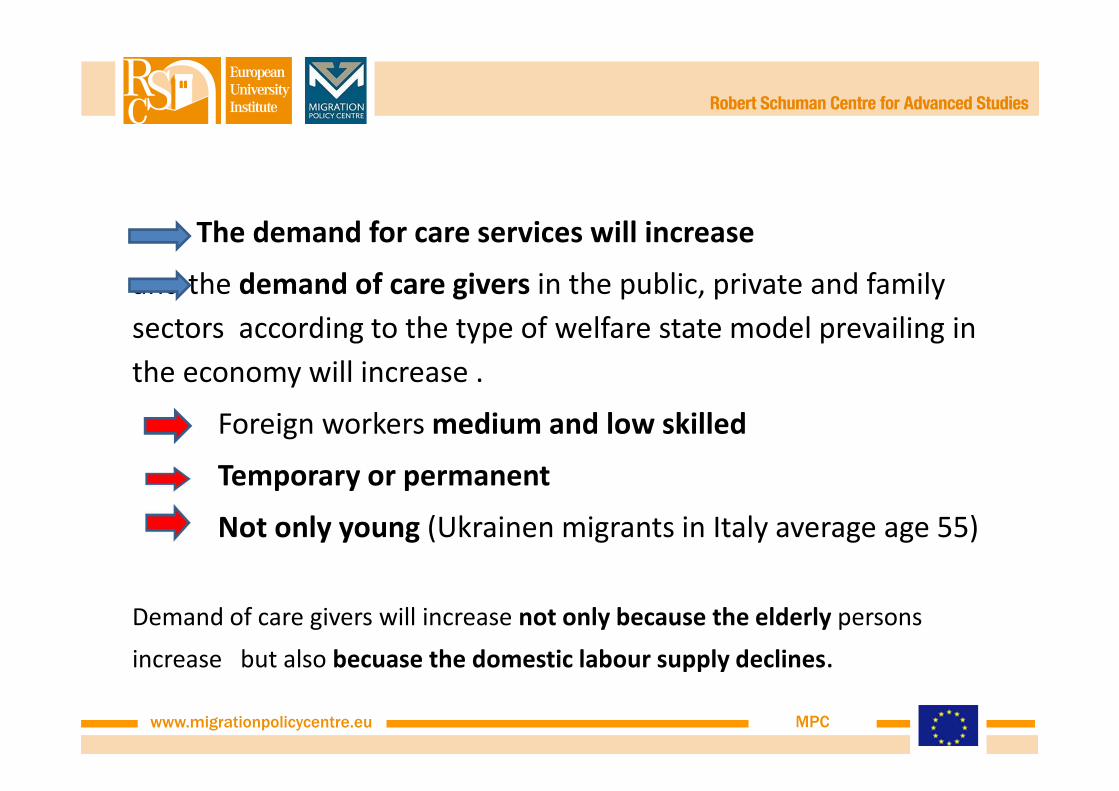
The demand for care services will increase
and the demand of care givers in the public, private and family
sectors according to the type of welfare state model prevailing in
the economy will increase .
Foreign workers medium and low skilled
Temporary or permanent
Not only young (Ukrainen migrants in Italy average age 55)
Demand of care givers will increase not only because the elderly persons
increase but also becuase the domestic labour supply declines.
www.migrationpolicycentre.eu MPC
www.migrationpolicycentre.eu MPC
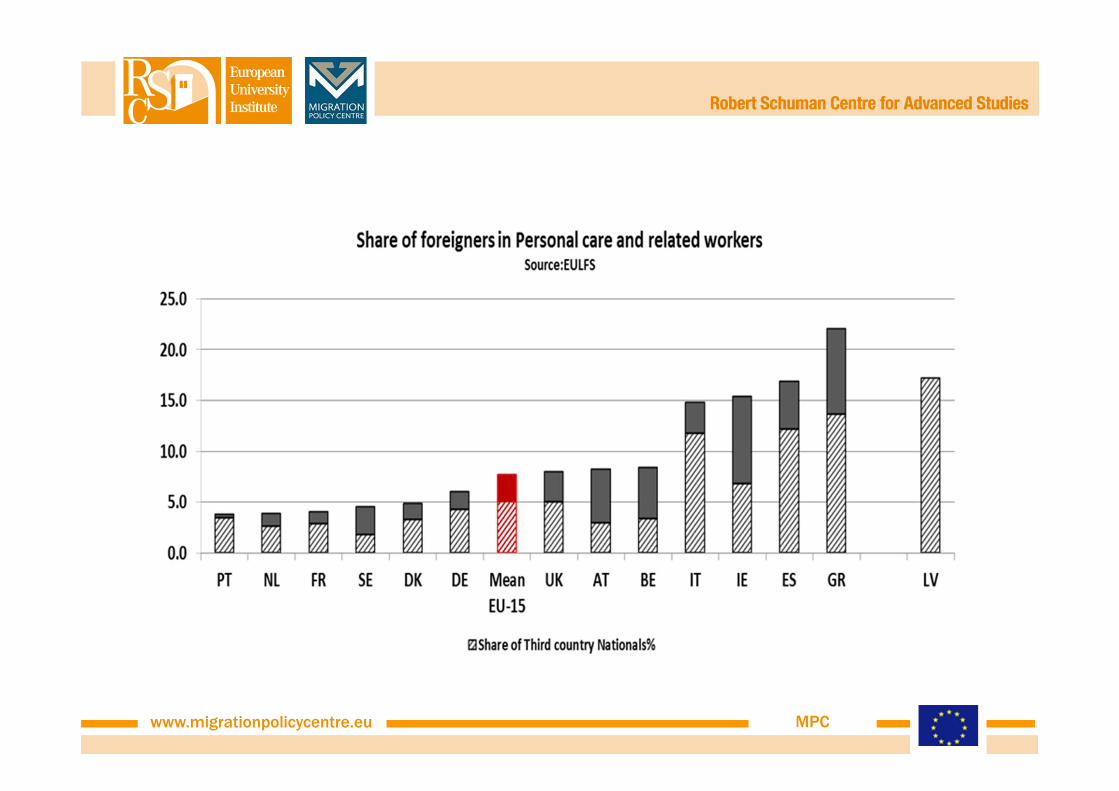
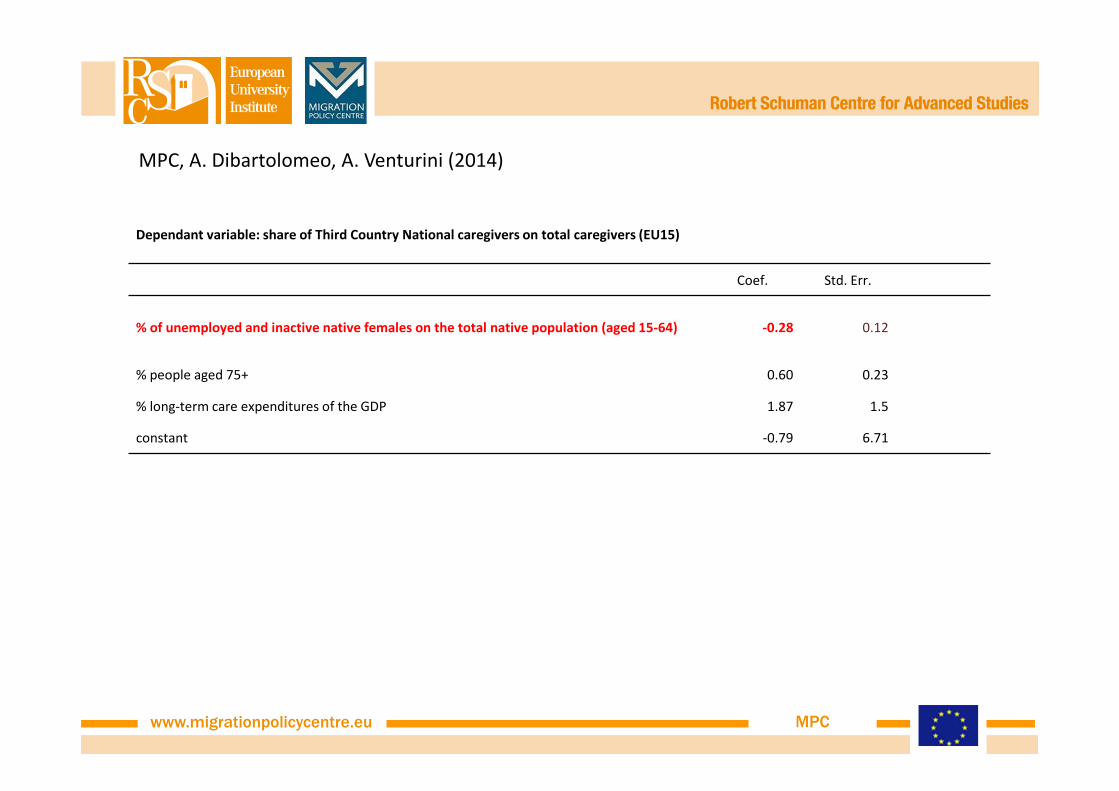
MPC, A. Dibartolomeo, A. Venturini (2014)
Dependant variable: share of Third Country National caregivers on total caregivers (EU15)
Coef. Std. Err.
% of unemployed and inactive native females on the total native population (aged 15-64) -0.28 0.12
% people aged 75+ 0.60 0.23
% long-term care expenditures of the GDP 1.87 1.5
constant -0.79 6.71
www.migrationpolicycentre.eu MPC
Europe is aging
• Size
• The European Labour force (age 15-59) is 313 million in 2010
while without migration in 2050 will be 246 million or with
similar migration inflows 299 million.
• The stock of EU27 working population is reducing by 9.5%
every 10 years or 4.5% if the inflows continue (Ph.Fargues 2012)
MPC - www.migrationpolicycentre.eu 12
60
80
100
120
2015 2020 2025 2030 2035
Ba
se 1
00
in
20
15
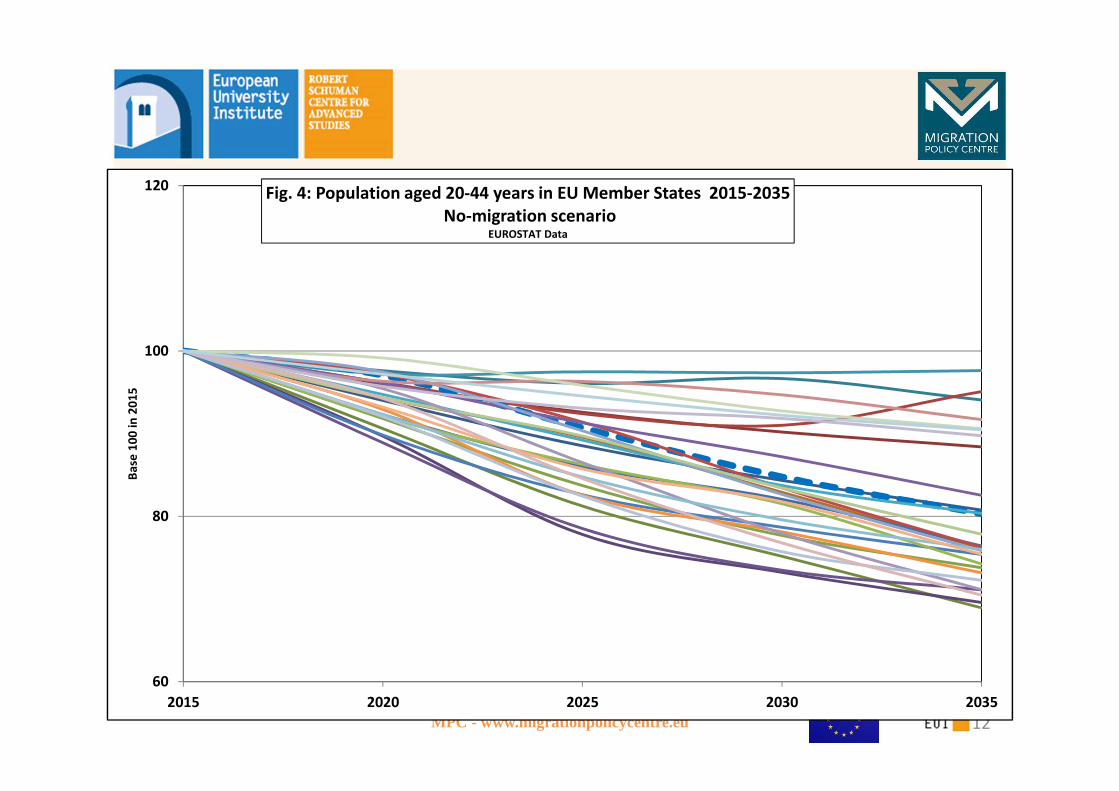
Fig. 4: Population aged 20-44 years in EU Member States 2015-2035
No-migration scenario EUROSTAT Data
www.migrationpolicycentre.eu MPC
• This evolution of the native population needs migrants
• to satisfy the care demand a temporary migration of medium and low
skilled workers could also be a solution,
• the decreasing size of the population permanent migrants are needed
• as future EU citizens and thus
• a new vision of the integration policy.
• Aging of skills• With the extension of working life workers has longer
professional life Human Capital Theory
• Youngs not only a pleasure, consumption dimension
• Investement dimension for future growth and innovation
26/04/2016 MPC - www.migrationpolicycentre.eu 14
26/04/2016 MPC - www.migrationpolicycentre.eu 15
0
1.000.000
2.000.000
3.000.000
4.000.000
5.000.000
6.000.000
7.000.000
8.000.000
20 30 40 50 60 70
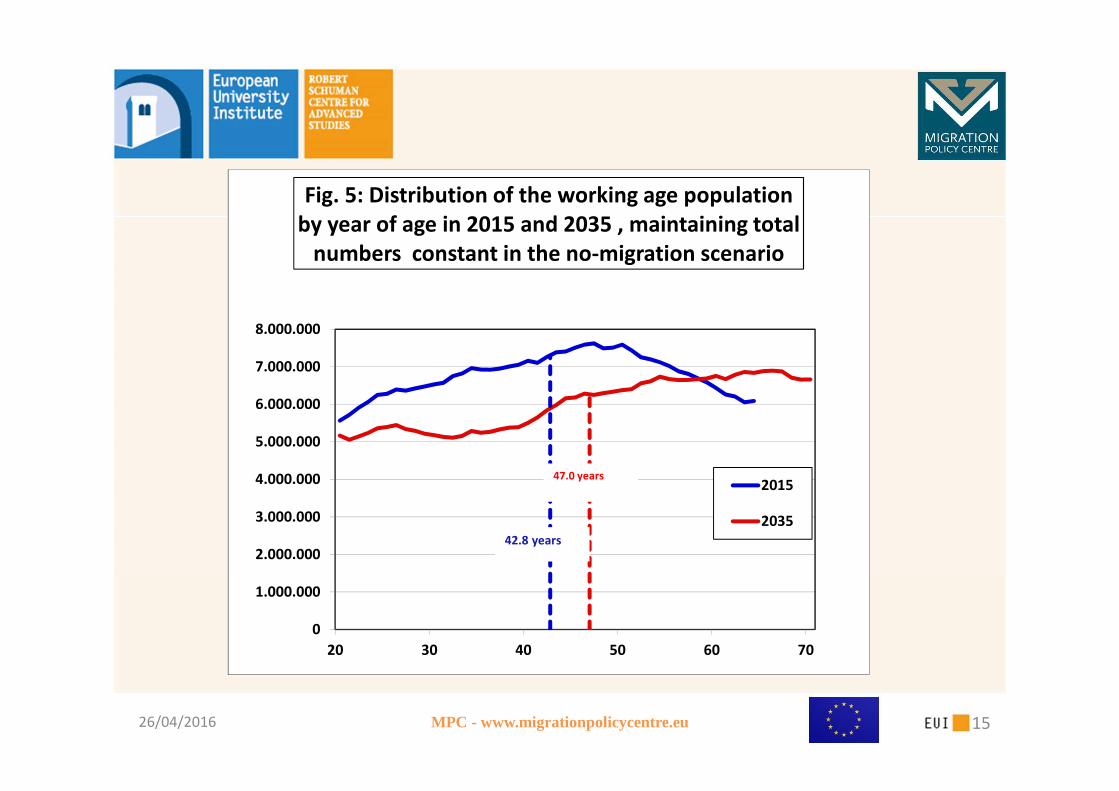
Fig. 5: Distribution of the working age population
by year of age in 2015 and 2035 , maintaining total
numbers constant in the no-migration scenario
2015
2035
42.8 years
47.0 years
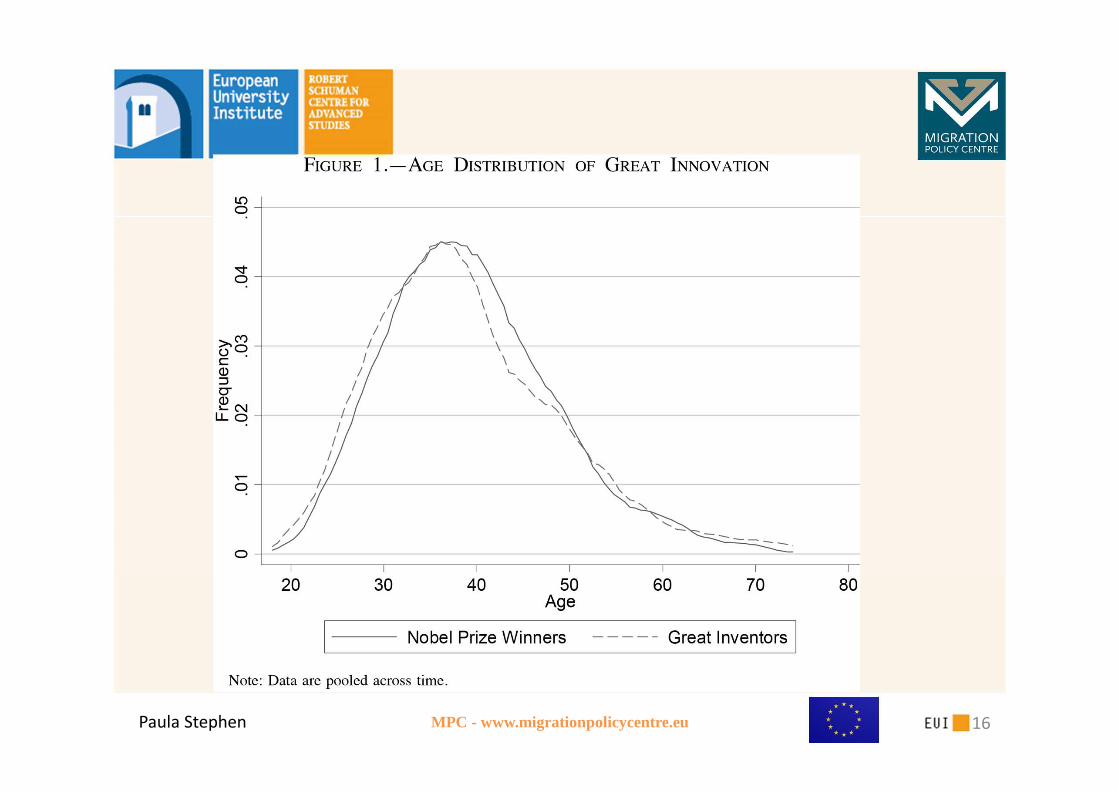
Paula Stephen MPC - www.migrationpolicycentre.eu 16
26/04/2016 MPC - www.migrationpolicycentre.eu 17
0
25.000
50.000
75.000
100.000
125.000
150.000
175.000
200.000
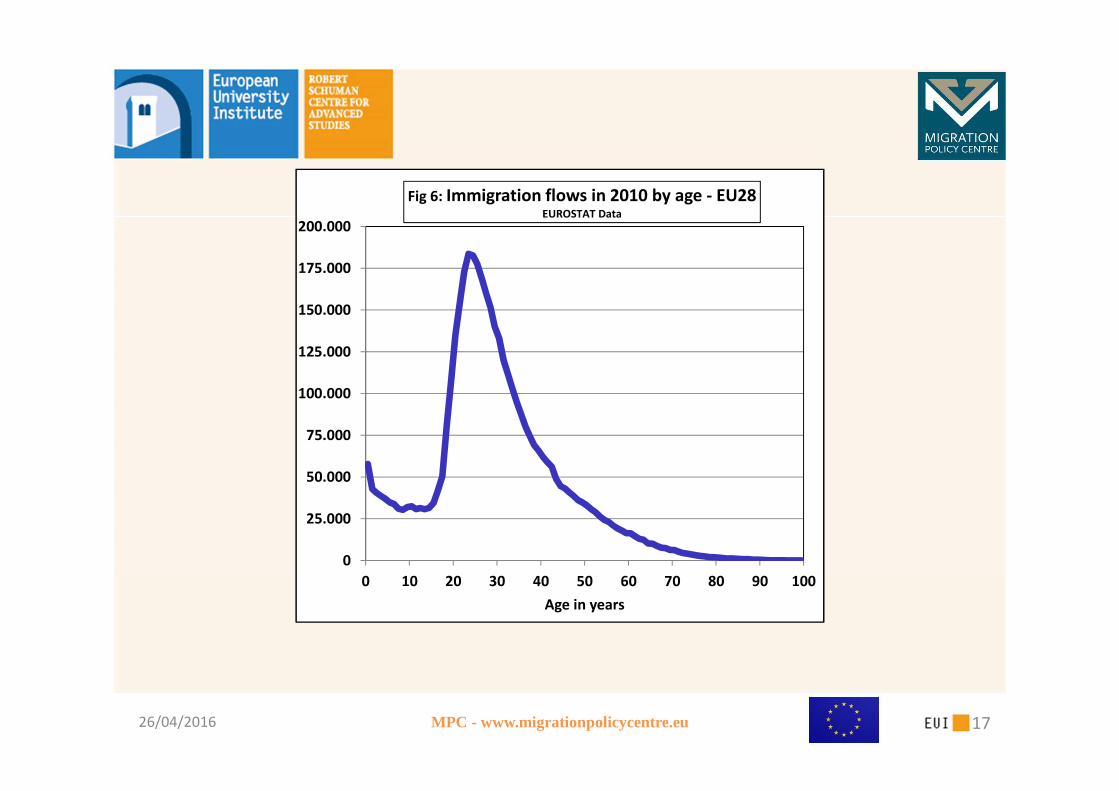
0 10 20 30 40 50 60 70 80 90 100
Age in years
Fig 6: Immigration flows in 2010 by age - EU28EUROSTAT Data
www.migrationpolicycentre.eu MPC
• the research has shown a very strong young age dividend,
both among foreigners, expecially among the high educated
(MPC, Venturini, Fassio, Montobbio 2015)
• Thus Europe needs also highly skilled permanent migrants
for innovation
26/04/2016 MPC - www.migrationpolicycentre.eu 19
40
60
80
100
120
140
160
2015 2020 2025 2030 2035
Ba
se 1
00
in
20
14
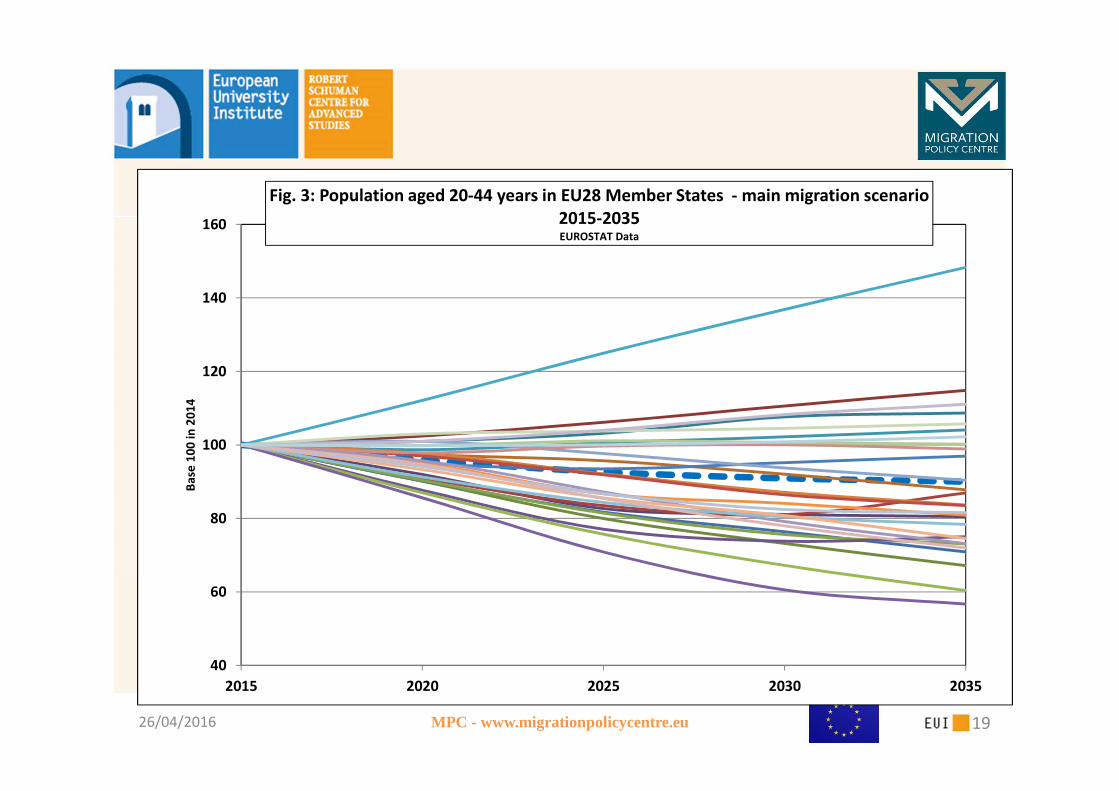
Fig. 3: Population aged 20-44 years in EU28 Member States - main migration scenario
2015-2035EUROSTAT Data
• Multi level governance of migration• Europe
• National legislation
• Regional or local legislation
26/04/2016 MPC - www.migrationpolicycentre.eu 20
• Family reunification directive
• Refugees directive
• European preference
• Global migration approach• Blue Card
• Circular Migration
• Neibourhood Policy• Partnership agreements
European Migration policy
26/04/2016 MPC - www.migrationpolicycentre.eu 21
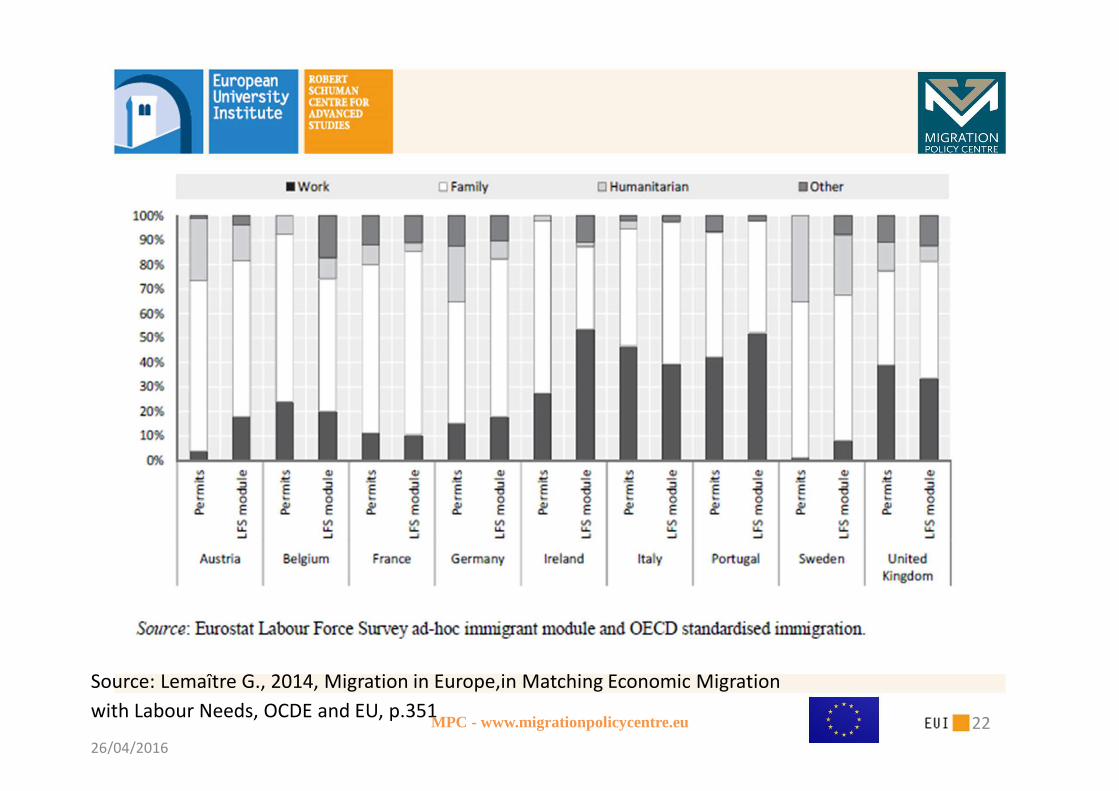
Source: Lemaître G., 2014, Migration in Europe,in Matching Economic Migration
with Labour Needs, OCDE and EU, p.351
26/04/2016
MPC - www.migrationpolicycentre.eu 22
Different doors of entrance
Different legislations
• Family reunification 50%
• Labour 30%
• Refugees 20%
Back door
26/04/2016 MPC - www.migrationpolicycentre.eu 23
26/04/2016 MPC - www.migrationpolicycentre.eu 24
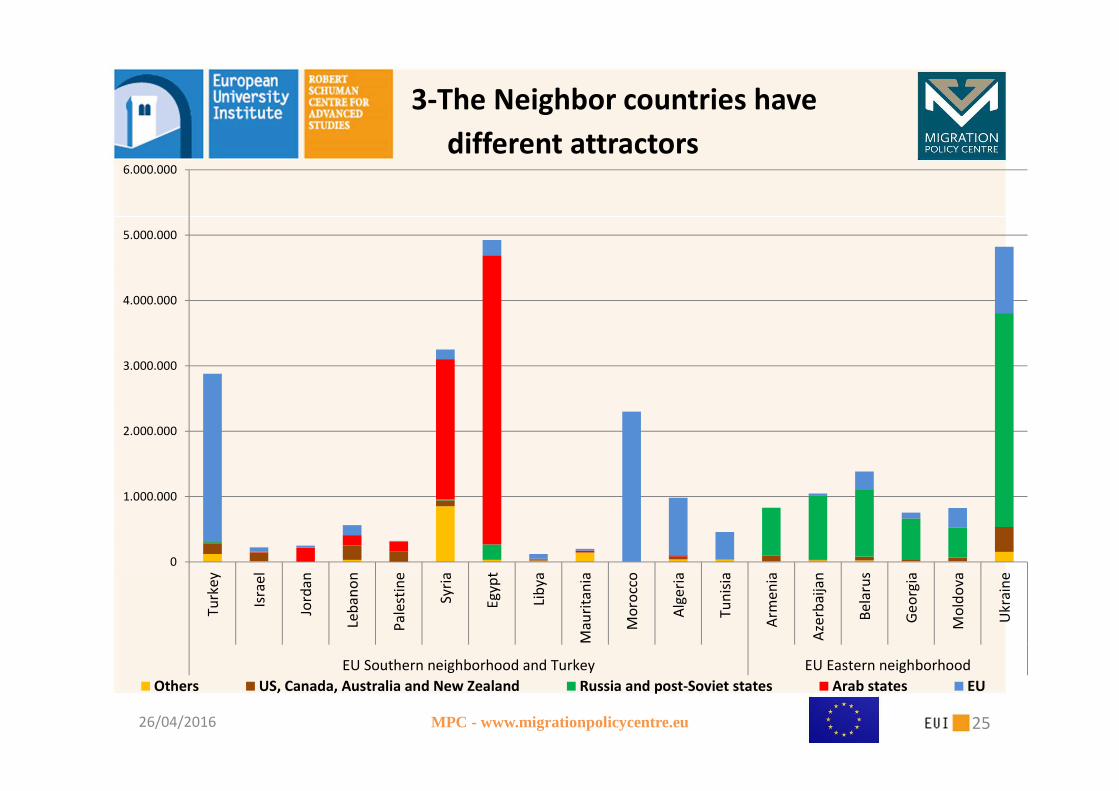
3-The Neighbor countries have
different attractors
26/04/2016 MPC - www.migrationpolicycentre.eu 25
0
1.000.000
2.000.000
3.000.000
4.000.000
5.000.000
6.000.000
Tu
rke
y
Isra
el
Jord
an
Leb
an
on
Pa
lest
ine
Syri
a
Eg
yp
t
Lib
ya
Ma
uri
tan
ia
Mo
rocc
o
Alg
eri
a
Tu
nis
ia
Arm
en
ia
Aze
rba
ija
n
Be
laru
s
Ge
org
ia
Mo
ldo
va
Uk
rain
e
EU Southern neighborhood and Turkey EU Eastern neighborhood
Others US, Canada, Australia and New Zealand Russia and post-Soviet states Arab states EU
www.migrationpolicycentre.eu MPC 26
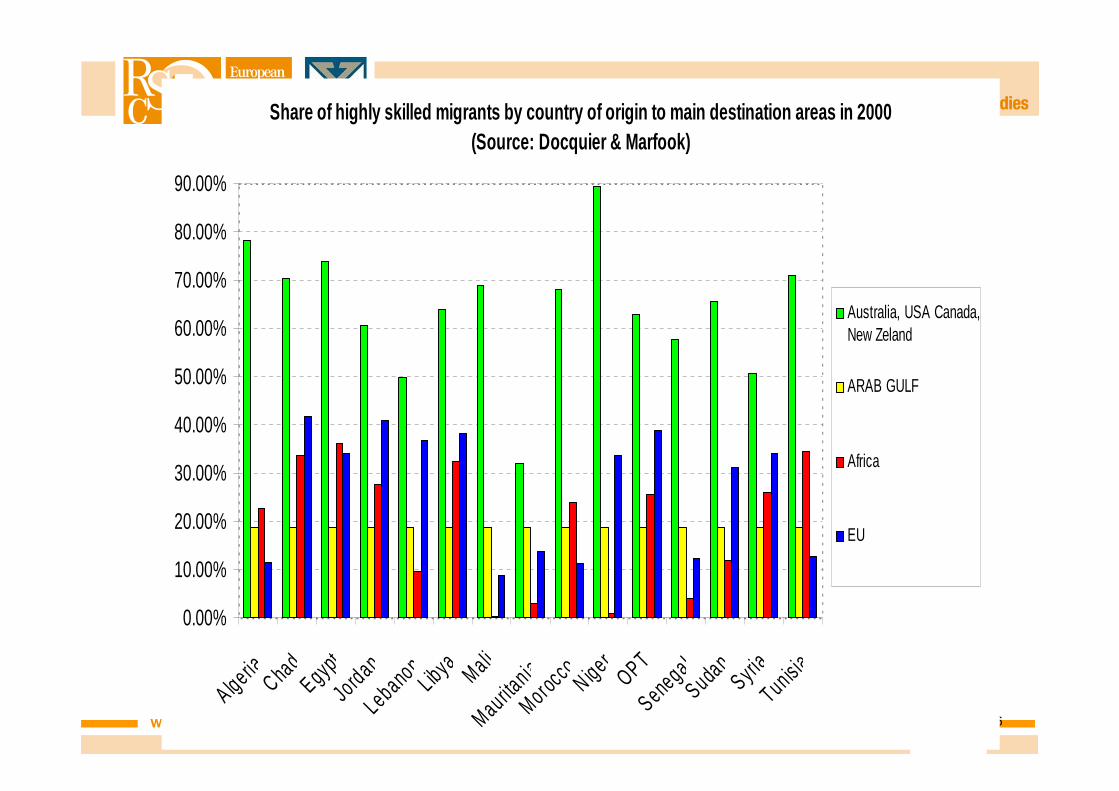
Share of highly skilled migrants by country of origin to main destination areas in 2000(Source: Docquier & Marfook)
0.00%
10.00%
20.00%
30.00%
40.00%
50.00%
60.00%
70.00%
80.00%
90.00%
A lgeriaCha
dEgypt
Jordan
Lebanon
Libya MaliMaurita
niaMoroc
co N igerOPT
Senegal
Sudan
Syria
TunisiaAustralia, USA Canada,New Zeland
ARAB GULF
Africa
EU
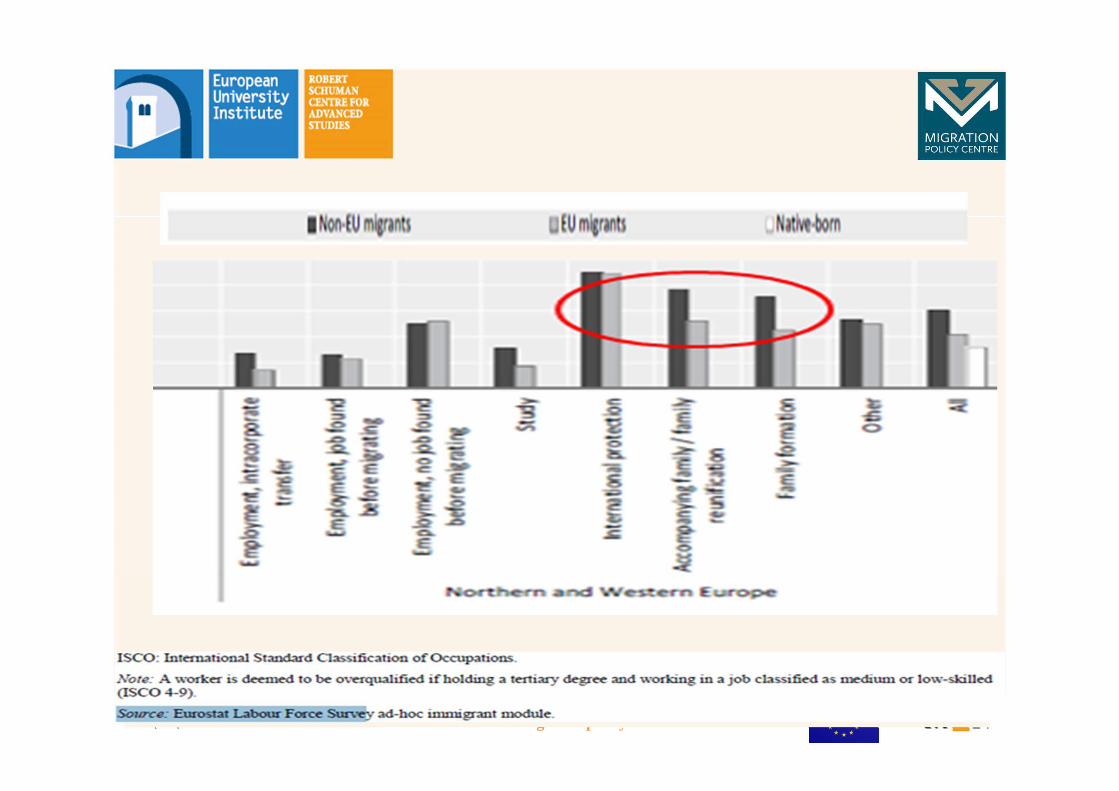
• The focus on the labour migrants creates a distorted vision of the effect of the labourmigration policy on the integration of migrantsand use of the welfare state
• And an impossible demand of efficiency by one single instrument.
26/04/2016 MPC - www.migrationpolicycentre.eu 27
26/04/2016 MPC - www.migrationpolicycentre.eu 28
26/04/2016 MPC - www.migrationpolicycentre.eu 29
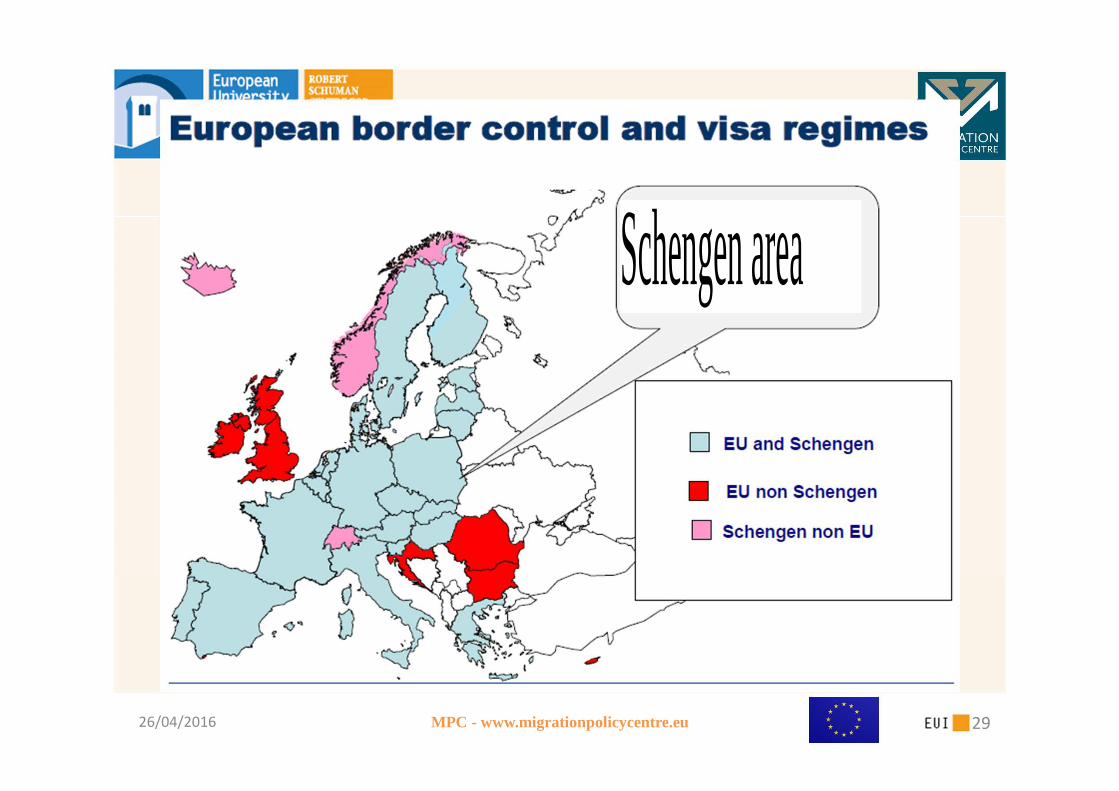
Schengen areaSchengen area
• Equal rights to native citizens
• Access to welfare services
• In the UK this issue creates problems
Continental Europe is part of the Schengen Agreement which implies free mobility, no visa nedeed to enter UK as EU Citizens.
26/04/2016 MPC - www.migrationpolicycentre.eu 30
• Very little attention has been devoted to the demographic effect of migration
• The Commission should push for more data on migrants by reason of entrance and more research on the transition to work of the foreigners.
Conclusion