the Future Forward Section 087 - softbank.jp · SoftBank Group Corp. is a corporation domiciled in...
93
1. Reporting entity SoftBank Group Corp. is a corporation domiciled in Japan. The registered address of SoftBank Group Corp.’s head office is disclosed on our website (https://www.softbank.jp/). These consolidated financial statements are composed of SoftBank Group Corp. and its subsidiaries (the “Company”). The Company engages in various businesses in the information industry, with its base in the Domestic Telecommunications segment, the Sprint segment, the Yahoo Japan segment, the Distribution segment, and the Arm segment. The details are described in “(1) Description of reportable segments” in “Note 6. Segment information.” 2. Basis of preparation of consolidated financial statements (1) Compliance with IFRSs The consolidated financial statements of the Company have been prepared in accordance with International Financial Reporting Standards (“IFRSs”). (2) Basis of measurement These consolidated financial statements have been prepared on the historical cost basis, except for certain items, such as financial instruments, that are measured at fair value as described in “Note 3. Significant accounting policies.” (3) Presentation currency and unit of currency These consolidated financial statements have been presented in Japanese yen, which is the currency of the primary economic environment of SoftBank Group Corp. (“functional currency”), and yen amounts are rounded to the nearest million. The translations of Japanese yen amounts into U.S. dollar amounts are included solely for the convenience of readers outside Japan and have been made at the rate of ¥112.19 to $1, the approximate rate of exchange at March 31, 2017. Such translations should not be construed as representations that the Japanese yen amounts could be converted into U.S. dollars at that or any other rate. (4) Changes in presentation (Consolidated statement of income) a. “Gain on sales of shares of associates” which was included in “Other non-operating income (loss)” for the fiscal year ended March 31, 2016 is separately presented for the fiscal year ended March 31, 2017 since the significance of the amount increased. In order to reflect the change, ¥12,428 million which was included in “Other non-operating income (loss)” in the consolidated statement of income for the fiscal year ended March 31, 2016, is reclassified as “Gain on sales of shares of associates.” b. “Derivative gain (loss)” which was included in “Other non-operating income (loss)” for the fiscal year ended March 31, 2016 is separately presented for the fiscal year ended March 31, 2017 since the significance of the amount increased. In order to reflect the change, ¥12,788 million which was included in “Other non-operating income (loss)” in the consolidated statement of income for the fiscal year ended March 31, 2016, is reclassified as “Derivative gain (loss).” c. “Gain (loss) from financial instruments at FVTPL” which was included in “Other non-operating income (loss)” for the fiscal year ended March 31, 2016 is separately presented for the fiscal year ended March 31, 2017 since the significance of the amount increased. In order to reflect the change, ¥114,377 million which was included in “Other non-operating income (loss)” in the consolidated statement of income for the fiscal year ended March 31, 2016, is reclassified as “Gain (loss) from financial instru- ments at FVTPL.” d. “Dilution gain from changes in equity interest” which was separately presented for the fiscal year ended March 31, 2016 is included in “Other non-operating income (loss)” for the fiscal year ended March 31, 2017 since the significance of the amount decreased. In order to reflect the change, ¥14,903 million which was separately presented as “Dilution gain from changes in equity interest” in the consolidated statement of income for the fiscal year ended March 31, 2016, is included in “Other non-operating income (loss).” Notes to Consolidated Financial Statements SoftBank Group Corp. ANNUAL REPORT 2017 087 Trajectory of the Information Revolution Bringing the Future Forward Essential Information Management Organization Corporate Information Financial Section
Transcript of the Future Forward Section 087 - softbank.jp · SoftBank Group Corp. is a corporation domiciled in...

1. Reporting entitySoftBank Group Corp. is a corporation domiciled in Japan. The registered address of SoftBank Group Corp.’s
head office is disclosed on our website (https://www.softbank.jp/). These consolidated financial statements are
composed of SoftBank Group Corp. and its subsidiaries (the “Company”). The Company engages in various
businesses in the information industry, with its base in the Domestic Telecommunications segment, the Sprint
segment, the Yahoo Japan segment, the Distribution segment, and the Arm segment. The details are
described in “(1) Description of reportable segments” in “Note 6. Segment information.”
2. Basis of preparation of consolidated financial statements(1) Compliance with IFRSs The consolidated financial statements of the Company have been prepared in accordance with International
Financial Reporting Standards (“IFRSs”).
(2) Basis of measurementThese consolidated financial statements have been prepared on the historical cost basis, except for certain
items, such as financial instruments, that are measured at fair value as described in “Note 3. Significant
accounting policies.”
(3) Presentation currency and unit of currencyThese consolidated financial statements have been presented in Japanese yen, which is the currency of the
primary economic environment of SoftBank Group Corp. (“functional currency”), and yen amounts are
rounded to the nearest million.
The translations of Japanese yen amounts into U.S. dollar amounts are included solely for the convenience
of readers outside Japan and have been made at the rate of ¥112.19 to $1, the approximate rate of exchange
at March 31, 2017. Such translations should not be construed as representations that the Japanese yen
amounts could be converted into U.S. dollars at that or any other rate.
(4) Changes in presentation (Consolidated statement of income)
a. “Gain on sales of shares of associates” which was included in “Other non-operating income (loss)” for
the fiscal year ended March 31, 2016 is separately presented for the fiscal year ended March 31, 2017
since the significance of the amount increased. In order to reflect the change, ¥12,428 million which
was included in “Other non-operating income (loss)” in the consolidated statement of income for the
fiscal year ended March 31, 2016, is reclassified as “Gain on sales of shares of associates.”
b. “Derivative gain (loss)” which was included in “Other non-operating income (loss)” for the fiscal year
ended March 31, 2016 is separately presented for the fiscal year ended March 31, 2017 since the
significance of the amount increased. In order to reflect the change, ¥12,788 million which was
included in “Other non-operating income (loss)” in the consolidated statement of income for the fiscal
year ended March 31, 2016, is reclassified as “Derivative gain (loss).”
c. “Gain (loss) from financial instruments at FVTPL” which was included in “Other non-operating income
(loss)” for the fiscal year ended March 31, 2016 is separately presented for the fiscal year ended March
31, 2017 since the significance of the amount increased. In order to reflect the change, ¥114,377
million which was included in “Other non-operating income (loss)” in the consolidated statement of
income for the fiscal year ended March 31, 2016, is reclassified as “Gain (loss) from financial instru-
ments at FVTPL.”
d. “Dilution gain from changes in equity interest” which was separately presented for the fiscal year
ended March 31, 2016 is included in “Other non-operating income (loss)” for the fiscal year ended
March 31, 2017 since the significance of the amount decreased. In order to reflect the change,
¥14,903 million which was separately presented as “Dilution gain from changes in equity interest” in
the consolidated statement of income for the fiscal year ended March 31, 2016, is included in “Other
non-operating income (loss).”
Notes to Consolidated Financial Statements
SoftBank Group Corp. ANNUAL REPORT 2017 087Trajectory of
the Information RevolutionBringing the Future Forward
EssentialInformation
Management Organization
Corporate Information
Financial Section
(Consolidated statement of cash flows)
a. “Gain on sales of shares of associates” which was included in “Other non-operating loss (income)” in
net cash provided by operating activities for the fiscal year ended March 31, 2016 is separately
presented for the fiscal year ended March 31, 2017 since the significance of the amount increased. In
order to reflect the change, ¥(12,428) million which was included in “Other non-operating loss
(income)” in net cash provided by operating activities in the consolidated statement of cash flows for
the fiscal year ended March 31, 2016, is reclassified as “Gain on sales of shares of associates” in net
cash provided by operating activities.
b. “Derivative (gain) loss” which was included in “Other non-operating loss (income)” in net cash
provided by operating activities for the fiscal year ended March 31, 2016 is separately presented for
the fiscal year ended March 31, 2017 since the significance of the amount increased. In order to reflect
the change, ¥(12,788) million which was included in “Other non-operating loss (income)” in net cash
provided by operating activities in the consolidated statement of cash flows for the fiscal year ended
March 31, 2016, is reclassified as “Derivative (gain) loss” in net cash provided by operating activities.
c. “(Gain) loss from financial instruments at FVTPL” which was included in “Other non-operating loss
(income)” in net cash provided by operating activities for the fiscal year ended March 31, 2016 is
separately presented for the fiscal year ended March 31, 2017 since the significance of the amount
increased. In order to reflect the change, ¥(114,377) million which was included in “Other non-
operating loss (income)” in net cash provided by operating activities in the consolidated statement of
cash flows for the fiscal year ended March 31, 2016, is reclassified as “(Gain) loss from financial
instruments at FVTPL” in net cash provided by operating activities.
d. “Dilution gain from changes in equity interest” which was separately presented in net cash provided
by operating activities for the fiscal year ended March 31, 2016 is included in “Other non-operating
income (loss)” for the fiscal year ended March 31, 2017 since the significance of the amount
decreased. In order to reflect the change, ¥(14,903) million which was separately presented as
“Dilution gain from changes in equity interest” in net cash provided by operating activities in the
consolidated statement of cash flows for the fiscal year ended March 31, 2016, is included in “Other
non-operating loss (income)” in net cash provided by operating activities.
e. “Payments into time deposits” which was included in “Other” in net cash used in investing activities
for the fiscal year ended March 31, 2016 is separately presented for the fiscal year ended March 31,
2017 since the significance of the amount increased. In order to reflect the change, ¥(45,748) million
which was included in “Other” in net cash used in investing activities in the consolidated statement of
cash flows for the fiscal year ended March 31, 2016, is reclassified as “Payments into time deposits” in
net cash used in investing activities.
f. “Proceeds from withdrawal of time deposits” which was included in “Other” in net cash used in
investing activities for the fiscal year ended March 31, 2016 is separately presented for the fiscal year
ended March 31, 2017 since the significance of the amount increased. In order to reflect the change,
¥40,907 million which was included in “Other” in net cash used in investing activities in the consoli-
dated statement of cash flows for the fiscal year ended March 31, 2016, is reclassified as “Proceeds
from withdrawal of time deposits” in net cash used in investing activities.
SoftBank Group Corp. ANNUAL REPORT 2017 088Trajectory of
the Information RevolutionBringing the Future Forward
EssentialInformation
Management Organization
Corporate Information
Financial Section

(5) New standards and interpretations not yet adopted by the CompanyNew standards and interpretations which are newly established or amended before the approval date of the
consolidated financial statements, and are not yet adopted by the Company, and which may have potential
impacts, are as follows. The Company is currently evaluating the potential impacts.
Standard / interpretation Mandatory adoption(From the year beginning) To be adopted by the Group Outline of the new / revised standards
IFRS 9 Financial Instruments January 1, 2018 From the fiscal year ending March 31, 2019
IFRS 9 replaces a part of the previous IAS 39. Main revisions are:to revise classification into measurement categories of financial instruments (amortized costs and fair values) and measurement;
to revise the treatment of changes in fair value of financial liabilities measured at fair value;to revise the eligibility requirement of hedged items and hedging instruments, and requirements related to the effectiveness of the hedge; and
to revise the measurement approach for impairment by introducing an impairment model based on the expected credit loss.
IFRS 15 Revenue from contracts with customers (and clarification to IFRS 15)
January 1, 2018 From the fiscal year ending March 31, 2019
IFRS 15 (clarification to IFRS 15 is included) replaces the previous IAS 11 and IAS 18. Main revisions are:to require revenue recognition by the following five steps:
a. identify the contract with the customer b. identify the performance obligations in the contractc. determine the transaction priced. allocate the transaction price to each performance obligation in the contracte. recognize revenue when (or as) a performance obligation is satisfied
to revise the treatment for contract costs, license and guarantee of products; andto increase the disclosure related to revenue recognition.
IFRS 16 Leases January 1, 2019 From the fiscal year ending March 31, 2020
IFRS 16 replaces the previous IAS 17 and IFRIC 4. Main revisions are:Revision to apply a control model to the identification of leases and distinguishing between leases and service contracts; and
Revision to eliminate lease classification and recognition of assets and liabilities for all leases by the lessee.
IAS 7 (Amendment) Statement of cash flows January 1, 2017 From the fiscal year ending March 31, 2018
Requirement for additional disclosure related to changes in liabilities arising from financing activities.
SoftBank Group Corp. ANNUAL REPORT 2017 089Trajectory of
the Information RevolutionBringing the Future Forward
EssentialInformation
Management Organization
Corporate Information
Financial Section
(6) Definition of company name and abbreviation used in the notesCompany names and abbreviations used in the notes, except as otherwise stated or interpreted differently in
the context, are as follows:
Company name / Abbreviation Definition
“SoftBank Group Corp.” SoftBank Group Corp. (stand-alone basis)The “Company” SoftBank Group Corp. and its subsidiariesEach of the following abbreviations indicates the respective company, and its subsidiaries, if any.
“Arm” Arm Holdings plc “Sprint” Sprint Corporation “Sprint Communications” Sprint Communications, Inc.“Brightstar” Brightstar Global Group Inc.“Clearwire” Clearwire Corporation“Supercell” Supercell Oy“Alibaba” Alibaba Group Holding Limited“GungHo” GungHo Online Entertainment, Inc.“WCP” Wireless City Planning Inc.
3. Significant accounting policiesAccounting policies the Company has adopted have been applied consistently to all periods presented in
these consolidated financial statements.
(1) Basis of consolidationa. Subsidiaries
A subsidiary is an entity that is controlled by SoftBank Group Corp.
The Company controls an entity when the Company is exposed to, or has rights to, variable returns
from its involvement with the entity and has the ability to affect those returns through its power over
the entity.
The subsidiaries’ financial statements are consolidated from the date when control is acquired
(“acquisition date”) until the date when the control is lost.
When necessary, adjustments are made to the financial statements of subsidiaries to bring their
accounting policies in line with those used by the Company.
Non-controlling interests consist of those interests at the acquisition date and any adjustments for
subsequent changes in those interests.
Total comprehensive income of subsidiaries is generally attributed to the owners of the parent and
to the non-controlling interests, even if this results in the non-controlling interests having a deficit
balance.
All intragroup balances and transactions and unrealized gain or loss arising from intragroup
transactions are eliminated on consolidation.
Changes in the Company’s ownership interests in subsidiaries that do not result in the Company
losing control over the subsidiaries are accounted for as equity transactions. The carrying amounts of
the Company’s interests and the non-controlling interests are adjusted to reflect the changes in their
interests in the subsidiaries.
Any difference between the amount by which the non-controlling interests are adjusted and the
fair value of the consideration paid or received is recognized directly in equity and attributed to owners
of the parent.
When SoftBank Group Corp. loses control of a subsidiary, a gain or loss is calculated as the
difference between:
• the aggregate of the fair value of the consideration received and the fair value of any retained
interest; and
• the net carrying amount of the assets (including goodwill), liabilities, and non-controlling interests
of the subsidiary when control is lost.
Any amounts previously recognized in accumulated other comprehensive income in relation to the
former subsidiaries are reclassified to profit or loss.
b. Associates and joint ventures
An associate is an entity over which SoftBank Group Corp. has significant influence in the financial and
operating policy decisions, but does not have control or joint control.
A joint venture is an investment which parties including SoftBank Group Corp. have joint control
based on the contractual arrangement that requires unanimous consent related to significant decisions
of the business activities and have rights to the net assets of the arrangement.
Investments in associates and joint ventures are accounted for using the equity method and are
initially recognized at cost. The investment is adjusted thereafter to recognize the Company’s interest
of the profit or loss and other comprehensive income from the date of acquisition to the date of loss
of significant influence.
However, regarding preferred stock investment in associates, when the feature of preferred stock is
substantively different from common stock, it is not accounted for using the equity method, and it is
designated as financial assets at fair value through profit or loss (“financial assets at FVTPL”). Please
refer to “(4) Financial instruments” in “Note 3. Significant accounting policies” for details.
When the losses of an associate and a joint venture exceed the Company’s interest in the associate
and the joint venture, long-term interests that, in substance, form a part of the net investment in the
company are decreased to zero, and no additional loss is recognized except when the Company incurs
legal or constructive obligations to or makes payments on behalf of the associate and the joint
venture.
SoftBank Group Corp. ANNUAL REPORT 2017 090Trajectory of
the Information RevolutionBringing the Future Forward
EssentialInformation
Management Organization
Corporate Information
Financial Section

Unrealized gains or losses on intercompany transactions with associates and joint ventures are
added to or deducted from the carrying amount of the investments only to the extent of the
Company’s interests in the associates and the joint ventures.
Any excess in the cost of acquisition of an associate and a joint venture over the Company’s
interest of the net fair value of the identifiable assets and liabilities recognized at the date of acquisi-
tion is recognized as goodwill and included within the carrying amount of the investments in associates
and joint ventures.
Because goodwill is not separately recognized, it is not tested for impairment separately. Instead,
the entire carrying amount of the investments in associates and joint ventures, including goodwill, is
tested for impairment as a single asset whenever objective evidence indicates that the investment may
be impaired.
The Company applies the equity method to the financial statements of Alibaba, an associate of the
Company, on a three-month time lag, as it is impracticable to conform the reporting period of Alibaba
due to the contract with Alibaba. Adjustments are made for significant transactions or events that
occurred during the intervening period and which were publicly announced by Alibaba.
(2) Business combinationsBusiness combinations are accounted for using the acquisition method at the acquisition date.
The consideration transferred in a business combination is measured as the sum of the assets transferred
by the Company, liabilities assumed by the Company from the former owners of the acquiree, and the fair
value at the acquisition date of the equity interests issued by the Company. Acquisition-related costs are
recognized in profit or loss as incurred.
At the acquisition date, the identifiable assets acquired and the liabilities assumed are recognized at their
fair value, except that:
• deferred tax assets or liabilities and assets or liabilities related to employee benefits are recognized and
measured in accordance with IAS 12 “Income Taxes” and IAS 19 “Employee Benefits,” respectively;
• liabilities or equity instruments related to share-based payment arrangements of the acquiree or
share-based payment arrangements of the Company entered into to replace share-based payment
arrangements of the acquiree are measured in accordance with IFRS 2 “Share-based Payment” at the
acquisition date; and
• assets or disposal groups that are classified as held-for-sale are measured in accordance with IFRS 5
“Non-current Assets Held-for-Sale and Discontinued Operations.”
The excess of the consideration transferred and the amount of any non-controlling interest in the acquiree
over the fair value of the identifiable net assets acquired at the acquisition date is recorded as goodwill. If the
consideration transferred and the amount of any non-controlling interest in the acquiree is less than the fair
value of the identifiable net assets of the acquired subsidiary, the difference is recognized immediately in
profit or loss.
On an acquisition-by-acquisition basis, the Company chooses a measurement basis of non-controlling
interests at either fair value or by the proportionate share of the non-controlling interests in the recognized
amounts of the acquiree’s identifiable net assets. When a business combination is achieved in stages, the
Company’s previously held interest in the acquiree is remeasured at fair value at the acquisition date and the
resulting gain or loss, if any, is recognized in profit or loss.
Amounts arising from changes in the value of interests in the acquiree prior to the acquisition date that
have previously been recognized in other comprehensive income are recognized in profit or loss.
If the initial accounting for a business combination is incomplete by the end of the fiscal year, the
Company reports in its consolidated financial statements provisional amounts for the items for which the
accounting is incomplete. The Company retrospectively adjusts the provisional amounts recognized at the
acquisition date as an adjustment during the measurement period when new information about facts and
circumstances that existed as of the acquisition date and, if known, would have affected the recognized
amounts for the business combination. The measurement period shall not exceed one year from the
acquisition date.
Goodwill arising in business combinations that occurred before the date of transition to IFRSs is carried
over at the carrying amount under the previous accounting principles (Japanese Generally Accepted
Accounting Principles, “JGAAP”) as of the date of transition to IFRSs, and recorded by that amount after an
impairment test.
(3) Foreign currency translationa. Transactions denominated in foreign currencies
The financial statements of each group company are prepared in their functional currency. Transactions
in currencies other than the entity’s functional currency (foreign currencies) are translated at the rates
of exchange prevailing at the dates of the transactions.
Monetary items denominated in foreign currencies are translated into the functional currency at
the rates prevailing at the end of the fiscal year. Non-monetary items carried at fair value that are
denominated in foreign currencies are translated into the functional currency at the rates prevailing at
the date when the fair value was measured.
Exchange differences arising from translation are recognized in profit or loss, except for exchange
differences arising from non-monetary available-for-sale financial assets measured through other
comprehensive income and cash flow hedges are recognized in other comprehensive income.
b. Foreign operations
For the purposes of presenting consolidated financial statements, the assets and liabilities of the
Company’s foreign operations (including goodwill arising from acquisitions and the adjustments of fair
value) are translated into Japanese yen using exchange rates prevailing at the end of the fiscal year.
SoftBank Group Corp. ANNUAL REPORT 2017 091Trajectory of
the Information RevolutionBringing the Future Forward
EssentialInformation
Management Organization
Corporate Information
Financial Section
Income, expenses and cash flows are translated into Japanese yen by using the average exchange
rates for each quarter. When the translated amounts do not approximate the amounts translated by
the exchange rates at the dates of the transactions, the exchange rates at the transaction dates are
used for the translation.
The exchange rates used in the translation are described in “Note 29. Foreign currency exchange rates.”
Exchange differences arising from translating the financial statements of foreign operations are
recognized in other comprehensive income and cumulative differences are included in accumulated
other comprehensive income.
These cumulative differences are reclassified from equity to profit or loss when the Company loses
control or significant influence over the foreign operation.
(4) Financial instrumentsa. Financial instruments
Financial assets and financial liabilities are recognized when the Company becomes a party to the
contract provision of the instrument.
Financial assets and financial liabilities are measured at fair value at initial recognition. Transaction
costs that are directly attributable to the acquisition of financial assets and issuance of financial
liabilities other than financial assets at FVTPL and financial liabilities at fair value through profit or loss
(“financial liabilities at FVTPL”) are added to the fair value of the financial assets or deducted from the
fair value of financial liabilities at initial recognition. Transaction costs directly attributable to the
acquisition of financial assets at FVTPL and financial liabilities at FVTPL are recognized in profit or loss.
b. Non-derivative financial assets
Non-derivative financial assets are classified as “financial assets at FVTPL,” “held-to-maturity invest-
ments,” “loans and receivables,” or “available-for-sale financial assets.” The classification depends on
the nature and purpose of the financial assets and is determined upon initial recognition.
All purchases and sales of financial assets made in a regular way are recognized and derecognized
on a trade date basis. Purchases and sales made in a regular way refer to acquiring or disposing
financial assets under a contract that requires the delivery of assets within a time frame established by
regulation or convention in the marketplace.
(a) Financial assets at FVTPL
Financial assets are classified as “financial assets at FVTPL” when they are held for trading purposes or
designated as financial assets at FVTPL.
Financial assets other than derivatives, which are mainly acquired to be sold in the short-term, are
classified as held for trading purposes.
The Company designates a financial asset as a financial asset at FVTPL upon initial recognition, if:
• the financial assets are managed in accordance with the Company’s documented risk manage-
ment policy or investment strategy; and
• its performance is reviewed on the fair value basis by the Company’s management to make
decisions about the investment plan.
Also, if the Company is required to separate an embedded derivative from its host contract, but is
unable to measure the embedded derivative separately either at acquisition or at the end of a
subsequent financial reporting period, the entire hybrid contract is designated and accounted for as
financial assets at FVTPL.
Subsequent to initial recognition, financial assets at FVTPL are measured at fair value. Gains or
losses arising from changes in fair value, dividend income and interest income are recognized in profit
or loss. Fair value of financial assets at FVTPL is measured in the manner described in “(1)
Categorization by level within the fair value hierarchy” in “Note 26. Fair value of financial
instruments.”
(b) Held-to-maturity investments
Non-derivative financial assets with fixed or determinable payments and fixed maturity dates that the
Company has the positive intent and ability to hold to maturity are classified as “held-to-maturity
investments.”
Subsequent to initial recognition, held-to-maturity investments are measured at amortized cost
using the effective interest method, less any impairment. Interest income based on the effective
interest rate is recognized in profit or loss.
(c) Loans and receivables
Non-derivative financial assets with fixed or determinable payments that are not quoted in an active
market are classified as “loans and receivables.”
Subsequent to initial recognition, loans and receivables are measured at amortized cost using the
effective interest method, less any impairment. Interest income based on the effective interest rate is
recognized in profit or loss.
(d) Available-for-sale financial assets
Non-derivative financial assets are classified as “available-for-sale financial assets,” if:
• they are designated as “available-for-sale financial assets”; or
• they are classified as neither “financial assets at FVTPL,” “held-to-maturity investments,” nor
“loans and receivables.”
Subsequent to initial recognition, available-for-sale financial assets are measured at fair value and
gains or losses arising from changes in fair value are recognized in other comprehensive income. Fair
value of available-for-sale financial assets is measured in the manner described in “(1) Categorization
by level within the fair value hierarchy” in “Note 26. Fair value of financial instruments.” Exchange
differences arising on monetary financial assets classified as available-for-sale financial assets, interest
income calculated using the effective interest method relating to available-for-sale financial assets, and
dividends received are recognized in profit or loss.
SoftBank Group Corp. ANNUAL REPORT 2017 092Trajectory of
the Information RevolutionBringing the Future Forward
EssentialInformation
Management Organization
Corporate Information
Financial Section

(e) Impairment of financial assets
Among financial assets other than those at FVTPL, available-for-sale equity instruments are assessed for
any objective evidence of impairment at the end of the fiscal year and at the end of each quarter, and
the other assets are assessed for any objective evidence of impairment at the end of the fiscal year.
Financial assets are impaired when there is objective evidence that loss events occurred subsequent to
initial recognition of the financial assets and when estimated negative future cash flows of the financial
assets from those events can be reasonably estimated.
For available-for-sale equity instruments, a significant or prolonged decline in the fair value below
the cost is considered to be objective evidence of impairment. In addition, objective evidence of
impairment of all financial assets could include:
• significant financial difficulty of the issuer or borrower;
• breach of contract, such as a default or delinquency in interest or principal payments;
• high possibilities of borrowers’ bankruptcy or entering financial reorganization; or
• disappearance of an active market for the financial assets.
The Company assesses the existence of objective evidence of impairment individually for indepen-
dently significant assets or collectively for assets with no individual significance.
When there is objective evidence of impairment on loans and receivables or held-to-maturity
investments, the difference between the asset’s carrying amount and the present value of estimated
future cash flows, discounted at the original effective interest rate, is recognized in profit or loss as an
impairment loss. The impairment loss is recognized through the use of an allowance account, and the
carrying amount of a loan and receivable is written off against the allowance account when it is
considered uncollectible.
The carrying amount of held-to-maturity investments is reduced by the impairment loss directly. If,
in a subsequent period, the amount of the impairment loss decreases and the decrease can be related
objectively to an event occurring after the impairment was recognized, the previously recognized
impairment loss is reversed through profit or loss to the extent that the carrying amount of the
financial asset does not exceed what the amortized cost would have been, had the impairment not
been recognized.
When there is objective evidence that an available-for-sale financial asset is impaired, previously
recognized accumulated other comprehensive income is transferred to profit or loss. Impairment losses
on equity instruments classified as available-for-sale financial assets are not reversed.
(f) Derecognition of financial assets
The Company derecognizes a financial asset when the contractual rights to the cash flows from the
financial asset expire or when it transfers the financial asset and substantially all the risks and rewards
of ownership of the financial asset.
c. Non-derivative financial liabilities
Non-derivative financial liabilities are classified into “financial liabilities at FVTPL” or “financial liabilities
measured at amortized cost” and the classification is determined at initial recognition.
Non-derivative financial liabilities are classified into “financial liabilities at FVTPL” when the entire
hybrid contract, including more than one embedded derivatives, is designated and accounted for as a
financial liability at FVTPL. Subsequent to initial recognition, liabilities at FVTPL are measured at fair
value and gains or losses arising from changes in fair value and interest costs are recognized in profit or loss.
Financial liabilities measured at amortized cost are measured using the effective interest method,
subsequent to initial recognition.
The Company derecognizes financial liabilities when the Company’s obligations are discharged,
canceled or expired.
d. Derivatives and hedge accounting
(a) Derivatives
The Company is engaged in derivative transactions, including foreign currency forward contracts,
currency swaps, and collar transactions in order to manage its exposure to foreign exchange rate,
interest rate, and share price risks.
Derivatives are initially recognized at fair value at the date the derivative contracts are entered into
and are subsequently measured at their fair values at the end of fiscal year. Changes in the fair value of
derivatives are recognized in profit or loss immediately unless the derivative is designated and effective
as a hedging instrument. Derivative financial assets not designated as hedging instruments are
classified into “financial assets at FVTPL” and derivative financial liabilities not designated as hedging
instruments are classified into “financial liabilities at FVTPL.”
(b) Hedge accounting
The Company designates certain derivative transactions as hedging instruments and accounts for them
as cash flow hedges.
At the inception of the hedge, the Company formally designates and documents the hedge
relationship qualifying for hedge accounting, along with its risk management objectives and its
strategy for undertaking various hedge transactions. At the inception of the hedge and on an ongoing
basis, the Company evaluates whether the hedging instrument is highly effective in offsetting changes
in fair values or cash flows of the relevant hedged item during the underlying period.
The effective portion of changes in the fair value of derivatives that are designated and qualifying
as cash flow hedges is recognized in other comprehensive income and accumulated in equity.
Accumulated other comprehensive income is transferred to profit or loss through a line item relating to
the hedged item in the consolidated statement of income in the periods when the cash flows from the
hedged item affect profit or loss. Any ineffective portion of changes in fair value of derivatives is
recognized immediately in profit or loss.
SoftBank Group Corp. ANNUAL REPORT 2017 093Trajectory of
the Information RevolutionBringing the Future Forward
EssentialInformation
Management Organization
Corporate Information
Financial Section

When the hedged forecasted transaction subsequently results in the recognition of a non-financial
asset or a non-financial liability, the Company removes the associated gains or losses previously
recognized in accumulated other comprehensive income and includes them in the initial amount of the
cost of the non-financial asset or non-financial liability (basis adjustment).
Hedge accounting is discontinued when the Company revokes the hedging relationship, when the
hedging instrument expires or is sold, terminated or exercised or when the hedge no longer meets the
criteria for hedge accounting.
When hedge accounting is discontinued, any gains or losses recognized in accumulated other
comprehensive income remain in equity and are reclassified to profit or loss when the forecasted
transaction is ultimately recognized in profit or loss. When a forecasted transaction is no longer
expected to occur, the gains or losses recognized in accumulated other comprehensive income are
reclassified immediately to profit or loss.
(c) Embedded derivatives
Derivatives embedded in non-derivative host contracts (“embedded derivatives”) are separated from
the host contracts and accounted for as separate derivatives when their economic characteristics and
risks are not closely related to those of the host contracts and the whole financial instruments,
including embedded derivatives, are not measured at FVTPL. If the Company is required to separate an
embedded derivative from its host contract, but is unable to measure the embedded derivative
separately either at acquisition or at the end of a subsequent financial reporting period, the entire
hybrid contract is designated and accounted for as financial assets or financial liabilities at FVTPL.
e. Offsetting financial assets and financial liabilities
Financial assets and financial liabilities are offset, and the net amounts are presented in the consoli-
dated statement of financial position when, and only when, the Company currently has a legally
enforceable right to set off the recognized amounts, and intends either to settle on a net basis or to
realize the assets and settle the liabilities simultaneously.
(5) Cash and cash equivalentsCash and cash equivalents consist of cash, demand deposits and short-term investments with maturities of
three months or less that are readily convertible to cash and subject to insignificant risk of change in value.
(6) InventoriesInventories are stated at the lower of cost or net realizable value. Inventories mainly consist of mobile
handsets and accessories. Their costs comprise all costs of purchase and other costs incurred in bringing the
inventories to their present location and condition. The costs are mainly calculated by the moving-average
method.
Net realizable value is the estimated selling price in the ordinary course of business, less estimated costs
necessary to make the sale.
(7) Property, plant and equipmentProperty, plant and equipment are measured on a historical cost basis, less accumulated depreciation and
accumulated impairment losses. Historical cost includes costs directly attributable to the acquisition of the
asset and the initial estimated costs related to disassembly, retirement and site restoration.
Property, plant and equipment are depreciated mainly using the straight-line method over the estimated
useful lives of each component. The depreciable amount is calculated as the cost of an asset, less its residual
value. Land and construction in progress are not depreciated.
The estimated useful lives of major components of property, plant and equipment are as follows:
Buildings and structures
Buildings . . . . . . . . . . . . . . . . . . . . . . . . . . . . . . . . . . . . . . . . . . . . . . . . . . . . . . .12 - 50 years
Other . . . . . . . . . . . . . . . . . . . . . . . . . . . . . . . . . . . . . . . . . . . . . . . . . . . . . . . . . 5 - 15 years
Telecommunications equipment
Wireless equipment, switching equipment and other network equipment . . . . . . 5 - 30 years
Towers. . . . . . . . . . . . . . . . . . . . . . . . . . . . . . . . . . . . . . . . . . . . . . . . . . . . . . . . .15 - 42 years
Other . . . . . . . . . . . . . . . . . . . . . . . . . . . . . . . . . . . . . . . . . . . . . . . . . . . . . . . . . 5 - 40 years
Furniture, fixtures and equipment
Leased mobile devices . . . . . . . . . . . . . . . . . . . . . . . . . . . . . . . . . . . . . . . . . . . . . 2 - 3 years
Other . . . . . . . . . . . . . . . . . . . . . . . . . . . . . . . . . . . . . . . . . . . . . . . . . . . . . . . . . 4 - 10 years
The depreciation methods, useful lives, and residual values of assets are reviewed at the end of each fiscal
year, and any changes are applied prospectively as a change in accounting estimate.
Assets held under finance leases are depreciated over their estimated useful lives when there is certainty
that ownership will be obtained by the end of the lease term. However, when there is no certainty that
ownership will be obtained by the end of the lease term, assets are depreciated over the shorter of the lease
term or their estimated useful lives.
(8) GoodwillPlease refer to “(2) Business combinations” in “Note 3. Significant accounting policies” for the measurement
of goodwill at initial recognition. Goodwill is measured at cost less accumulated impairment losses.
Goodwill is not amortized, and is tested for impairment when there is an indication of impairment in
cash-generating units or groups of cash-generating units to which goodwill has been allocated, and annually,
regardless of any indication of impairment. Impairment is described in “(11) Impairment of property, plant and
equipment, intangible assets and goodwill” in “Note 3. Significant accounting policies.”
The Company’s policy for goodwill arising from the acquisition of an associate is described in “(1) Basis of
consolidation” in “Note 3. Significant accounting policies.”
SoftBank Group Corp. ANNUAL REPORT 2017 094Trajectory of
the Information RevolutionBringing the Future Forward
EssentialInformation
Management Organization
Corporate Information
Financial Section

(9) Intangible assetsIntangible assets are measured at historical cost, less accumulated amortization and accumulated impairment
losses.
Intangible assets acquired separately are measured at cost upon initial recognition. Intangible assets
acquired in a business combination are recognized separately from goodwill upon initial recognition and are
measured at fair value at the acquisition date. Any internally-generated research and development expendi-
ture is recognized as an expense in the period in which it is incurred, except for expenditures on development
activities eligible for capitalization (internally-generated intangible assets). The amount initially recognized for
internally-generated intangible assets is the sum of the expenditures incurred from the date when the
intangible asset first meets all of the capitalization criteria to the date the development is completed.
There are intangible assets with finite useful lives and intangible assets with indefinite useful lives.
The intangible assets with finite useful lives are amortized over the estimated useful lives. Amortization of
the customer relationships is mainly calculated by the sum-of-the-digits method and intangible assets with
finite useful lives other than customer relationships are amortized by the straight-line method.
The estimated useful lives of major categories of intangible assets with finite useful lives are as follows:
Software
Software related to wireless equipment . . . . . . . . . . . . . . . . . . . . . . . . . . . . . . . 5 - 10 years
Other . . . . . . . . . . . . . . . . . . . . . . . . . . . . . . . . . . . . . . . . . . . . . . . . . . . . . . . . 3 - 5 years
Technologies . . . . . . . . . . . . . . . . . . . . . . . . . . . . . . . . . . . . . . . . . . . . . . . . . . . . . 8 - 20 years
Customer relationships . . . . . . . . . . . . . . . . . . . . . . . . . . . . . . . . . . . . . . . . . . . . . 4 - 24 years
Favorable lease contracts . . . . . . . . . . . . . . . . . . . . . . . . . . . . . . . . . . . . . . . . . . . . 7 - 23 years
Trademarks (with finite useful lives) . . . . . . . . . . . . . . . . . . . . . . . . . . . . . . . . . . . . 8 - 34 years
Spectrum migration costs . . . . . . . . . . . . . . . . . . . . . . . . . . . . . . . . . . . . . . . . . . . 18 years
Other . . . . . . . . . . . . . . . . . . . . . . . . . . . . . . . . . . . . . . . . . . . . . . . . . . . . . . . . . . 5 - 20 years
Amortization methods, useful lives and residual values of assets are reviewed at the end of each fiscal
year, and any changes are applied prospectively as a change in accounting estimate.
Favorable lease contracts are recognized as intangible assets based on the estimated fair value of the
favorable portion of future cash flows if, at the time of business combinations, the terms of operating lease
contracts in which the acquiree is the lessee are favorable compared to market terms.
Spectrum migration costs are the amounts that the Company incurred in connection with the costs arising
from the migration of the existing users from the 900 MHz band, which SoftBank Corp. acquired, to the
other frequency spectrum based on the termination campaign. Useful lives are estimated based on the actual
utilization of the frequency spectrum in the past.
Intangible assets with indefinite useful lives are as follows:
• Licenses using specific frequency spectrum granted by the U.S. Federal Communications Commission
(“FCC licenses”)
• Trademarks (with indefinite useful lives)
As long as the Company acts within the requirements of the regulatory authorities, the renewal and
extension of FCC licenses are reasonably certain at minimal cost. Therefore, it has been determined that FCC
licenses have indefinite useful lives.
The Company determined that “Sprint,” “Boost Mobile” and other trademarks have indefinite useful lives
as they can be legally utilized continuously as long as the business continues and management’s current plans
are to offer services under these trademarks for the foreseeable future.
The intangible assets with indefinite useful lives and the intangible assets that are not yet available for use
are not amortized. The impairment of these assets is described in “(11) Impairment of property, plant and
equipment, intangible assets and goodwill” in “Note 3. Significant accounting policies.”
(10) Leases The assessment of whether an arrangement is a lease or contains a lease is made on a basis of all the facts
and circumstances at the inception of the arrangement.
Leases are classified as finance leases whenever all the risks and rewards of ownership of assets are
substantially transferred to the lessee. All other leases are classified as operating leases. It is determined that
all the risks and rewards of ownership of assets are transferred to the lessee when the lease terms account for
most of the economic useful lives of the assets, or the present values of the total minimum lease payments
are almost equal to the fair values of the assets. The lease terms are the total of the non-cancelable period
and the period which is deemed to be reasonably certain that the renewal option will be exercised at the
inception of the leases.
a. Finance leases
(The Company as lessee)
At inception, the Company initially recognizes finance leases as assets and the lease obligation at the
amount equal to the fair value of the leased property or, if lower, at the present value of the minimum
lease payments.
Subsequent to initial recognition, the accounting policy for assets held under finance leases is
consistent with that of assets that are owned. Lease payments are apportioned between finance cost
and reduction of the lease obligation so as to achieve a constant rate of interest on the remaining
balance of the liability.
b. Operating leases
(The Company as lessee)
Gross operating lease payments are recognized as expenses on a straight-line basis over the relevant
lease terms.
SoftBank Group Corp. ANNUAL REPORT 2017 095Trajectory of
the Information RevolutionBringing the Future Forward
EssentialInformation
Management Organization
Corporate Information
Financial Section

(The Company as lessor)
Gross operating lease incomes are recognized as revenues on a straight-line basis over the relevant
lease terms.
(11) Impairment of property, plant and equipment, intangible assets and goodwilla. Impairment of property, plant and equipment and intangible assets
At the end of the fiscal year, the Company determines whether there is any indication that property,
plant and equipment and intangible assets may be impaired.
If any such indication exists, the recoverable amount of the asset is estimated. When it is not
possible to estimate the recoverable amount of an individual asset, the Company estimates the
recoverable amount of the cash-generating unit to which the asset belongs. A cash-generating unit is
the smallest identifiable group of assets that generates cash inflows that are largely independent of the
cash inflows from other assets or groups of assets.
Intangible assets with indefinite useful lives and intangible assets that are not yet available for use
are tested for impairment annually regardless of whether there is any indication of impairment.
The recoverable amount is the higher of fair value less costs to sell, or value in use. In assessing
value in use, the estimated future cash flows are discounted to their present value using a pre-tax
discount rate that reflects the time value of money and the risks specific to the asset.
If the recoverable amount of an asset or cash-generating unit is estimated to be less than its
carrying amount, the carrying amount of the asset or cash-generating unit is reduced to its recoverable
amount, and an impairment loss is recognized in profit or loss.
At the end of the fiscal year, the Company evaluates whether there is any indication that an
impairment loss recognized in prior years for assets other than goodwill has decreased or extinguished.
If such indication of a reversal of an impairment loss exists, the recoverable amount of the asset or
cash-generating unit is estimated. If the recoverable amount of an asset or cash-generating unit is
estimated to be higher than its carrying amount, a reversal of an impairment loss is recognized, to the
extent that the increased carrying amount does not exceed the lower of the recoverable amount or the
carrying amount (less depreciation and amortization) that would have been recognized, had no
impairment loss been recognized.
b. Impairment of goodwill
At the end of the fiscal year and at the end of each quarter, the Company determines whether there is
any indication that goodwill may be impaired.
Goodwill is allocated to each of the cash-generating units or groups of cash-generating units that
are expected to benefit from the synergies arising from the business combination, and it is tested for
impairment annually, regardless of any indication of impairment, and when there is an indication that
the cash-generating unit or groups of cash-generating units may be impaired. If, at the time of the
impairment test, the recoverable amount of the cash-generating unit or groups of cash-generating
units is less than its carrying amount, the impairment loss is allocated first to reduce the carrying
amount of any goodwill allocated to the cash-generating unit or groups of cash-generating units and
then to the other assets pro rata based on the carrying amount of each asset in the unit or groups of
cash-generating units.
Any impairment loss for goodwill is recognized directly in profit or loss and is not reversed in
subsequent periods.
(12) Retirement benefitsDefined contribution plans are post-employment benefit plans under which an employer pays fixed contribu-
tions into a separate fund and will have no legal or constructive obligations to pay further contributions.
Defined benefit plans are post-employment benefit plans other than defined contribution plans.
The Company primarily adopts defined contribution pension plans.
SoftBank Corp. has frozen its defined benefit lump-sum plans since March 2006 and 2007. Liabilities for
the frozen defined benefit lump-sum plans are recognized as defined benefit liabilities until they are paid in
the form of a lump sum at the time of future retirement of employees.
Sprint has frozen its defined benefit pension plans since December 2005. Liabilities for the defined benefit
pension plans are recognized as defined benefit liabilities until they are paid as pensions after the time of
retirement of employees.
a. Defined contribution plans
Contributions paid for defined contribution plans are recognized as expenses in the period in which
the employees render the related service. Contributions payable are recognized as liabilities.
b. Defined benefit plans
The liability recognized in respect of the defined benefit plans (the defined benefit liability) is the present
value of the defined benefit obligation less the fair value of plan assets at the end of the fiscal year.
The defined benefit obligation is determined by independent actuaries using the projected unit
credit method, and its present value is determined by applying a discount rate based on the yield curve
of high-quality corporate bonds over the approximate period of the benefit payments.
Defined benefit cost includes service cost, net interest on the net defined benefit liability (asset),
and remeasurements of the net defined benefit liability (asset). Service cost and net interest are
recognized in net profit or loss. Net interest is determined using the discount rate described above.
The liabilities for the frozen defined benefit plans are calculated on the basis of retirement benefits
vested at the time the plans were frozen. Therefore, service cost is not incurred for those defined
benefit plans.
The Company’s remeasurements, which comprise actuarial gains and losses and the return on plan
assets (excluding amounts included in net interest), are recognized in other comprehensive income and
transferred to retained earnings immediately from accumulated other comprehensive income.
SoftBank Group Corp. ANNUAL REPORT 2017 096Trajectory of
the Information RevolutionBringing the Future Forward
EssentialInformation
Management Organization
Corporate Information
Financial Section

(13) ProvisionsProvisions are recognized when the Company has a present legal or constructive obligation as a result of a
past event, it is probable that the Company will be required to settle the obligation, and a reliable estimate
can be made of the amount of the obligation.
Provisions are measured using the estimated future cash flows, discounted using a pre-tax rate reflecting
the time value of money and the specific risks of the liability, after taking into account the risks and uncertain-
ties surrounding the obligation at the end of the fiscal year.
The Company recognizes asset retirement obligations, restructuring provisions, provisions for loss on
interest repayment, and provisions for onerous contract as provisions.
Restructuring provisions are recognized when the Company has a detailed formal plan for the restructur-
ing and has raised a valid expectation to those who will be affected that the Company will carry out the
restructuring by starting implementation of the plan or announcing the main features of the plan.
Restructuring provisions are mainly related to network shutdown and backhaul access contracts. The
details of the restructuring provision are described in “Note 23. Provisions.”
Provision for loss on interest repayment is recorded based on an amount representing future expected
claims in order to prepare for future claims by debtors and other, for repayment of interest paid in excess of
the rate permitted under the Interest Rate Restriction Act.
(14) Treasury stockWhen the Company acquires its own equity share capital (“treasury stock”), the consideration paid, including
any directly attributable incremental costs (net of income taxes), is deducted from equity. No gain or loss is
recognized on the purchase, sale, or cancellation of the treasury stock. The difference between the carrying
amount and the consideration on sale is recognized as capital surplus.
(15) Assets or disposal groups classified as held for saleAssets or disposal groups, whose recoveries are expected principally through sale transactions rather than
continuing use, are classified as held for sale when it is probable that the sale will be completed within one
year, they are available for immediate sale in their present condition, and management commits to a plan to
sell.
The Company, when committed to a sale plan involving loss of control of a subsidiary, classifies assets and
liabilities of the subsidiary as held for sale when the above criteria are met, regardless of whether the
Company will retain a non-controlling interest in its former subsidiary after the sale.
Assets classified as held for sale are measured at the lower of the carrying amounts and fair values less
costs to sell and depreciation of property, plant and equipment and amortization of intangible assets are not
conducted after the classification.
(16) Share-based paymentsThe Company grants stock options and restricted stock unit awards as equity-settled share-based compensa-
tion and cash-settled share-based compensation.
Equity-settled share-based compensation is measured at fair value at the grant date. The fair value of
stock options is calculated using the Black-Scholes model and other, and the fair value of restricted stock units
is calculated using the share price at the date of grant.
The fair value determined at the grant date is expensed over the vesting period, based on the estimate of
stock options or restricted stock units that will eventually vest, with a corresponding increase in equity.
The Company regularly reviews the assumptions made and revises estimates of the number of stock
options or restricted stock units that are expected to vest, when necessary.
Cash-settled share-based compensation is accounted for as liabilities and is measured initially at the fair
value of the award. The fair value of the liabilities is remeasured on each closing date and the settlement date,
and changes in fair values are recognized in profit or loss.
(17) RevenueThe Company’s accounting policy for revenue recognition by major categories is as follows:
Domestic Telecommunications segment and Sprint segment
a. Mobile Communications service and sales of mobile handsets
The Company provides mobile telecommunications services, which consist of voice communications
and data transmission to subscribers, and sells mobile handsets and accessories to customers.
In the Mobile Communications service, revenues are mainly generated from basic monthly charges,
telecom service (“revenues from the mobile telecommunications service”) and other fees. Also,
revenues from the sale of mobile handsets (“revenues from the sale of mobile handsets”) are
generated from the sale of mobile handsets and accessories to subscribers or dealers.
The business flow of the above transactions consists of “Indirect sales,” where the Company sells
mobile handsets to dealers and enters into telecommunications services contracts with subscribers
through dealers, and “Direct sales,” where the Company sells mobile handsets to subscribers and
enters into telecommunications services contracts directly with subscribers. The revenues are recog-
nized respectively as follows:
(a) Indirect sales
Revenues from the sale of mobile handsets are recognized when mobile handsets are delivered to
dealers, which is when risk and economic value are deemed to be transferred. Commission fees paid
to dealers related to the sales of mobile handsets are deducted from revenues.
The mobile telecommunications services are recognized as revenue when services are provided to
subscribers. Discounts are deducted from revenues from monthly mobile telecommunications services
as a discount of mobile telecommunications charges.
SoftBank Group Corp. ANNUAL REPORT 2017 097Trajectory of
the Information RevolutionBringing the Future Forward
EssentialInformation
Management Organization
Corporate Information
Financial Section
Activation fees are deferred upon entering into the contract and recognized as revenues over the
estimated average contract period. Upgrade fees are recognized as revenues over the estimated
average usage period of handsets with the subscribers. Direct costs related to activation are deferred to
the extent of the activation fees and upgrade fees and are amortized over the respective same period.
(b) Direct sales
In direct transactions, as the revenue from the sales of mobile handsets and the mobile telecommuni-
cations services, including the fees, are considered to be one transaction, the total amount of revenues
is allocated to mobile handsets and telecommunications service on the basis of the fair value ratio.
When handsets are sold in installments, revenue from the sales of mobile handsets is recognized
based on the fair value ratio when handsets are delivered to the subscribers. When handsets are sold
in lump-sum payment, the maximum amount of revenues to be recognized by the sale of mobile
handsets is set by the amounts to be received from subscribers at the sales of the mobile handsets. The
amount of revenue allocated to the mobile telecommunication services is recognized when the service
is provided to the subscribers.
b. Fixed-line Telecommunications service
In the Fixed-line Telecommunications service, revenues are generated mainly from voice communica-
tions and digital data transmission services, Internet provider charges, ADSL service fees, IP telephony
service fees, and the usage of the network (“revenues from fixed-line telecommunications service”).
Revenues from fixed-line telecommunications services are recognized as revenues when services are
provided to subscribers, based upon fixed monthly charges plus the usage of the network.
Yahoo Japan segment
In the Yahoo Japan segment, revenues are generated mainly from sponsored search advertising, display
advertising, e-commerce related commission fees, revenue from membership and product sales.
Sponsored search advertising revenue is recognized when a visitor to the website clicks the advertise-
ment. Display advertising comprises premium advertising, Yahoo! Display Ad Network (“YDN”) and other
services. Revenue from premium advertising is recognized over a period in which related advertisement is
displayed. Revenue from YDN is recognized when a visitor to the website clicks the advertisement on the
page with the related content. Revenue from e-commerce related commission fees is recognized when the
transaction occurs. Revenue from membership fees is recognized over an effective period of the member-
ship. Revenue from product sales is recognized when the significant risks and rewards of ownership of the
products are transferred to the buyer, the Company retains neither continuing managerial involvement nor
effective control over the products sold, it is probable that the economic benefits associated with the
transaction will flow into the Company, and the costs incurred and the amount of revenue related to the
transaction can be measured reliably.
Distribution segment
In the Distribution segment, revenues are generated mainly from distribution of mobile handsets to
telecommunication service providers and retailers overseas, and sales of PC software, peripherals, and
mobile handset accessories in Japan. Revenue in the Distribution segment is recognized when the
significant risks and rewards of ownership of the products are transferred to the buyer, the Company
retains neither continuing managerial involvement nor effective control over the products sold, it is
probable that the economic benefits associated with the transaction will flow into the Company, and the
costs incurred and the amount of revenue related to the transaction can be measured reliably. For
transactions conducted by the Company on behalf of third parties, revenue is presented on a net basis by
excluding payment to third parties from the total consideration received from customers.
Arm segment
In the Arm segment, revenue is generated mainly from sales of licenses to Arm’s technology and royalties
arising from the resulting sale of licensees’ Arm’s technology-based products.
License revenue is recognized when the significant risks and rewards of ownership of the products are
transferred to the buyer, the Company retains neither continuing managerial involvement nor effective
control over the products sold, it is probable that the economic benefits associated with the transaction
will flow into the Company, and the costs incurred and the amount of revenue related to the transaction
can be measured reliably.
Royalty revenue is earned on sales of products containing Arm’s technology by the Company’s
customers. Royalty revenue is recognized when it is probable that the economic benefits associated with
the transaction will flow into the Company, and the amount of revenue can be reliably measured. Royalty
revenue is recognized on an accrual basis in the quarter in which the customers ship products containing
Arm’s technology, using an estimate based on sales trends and product information.
(18) Sales commission feesThe Company pays sales commission fees when dealers sell the Company’s mobile handsets to subscribers or
acquire and retain engagement of telecommunications service between the Company and subscribers.
Commission fees related to the sales of mobile handsets are deducted from the revenues from the sales of
mobile handsets. Commission fees related to the acquisition and retention of engagement of telecommunica-
tions service are recognized as selling, general and administrative expenses.
(19) Income taxIncome tax expense is composed of current and deferred taxes, and recognized in profit or loss, except for
taxes related to business combinations and items that are recognized in other comprehensive income or
directly in equity.
SoftBank Group Corp. ANNUAL REPORT 2017 098Trajectory of
the Information RevolutionBringing the Future Forward
EssentialInformation
Management Organization
Corporate Information
Financial Section

Current tax is measured at the amount expected to be paid to or recovered from the taxation authorities,
using the tax rates and tax laws that have been enacted or substantively enacted by the end of the fiscal year.
Deferred tax assets are recognized to the extent that it is probable that taxable profits will be available
against which deductible temporary differences, net operating loss carryforwards and tax credit carryforwards
can be utilized. The recoverability of deferred tax assets is reassessed at the end of the fiscal year.
Deferred tax assets are not recognized for temporary differences from initial recognition of assets and
liabilities that do not arise from business combinations and that do not impact accounting profit or taxable
income.
Deferred tax assets are recognized for deductible temporary differences associated with investments in
subsidiaries and associates when it is probable that the temporary difference will reverse in the foreseeable
future and when there will be sufficient taxable profits against which the temporary differences can be
utilized.
Deferred tax liabilities are basically recognized for taxable temporary differences, except for:
• temporary differences arising from the initial recognition of assets and liabilities, and related transactions
other than business combinations, that affect neither the accounting profit nor the taxable profit;
• taxable temporary differences arising from the initial recognition of goodwill; and
• taxable temporary differences associated with investments in subsidiaries and associates, where the
Company is able to control the reversal of the temporary difference and it is probable that the tempo-
rary difference will not reverse in the foreseeable future.
Deferred tax assets and liabilities are measured at the tax rates that are expected to apply to the period
when the asset is realized or the liability is settled, based on tax laws that have been enacted or substantively
enacted by the end of the fiscal year.
Deferred tax assets and liabilities are offset if the Company has a legally enforceable right to set off
current tax assets against current tax liabilities, and income taxes are levied by the same taxation authority on
the same taxable entity.
(20) Earnings per shareBasic earnings per share are calculated by dividing net income attributable to owners of the parent by the
weighted-average number of ordinary shares (after adjusting for treasury stocks) outstanding for the period.
Diluted earnings per share assume full conversion of the issued potential stocks having a dilutive effect,
with an adjustment for net income attributable to owners of the parent and the weighted-average number of
ordinary shares (after adjusting for treasury stocks) outstanding for the period.
4. Significant judgments and estimatesIn preparing consolidated financial statements under IFRSs, management makes judgments, estimates, and
assumptions that affect the application of accounting policies and carrying amounts of assets, liabilities,
revenue, and expenses. These estimates and underlying assumptions are based on management’s best
judgments, through their evaluation of various factors that were considered reasonable as of the period-end,
based on historical experience and by collecting available information. By the nature of its estimates or
assumptions, however, actual results in the future may differ from those projected estimates or assumptions.
Estimates and underlying assumptions are continuously reviewed. Revisions to accounting estimates are
recognized in the period in which the estimate is revised as well as in the future periods. Significant judg-
ments, estimates and assumptions that affect the amounts recognized in the Company’s consolidated
financial statements are as follows:
• judgments of whether an entity is controlled by the Company in determining the scope of consolidation
((1) in “Note 3. Significant accounting policies” and “Note 15. Major subsidiaries”);
• significant judgments for the determination of joint ventures ((1) in “Note 3. Significant accounting
policies” and (3) in “Note 14. Leases”);
• estimates for impairment of investments accounted for using the equity method ((1) in “Note 3.
Significant accounting policies”);
• estimates of fair value of assets acquired and the liabilities assumed in a business combination ((2) in
“Note 3. Significant accounting policies” and “Note 5. Business combinations”);
• fair value measurement of financial assets at FVTPL, financial liabilities at FVTPL, and available-for-sale
financial assets ((4) in “Note 3. Significant accounting policies,” (1) (2) in “Note 26. Fair value of
financial instruments” and “Note 39. Gain and loss from financial instruments at FVTPL”);
• estimates for impairment of financial assets measured at amortized cost ((4) in “Note 3. Significant
accounting policies” and “Note 40. Other non-operating income and loss”);
• estimates of residual value and useful life of property, plant and equipment and intangible assets ((7)
and (9) in “Note 3. Significant accounting policies”);
• judgments and estimates for accounting treatment of contracts including leases ((10) in “Note 3.
Significant accounting policies” and “Note 14. Leases”);
• estimates for impairment of property, plant and equipment, intangible assets and goodwill ((11) in
“Note 3. Significant accounting policies,” “Note 13. Goodwill and intangible assets” and “Note 35.
Other operating income and loss”);
• measurement of defined benefit obligation ((12) in “Note 3. Significant accounting policies” and (2) in
“Note 24. Retirement benefits”);
• judgments and estimates for recognition and measurement on provisions ((13) in “Note 3. Significant
accounting policies” and “Note 23. Provisions”);
• assessment of recoverability of deferred tax assets ((19) in “Note 3. Significant accounting policies” and
(4) in “Note 18. Income taxes”); and
• recognition of liabilities and expenses related to contingencies (“Note 35. Other operating income and
loss” and (b) (3) b. in “Note 46. Contingency”).
Relating to a transaction in which SoftBank Group Corp.’s then wholly-owned subsidiary, SOFTBANK GROUP
SoftBank Group Corp. ANNUAL REPORT 2017 099Trajectory of
the Information RevolutionBringing the Future Forward
EssentialInformation
Management Organization
Corporate Information
Financial Section

CAPITAL APAC PTE. LTD. (“APAC,” currently Foxconn Ventures Pte. Ltd.), sold a portion of its Alibaba shares
to SoftBank Group Corp., SoftBank Group Corp.’s wholly-owned subsidiary West Raptor Holdings, LLC, and
third parties, for the nine-month period ended December 31, 2016, the Company had recognized deferred
tax liabilities of ¥913,012 million ($8,138,087 thousand) on SoftBank Group Corp.’s expected taxable income
for the next fiscal year (April 1, 2017 to March 31, 2018). SoftBank Group Corp. had also recorded deferred
tax assets of ¥60,451 million ($538,827 thousand), as it was deemed probable that, in conjunction with the
transaction, taxable profit would be available against which carryforwards and a deductible temporary
differences could be utilized. However, because ownership of APAC’s outstanding shares was below 50% on
March 31, 2017 and taxable profit was not expected at SoftBank Group Corp. for the next fiscal year, the
Company did not recognize any deferred tax liabilities relating to the transaction for the fiscal year ended
March 2017. In addition, SoftBank Group Corp. did not recognize any deferred tax assets for the fiscal year
ended March 2017, as it was deemed probable that taxable profit would not be available against which
carryforwards and deductible temporary differences could be utilized.
5. Business combinationsFor the fiscal year ended March 31, 2016
(1) ASKUL Corporationa. Overview of consolidation
ASKUL Corporation, an associate of the Company, which primarily conducts mail order services for
office supplies, became the Company’s subsidiary on August 27, 2015 as a result of ASKUL
Corporation’s acquisition of its own treasury stock as resolved by its Board of Directors on May 19,
2015. As a result of ASKUL Corporation’s acquisition of its own treasury stock, the ownership ratio of
ASKUL Corporation’s voting rights held by the Company rose from 41.7% (as of May 20, 2015) to
44.4% (as of August 27, 2015). The Company did not yet hold the majority of the voting rights of
ASKUL Corporation; however, considering relevant facts such as the dispersion of voting rights in
ASKUL Corporation and the voting patterns exercised in ASKUL Corporation’s past shareholders
meetings, the Company determined that it substantially has control of ASKUL Corporation as a
consolidated subsidiary.
b. Summary of the acquiree
Name ASKUL Corporation
Business description Mail-order business for office supplies, such as stationery, other products and services
c. Acquisition date
August 27, 2015
d. Consideration transferred and its components
(Millions of yen)
Acquisition date(August 27, 2015)
Fair value of equity interest in ASKUL Corporation already held at the time of the acquisition . . . . . . . . . . . . . . . . . . . . . . . . . . . . . . . . . . . . . . . . . . . . . . ¥93,611
Total consideration transferred . . . . . . . . . . . . . . . . . . . . . . . . . . . . . . . . . . . A ¥93,611
As a result of the remeasurement of equity interest previously held at the time of the acquisition of
control by the Company in ASKUL Corporation at fair value on the acquisition date, the Company
recognized a gain on the acquisition of ¥59,441 million for the fiscal year ended March 31, 2016. This
gain is presented as “Gain from remeasurement relating to business combination” in the consolidated
statement of income.
e. Fair values of assets and liabilities, non-controlling interests and goodwill on the acquisition date
(Millions of yen)
Acquisition date(August 27, 2015)
Trade and other receivables . . . . . . . . . . . . . . . . . . . . . . . . . . . . . . . . . ¥ 45,365Other current assets . . . . . . . . . . . . . . . . . . . . . . . . . . . . . . . . . . . . . . . 44,751Property, plant and equipment . . . . . . . . . . . . . . . . . . . . . . . . . . . . . . . 32,315Intangible assets . . . . . . . . . . . . . . . . . . . . . . . . . . . . . . . . . . . . . . . . . 69,124Other non-current assets . . . . . . . . . . . . . . . . . . . . . . . . . . . . . . . . . . . 8,394Total assets . . . . . . . . . . . . . . . . . . . . . . . . . . . . . . . . . . . . . . . . . . . . . 199,949
Current liabilities . . . . . . . . . . . . . . . . . . . . . . . . . . . . . . . . . . . . . . . . . 71,495Non-current liabilities . . . . . . . . . . . . . . . . . . . . . . . . . . . . . . . . . . . . . . 34,586Total liabilities . . . . . . . . . . . . . . . . . . . . . . . . . . . . . . . . . . . . . . . . . . . 106,081
Net assets . . . . . . . . . . . . . . . . . . . . . . . . . . . . . . . . . . . . . . . . . . . . . . B 93,868
Non-controlling interests1 . . . . . . . . . . . . . . . . . . . . . . . . . . . . . . . . . . . C 54,036Goodwill2 . . . . . . . . . . . . . . . . . . . . . . . . . . . . . . . . . . . . . . . . . . . . . . . A–(B–C) ¥ 53,779
Notes:1. Non-controlling interests Non-controlling interests in an acquiree that are present ownership interests and entitle their holders to a proportionate share of the
entity’s net assets in the event of liquidation are measured based on the proportionate interests at the acquisition date in the identifiable net assets of the acquiree at the acquisition date.
2. Goodwill Goodwill reflects an excess earning power expected from the future business development and the synergy between the Company
and the acquiree.
SoftBank Group Corp. ANNUAL REPORT 2017 100Trajectory of
the Information RevolutionBringing the Future Forward
EssentialInformation
Management Organization
Corporate Information
Financial Section

f. Proceeds from acquisition of control over subsidiaries
(Millions of yen)
Acquisition date(August 27, 2015)
Cash and cash equivalents held by the acquiree at the acquisition of control . . . . . ¥31,291Proceeds in cash from the acquisition of control over the subsidiary . . . . . . . . . . . . ¥31,291
g. Sales and net income of the acquiree
The amounts of the acquiree’s sales and net income before elimination of inter-company transactions
after the acquisition date, which are recorded in the consolidated statement of income for the fiscal
year ended March 31, 2016, are ¥189,013 million and ¥2,970 million, respectively.
In addition, the above net income includes amortization expenses, which are related to intangible
assets recognized at the acquisition date, and other expenses.
(2) Ikyu Corporationa. Overview of consolidation
The Company, for the purpose of ensuring the effectiveness of growth through the e-Commerce
Revolution, which is strategically important for Yahoo Japan Corporation, has been performing a
tender offer for Ikyu Corporation’s shares, which was resolved at Yahoo Japan Corporation’s Board of
Directors’ meeting held on December 15, 2015. The tender offer ended on February 3, 2016 and then
Yahoo Japan Corporation acquired 27,480,682 shares of Ikyu Corporation’s common shares at
¥94,341 million in cash. Consequently, the Company’s voting rights ratio for Ikyu Corporation has
become 94.3% and Ikyu Corporation has been converted to a consolidated subsidiary.
b. Summary of the acquiree
Name Ikyu Corporation
Business description Operation of various Internet sites that provide reservation services for hotels,
restaurants, and other.
c. Acquisition date
February 3, 2016
d. Consideration transferred and its components
(Millions of yen)
Acquisition date (February 3, 2016)
Payment by cash . . . . . . . . . . . . . . . . . . . . . . . . . . . . . . . . . . . . . . . . . . . . . ¥94,341Total consideration transferred . . . . . . . . . . . . . . . . . . . . . . . . . . . . . . . . . . . A ¥94,341
e. Fair values of assets and liabilities, non-controlling interests and goodwill on the acquisition date
(Millions of yen)
Acquisition date(February 3, 2016)
Current assets . . . . . . . . . . . . . . . . . . . . . . . . . . . . . . . . . . . . . . . . . . . ¥ 8,934Intangible assets . . . . . . . . . . . . . . . . . . . . . . . . . . . . . . . . . . . . . . . . . 26,183Other non-current assets . . . . . . . . . . . . . . . . . . . . . . . . . . . . . . . . . . . 1,130Total assets . . . . . . . . . . . . . . . . . . . . . . . . . . . . . . . . . . . . . . . . . . . . . 36,247
Current liabilities . . . . . . . . . . . . . . . . . . . . . . . . . . . . . . . . . . . . . . . . . 4,270Non-current liabilities . . . . . . . . . . . . . . . . . . . . . . . . . . . . . . . . . . . . . . 8,177Total liabilities . . . . . . . . . . . . . . . . . . . . . . . . . . . . . . . . . . . . . . . . . . . 12,447
Net assets . . . . . . . . . . . . . . . . . . . . . . . . . . . . . . . . . . . . . . . . . . . . . . B 23,800
Non-controlling interests1 . . . . . . . . . . . . . . . . . . . . . . . . . . . . . . . . . . . C 1,503Goodwill2 . . . . . . . . . . . . . . . . . . . . . . . . . . . . . . . . . . . . . . . . . . . . . . . A–(B–C) ¥72,044
Notes:1. Non-controlling interests Non-controlling interests in an acquiree that are present ownership interests and entitle their holders to a proportionate share of the
entity’s net assets in the event of liquidation are measured based on the proportionate interests at the acquisition date in the identifiable net assets of the acquiree at the acquisition date.
2. Goodwill Goodwill reflects an excess earning power expected from the future business development and the synergy between the Company
and the acquiree.
f. Payment for acquisition of control over subsidiaries
(Millions of yen)
Acquisition date(February 3, 2016)
Payment for the acquisition by cash . . . . . . . . . . . . . . . . . . . . . . . . . . . . . . . . . . . . ¥(94,341)Cash and cash equivalents held by the acquiree at the acquisition of control . . . . . . . . . . . . . . . . . . . . . . . . . . . . . 4,016
Payment for the acquisition of control over the subsidiary by cash . . . . . . . . . . . . . ¥(90,325)
g. Sales and net income of the acquiree
The amounts of the acquiree’s sales and net income after the acquisition date are immaterial.
SoftBank Group Corp. ANNUAL REPORT 2017 101Trajectory of
the Information RevolutionBringing the Future Forward
EssentialInformation
Management Organization
Corporate Information
Financial Section

For the fiscal year ended March 31, 2017
(3) Arma. Overview of consolidation
On July 18, 2016 (GMT), the Company and Arm, located in the United Kingdom, entered into an
agreement on the terms of a recommended all cash acquisition of the entire issued and to be issued
share capital of Arm by the Company for a total acquisition price of approximately £24.0 billion
(approximately ¥3.3 trillion) by means of an English court-sanctioned scheme of arrangement
(“Acquisition”). The Acquisition was approved at Arm’s general meeting of shareholders held on
August 30, 2016, and at the English court hearing held on September 1, 2016, and came into effect
on September 5, 2016.
As a result of the transaction, Arm became a wholly-owned subsidiary of the Company.
b. Purpose of consolidation
The Company believes Arm is one of the world’s leading technology companies, with strong capabili-
ties in global semiconductor intellectual property and the “Internet of Things,” and a proven track
record of innovation.
The board and management of the Company believe that the acquisition of Arm by the Company
will deliver the following benefits:
• Support and accelerate Arm’s position as the global leader in intellectual property licensing and
R&D outsourcing for semiconductor companies
The Company’s deep industry expertise and global network of relationships will accelerate
adoption of Arm’s intellectual property across existing and new markets.
• Maintain Arm’s dedication to innovation
The Company intends to sustain Arm’s long-term focus on generating more value per device, and
driving licensing wins and future royalty streams in new growth categories, specifically
“Enterprise and Embedded Intelligence.”
• Increased investment to drive the next wave of innovation
The Company intends to support Arm’s multiple growth initiatives by investing in engineering
talent and complementary acquisitions with the aim of ensuring Arm maintains a R&D edge over
existing and emerging competitors. The Company believes such an investment strategy in
long-term growth will be easier to execute as a non-listed company.
• Shared culture and long-term vision
The Company believes the two companies share the same technology-oriented culture, long-term
vision, focus on innovation and commitment to attracting, developing and retaining top talent.
These common values will be the foundation for the strong strategic partnership necessary to
capture the significant opportunities ahead.
• Maintain and grow the UK’s leadership in science and technology
The Company is investing in the UK as a world leader in science and technology development
and innovation and, as evidence of this, intends to invest in multiple Arm growth initiatives, at
least doubling the number of Arm employees in the UK over the next five years.
c. Summary of Arm
(a) Name Arm Holdings plc
(b) Address 110 Fulbourn Road, Cambridge CB1 9NJ, United Kingdom
(c) Name and title of representative Simon Segars, Chief Executive Officer
(d) Nature of business • Design of microprocessor intellectual property and related technology
• Sale of software tools
(e) Share capital £0.7 million (as of December 31, 2015)
(f) Date of incorporation October 16, 1990
(g) Consolidated net sales £968 million (for the fiscal year ended December 31, 2015 under IFRSs)
d. Acquisition date
September 5, 2016
e. Consideration transferred and the component
(Millions of yen)(Thousands of
U.S. dollars)
Acquisition date (September 5, 2016)
Acquisition date (September 5, 2016)
Payment for the acquisition by cash . . . . . . . . . . . . . . . ¥3,319,137 $29,584,963 Fair value of equity interest in Arm already held at the time of the acquisition . . . . . . . . . . . . . . . . . . . . . . . . 47,867 426,660
Total consideration transferred . . . . . . . . . . . . . . . . . . . A ¥3,367,004 $30,011,623
Acquisition-related costs of ¥25,780 million ($229,789 thousand) arising from the business combina-
tion are recognized in “Other operating loss.”
As a result of the remeasurement of 1.4% equity interest at fair value which was already held by
the Company at the time of the acquisition of control in Arm, the Company recognized a gain of
¥18,168 million ($161,940 thousand) through the step acquisition. This gain is presented as “Gain
from remeasurement relating to business combination” in the consolidated statement of income.
SoftBank Group Corp. ANNUAL REPORT 2017 102Trajectory of
the Information RevolutionBringing the Future Forward
EssentialInformation
Management Organization
Corporate Information
Financial Section
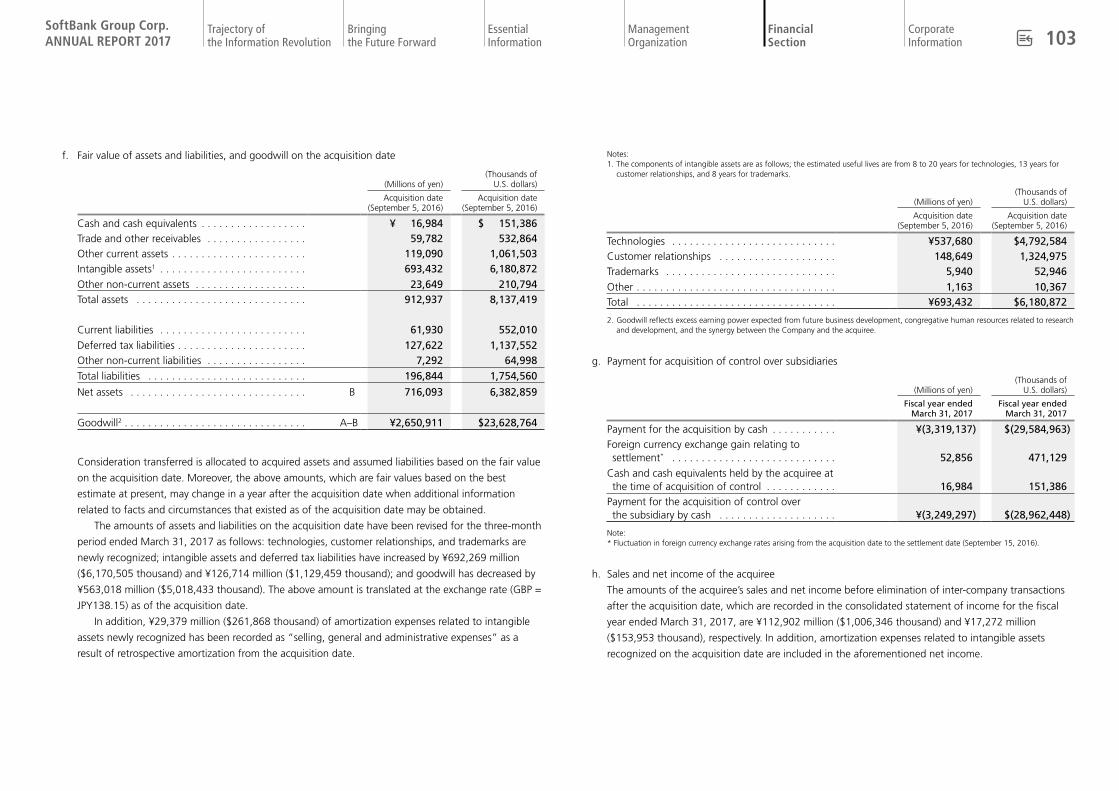
f. Fair value of assets and liabilities, and goodwill on the acquisition date
(Millions of yen)(Thousands of
U.S. dollars)
Acquisition date(September 5, 2016)
Acquisition date(September 5, 2016)
Cash and cash equivalents . . . . . . . . . . . . . . . . . . ¥ 16,984 $ 151,386Trade and other receivables . . . . . . . . . . . . . . . . . 59,782 532,864Other current assets . . . . . . . . . . . . . . . . . . . . . . . 119,090 1,061,503Intangible assets1 . . . . . . . . . . . . . . . . . . . . . . . . . 693,432 6,180,872Other non-current assets . . . . . . . . . . . . . . . . . . . 23,649 210,794Total assets . . . . . . . . . . . . . . . . . . . . . . . . . . . . . 912,937 8,137,419
Current liabilities . . . . . . . . . . . . . . . . . . . . . . . . . 61,930 552,010Deferred tax liabilities . . . . . . . . . . . . . . . . . . . . . . 127,622 1,137,552Other non-current liabilities . . . . . . . . . . . . . . . . . 7,292 64,998Total liabilities . . . . . . . . . . . . . . . . . . . . . . . . . . . 196,844 1,754,560
Net assets . . . . . . . . . . . . . . . . . . . . . . . . . . . . . . B 716,093 6,382,859
Goodwill2 . . . . . . . . . . . . . . . . . . . . . . . . . . . . . . . A–B ¥2,650,911 $23,628,764
Consideration transferred is allocated to acquired assets and assumed liabilities based on the fair value
on the acquisition date. Moreover, the above amounts, which are fair values based on the best
estimate at present, may change in a year after the acquisition date when additional information
related to facts and circumstances that existed as of the acquisition date may be obtained.
The amounts of assets and liabilities on the acquisition date have been revised for the three-month
period ended March 31, 2017 as follows: technologies, customer relationships, and trademarks are
newly recognized; intangible assets and deferred tax liabilities have increased by ¥692,269 million
($6,170,505 thousand) and ¥126,714 million ($1,129,459 thousand); and goodwill has decreased by
¥563,018 million ($5,018,433 thousand). The above amount is translated at the exchange rate (GBP =
JPY138.15) as of the acquisition date.
In addition, ¥29,379 million ($261,868 thousand) of amortization expenses related to intangible
assets newly recognized has been recorded as “selling, general and administrative expenses” as a
result of retrospective amortization from the acquisition date.
Notes:1. The components of intangible assets are as follows; the estimated useful lives are from 8 to 20 years for technologies, 13 years for
customer relationships, and 8 years for trademarks.
(Millions of yen)(Thousands of
U.S. dollars)
Acquisition date (September 5, 2016)
Acquisition date (September 5, 2016)
Technologies . . . . . . . . . . . . . . . . . . . . . . . . . . . . ¥537,680 $4,792,584Customer relationships . . . . . . . . . . . . . . . . . . . . 148,649 1,324,975Trademarks . . . . . . . . . . . . . . . . . . . . . . . . . . . . . 5,940 52,946Other . . . . . . . . . . . . . . . . . . . . . . . . . . . . . . . . . . 1,163 10,367Total . . . . . . . . . . . . . . . . . . . . . . . . . . . . . . . . . . ¥693,432 $6,180,872
2. Goodwill reflects excess earning power expected from future business development, congregative human resources related to research and development, and the synergy between the Company and the acquiree.
g. Payment for acquisition of control over subsidiaries
(Millions of yen)(Thousands of
U.S. dollars)
Fiscal year endedMarch 31, 2017
Fiscal year endedMarch 31, 2017
Payment for the acquisition by cash . . . . . . . . . . . ¥(3,319,137) $(29,584,963)Foreign currency exchange gain relating to settlement* . . . . . . . . . . . . . . . . . . . . . . . . . . . . 52,856 471,129
Cash and cash equivalents held by the acquiree at the time of acquisition of control . . . . . . . . . . . . 16,984 151,386
Payment for the acquisition of control over the subsidiary by cash . . . . . . . . . . . . . . . . . . . . ¥(3,249,297) $(28,962,448)
Note:* Fluctuation in foreign currency exchange rates arising from the acquisition date to the settlement date (September 15, 2016).
h. Sales and net income of the acquiree
The amounts of the acquiree’s sales and net income before elimination of inter-company transactions
after the acquisition date, which are recorded in the consolidated statement of income for the fiscal
year ended March 31, 2017, are ¥112,902 million ($1,006,346 thousand) and ¥17,272 million
($153,953 thousand), respectively. In addition, amortization expenses related to intangible assets
recognized on the acquisition date are included in the aforementioned net income.
SoftBank Group Corp. ANNUAL REPORT 2017 103Trajectory of
the Information RevolutionBringing the Future Forward
EssentialInformation
Management Organization
Corporate Information
Financial Section
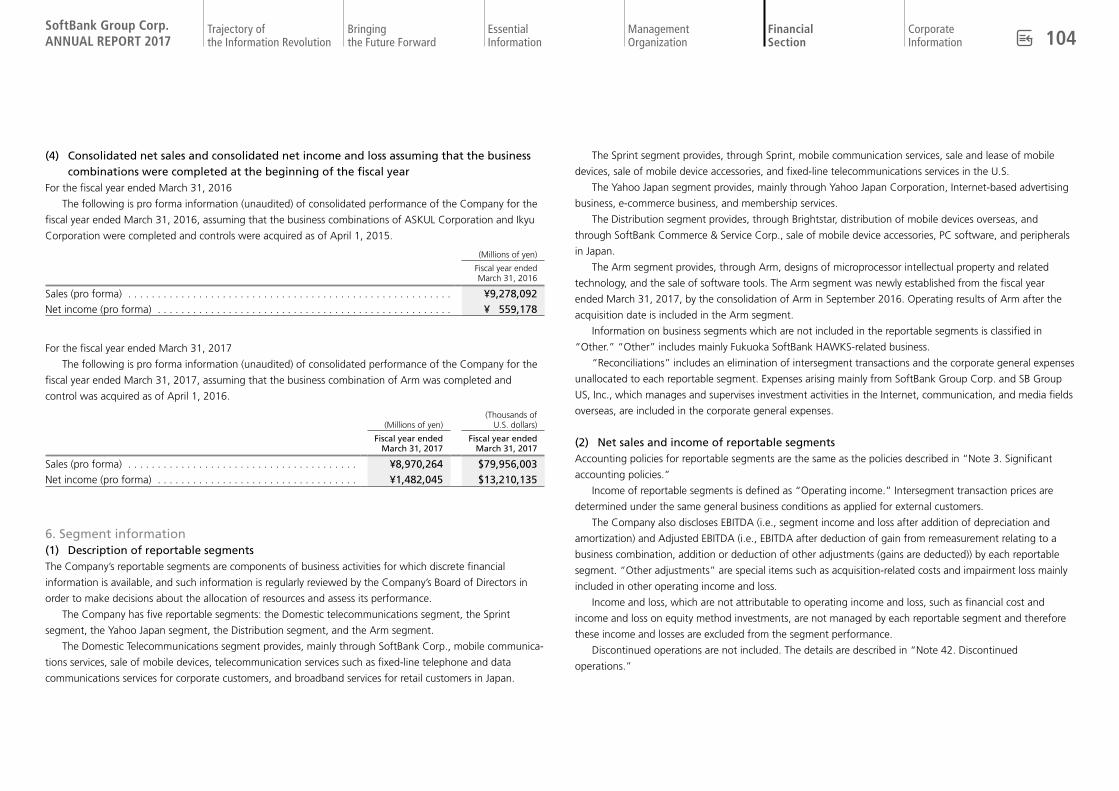
(4) Consolidated net sales and consolidated net income and loss assuming that the business combinations were completed at the beginning of the fiscal year
For the fiscal year ended March 31, 2016
The following is pro forma information (unaudited) of consolidated performance of the Company for the
fiscal year ended March 31, 2016, assuming that the business combinations of ASKUL Corporation and Ikyu
Corporation were completed and controls were acquired as of April 1, 2015.
(Millions of yen)
Fiscal year endedMarch 31, 2016
Sales (pro forma) . . . . . . . . . . . . . . . . . . . . . . . . . . . . . . . . . . . . . . . . . . . . . . . . . . . . . . . ¥9,278,092Net income (pro forma) . . . . . . . . . . . . . . . . . . . . . . . . . . . . . . . . . . . . . . . . . . . . . . . . . . ¥ 559,178
For the fiscal year ended March 31, 2017
The following is pro forma information (unaudited) of consolidated performance of the Company for the
fiscal year ended March 31, 2017, assuming that the business combination of Arm was completed and
control was acquired as of April 1, 2016.
(Millions of yen)(Thousands of
U.S. dollars)
Fiscal year endedMarch 31, 2017
Fiscal year endedMarch 31, 2017
Sales (pro forma) . . . . . . . . . . . . . . . . . . . . . . . . . . . . . . . . . . . . . . . ¥8,970,264 $79,956,003Net income (pro forma) . . . . . . . . . . . . . . . . . . . . . . . . . . . . . . . . . . ¥1,482,045 $13,210,135
6. Segment information(1) Description of reportable segmentsThe Company’s reportable segments are components of business activities for which discrete financial
information is available, and such information is regularly reviewed by the Company’s Board of Directors in
order to make decisions about the allocation of resources and assess its performance.
The Company has five reportable segments: the Domestic telecommunications segment, the Sprint
segment, the Yahoo Japan segment, the Distribution segment, and the Arm segment.
The Domestic Telecommunications segment provides, mainly through SoftBank Corp., mobile communica-
tions services, sale of mobile devices, telecommunication services such as fixed-line telephone and data
communications services for corporate customers, and broadband services for retail customers in Japan.
The Sprint segment provides, through Sprint, mobile communication services, sale and lease of mobile
devices, sale of mobile device accessories, and fixed-line telecommunications services in the U.S.
The Yahoo Japan segment provides, mainly through Yahoo Japan Corporation, Internet-based advertising
business, e-commerce business, and membership services.
The Distribution segment provides, through Brightstar, distribution of mobile devices overseas, and
through SoftBank Commerce & Service Corp., sale of mobile device accessories, PC software, and peripherals
in Japan.
The Arm segment provides, through Arm, designs of microprocessor intellectual property and related
technology, and the sale of software tools. The Arm segment was newly established from the fiscal year
ended March 31, 2017, by the consolidation of Arm in September 2016. Operating results of Arm after the
acquisition date is included in the Arm segment.
Information on business segments which are not included in the reportable segments is classified in
“Other.” “Other” includes mainly Fukuoka SoftBank HAWKS-related business.
“Reconciliations” includes an elimination of intersegment transactions and the corporate general expenses
unallocated to each reportable segment. Expenses arising mainly from SoftBank Group Corp. and SB Group
US, Inc., which manages and supervises investment activities in the Internet, communication, and media fields
overseas, are included in the corporate general expenses.
(2) Net sales and income of reportable segmentsAccounting policies for reportable segments are the same as the policies described in “Note 3. Significant
accounting policies.”
Income of reportable segments is defined as “Operating income.” Intersegment transaction prices are
determined under the same general business conditions as applied for external customers.
The Company also discloses EBITDA (i.e., segment income and loss after addition of depreciation and
amortization) and Adjusted EBITDA (i.e., EBITDA after deduction of gain from remeasurement relating to a
business combination, addition or deduction of other adjustments (gains are deducted)) by each reportable
segment. “Other adjustments” are special items such as acquisition-related costs and impairment loss mainly
included in other operating income and loss.
Income and loss, which are not attributable to operating income and loss, such as financial cost and
income and loss on equity method investments, are not managed by each reportable segment and therefore
these income and losses are excluded from the segment performance.
Discontinued operations are not included. The details are described in “Note 42. Discontinued
operations.”
SoftBank Group Corp. ANNUAL REPORT 2017 104Trajectory of
the Information RevolutionBringing the Future Forward
EssentialInformation
Management Organization
Corporate Information
Financial Section
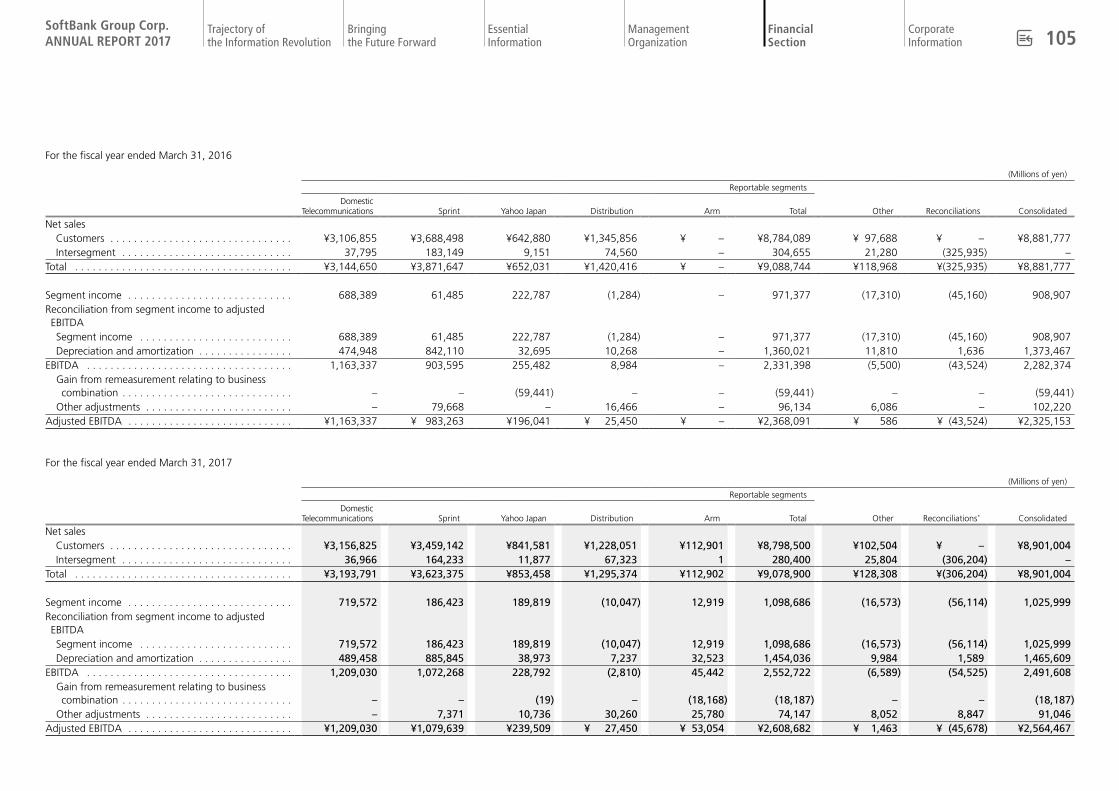
For the fiscal year ended March 31, 2016
(Millions of yen)
Reportable segments
Domestic Telecommunications Sprint Yahoo Japan Distribution Arm Total Other Reconciliations Consolidated
Net salesCustomers . . . . . . . . . . . . . . . . . . . . . . . . . . . . . . . ¥3,106,855 ¥3,688,498 ¥642,880 ¥1,345,856 ¥ – ¥8,784,089 ¥ 97,688 ¥ – ¥8,881,777Intersegment . . . . . . . . . . . . . . . . . . . . . . . . . . . . . 37,795 183,149 9,151 74,560 – 304,655 21,280 (325,935) –
Total . . . . . . . . . . . . . . . . . . . . . . . . . . . . . . . . . . . . . ¥3,144,650 ¥3,871,647 ¥652,031 ¥1,420,416 ¥ – ¥9,088,744 ¥118,968 ¥(325,935) ¥8,881,777
Segment income . . . . . . . . . . . . . . . . . . . . . . . . . . . . 688,389 61,485 222,787 (1,284) – 971,377 (17,310) (45,160) 908,907Reconciliation from segment income to adjusted EBITDASegment income . . . . . . . . . . . . . . . . . . . . . . . . . . 688,389 61,485 222,787 (1,284) – 971,377 (17,310) (45,160) 908,907Depreciation and amortization . . . . . . . . . . . . . . . . 474,948 842,110 32,695 10,268 – 1,360,021 11,810 1,636 1,373,467
EBITDA . . . . . . . . . . . . . . . . . . . . . . . . . . . . . . . . . . . 1,163,337 903,595 255,482 8,984 – 2,331,398 (5,500) (43,524) 2,282,374Gain from remeasurement relating to business combination . . . . . . . . . . . . . . . . . . . . . . . . . . . . . – – (59,441) – – (59,441) – – (59,441)
Other adjustments . . . . . . . . . . . . . . . . . . . . . . . . . – 79,668 – 16,466 – 96,134 6,086 – 102,220Adjusted EBITDA . . . . . . . . . . . . . . . . . . . . . . . . . . . . ¥1,163,337 ¥ 983,263 ¥196,041 ¥ 25,450 ¥ – ¥2,368,091 ¥ 586 ¥ (43,524) ¥2,325,153
For the fiscal year ended March 31, 2017
(Millions of yen)
Reportable segments
Domestic Telecommunications Sprint Yahoo Japan Distribution Arm Total Other Reconciliations* Consolidated
Net salesCustomers . . . . . . . . . . . . . . . . . . . . . . . . . . . . . . . ¥3,156,825 ¥3,459,142 ¥841,581 ¥1,228,051 ¥112,901 ¥8,798,500 ¥102,504 ¥ – ¥8,901,004Intersegment . . . . . . . . . . . . . . . . . . . . . . . . . . . . . 36,966 164,233 11,877 67,323 1 280,400 25,804 (306,204) –
Total . . . . . . . . . . . . . . . . . . . . . . . . . . . . . . . . . . . . . ¥3,193,791 ¥3,623,375 ¥853,458 ¥1,295,374 ¥112,902 ¥9,078,900 ¥128,308 ¥(306,204) ¥8,901,004
Segment income . . . . . . . . . . . . . . . . . . . . . . . . . . . . 719,572 186,423 189,819 (10,047) 12,919 1,098,686 (16,573) (56,114) 1,025,999Reconciliation from segment income to adjusted EBITDASegment income . . . . . . . . . . . . . . . . . . . . . . . . . . 719,572 186,423 189,819 (10,047) 12,919 1,098,686 (16,573) (56,114) 1,025,999Depreciation and amortization . . . . . . . . . . . . . . . . 489,458 885,845 38,973 7,237 32,523 1,454,036 9,984 1,589 1,465,609
EBITDA . . . . . . . . . . . . . . . . . . . . . . . . . . . . . . . . . . . 1,209,030 1,072,268 228,792 (2,810) 45,442 2,552,722 (6,589) (54,525) 2,491,608Gain from remeasurement relating to business combination . . . . . . . . . . . . . . . . . . . . . . . . . . . . . – – (19) – (18,168) (18,187) – – (18,187)
Other adjustments . . . . . . . . . . . . . . . . . . . . . . . . . – 7,371 10,736 30,260 25,780 74,147 8,052 8,847 91,046Adjusted EBITDA . . . . . . . . . . . . . . . . . . . . . . . . . . . . ¥1,209,030 ¥1,079,639 ¥239,509 ¥ 27,450 ¥ 53,054 ¥2,608,682 ¥ 1,463 ¥ (45,678) ¥2,564,467
SoftBank Group Corp. ANNUAL REPORT 2017 105Trajectory of
the Information RevolutionBringing the Future Forward
EssentialInformation
Management Organization
Corporate Information
Financial Section

(Thousands of U.S. dollars)
Reportable segments
Domestic Telecommunications Sprint Yahoo Japan Distribution Arm Total Other Reconciliations* Consolidated
Net salesCustomers . . . . . . . . . . . . . . . . . . . . . . . . . . . . . . . $28,138,203 $30,832,891 $7,501,390 $10,946,172 $1,006,337 $78,424,993 $ 913,665 $ – $79,338,658Intersegment . . . . . . . . . . . . . . . . . . . . . . . . . . . . . 329,495 1,463,882 105,866 600,080 9 2,499,332 230,002 (2,729,334) –
Total . . . . . . . . . . . . . . . . . . . . . . . . . . . . . . . . . . . . . $28,467,698 $32,296,773 $7,607,256 $11,546,252 $1,006,346 $80,924,325 $1,143,667 $(2,729,334) $79,338,658
Segment income . . . . . . . . . . . . . . . . . . . . . . . . . . . . 6,413,869 1,661,672 1,691,942 (89,553) 115,153 9,793,083 (147,723) (500,169) 9,145,191Reconciliation from segment income to adjusted EBITDASegment income . . . . . . . . . . . . . . . . . . . . . . . . . . 6,413,869 1,661,672 1,691,942 (89,553) 115,153 9,793,083 (147,723) (500,169) 9,145,191Depreciation and amortization . . . . . . . . . . . . . . . . 4,362,760 7,895,936 347,384 64,506 289,892 12,960,478 88,992 14,163 13,063,633
EBITDA . . . . . . . . . . . . . . . . . . . . . . . . . . . . . . . . . . . 10,776,629 9,557,608 2,039,326 (25,047) 405,045 22,753,561 (58,731) (486,006) 22,208,824Gain from remeasurement relating to business combination . . . . . . . . . . . . . . . . . . . . . . . . . . . . . – – (169) – (161,940) (162,109) – – (162,109)
Other adjustments . . . . . . . . . . . . . . . . . . . . . . . . . – 65,701 95,695 269,721 229,789 660,906 71,771 78,857 811,534Adjusted EBITDA . . . . . . . . . . . . . . . . . . . . . . . . . . . . $10,776,629 $ 9,623,309 $2,134,852 $ 244,674 $ 472,894 $23,252,358 $ 13,040 $ (407,149) $22,858,249
Note: * ¥8,847 million ($78,857 thousand) of expenses arising from the resignation of Nikesh Arora from his position as a director is included in “Reconciliations” for the fiscal year ended March 31, 2017. The details are described in “(2) Remuneration for major executives” in “Note 45. Related party transactions.”
(3) Geographical informationa. Net sales to external customers
(Millions of yen)(Thousands of
U.S. dollars)
Fiscal year endedMarch 31, 2016
Fiscal year endedMarch 31, 2017
Fiscal year endedMarch 31, 2017
Japan . . . . . . . . . . . . . . . . . . . . . . . . . . . . ¥4,090,986 ¥4,359,888 $38,861,645U.S. . . . . . . . . . . . . . . . . . . . . . . . . . . . . . 4,157,020 3,962,325 35,317,987Other . . . . . . . . . . . . . . . . . . . . . . . . . . . . 633,771 578,791 5,159,026
Total . . . . . . . . . . . . . . . . . . . . . . . . . . . ¥8,881,777 ¥8,901,004 $79,338,658
Sales are categorized based on the location of external customers.
b. Non-current assets (excluding financial assets and deferred tax assets)
(Millions of yen)(Thousands of
U.S. dollars)
As ofMarch 31, 2016
As ofMarch 31, 2017
As ofMarch 31, 2017
Japan . . . . . . . . . . . . . . . . . . . . . . . . . . . . ¥ 4,212,343 ¥ 4,072,675 $ 36,301,587U.S. . . . . . . . . . . . . . . . . . . . . . . . . . . . . . 8,019,523 7,772,859 69,282,993U.K. . . . . . . . . . . . . . . . . . . . . . . . . . . . . . 4,720 3,373,592 30,070,345Other . . . . . . . . . . . . . . . . . . . . . . . . . . . . 188,329 63,051 562,001
Total . . . . . . . . . . . . . . . . . . . . . . . . . . . ¥12,424,915 ¥15,282,177 $136,216,926
SoftBank Group Corp. ANNUAL REPORT 2017 106Trajectory of
the Information RevolutionBringing the Future Forward
EssentialInformation
Management Organization
Corporate Information
Financial Section

7. Cash and cash equivalentsThe components of cash and cash equivalents are as follows:
(Millions of yen)(Thousands of
U.S. dollars)
As ofMarch 31, 2016
As ofMarch 31, 2017
As ofMarch 31, 2017
Cash and demand deposits . . . . . . . . . . . . . . . . ¥1,979,642 ¥1,592,709 $14,196,533Time deposits (maturities of three-month or less) 404,434 411,518 3,668,045MMF . . . . . . . . . . . . . . . . . . . . . . . . . . . . . . . . . 137,390 120,149 1,070,942Other . . . . . . . . . . . . . . . . . . . . . . . . . . . . . . . . . 48,141 58,726 523,451
Total . . . . . . . . . . . . . . . . . . . . . . . . . . . . . . . . ¥2,569,607 ¥2,183,102 $19,458,971
Cash and demand deposits as of March 31, 2016 include ¥120,998 million of cash in trust established for
SoftBank Group Corp.’s acquisition of its own treasury stock (As of March 31, 2017: ¥ zero).
The amount of cash and cash equivalents pledged as collateral for interest-bearing debt or other is
described in “(5) Assets pledged as collateral” in “Note 19. Interest-bearing debt.”
8. Trade and other receivablesThe components of trade and other receivables are as follows:
(Millions of yen)(Thousands of
U.S. dollars)
As ofMarch 31, 2016
As ofMarch 31, 2017
As ofMarch 31, 2017
Trade receivables . . . . . . . . . . . . . . . . . . . . . . . . ¥1,320,862 ¥1,493,857 $13,315,420Installment receivables . . . . . . . . . . . . . . . . . . . . 511,980 537,164 4,787,985Other . . . . . . . . . . . . . . . . . . . . . . . . . . . . . . . . . 127,253 154,031 1,372,948Allowance for doubtful accounts . . . . . . . . . . . . (45,306) (63,433) (565,407)
Total . . . . . . . . . . . . . . . . . . . . . . . . . . . . . . . . ¥1,914,789 ¥2,121,619 $18,910,946
Installment receivables represent receivables arising from the Company’s advance payments to
dealers on behalf of its customers who chose to purchase mobile handsets by installments in indirect
sales. The amounts are charged to customers together with telecommunication service fees over the
periods of installment payments.
The period of installment payments for the receivables above is within 24 months. As such, the
amounts due within a year after the period end date are included in “Trade and other receivables,” and
those after one year are included in “Other financial assets (non-current).”
9. Other financial assetsThe components of other financial assets are as follows:
(Millions of yen)(Thousands of
U.S. dollars)
As ofMarch 31, 2016
As ofMarch 31, 2017
As ofMarch 31, 2017
CurrentMarketable securities . . . . . . . . . . . . . . . . . . . . ¥ 29,596 ¥ 277,895 $ 2,477,003Time deposits (maturities of three-month over) 32,313 458,495 4,086,772Other . . . . . . . . . . . . . . . . . . . . . . . . . . . . . . . . 90,949 58,299 519,646
Total . . . . . . . . . . . . . . . . . . . . . . . . . . . . . . . ¥152,858 ¥ 794,689 $ 7,083,421Non-current
Installment receivables . . . . . . . . . . . . . . . . . . . 175,061 230,495 2,054,506Investment securities . . . . . . . . . . . . . . . . . . . . 650,169 1,106,409 9,861,922Other . . . . . . . . . . . . . . . . . . . . . . . . . . . . . . . . 180,482 247,281 2,204,127Allowance for doubtful accounts . . . . . . . . . . . (34,838) (31,918) (284,500)
Total . . . . . . . . . . . . . . . . . . . . . . . . . . . . . . ¥970,874 ¥1,552,267 $13,836,055
Installment receivables are described in “Note 8. Trade and other receivables.”
10. InventoriesThe components of inventories are as follows:
(Millions of yen)(Thousands of
U.S. dollars)
As ofMarch 31, 2016
As ofMarch 31, 2017
As ofMarch 31, 2017
Merchandise and finished products . . . . . . . . . . ¥333,085 ¥297,077 $2,647,981Other . . . . . . . . . . . . . . . . . . . . . . . . . . . . . . . . . 26,379 44,267 394,572
Total . . . . . . . . . . . . . . . . . . . . . . . . . . . . . . . . ¥359,464 ¥341,344 $3,042,553
SoftBank Group Corp. ANNUAL REPORT 2017 107Trajectory of
the Information RevolutionBringing the Future Forward
EssentialInformation
Management Organization
Corporate Information
Financial Section
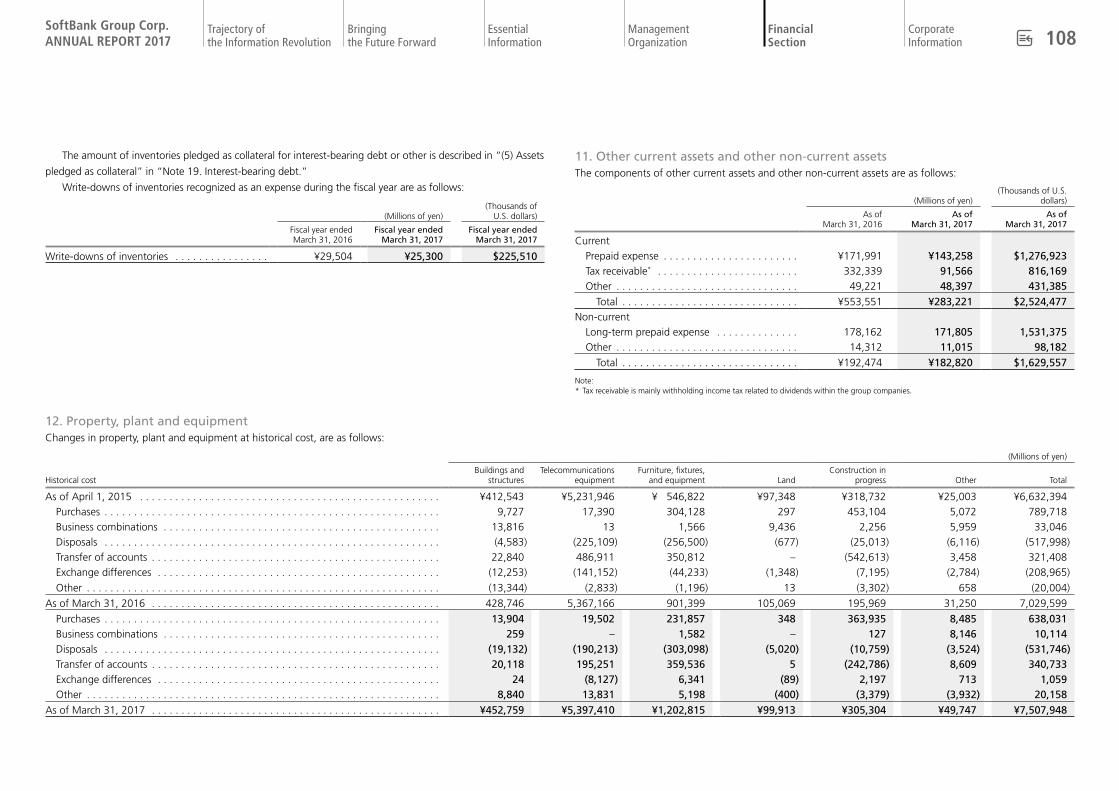
The amount of inventories pledged as collateral for interest-bearing debt or other is described in “(5) Assets
pledged as collateral” in “Note 19. Interest-bearing debt.”
Write-downs of inventories recognized as an expense during the fiscal year are as follows:
(Millions of yen)(Thousands of
U.S. dollars)
Fiscal year endedMarch 31, 2016
Fiscal year endedMarch 31, 2017
Fiscal year endedMarch 31, 2017
Write-downs of inventories . . . . . . . . . . . . . . . . ¥29,504 ¥25,300 $225,510
11. Other current assets and other non-current assetsThe components of other current assets and other non-current assets are as follows:
(Millions of yen)(Thousands of U.S.
dollars)
As ofMarch 31, 2016
As ofMarch 31, 2017
As ofMarch 31, 2017
CurrentPrepaid expense . . . . . . . . . . . . . . . . . . . . . . . ¥171,991 ¥143,258 $1,276,923Tax receivable* . . . . . . . . . . . . . . . . . . . . . . . . 332,339 91,566 816,169Other . . . . . . . . . . . . . . . . . . . . . . . . . . . . . . . 49,221 48,397 431,385
Total . . . . . . . . . . . . . . . . . . . . . . . . . . . . . . ¥553,551 ¥283,221 $2,524,477Non-current
Long-term prepaid expense . . . . . . . . . . . . . . 178,162 171,805 1,531,375Other . . . . . . . . . . . . . . . . . . . . . . . . . . . . . . . 14,312 11,015 98,182
Total . . . . . . . . . . . . . . . . . . . . . . . . . . . . . . ¥192,474 ¥182,820 $1,629,557
Note:* Tax receivable is mainly withholding income tax related to dividends within the group companies.
12. Property, plant and equipmentChanges in property, plant and equipment at historical cost, are as follows:
(Millions of yen)
Historical costBuildings and
structuresTelecommunications
equipmentFurniture, fixtures,
and equipment LandConstruction in
progress Other Total
As of April 1, 2015 . . . . . . . . . . . . . . . . . . . . . . . . . . . . . . . . . . . . . . . . . . . . . . . . . . . ¥412,543 ¥5,231,946 ¥ 546,822 ¥97,348 ¥318,732 ¥25,003 ¥6,632,394Purchases . . . . . . . . . . . . . . . . . . . . . . . . . . . . . . . . . . . . . . . . . . . . . . . . . . . . . . . . . 9,727 17,390 304,128 297 453,104 5,072 789,718Business combinations . . . . . . . . . . . . . . . . . . . . . . . . . . . . . . . . . . . . . . . . . . . . . . . 13,816 13 1,566 9,436 2,256 5,959 33,046Disposals . . . . . . . . . . . . . . . . . . . . . . . . . . . . . . . . . . . . . . . . . . . . . . . . . . . . . . . . . (4,583) (225,109) (256,500) (677) (25,013) (6,116) (517,998)Transfer of accounts . . . . . . . . . . . . . . . . . . . . . . . . . . . . . . . . . . . . . . . . . . . . . . . . . 22,840 486,911 350,812 – (542,613) 3,458 321,408Exchange differences . . . . . . . . . . . . . . . . . . . . . . . . . . . . . . . . . . . . . . . . . . . . . . . . (12,253) (141,152) (44,233) (1,348) (7,195) (2,784) (208,965)
Other . . . . . . . . . . . . . . . . . . . . . . . . . . . . . . . . . . . . . . . . . . . . . . . . . . . . . . . . . . . . (13,344) (2,833) (1,196) 13 (3,302) 658 (20,004)
As of March 31, 2016 . . . . . . . . . . . . . . . . . . . . . . . . . . . . . . . . . . . . . . . . . . . . . . . . . 428,746 5,367,166 901,399 105,069 195,969 31,250 7,029,599
Purchases . . . . . . . . . . . . . . . . . . . . . . . . . . . . . . . . . . . . . . . . . . . . . . . . . . . . . . . . . 13,904 19,502 231,857 348 363,935 8,485 638,031Business combinations . . . . . . . . . . . . . . . . . . . . . . . . . . . . . . . . . . . . . . . . . . . . . . . 259 – 1,582 – 127 8,146 10,114Disposals . . . . . . . . . . . . . . . . . . . . . . . . . . . . . . . . . . . . . . . . . . . . . . . . . . . . . . . . . (19,132) (190,213) (303,098) (5,020) (10,759) (3,524) (531,746)Transfer of accounts . . . . . . . . . . . . . . . . . . . . . . . . . . . . . . . . . . . . . . . . . . . . . . . . . 20,118 195,251 359,536 5 (242,786) 8,609 340,733Exchange differences . . . . . . . . . . . . . . . . . . . . . . . . . . . . . . . . . . . . . . . . . . . . . . . . 24 (8,127) 6,341 (89) 2,197 713 1,059Other . . . . . . . . . . . . . . . . . . . . . . . . . . . . . . . . . . . . . . . . . . . . . . . . . . . . . . . . . . . . 8,840 13,831 5,198 (400) (3,379) (3,932) 20,158
As of March 31, 2017 . . . . . . . . . . . . . . . . . . . . . . . . . . . . . . . . . . . . . . . . . . . . . . . . . ¥452,759 ¥5,397,410 ¥1,202,815 ¥99,913 ¥305,304 ¥49,747 ¥7,507,948
SoftBank Group Corp. ANNUAL REPORT 2017 108Trajectory of
the Information RevolutionBringing the Future Forward
EssentialInformation
Management Organization
Corporate Information
Financial Section

(Thousands of U.S. dollars)
Historical costBuildings and
structuresTelecommunications
equipmentFurniture, fixtures,
and equipment LandConstruction in
progress Other Total
As of March 31, 2016 . . . . . . . . . . . . . . . . . . . . . . . . . . . . . . . . . . . . . . . . . . . . . . . . . $3,821,606 $47,839,968 $ 8,034,576 $936,527 $1,746,760 $278,545 $62,657,982Purchases . . . . . . . . . . . . . . . . . . . . . . . . . . . . . . . . . . . . . . . . . . . . . . . . . . . . . . . . . 123,933 173,830 2,066,646 3,102 3,243,917 75,630 5,687,058Business combinations . . . . . . . . . . . . . . . . . . . . . . . . . . . . . . . . . . . . . . . . . . . . . . . 2,309 – 14,101 – 1,132 72,609 90,151Disposals . . . . . . . . . . . . . . . . . . . . . . . . . . . . . . . . . . . . . . . . . . . . . . . . . . . . . . . . . (170,532) (1,695,454) (2,701,649) (44,746) (95,900) (31,411) (4,739,692)Transfer of accounts . . . . . . . . . . . . . . . . . . . . . . . . . . . . . . . . . . . . . . . . . . . . . . . . . 179,320 1,740,360 3,204,706 45 (2,164,061) 76,737 3,037,107Exchange differences . . . . . . . . . . . . . . . . . . . . . . . . . . . . . . . . . . . . . . . . . . . . . . . . 214 (72,440) 56,520 (793) 19,583 6,355 9,439Other . . . . . . . . . . . . . . . . . . . . . . . . . . . . . . . . . . . . . . . . . . . . . . . . . . . . . . . . . . . . 78,795 123,282 46,332 (3,565) (30,119) (35,048) 179,677
As of March 31, 2017 . . . . . . . . . . . . . . . . . . . . . . . . . . . . . . . . . . . . . . . . . . . . . . . . . $4,035,645 $48,109,546 $10,721,232 $890,570 $2,721,312 $443,417 $66,921,722
Changes in the accumulated depreciation and impairment losses of property, plant and equipment are as follows:
(Millions of yen)
Accumulated depreciation and impairment lossesBuildings and
structuresTelecommunications
equipmentFurniture, fixtures,
and equipment LandConstruction in
progress Other Total
As of April 1, 2015 . . . . . . . . . . . . . . . . . . . . . . . . . . . . . . . . . . . . . . . . . . . . . . . . . . . ¥(144,910) ¥(1,980,273) ¥(181,517) ¥(6) ¥ (387) ¥ (7,853) ¥(2,314,946)Depreciation . . . . . . . . . . . . . . . . . . . . . . . . . . . . . . . . . . . . . . . . . . . . . . . . . . . . . . . (33,650) (618,930) (281,695) – – (5,831) (940,106)Impairment loss . . . . . . . . . . . . . . . . . . . . . . . . . . . . . . . . . . . . . . . . . . . . . . . . . . . . (639) – (1,151) (1) (24,977) (946) (27,714)Disposals . . . . . . . . . . . . . . . . . . . . . . . . . . . . . . . . . . . . . . . . . . . . . . . . . . . . . . . . . 4,105 212,607 92,354 – 23,751 2,665 335,482Transfer of accounts . . . . . . . . . . . . . . . . . . . . . . . . . . . . . . . . . . . . . . . . . . . . . . . . . (16) 1,802 34,828 – – 3 36,617Exchange differences . . . . . . . . . . . . . . . . . . . . . . . . . . . . . . . . . . . . . . . . . . . . . . . . 4,116 48,826 12,471 – 100 1,960 67,473Other . . . . . . . . . . . . . . . . . . . . . . . . . . . . . . . . . . . . . . . . . . . . . . . . . . . . . . . . . . . . (3,183) 355 590 – – (660) (2,898)
As of March 31, 2016 . . . . . . . . . . . . . . . . . . . . . . . . . . . . . . . . . . . . . . . . . . . . . . . . . (174,177) (2,335,613) (324,120) (7) (1,513) (10,662) (2,846,092)Depreciation . . . . . . . . . . . . . . . . . . . . . . . . . . . . . . . . . . . . . . . . . . . . . . . . . . . . . . . (37,248) (557,896) (440,026) – – (6,572) (1,041,742)Impairment loss . . . . . . . . . . . . . . . . . . . . . . . . . . . . . . . . . . . . . . . . . . . . . . . . . . . . (15) – (3,497) – (2,332) – (5,844)Disposals . . . . . . . . . . . . . . . . . . . . . . . . . . . . . . . . . . . . . . . . . . . . . . . . . . . . . . . . . 12,290 161,937 197,339 – 320 1,100 372,986Transfer of accounts . . . . . . . . . . . . . . . . . . . . . . . . . . . . . . . . . . . . . . . . . . . . . . . . . 56 (730) 9,252 – 2 (6) 8,574Exchange differences . . . . . . . . . . . . . . . . . . . . . . . . . . . . . . . . . . . . . . . . . . . . . . . . (197) (5,573) (5,449) (1) 6 (115) (11,329)Other . . . . . . . . . . . . . . . . . . . . . . . . . . . . . . . . . . . . . . . . . . . . . . . . . . . . . . . . . . . . 9,593 (5,439) (8,584) – 390 (3,207) (7,247)
As of March 31, 2017 . . . . . . . . . . . . . . . . . . . . . . . . . . . . . . . . . . . . . . . . . . . . . . . . . ¥(189,698) ¥(2,743,314) ¥(575,085) ¥(8) ¥(3,127) ¥(19,462) ¥(3,530,694)
SoftBank Group Corp. ANNUAL REPORT 2017 109Trajectory of
the Information RevolutionBringing the Future Forward
EssentialInformation
Management Organization
Corporate Information
Financial Section
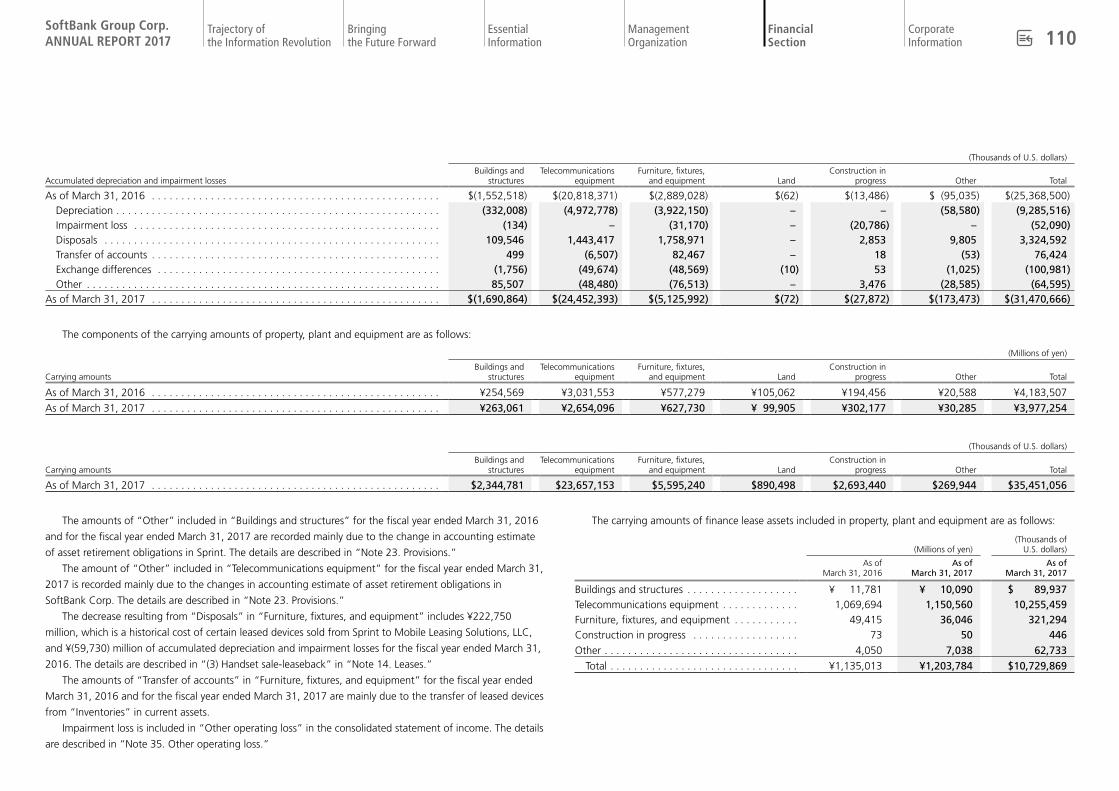
(Thousands of U.S. dollars)
Accumulated depreciation and impairment lossesBuildings and
structuresTelecommunications
equipmentFurniture, fixtures,
and equipment LandConstruction in
progress Other Total
As of March 31, 2016 . . . . . . . . . . . . . . . . . . . . . . . . . . . . . . . . . . . . . . . . . . . . . . . . . $(1,552,518) $(20,818,371) $(2,889,028) $(62) $(13,486) $ (95,035) $(25,368,500)Depreciation . . . . . . . . . . . . . . . . . . . . . . . . . . . . . . . . . . . . . . . . . . . . . . . . . . . . . . . (332,008) (4,972,778) (3,922,150) – – (58,580) (9,285,516)Impairment loss . . . . . . . . . . . . . . . . . . . . . . . . . . . . . . . . . . . . . . . . . . . . . . . . . . . . (134) – (31,170) – (20,786) – (52,090)Disposals . . . . . . . . . . . . . . . . . . . . . . . . . . . . . . . . . . . . . . . . . . . . . . . . . . . . . . . . . 109,546 1,443,417 1,758,971 – 2,853 9,805 3,324,592Transfer of accounts . . . . . . . . . . . . . . . . . . . . . . . . . . . . . . . . . . . . . . . . . . . . . . . . . 499 (6,507) 82,467 – 18 (53) 76,424Exchange differences . . . . . . . . . . . . . . . . . . . . . . . . . . . . . . . . . . . . . . . . . . . . . . . . (1,756) (49,674) (48,569) (10) 53 (1,025) (100,981)Other . . . . . . . . . . . . . . . . . . . . . . . . . . . . . . . . . . . . . . . . . . . . . . . . . . . . . . . . . . . . 85,507 (48,480) (76,513) – 3,476 (28,585) (64,595)
As of March 31, 2017 . . . . . . . . . . . . . . . . . . . . . . . . . . . . . . . . . . . . . . . . . . . . . . . . . $(1,690,864) $(24,452,393) $(5,125,992) $(72) $(27,872) $(173,473) $(31,470,666)
The components of the carrying amounts of property, plant and equipment are as follows:
(Millions of yen)
Carrying amountsBuildings and
structuresTelecommunications
equipmentFurniture, fixtures,
and equipment LandConstruction in
progress Other Total
As of March 31, 2016 . . . . . . . . . . . . . . . . . . . . . . . . . . . . . . . . . . . . . . . . . . . . . . . . . ¥254,569 ¥3,031,553 ¥577,279 ¥105,062 ¥194,456 ¥20,588 ¥4,183,507
As of March 31, 2017 . . . . . . . . . . . . . . . . . . . . . . . . . . . . . . . . . . . . . . . . . . . . . . . . . ¥263,061 ¥2,654,096 ¥627,730 ¥ 99,905 ¥302,177 ¥30,285 ¥3,977,254
(Thousands of U.S. dollars)
Carrying amountsBuildings and
structuresTelecommunications
equipmentFurniture, fixtures,
and equipment LandConstruction in
progress Other Total
As of March 31, 2017 . . . . . . . . . . . . . . . . . . . . . . . . . . . . . . . . . . . . . . . . . . . . . . . . . $2,344,781 $23,657,153 $5,595,240 $890,498 $2,693,440 $269,944 $35,451,056
The amounts of “Other” included in “Buildings and structures” for the fiscal year ended March 31, 2016
and for the fiscal year ended March 31, 2017 are recorded mainly due to the change in accounting estimate
of asset retirement obligations in Sprint. The details are described in “Note 23. Provisions.”
The amount of “Other” included in “Telecommunications equipment” for the fiscal year ended March 31,
2017 is recorded mainly due to the changes in accounting estimate of asset retirement obligations in
SoftBank Corp. The details are described in “Note 23. Provisions.”
The decrease resulting from “Disposals” in “Furniture, fixtures, and equipment” includes ¥222,750
million, which is a historical cost of certain leased devices sold from Sprint to Mobile Leasing Solutions, LLC,
and ¥(59,730) million of accumulated depreciation and impairment losses for the fiscal year ended March 31,
2016. The details are described in “(3) Handset sale-leaseback” in “Note 14. Leases.”
The amounts of “Transfer of accounts” in “Furniture, fixtures, and equipment” for the fiscal year ended
March 31, 2016 and for the fiscal year ended March 31, 2017 are mainly due to the transfer of leased devices
from “Inventories” in current assets.
Impairment loss is included in “Other operating loss” in the consolidated statement of income. The details
are described in “Note 35. Other operating loss.”
The carrying amounts of finance lease assets included in property, plant and equipment are as follows:
(Millions of yen)(Thousands of
U.S. dollars)
As ofMarch 31, 2016
As ofMarch 31, 2017
As ofMarch 31, 2017
Buildings and structures . . . . . . . . . . . . . . . . . . . ¥ 11,781 ¥ 10,090 $ 89,937Telecommunications equipment . . . . . . . . . . . . . 1,069,694 1,150,560 10,255,459Furniture, fixtures, and equipment . . . . . . . . . . . 49,415 36,046 321,294Construction in progress . . . . . . . . . . . . . . . . . . 73 50 446Other . . . . . . . . . . . . . . . . . . . . . . . . . . . . . . . . . 4,050 7,038 62,733
Total . . . . . . . . . . . . . . . . . . . . . . . . . . . . . . . . ¥1,135,013 ¥1,203,784 $10,729,869
SoftBank Group Corp. ANNUAL REPORT 2017 110Trajectory of
the Information RevolutionBringing the Future Forward
EssentialInformation
Management Organization
Corporate Information
Financial Section

Finance lease obligations of the Company are pledged through the lessor’s retaining the property right of
lease assets.
The amount of property, plant and equipment pledged as collateral for interest-bearing debt or other is
described in “(5) Assets pledged as collateral” in “Note 19. Interest-bearing debt.”
Assets with limited property rights due to installment purchases are described in “(6) Assets with limited
property rights” in “Note 19. Interest-bearing debt.”
13. Goodwill and intangible assetsChanges in goodwill and intangible assets at historical cost are as follows:
(Millions of yen)
Intangible assets with indefinite useful lives Intangible assets with finite useful lives
Historical cost Goodwill FCC licenses Trademarks Software TechnologiesCustomer
relationshipsFavorable lease
contracts Game titles TrademarksSpectrum
migration costs Other Total
As of April 1, 2015 . . . . . ¥1,673,151 ¥4,320,296 ¥734,655 ¥1,363,940 ¥ – ¥979,860 ¥176,933 ¥192,536 ¥63,210 ¥54,569 ¥168,385 ¥8,054,384Purchases . . . . . . . . . . . – 10,389 – 85,036 – – – – 29 – 186,534 281,988Internal development . . – – – 4,353 – – – – – – 14,446 18,799Business combinations . 128,774 – 30,250 8,797 – 56,680 – – – – 827 96,554Loss of control . . . . . . . (146,032) – – (3,831) – – – (77,796) (47) – (1,766) (83,440)Disposals . . . . . . . . . . . – – – (62,928) – – (307) – (48) – (1,275) (64,558)Transfer of accounts . . . – – (114) 177,792 – – – – 7 62,664 (233,501) 6,848Exchange differences . . (30,072) (269,935) (46,911) (25,021) – (55,663) (11,016) (2,306) (3,909) – (4,024) (418,785)Other . . . . . . . . . . . . . . (158) – – 875 – 228 – – 3 – 1,404 2,510
As of March 31, 2016 . . . 1,625,663 4,060,750 717,880 1,549,013 – 981,105 165,610 112,434 59,245 117,233 131,030 7,894,300Purchases . . . . . . . . . . . – 17,454 – 55,551 – 1,837 – – 22 – 177,169 252,033Internal development . . – – – 5,265 – – – – – – 18,989 24,254Business combinations . 2,659,035 – – 2,142 538,076 149,215 – – 5,946 – 445 695,824Loss of control . . . . . . . (89,834) – – (99) – – – (101,842) – – (241) (102,182)Disposals . . . . . . . . . . . – – – (79,614) – (109) (1,367) – (256) – (1,329) (82,675)Transfer of accounts . . . – – 1 114,764 – 23 – – – – (114,927) (139)Exchange differences . . 26,734 (13,939) (3,625) (1,185) 7,119 (2,968) (758) (10,592) (185) – (867) (27,000)Other . . . . . . . . . . . . . . – 36,386 1 2,405 – 518 – – 56 – (696) 38,670
As of March 31, 2017 . . . ¥4,221,598 ¥4,100,651 ¥714,257 ¥1,648,242 ¥545,195 ¥1,129,621 ¥163,485 ¥ – ¥64,828 ¥117,233 ¥209,573 ¥8,693,085
SoftBank Group Corp. ANNUAL REPORT 2017 111Trajectory of
the Information RevolutionBringing the Future Forward
EssentialInformation
Management Organization
Corporate Information
Financial Section
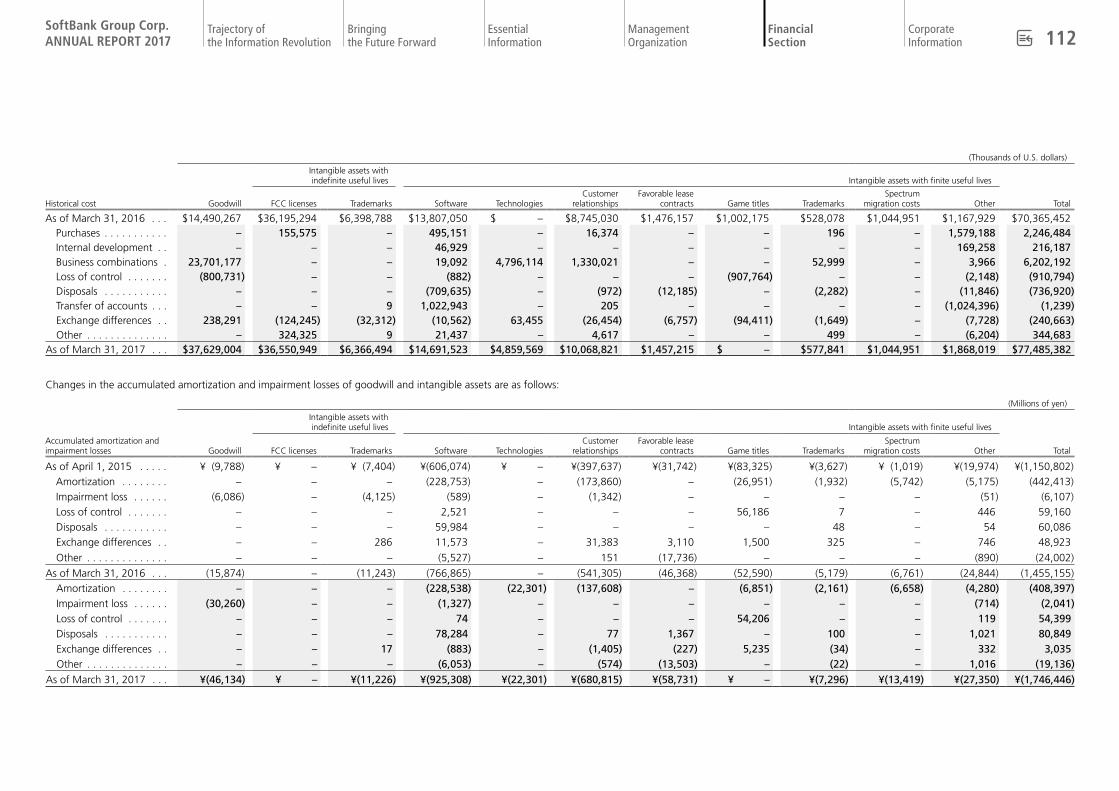
(Thousands of U.S. dollars)
Intangible assets with indefinite useful lives Intangible assets with finite useful lives
Historical cost Goodwill FCC licenses Trademarks Software TechnologiesCustomer
relationshipsFavorable lease
contracts Game titles TrademarksSpectrum
migration costs Other Total
As of March 31, 2016 . . . $14,490,267 $36,195,294 $6,398,788 $13,807,050 $ – $8,745,030 $1,476,157 $1,002,175 $528,078 $1,044,951 $1,167,929 $70,365,452Purchases . . . . . . . . . . . – 155,575 – 495,151 – 16,374 – – 196 – 1,579,188 2,246,484Internal development . . – – – 46,929 – – – – – – 169,258 216,187Business combinations . 23,701,177 – – 19,092 4,796,114 1,330,021 – – 52,999 – 3,966 6,202,192Loss of control . . . . . . . (800,731) – – (882) – – – (907,764) – – (2,148) (910,794)Disposals . . . . . . . . . . . – – – (709,635) – (972) (12,185) – (2,282) – (11,846) (736,920)Transfer of accounts . . . – – 9 1,022,943 – 205 – – – – (1,024,396) (1,239)Exchange differences . . 238,291 (124,245) (32,312) (10,562) 63,455 (26,454) (6,757) (94,411) (1,649) – (7,728) (240,663)Other . . . . . . . . . . . . . . – 324,325 9 21,437 – 4,617 – – 499 – (6,204) 344,683
As of March 31, 2017 . . . $37,629,004 $36,550,949 $6,366,494 $14,691,523 $4,859,569 $10,068,821 $1,457,215 $ – $577,841 $1,044,951 $1,868,019 $77,485,382
Changes in the accumulated amortization and impairment losses of goodwill and intangible assets are as follows:
(Millions of yen)
Intangible assets with indefinite useful lives Intangible assets with finite useful lives
Accumulated amortization and impairment losses Goodwill FCC licenses Trademarks Software Technologies
Customer relationships
Favorable lease contracts Game titles Trademarks
Spectrum migration costs Other Total
As of April 1, 2015 . . . . . ¥ (9,788) ¥ – ¥ (7,404) ¥(606,074) ¥ – ¥(397,637) ¥(31,742) ¥(83,325) ¥(3,627) ¥ (1,019) ¥(19,974) ¥(1,150,802)Amortization . . . . . . . . – – – (228,753) – (173,860) – (26,951) (1,932) (5,742) (5,175) (442,413)Impairment loss . . . . . . (6,086) – (4,125) (589) – (1,342) – – – – (51) (6,107)Loss of control . . . . . . . – – – 2,521 – – – 56,186 7 – 446 59,160Disposals . . . . . . . . . . . – – – 59,984 – – – – 48 – 54 60,086Exchange differences . . – – 286 11,573 – 31,383 3,110 1,500 325 – 746 48,923
Other . . . . . . . . . . . . . . – – – (5,527) – 151 (17,736) – – – (890) (24,002)
As of March 31, 2016 . . . (15,874) – (11,243) (766,865) – (541,305) (46,368) (52,590) (5,179) (6,761) (24,844) (1,455,155)Amortization . . . . . . . . – – – (228,538) (22,301) (137,608) – (6,851) (2,161) (6,658) (4,280) (408,397)Impairment loss . . . . . . (30,260) – – (1,327) – – – – – – (714) (2,041)Loss of control . . . . . . . – – – 74 – – – 54,206 – – 119 54,399Disposals . . . . . . . . . . . – – – 78,284 – 77 1,367 – 100 – 1,021 80,849Exchange differences . . – – 17 (883) – (1,405) (227) 5,235 (34) – 332 3,035Other . . . . . . . . . . . . . . – – – (6,053) – (574) (13,503) – (22) – 1,016 (19,136)
As of March 31, 2017 . . . ¥(46,134) ¥ – ¥(11,226) ¥(925,308) ¥(22,301) ¥(680,815) ¥(58,731) ¥ – ¥(7,296) ¥(13,419) ¥(27,350) ¥(1,746,446)
SoftBank Group Corp. ANNUAL REPORT 2017 112Trajectory of
the Information RevolutionBringing the Future Forward
EssentialInformation
Management Organization
Corporate Information
Financial Section

(Thousands of U.S. dollars)
Intangible assets with indefinite useful lives Intangible assets with finite useful lives
Accumulated amortization and impairment losses Goodwill FCC licenses Trademarks Software Technologies
Customer relationships
Favorable lease contracts Game titles Trademarks
Spectrum migration costs Other Total
As of March 31, 2016 . . . $(141,492) $ – $(100,214) $(6,835,413) $ – $(4,824,895) $(413,299) $(468,758) $(46,163) $ (60,264) $(221,446) $(12,970,452)Amortization . . . . . . . . – – – (2,037,062) (198,779) (1,226,562) – (61,066) (19,262) (59,346) (38,150) (3,640,227)Impairment loss . . . . . . (269,721) – – (11,828) – – – – – – (6,364) (18,192)Loss of control . . . . . . . – – – 660 – – – 483,162 – – 1,061 484,883Disposals . . . . . . . . . . . – – – 697,781 – 686 12,185 – 891 – 9,101 720,644Exchange differences . . – – 152 (7,871) – (12,524) (2,023) 46,662 (303) – 2,959 27,052Other . . . . . . . . . . . . . . – – – (53,954) – (5,116) (120,358) – (196) – 9,056 (170,568)
As of March 31, 2017 . . . $(411,213) $ – $(100,062) $(8,247,687) $(198,779) $(6,068,411) $(523,495) $ – $(65,033) $(119,610) $(243,783) $(15,566,860)
The carrying amounts of goodwill and intangible assets are as follows:
(Millions of yen)
Intangible assets with indefinite useful lives Intangible assets with finite useful lives
Carrying amounts Goodwill FCC licenses Trademarks Software TechnologiesCustomer
relationshipsFavorable lease
contracts Game titles TrademarksSpectrum
migration costs Other Total
As of March 31, 2016 . . . ¥1,609,789 ¥4,060,750 ¥706,637 ¥782,148 ¥ – ¥439,800 ¥119,242 ¥59,844 ¥54,066 ¥110,472 ¥106,186 ¥6,439,145
As of March 31, 2017 . . . ¥4,175,464 ¥4,100,651 ¥703,031 ¥722,934 ¥522,894 ¥448,806 ¥104,754 ¥ – ¥57,532 ¥103,814 ¥182,223 ¥6,946,639
(Thousands of U.S. dollars)
Intangible assets with indefinite useful lives Intangible assets with finite useful lives
Carrying amounts Goodwill FCC licenses Trademarks Software TechnologiesCustomer
relationshipsFavorable lease
contracts Game titles TrademarksSpectrum
migration costs Other Total
As of March 31, 2017 . . . $37,217,791 $36,550,949 $6,266,432 $6,443,836 $4,660,790 $4,000,410 $933,720 $ – $512,808 $925,341 $1,624,236 $61,918,522
“FCC licenses” are licenses to use a specific frequency spectrum granted by the U.S. Federal Communications
Commission (“FCC”). As long as the Company acts within the requirements of regulatory authorities, the
renewal and extension of FCC licenses are reasonably certain at minimal cost. Therefore, it is determined that
FCC licenses have indefinite useful lives.
The Company determined that the “Sprint” and “Boost Mobile” trademarks have indefinite useful lives as
they can be legally utilized continuously as long as the business continues and management’s current plans
are to offer services under these trademarks for the foreseeable future.
Technologies reflect excessive earning capacity in the future expected from technologies of the acquiree
that had been already developed, or was already well-advanced in development, at the time of the business
combinations.
Customer relationships reflect excessive earning capacity in the future expected from the existing
customers of the acquiree at the time of the business combinations.
Favorable lease contracts are recognized as intangible assets based on the estimated fair value of the
favorable portion of future cash flows if, at the time of business combinations, the terms of operating lease
contracts in which the acquiree is the lessee are favorable compared to market terms at acquisition date.
Reversal of favorable lease contracts is recognized as operating lease payments.
Game titles reflect excessive earning capacity in the future expected from the existing game titles of the
acquiree at the time of the business combinations.
Spectrum migration costs are the amounts that the Company incurred in connection with the costs arising
from the migration of the existing users from the 900 MHz band, which SoftBank Corp. acquired, to the
SoftBank Group Corp. ANNUAL REPORT 2017 113Trajectory of
the Information RevolutionBringing the Future Forward
EssentialInformation
Management Organization
Corporate Information
Financial Section
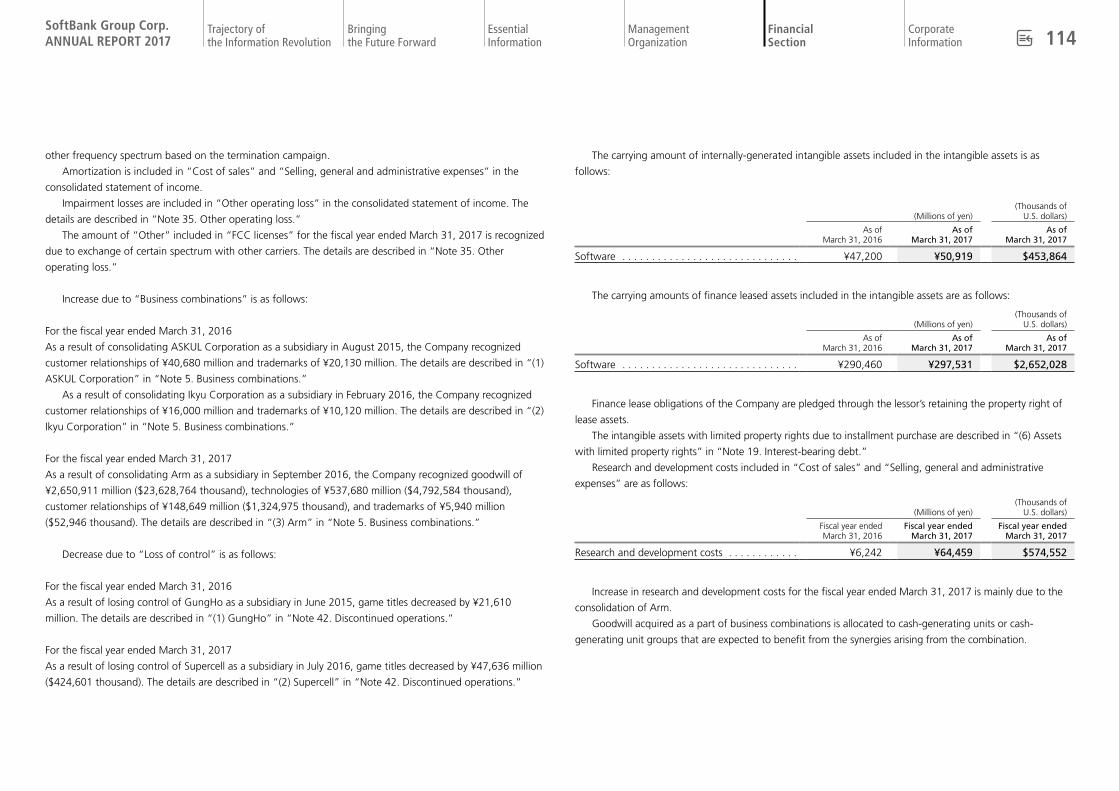
other frequency spectrum based on the termination campaign.
Amortization is included in “Cost of sales” and “Selling, general and administrative expenses” in the
consolidated statement of income.
Impairment losses are included in “Other operating loss” in the consolidated statement of income. The
details are described in “Note 35. Other operating loss.”
The amount of “Other” included in “FCC licenses” for the fiscal year ended March 31, 2017 is recognized
due to exchange of certain spectrum with other carriers. The details are described in “Note 35. Other
operating loss.”
Increase due to “Business combinations” is as follows:
For the fiscal year ended March 31, 2016
As a result of consolidating ASKUL Corporation as a subsidiary in August 2015, the Company recognized
customer relationships of ¥40,680 million and trademarks of ¥20,130 million. The details are described in “(1)
ASKUL Corporation” in “Note 5. Business combinations.”
As a result of consolidating Ikyu Corporation as a subsidiary in February 2016, the Company recognized
customer relationships of ¥16,000 million and trademarks of ¥10,120 million. The details are described in “(2)
Ikyu Corporation” in “Note 5. Business combinations.”
For the fiscal year ended March 31, 2017
As a result of consolidating Arm as a subsidiary in September 2016, the Company recognized goodwill of
¥2,650,911 million ($23,628,764 thousand), technologies of ¥537,680 million ($4,792,584 thousand),
customer relationships of ¥148,649 million ($1,324,975 thousand), and trademarks of ¥5,940 million
($52,946 thousand). The details are described in “(3) Arm” in “Note 5. Business combinations.”
Decrease due to “Loss of control” is as follows:
For the fiscal year ended March 31, 2016
As a result of losing control of GungHo as a subsidiary in June 2015, game titles decreased by ¥21,610
million. The details are described in “(1) GungHo” in “Note 42. Discontinued operations.”
For the fiscal year ended March 31, 2017
As a result of losing control of Supercell as a subsidiary in July 2016, game titles decreased by ¥47,636 million
($424,601 thousand). The details are described in “(2) Supercell” in “Note 42. Discontinued operations.”
The carrying amount of internally-generated intangible assets included in the intangible assets is as
follows:
(Millions of yen)(Thousands of
U.S. dollars)
As ofMarch 31, 2016
As ofMarch 31, 2017
As ofMarch 31, 2017
Software . . . . . . . . . . . . . . . . . . . . . . . . . . . . . . ¥47,200 ¥50,919 $453,864
The carrying amounts of finance leased assets included in the intangible assets are as follows:
(Millions of yen)(Thousands of
U.S. dollars)
As ofMarch 31, 2016
As ofMarch 31, 2017
As ofMarch 31, 2017
Software . . . . . . . . . . . . . . . . . . . . . . . . . . . . . . ¥290,460 ¥297,531 $2,652,028
Finance lease obligations of the Company are pledged through the lessor’s retaining the property right of
lease assets.
The intangible assets with limited property rights due to installment purchase are described in “(6) Assets
with limited property rights” in “Note 19. Interest-bearing debt.”
Research and development costs included in “Cost of sales” and “Selling, general and administrative
expenses” are as follows:
(Millions of yen)(Thousands of
U.S. dollars)
Fiscal year ended March 31, 2016
Fiscal year ended March 31, 2017
Fiscal year ended March 31, 2017
Research and development costs . . . . . . . . . . . . ¥6,242 ¥64,459 $574,552
Increase in research and development costs for the fiscal year ended March 31, 2017 is mainly due to the
consolidation of Arm.
Goodwill acquired as a part of business combinations is allocated to cash-generating units or cash-
generating unit groups that are expected to benefit from the synergies arising from the combination.
SoftBank Group Corp. ANNUAL REPORT 2017 114Trajectory of
the Information RevolutionBringing the Future Forward
EssentialInformation
Management Organization
Corporate Information
Financial Section

Amounts of goodwill and intangible assets with indefinite useful lives allocated to cash-generating units or
cash-generating unit groups are as follows:
Goodwill
(Millions of yen)(Thousands of
U.S. dollars)
Reportable segmentsCash-generating unit orCash-generating unit groups
As ofMarch 31, 2016
As ofMarch 31, 2017
As ofMarch 31, 2017
Domestic Telecommunications SoftBank1 . . . . . . . . ¥ 908,720 ¥ 909,463 $ 8,106,453Sprint Sprint . . . . . . . . . . . 331,811 330,726 2,947,910Yahoo Japan Yahoo2 . . . . . . . . . . 16,519 16,519 147,241
Marketing solution . . 9,821 9,821 87,539Shopping . . . . . . . . 56,600 58,159 518,397Ikyu . . . . . . . . . . . . 72,044 72,044 642,161Settlement finance . . 20,891 20,891 186,211Other . . . . . . . . . . . – 1,524 13,584
Subtotal . . . . . . . 175,875 178,958 1,595,133Distribution Brightstar . . . . . . . . 90,657 60,394 538,319Arm Arm . . . . . . . . . . . . – 2,691,818 23,993,386- Other . . . . . . . . . . . 102,726 4,105 36,590
Total . . . . . . . . . . . . . . . . . . . . . . . . . . . . . . . . ¥1,609,789 ¥4,175,464 $37,217,791
Notes:1. SoftBank comprises SoftBank Corp. and WCP.2. Goodwill is allocated to “Yahoo” because the benefits are expected to be realized from Yahoo Japan as a whole, not from individual cash-
generating units in Yahoo Japan.
Intangible assets with indefinite useful lives
(Millions of yen)(Thousands of
U.S. dollars)
Reportable segments Cash-generating unit As of
March 31, 2016As of
March 31, 2017As of
March 31, 2017
Sprint Sprint . . . . . . . . . . . ¥4,729,506 ¥4,766,499 $42,485,952Yahoo Japan Shopping . . . . . . . . 20,130 20,130 179,428
Ikyu . . . . . . . . . . . . 10,120 10,120 90,204Subtotal . . . . . . . 30,250 30,250 269,632
Distribution Brightstar US and Canada region . . . 3,042 3,030 27,008
Brightstar Asia and Oceania region . . . 1,753 1,613 14,377
Brightstar Europe and Africa region . . . . 2,836 2,290 20,412Subtotal . . . . . . . 7,631 6,933 61,797
Total . . . . . . . . . . . . . . . . . . . . . . . . . . . . . . . . ¥4,767,387 ¥4,803,682 $42,817,381
The recoverable amount of each cash-generating unit or cash-generating unit group is measured as follows:
Value in use: SoftBank, Marketing solution, Shopping, Settlement finance, Ikyu, Brightstar, Brightstar US
and Canada region, Brightstar Latin America region, Brightstar Asia and Oceania region,
Brightstar Europe and Africa region, and SoftBank Commerce & Service Corp.
Fair value less disposal cost: Sprint, Yahoo, and Arm
Value in use is assessed by discounting to the present value the estimated cash flows in the next five years
based on the financial budget approved by the management, which reflects past experience and external
information, using the pre-tax discount rate of 7.21%-16.17% of the cash-generating unit or cash-generating
unit groups (5.12%-22.11% for the fiscal year ended March 31, 2016). The cash flows from after five years
are assumed to increase on the basis of the growth rate of 0%-2.34% (0%-3.81% for the fiscal year ended
March 31, 2016).
In Sprint and Yahoo, the fair value less disposal cost is measured based on active market prices and in
Arm, it is measured by discounting the cash flows which are estimated based on the business plans for the
next 10 years while taking into account the future cash flows that market participants would expect to receive
in accordance with their assumptions discounted to the present value using a post-tax discount rate of 9%.
The cash flows from after 10 years are assumed on the basis of the growth rate of 19% on the 11th year and
10% on the 12th year. The cash flows from the 13th year onward are assumed to increase on the basis of the
growth rate of 2%. Fair value is classified into level 3 as its fair value is measured using unobservable inputs.
Goodwill of Brightstar had been allocated to the entirety of Brightstar (a group of cash-generating units),
which had bundled five cash-generating units (Brightstar’s US & Canada, Latin America, Asia & Oceania,
SoftBank Commerce & Service Corp., and Europe & Africa); however, in March 2017, its goodwill was
reallocated to Brightstar, which bundled four cash-generating units except for SoftBank Commerce & Service
Corp. due to the determination of business reorganization in the Distribution segment. Since impairment
indicators existed, the impairment test was conducted on goodwill and intangible assets with indefinite useful
lives. As a result, the recoverable amount of goodwill was less than its carrying amount and, therefore,
¥30,260 million ($269,721 thousand) of impairment loss on goodwill was recorded. Value in use was used as
the recoverable amount and estimated future cash flow plan of four cash-generating units approved by the
management was calculated using a pre-tax discount rate of 10.97%-16.17%.
Other than the above, as a result of an annual impairment test of goodwill and intangible assets with
indefinite useful lives for cash-generating units or cash-generating unit groups, no impairment loss was recognized.
As a result of reviewing the business plan of Brightstar’s Latin America region, goodwill and intangible
assets with indefinite useful lives were tested for impairment because there was an indication of impairment
for the fiscal year ended March 31, 2016. As a result, the recoverable amount became negative and therefore
the carrying amount of assets related to the cash-generating unit was reduced to zero. Impairment loss on
property, plant and equipment was ¥8,070 million and impairment loss on intangible assets was ¥5,563
million. Value in use was used as the recoverable amount and calculated by discounting management’s
approved estimated future cash flow plan using a pre-tax discount rate of 22.11%. In addition, impairment
loss of ¥6,086 million for goodwill allocated to cash-generating unit groups of Other is recognized.
SoftBank Group Corp. ANNUAL REPORT 2017 115Trajectory of
the Information RevolutionBringing the Future Forward
EssentialInformation
Management Organization
Corporate Information
Financial Section

The Company determined that for cash-generating units or cash-generating unit groups to which the
goodwill and intangible assets with indefinite useful lives are allocated, the recoverable amount is unlikely to
fall below the carrying amount, even if major assumptions used in the impairment test change to a reasonably
foreseeable extent.
14. Leases(1) Finance leases(As lessee)
The Company has leased assets, including wireless equipment, switching equipment, power supply systems
and transmission facilities.
The components of finance lease obligations are as follows:
(Millions of yen)(Thousands of
U.S. dollars)
As ofMarch 31, 2016
As ofMarch 31, 2017
As ofMarch 31, 2017
The total minimum lease paymentsWithin 1 year . . . . . . . . . . . . . . . . . . . . . . . . . ¥ 417,891 ¥ 458,234 $ 4,084,4461 to 5 years . . . . . . . . . . . . . . . . . . . . . . . . . . 836,142 827,253 7,373,679Over 5 years . . . . . . . . . . . . . . . . . . . . . . . . . . 5,542 2,573 22,934
Total . . . . . . . . . . . . . . . . . . . . . . . . . . . . . . 1,259,575 1,288,060 11,481,059Deduction -future financial expense . . . . . . . . . . (47,389) (42,170) (375,880)Present value of finance lease obligations . . . . . . ¥1,212,186 ¥1,245,890 $11,105,179
The components of the present value of finance lease obligations are as follows:
(Millions of yen)(Thousands of
U.S. dollars)
As ofMarch 31, 2016
As ofMarch 31, 2017
As ofMarch 31, 2017
Within 1 year . . . . . . . . . . . . . . . . . . . . . . . . . . . ¥ 396,992 ¥ 438,284 $ 3,906,6231 to 5 years . . . . . . . . . . . . . . . . . . . . . . . . . . . . 809,799 805,085 7,176,085Over 5 years . . . . . . . . . . . . . . . . . . . . . . . . . . . . 5,395 2,521 22,471
Total . . . . . . . . . . . . . . . . . . . . . . . . . . . . . . . . ¥1,212,186 ¥1,245,890 $11,105,179
The outstanding balance by year of maturity of financial lease obligations is described in “(2) Financial risk
management c. Liquidity risk” in “Note 25. Financial instrument.”
Certain lease contracts have financial covenants. Major contents are described in “(3) Financial covenants”
in “Note 19. Interest-bearing debt.”
The components of the future minimum lease payments receivable under non-cancelable subleases are as follows:
(Millions of yen)(Thousands of
U.S. dollars)
As ofMarch 31, 2016
As ofMarch 31, 2017
As ofMarch 31, 2017
Total . . . . . . . . . . . . . . . . . . . . . . . . . . . . . . . . . ¥27,964 ¥28,006 $249,630
(2) Operating leases(As lessee)
The Company leases towers, land and buildings for the placement of telecommunications equipment,
frequency spectrum, and telecommunication lines under operating leases. Certain operating lease contracts
have automatic renewal options and escalation clauses.
In addition to the non-cancelable period, an automatic renewal option is included in the lease term to the
extent that, at the inception of the lease, it is reasonably certain that the option will be exercised. For
operating leases with escalation clauses or a portion of which is free of charge, the total lease payment
amount is amortized over the lease term by the straight line method.
Cell site leases
Cell site leases in the U.S. are generally provided by the cell phone tower operators who provide tower and
ground space to place Sprint-owned antennae, radio, and related equipment. The contract terms generally
provide for an initial non-cancelable term of 5 to 12 years with up to five renewal options for five years each.
At the establishment of the cell sites leases, it is assumed that at least one renewal option is exercised for
contracts less than 10 years.
Cell site leases in Japan contain only land or buildings for the placement of cell sites. Most of the contract
terms are 10 years or 20 years. At the establishment of the cell site leases, it is reasonably certain that they
will be used until the contract term expires.
Spectrum leases (U.S.)
U.S. leased spectrum agreements have renewal options. For those contracts, it is reasonably certain that, at
the inception of the transaction, all the renewal options will be used and terms including renewal terms are
up to 30 years.
The components of the future minimum lease payments related to non-cancelable operating leases are as follows:
(Millions of yen)(Thousands of
U.S. dollars)
As ofMarch 31, 2016
As ofMarch 31, 2017
As ofMarch 31, 2017
Within 1 year . . . . . . . . . . . . . . . . . . . . . . . . . . . ¥ 434,831 ¥ 377,393 $ 3,363,8741 to 5 years . . . . . . . . . . . . . . . . . . . . . . . . . . . . 1,246,531 1,216,504 10,843,248Over 5 years . . . . . . . . . . . . . . . . . . . . . . . . . . . . 1,207,512 1,051,701 9,374,285
Total . . . . . . . . . . . . . . . . . . . . . . . . . . . . . . . . ¥2,888,874 ¥2,645,598 $23,581,407
SoftBank Group Corp. ANNUAL REPORT 2017 116Trajectory of
the Information RevolutionBringing the Future Forward
EssentialInformation
Management Organization
Corporate Information
Financial Section

Operating lease payments recognized as expenses for the fiscal year ended March 31, 2017 totaled
¥494,579 million ($4,408,405 thousand) (for the fiscal year ended March 31, 2016: ¥471,057 million).
(As lessor)
Sprint provides a device leasing program to its qualifying subscribers in the U.S. and SoftBank Corp. provides
device rental service to corporate customers in Japan. The Company classifies substantially all transactions as
operating leases along with the device leasing program and device rental service. At the end of the lease term
of the device leasing program at Sprint, the subscriber has the option to turn in their device, continue leasing
their device, or purchase the device. Since device leases are provided on the condition that subscribers
maintain telecommunication services with the Company, the amount of revenue from these transactions is
separated into the amount of payments to be received for device leases and other elements based on the fair
value of telecommunication service and lease.
The components of the future minimum lease payments receivable under non-cancelable operating leases are
as follows:
(Millions of yen)(Thousands of
U.S. dollars)
As ofMarch 31, 2016
As ofMarch 31, 2017
As ofMarch 31, 2017
Within 1 year . . . . . . . . . . . . . . . . . . . . . . . . . . . ¥292,923 ¥287,176 $2,559,7291 to 5 years . . . . . . . . . . . . . . . . . . . . . . . . . . . . 99,141 54,198 483,091Over 5 years . . . . . . . . . . . . . . . . . . . . . . . . . . . . 1,701 1,097 9,778
Total . . . . . . . . . . . . . . . . . . . . . . . . . . . . . . . . ¥393,765 ¥342,471 $3,052,598
(3) Handset sale-leasebackIn November 2015, Sprint entered into agreements (Handset Sale-Leaseback) to sell and leaseback
certain leased devices, with Mobile Leasing Solutions, LLC (MLS) and conducted the first Handset
Sale-Leaseback transaction (Tranche 1 transaction).
MLS was established for the leasing business by SBLS HD US, Inc. (SBLS), a wholly-owned subsidiary
of SoftBank Group Corp. and JPLS HD US, Inc. (JPLS), a company formed by Japanese leasing compa-
nies. It is contractually agreed that significant management policies and operating decisions of MLS
require the unanimous consent of its Board of Directors designated by SBLS and JPLS. Accordingly, the
Company accounts for MLS under the equity method as a joint venture.
Under this transaction, Sprint sold the devices and transferred the associated certain specified
customer lease end rights and obligations to MLS in exchange for proceeds, and a portion of the
proceeds will be settled at the end of the agreement as a deferred purchase price receivable.
Simultaneously with the sale of the devices and transfer of certain specified customer lease end rights
and obligations, MLS leased back each device to Sprint pursuant to the Master Lease Agreement in
exchange for monthly rental payments to be made by Sprint to MLS. In addition, Brightstar has a
contractual agreement with MLS to provide reverse logistics and remarketing services to MLS with
respect to the devices that are returned to MLS. The terms and conditions of the transaction are
negotiated and determined based on the market price and the content of the transaction.
Sprint derecognized the devices from property, plant and equipment when they were sold to MLS
under the Tranche 1 transaction; however, in December 2016, it terminated the Tranche 1 transaction
by repurchasing the devices and related customer lease end rights and obligations from MLS. As a
result, Sprint recognized the devices, inventories and other totaling $477 million (¥55,548 million) and
$16 million (¥1,826 million) respectively. The impact on the condensed interim consolidated statements
of income from the termination is immaterial.
The future minimum lease payments receivable during the period under the transaction is ¥45,843
million ($408,619 thousand) (for the fiscal year ended March 31, 2016: ¥28,385 million).
Of the transactions, the contractual detail of the second Handset Sale-Leaseback transaction
conducted in May 2016 is different from that of the Tranche 1 transaction and certain risks related to
ownership of the leased devices are not transferred and are retained in Sprint, therefore, borrowings
are recognized as fund procurements utilizing the leased devices.
Outline of the transaction*
Note:* In order to represent the main point of the transaction, the outline shows only the main components related to the transaction and the relation-
ship between the Company and each company in a simplified manner.
Customer
Lease to customers(operating lease)
Subsidiary
Leaseback of the devices
(operating lease)
Sale of the devices
Wholly-owned Subsidiary
MLSSprint
JPLSSBLS
SoftBank Group Corp.
Joint Control
SoftBank Group Corp. ANNUAL REPORT 2017 117Trajectory of
the Information RevolutionBringing the Future Forward
EssentialInformation
Management Organization
Corporate Information
Financial Section

15. Major subsidiaries(1) Organizational structureThe Company’s major subsidiaries are as follows:
Ownership percentage of voting rights (%)Company Name Reportable segments Location As of March 31, 2016 As of March 31, 2017
SoftBank Corp. Domestic Telecommunications Tokyo 99.99 99.99Wireless City Planning Inc.1 Domestic Telecommunications Tokyo 32.2 32.2SoftBank Payment Service Corp. Domestic Telecommunications Tokyo 100 100Sprint Corporation Sprint U.S. 83.4 83.0Sprint Communications, Inc. Sprint U.S. 100 100Yahoo Japan Corporation2 Yahoo Japan Tokyo 43.0 43.0ValueCommerce Co., Ltd. Yahoo Japan Tokyo 50.5 52.3ASKUL Corporation3 Yahoo Japan Tokyo 44.4 45.3eBOOK Initiative Japan Co., Ltd.4 Yahoo Japan Tokyo – 44.6Brightstar Global Group Inc. Distribution U.S. 95.5 87.1Brightstar Corp. Distribution U.S. 100 100SoftBank Commerce & Service Corp. Distribution Tokyo 100 100Arm Holdings plc Arm U.K. – 100Arm PIPD Holdings One, LLC Arm U.S. – 100Arm PIPD Holdings Two, LLC Arm U.S. – 100Arm Limited Arm U.K. – 100SoftBank Group International GK5 Company-wide Tokyo 100 100SoftBank Group Japan GK5 Company-wide Tokyo 100 100SB Group US, Inc. Company-wide U.S. 100 100SoftBank Group Capital Limited6 Company-wide U.K. 100 100SB Energy Corp. Other Tokyo 100 100Fukuoka SoftBank HAWKS Corp. Other Fukuoka 100 100SoftBank Robotics Group Corp.7 Other Tokyo 60.0 60.0SoftBank Robotics Corp. Other Tokyo 100 100SBBM Corporation Other Tokyo 100 100ITmedia Inc. Other Tokyo 57.9 58.0SoftBank Technology Corp. Other Tokyo 55.7 54.6Vector Inc. Other Tokyo 52.1 52.1SoftBank Ventures Korea Corp. Other South Korea 100 100SoftBank Korea Corp. Other South Korea 100 100Starburst I, Inc. Other U.S. 100 100SoftBank Holdings Inc. Other U.S. 100 100SoftBank America Inc. Other U.S. 100 100SoftBank Capital Fund’ 10 L.P. Other U.S. 81.7 81.7SoftBank Capital Fund’ 14 L.P. Other U.S. 99.0 99.0STARFISH I PTE. LTD. Other Singapore 100 100SB Pan Pacific Corporation Other Micronesia 100 100Hayate Corporation Other Micronesia 100 100West Raptor Holdings, LLC Other U.S. – 100
SoftBank Group Corp. ANNUAL REPORT 2017 118Trajectory of
the Information RevolutionBringing the Future Forward
EssentialInformation
Management Organization
Corporate Information
Financial Section

Notes: 1. The Company does not own the majority of WCP’s voting rights. However, the Company determined that it has control over WCP and included
it into the scope of consolidation, considering the fact that SoftBank Group Corp.’s directors, SoftBank Corp.’s directors and corporate officers constitute the majority of members of WCP’s Board of Directors and that WCP’s business activities significantly depend on the Company.
2. The Company does not own the majority of Yahoo Japan Corporation’s voting rights. However, the Company determined that it has control over Yahoo Japan Corporation and included it into the scope of consolidation, considering the fact that the Company holds 43.0% of the voting rights of Yahoo Japan Corporation and SoftBank Group Corp.’s directors and SoftBank Corp.’s directors constitute the majority of the members of Yahoo Japan Corporation’s Board of Directors.
3. The Company does not own the majority of ASKUL Corporation’s voting rights. However, the Company determined that it has control over ASKUL Corporation and included it into the scope of consolidation, considering the fact that the Company holds 45.3% of the voting rights of ASKUL Corporation, the dispersion of voting rights in ASKUL Corporation and the voting patterns exercised in ASKUL Corporation’s past shareholders meetings.
4. The Company does not own the majority of eBOOK Initiative Japan Co., Ltd.’s voting rights. However, the Company determined that it has control over eBOOK Initiative Japan Co., Ltd. and included it into the scope of consolidation, considering the fact that the Company holds 44.6% of the voting rights of eBOOK Initiative Japan Co., Ltd., and Yahoo Japan Corporation’s directors and its employees constitute the majority of the members of eBOOK Initiative Japan Co., Ltd.’s Board of Directors.
5. SoftBank Group International GK and SoftBank Group Japan GK conducted an absorption type merger with SoftBank Group International GK being the surviving company, effective on April 24, 2017.
6. SoftBank Group International Limited changed its company name to SoftBank Group Capital Limited on April 27, 2016.7. SoftBank Robotics Holdings Corp. changed its company name to SoftBank Robotics Group Corp. on November 1, 2016.
(2) Summarized consolidated financial information and other information on subsidiaries with significant non-controlling interests
a. Sprint (Sprint Corporation and its group companies)
(a) General information
As of March 31, 2016
As of March 31, 2017
Ownership ratio of the non-controlling interests (%) . . . . . . . . 16.6 17.0
(Millions of yen)(Thousands of
U.S. dollars)
As ofMarch 31, 2016
As ofMarch 31, 2017
As ofMarch 31, 2017
Accumulated amount attributable to the non-controlling interests of subsidiary group . . . . . . . . . . . . . . . . . . . ¥286,199 ¥274,376 $2,445,637
(Millions of yen)(Thousands of
U.S. dollars)
Fiscal year endedMarch 31, 2016
Fiscal year endedMarch 31, 2017
Fiscal year endedMarch 31, 2017
Net loss allocated to the non-controlling interests of subsidiary group . . . . . . . . . . ¥(39,387) ¥(24,295) $(216,552)
(b) Summarized consolidated financial information
(Millions of yen)(Thousands of
U.S. dollars)
As ofMarch 31, 2016
As ofMarch 31, 2017
As ofMarch 31, 2017
Current assets . . . . . . . . . . . . . . . . . . . . . ¥ 899,704 ¥1,583,724 $14,116,445Non-current assets . . . . . . . . . . . . . . . . . . 7,958,438 7,790,217 69,437,713Current liabilities . . . . . . . . . . . . . . . . . . . 1,527,507 1,424,313 12,695,543Non-current liabilities . . . . . . . . . . . . . . . . 5,362,584 6,108,478 54,447,616Net assets . . . . . . . . . . . . . . . . . . . . . . . . 1,968,051 1,841,150 16,410,999
(Millions of yen)(Thousands of
U.S. dollars)
Fiscal year endedMarch 31, 2016
Fiscal year endedMarch 31, 2017
Fiscal year endedMarch 31, 2017
Net sales . . . . . . . . . . . . . . . . . . . . . . . . . ¥3,871,647 ¥3,623,375 $32,296,773Net loss . . . . . . . . . . . . . . . . . . . . . . . . . . (230,380) (148,261) (1,321,517)Total comprehensive income . . . . . . . . . . (232,734) (160,823) (1,433,488)
No dividends were paid to non-controlling interests by Sprint for the fiscal year ended March 31,
2016 and the fiscal year ended March 31, 2017.
(Millions of yen)(Thousands of
U.S. dollars)
Fiscal year endedMarch 31, 2016
Fiscal year endedMarch 31, 2017
Fiscal year endedMarch 31, 2017
Net cash provided by operating activities . . . . . . . . . . . . . . . . . ¥ 361,001 ¥ 373,446 $ 3,328,692
Net cash used in investing activities . . . . . (685,226) (1,011,880) (9,019,342)Net cash provided by financing activities . . . . . . . . . . . . . . . . . 155,915 658,123 5,866,147
Effect of exchange rate changes on cash and cash equivalents . . . . . . . . . . . (16,029) 4,750 42,339
(Decrease) increase in cash and cash equivalents . . . . . . . . . . . . . . . . . . . ¥(184,339) ¥ 24,439 $ 217,836
SoftBank Group Corp. ANNUAL REPORT 2017 119Trajectory of
the Information RevolutionBringing the Future Forward
EssentialInformation
Management Organization
Corporate Information
Financial Section

b. Yahoo (Yahoo Japan Corporation and its group companies)
(a) General information
As ofMarch 31, 2016
As ofMarch 31, 2017
Ownership ratio of the non-controlling interests (%) . . . . . . . . 57.0 57.0
(Millions of yen)(Thousands of
U.S. dollars)
As ofMarch 31, 2016
As ofMarch 31, 2017
As ofMarch 31, 2017
Accumulated amount attributable to the non-controlling interests of subsidiary group . . . . . . . . . . . . . . . . . . . ¥539,584 ¥583,106 $5,197,486
(Millions of yen)(Thousands of
U.S. dollars)
Fiscal year endedMarch 31, 2016
Fiscal year endedMarch 31, 2017
Fiscal year endedMarch 31, 2017
Net income allocated to the non-controlling interests of subsidiary group . . . . . . . . . . . . . . . . . . . ¥97,909 ¥73,172 $652,215
(b) Summarized consolidated financial information
(Millions of yen)(Thousands of
U.S. dollars)
As ofMarch 31, 2016
As ofMarch 31, 2017
As ofMarch 31, 2017
Current assets . . . . . . . . . . . . . . . . . . . . . ¥806,380 ¥ 966,818 $8,617,684Non-current assets . . . . . . . . . . . . . . . . . . 555,000 585,974 5,223,051Current liabilities . . . . . . . . . . . . . . . . . . . 366,023 416,168 3,709,493Non-current liabilities . . . . . . . . . . . . . . . . 64,012 119,334 1,063,678Net assets . . . . . . . . . . . . . . . . . . . . . . . . 931,345 1,017,290 9,067,564
(Millions of yen)(Thousands of
U.S. dollars)
Fiscal year endedMarch 31, 2016
Fiscal year endedMarch 31, 2017
Fiscal year endedMarch 31, 2017
Net sales . . . . . . . . . . . . . . . . . . . . . . . . . ¥652,327 ¥853,730 $7,609,680Net income . . . . . . . . . . . . . . . . . . . . . . . 172,492 132,634 1,182,227Total comprehensive income . . . . . . . . . . 173,504 134,436 1,198,289
Dividends paid to the non-controlling interests by Yahoo Japan Corporation for the fiscal year
ended March 31, 2017 is ¥28,748 million ($256,244 thousand) (For the fiscal year ended March 31,
2016: ¥28,733 million).
(Millions of yen)(Thousands of
U.S. dollars)
Fiscal year endedMarch 31, 2016
Fiscal year endedMarch 31, 2017
Fiscal year endedMarch 31, 2017
Net cash provided by operating activities . . . . . . . . . . . . . . ¥ 107,519 ¥128,627 $1,146,511
Net cash used in investing activities . . . . . (112,647) (58,651) (522,783)Net cash (used in) provided by financing activities . . . . . . . . . . . . . . . (49,358) 23,996 213,887
Effect of exchange rate changes on cash and cash equivalents . . . . . . . . . . . (286) (70) (624)
(Decrease) increase in cash and cash equivalents . . . . . . . . . . . . . . . . . . . ¥ (54,772) ¥ 93,902 $ 836,991
16. Investments accounted for using the equity method(1) Summarized consolidated financial information and other of the significant associates
Alibaba Group Holding Limited
a. General information
Alibaba (registered in Cayman) operates online marketplaces “Taobao Marketplace,” “Tmall,”
“Alibaba.com” and other through its group company.
b. Summarized consolidated financial information
IFRSs summarized consolidated financial information for Alibaba is as follows.
The Company applies the equity method to the consolidated financial statements of Alibaba on a
three-month time lag, as it is impracticable to conform the reporting period of Alibaba to that of the
Company due to the contract with Alibaba. Also, this note discloses the summarized consolidated
financial information of Alibaba on a three-month time lag. Adjustments are made for significant
SoftBank Group Corp. ANNUAL REPORT 2017 120Trajectory of
the Information RevolutionBringing the Future Forward
EssentialInformation
Management Organization
Corporate Information
Financial Section

transactions or events which occurred during the intervening period and which were publicly
announced by Alibaba.
(Millions of yen)(Thousands of
U.S. dollars)
As ofMarch 31, 2016
As ofMarch 31, 2017
As ofMarch 31, 2017
Current assets . . . . . . . . . . . . . . . . . . . . . ¥2,637,889 ¥2,944,857 $26,248,837Non-current assets . . . . . . . . . . . . . . . . . . 3,755,127 5,301,646 47,255,959Current liabilities . . . . . . . . . . . . . . . . . . . 989,195 1,546,084 13,780,943Non-current liabilities . . . . . . . . . . . . . . . . 1,094,527 1,528,963 13,628,336Equity
Total equity attributable to owners of the parent . . . . . . . . . . . . . 3,580,184 4,373,539 38,983,323
Non-controlling interests . . . . . . . . . . . . 729,110 797,917 7,112,194
(Millions of yen)(Thousands of
U.S. dollars)
Fiscal year endedMarch 31, 2016
Fiscal year endedMarch 31, 2017
Fiscal year endedMarch 31, 2017
Net sales . . . . . . . . . . . . . . . . . . . . . . . . . ¥1,771,778 ¥2,337,597 $20,836,055
Net income . . . . . . . . . . . . . . . . . . . . . . . 1,177,794 1,026,796 9,152,295Other comprehensive income, net of tax . . . . . . . . . . . . . . . . . . . . . . . . 122,648 (120,129) (1,070,764)
Total comprehensive income . . . . . . . . . . ¥1,300,442 ¥ 906,667 $ 8,081,531
(Millions of yen)(Thousands of
U.S. dollars)
Fiscal year endedMarch 31, 2016
Fiscal year endedMarch 31, 2017
Fiscal year endedMarch 31, 2017
Net income attributable to owners of the parent . . . . . . . . . . . . . . . . . . . . . ¥1,175,236 ¥1,062,873 $ 9,473,866
Other comprehensive income attributable to owners of the parent, net of tax . . . . 122,254 (130,113) (1,159,756)
Total comprehensive income attributable to owners of the parent . . . . . . . . . . . . . ¥1,297,490 ¥ 932,760 $ 8,314,110
There was no dividend received from Alibaba for the fiscal years ended March 31, 2016 and 2017.
The reconciliation between total equity attributable to owners of the parent based on the summarized
consolidated financial information above and the carrying amount of the interests in Alibaba is as follows:
(Millions of yen)(Thousands of
U.S. dollars)
As ofMarch 31, 2016
As ofMarch 31, 2017
As ofMarch 31, 2017
Total equity attributable to owners of the parent . . . . . . . . . . . . . . . . . . . . . . . ¥3,580,184 ¥4,373,539 $38,983,323
Interest ratio (%) . . . . . . . . . . . . . . . . . . . 32.60 30.05 30.05Interests of the Company . . . . . . . . . . . . 1,167,140 1,314,249 11,714,493
Goodwill . . . . . . . . . . . . . . . . . . . . . . . . . 137,705 139,290 1,241,555Accumulated amortization of goodwill on the IFRSs transition date1 . . . (7,989) (6,899) (61,494)
Stock acquisition rights . . . . . . . . . . . . . . (62,980) (80,326) (715,982)Other2 . . . . . . . . . . . . . . . . . . . . . . . . . . . (32,329) (30,068) (268,010)Carrying amount of the interests in Alibaba . . . . . . . . . . . . . . . . . ¥1,201,547 ¥1,336,246 $11,910,562
Notes: 1. Goodwill recorded by Alibaba from business combinations before the IFRSs transition date was amortized over the periods in which
economic benefits were reasonably expected to be realized, when the Company applied the equity method to the investment in Alibaba under previous accounting principles (JGAAP). The adjustment amount above reflects the accumulated amortization of goodwill at the date of transition to IFRSs.
2. Other relates to adjustments mainly related to organization restructurings such as the transfer of Taobao shares in 2005 and the purchase of treasury stocks by Alibaba from Yahoo! Inc. in the U.S. in 2012.
c. Fair value of investment in Alibaba
The fair value of the investment in Alibaba based on market price is ¥9,036,776 million ($80,548,855
thousand) as of March 31, 2017 (As of March 31, 2016: ¥7,103,981 million).
(2) Aggregated information on investment in insignificant associates and joint venturesThe aggregated information of insignificant investments accounted for using the equity method, other than
(1) above (total amount of the Company’s interests), is as follows:
(Millions of yen)(Thousands of
U.S. dollars)
As ofMarch 31, 2016
As ofMarch 31, 2017
As ofMarch 31, 2017
Carrying amount of the interests Associates . . . . . . . . . . . . . . . . . . . . . . . . . . . ¥380,511 ¥327,184 $2,916,338Joint ventures . . . . . . . . . . . . . . . . . . . . . . . . . 6,212 7,369 65,684Total . . . . . . . . . . . . . . . . . . . . . . . . . . . . . . . . ¥386,723 ¥334,553 $2,982,022
SoftBank Group Corp. ANNUAL REPORT 2017 121Trajectory of
the Information RevolutionBringing the Future Forward
EssentialInformation
Management Organization
Corporate Information
Financial Section

(Millions of yen)(Thousands of
U.S. dollars)
Fiscal year endedMarch 31, 2016
Fiscal year endedMarch 31, 2017
Fiscal year endedMarch 31, 2017
Net incomeAssociates . . . . . . . . . . . . . . . . . . . . . . . . . . . ¥(3,775) ¥(9,159) $(81,638)Joint ventures . . . . . . . . . . . . . . . . . . . . . . . . . (1,483) 545 4,858Total . . . . . . . . . . . . . . . . . . . . . . . . . . . . . . . . ¥(5,258) ¥(8,614) $(76,780)
Other comprehensive income, net of tax
Associates . . . . . . . . . . . . . . . . . . . . . . . . . . . (417) 481 4,287Joint ventures . . . . . . . . . . . . . . . . . . . . . . . . . (779) 658 5,865Total . . . . . . . . . . . . . . . . . . . . . . . . . . . . . . . . ¥(1,196) ¥ 1,139 $ 10,152
Total comprehensive income
Associates . . . . . . . . . . . . . . . . . . . . . . . . . . . (4,192) (8,678) (77,351)Joint ventures . . . . . . . . . . . . . . . . . . . . . . . . . (2,262) 1,203 10,723Total . . . . . . . . . . . . . . . . . . . . . . . . . . . . . . . . ¥(6,454) ¥(7,475) $(66,628)
17. Structured entities(1) Consolidated structured entitiesThe Company owns investment funds which are structured entities consolidated by the Company. These
funds are structured as venture funds in the form of partnerships and limited partnerships for investment, and
designed so that the voting rights or similar rights are not determinant in evaluating control. The Company
evaluated that it controls the operation of those structured entities.
The Company is engaged in investment commitment contracts with certain consolidated structured entities.
The Company has not provided, nor intends to provide, any significant financial support or other
significant support to the consolidated structured entities without contractual obligation.
(2) Unconsolidated structured entitiesThe Company owns investment funds, which are structured entities unconsolidated by the Company. These
funds are structured as venture funds in the form of partnerships, limited partnerships for investment and
investment trusts, and designed so that the voting rights or similar rights are not determinant in evaluating
control. The third parties control the operation of these structured entities. The funds are financed by the
subscription by its partners.
The scale of the unconsolidated structured entities, the carrying amount of the investment in the entities
by the Company, and the potential maximum loss exposure of the Company are as follows:
(Millions of yen)(Thousands of
U.S. dollars)
As ofMarch 31, 2016
As ofMarch 31, 2017
As ofMarch 31, 2017
Total assets of the unconsolidated structured entities (aggregate amount) . . . . . . . . . . . . . . . ¥629,519 ¥523,860 $4,669,400
The maximum loss exposure of the CompanyThe carrying amount of the investment recognized by the Company . . . . . . . . . . . . . 75,733 62,079 553,338
Commitment contracts related to additional investment . . . . . . . . . . . . . . . . . . 16,437 18,540 165,255
Total . . . . . . . . . . . . . . . . . . . . . . . . . . . . . . . . ¥ 92,170 ¥ 80,619 $ 718,593
The investment recognized by the Company is included in “Investments accounted for using the equity
method” or “Other financial assets (non-current)” in the consolidated statement of financial position. There is
no liability to recognize related to unconsolidated structured entities.
The potential maximum loss exposure incurred from the involvement with the structured entities is limited
to the total of the carrying amount of the Company’s investment and commitment regarding additional
investment.
The Company’s maximum loss exposure represents the potential maximum loss amount, and does not
indicate any estimated loss amount by being involved with structured entities.
The Company has not provided, nor intends to provide, any financial support or other significant support
to the unconsolidated structured entities above without contractual obligation.
SoftBank Group Corp. ANNUAL REPORT 2017 122Trajectory of
the Information RevolutionBringing the Future Forward
EssentialInformation
Management Organization
Corporate Information
Financial Section
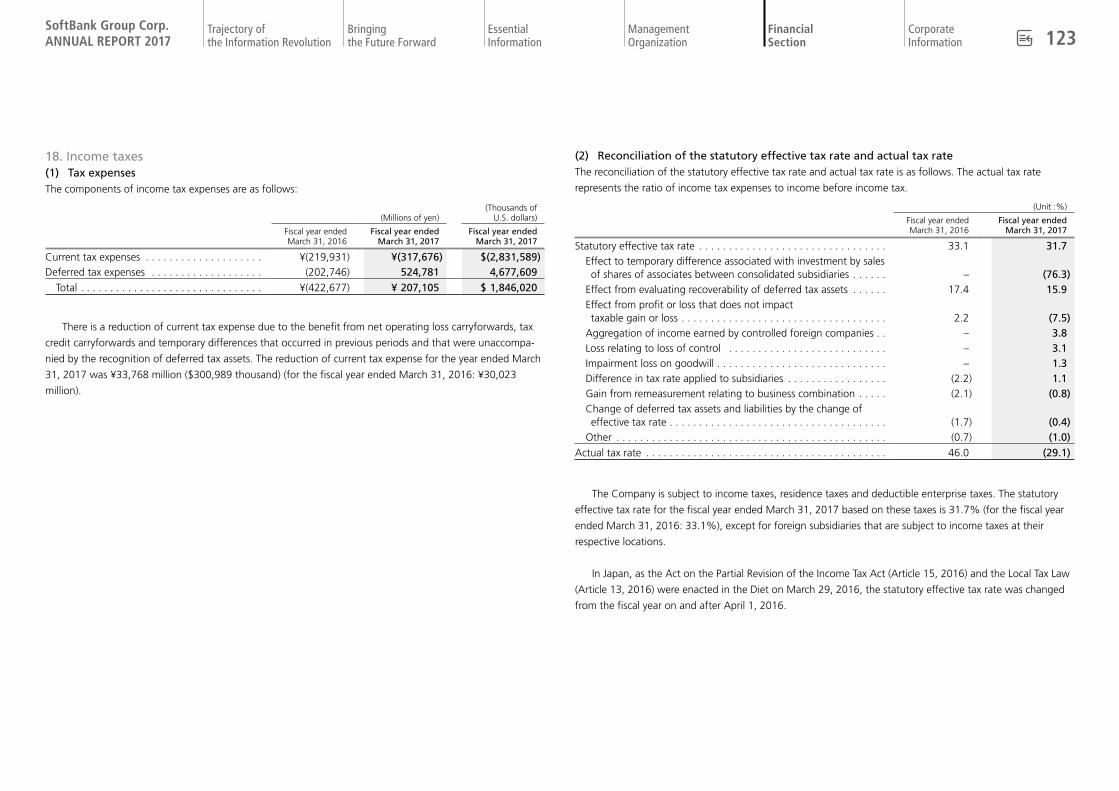
18. Income taxes(1) Tax expenses The components of income tax expenses are as follows:
(Millions of yen)(Thousands of
U.S. dollars)
Fiscal year endedMarch 31, 2016
Fiscal year endedMarch 31, 2017
Fiscal year endedMarch 31, 2017
Current tax expenses . . . . . . . . . . . . . . . . . . . . ¥(219,931) ¥(317,676) $(2,831,589)Deferred tax expenses . . . . . . . . . . . . . . . . . . . (202,746) 524,781 4,677,609
Total . . . . . . . . . . . . . . . . . . . . . . . . . . . . . . . ¥(422,677) ¥ 207,105 $ 1,846,020
There is a reduction of current tax expense due to the benefit from net operating loss carryforwards, tax
credit carryforwards and temporary differences that occurred in previous periods and that were unaccompa-
nied by the recognition of deferred tax assets. The reduction of current tax expense for the year ended March
31, 2017 was ¥33,768 million ($300,989 thousand) (for the fiscal year ended March 31, 2016: ¥30,023
million).
(2) Reconciliation of the statutory effective tax rate and actual tax rateThe reconciliation of the statutory effective tax rate and actual tax rate is as follows. The actual tax rate
represents the ratio of income tax expenses to income before income tax.
(Unit :%)
Fiscal year endedMarch 31, 2016
Fiscal year endedMarch 31, 2017
Statutory effective tax rate . . . . . . . . . . . . . . . . . . . . . . . . . . . . . . . . 33.1 31.7Effect to temporary difference associated with investment by sales of shares of associates between consolidated subsidiaries . . . . . . – (76.3)
Effect from evaluating recoverability of deferred tax assets . . . . . . 17.4 15.9Effect from profit or loss that does not impact taxable gain or loss . . . . . . . . . . . . . . . . . . . . . . . . . . . . . . . . . . . 2.2 (7.5)
Aggregation of income earned by controlled foreign companies . . – 3.8Loss relating to loss of control . . . . . . . . . . . . . . . . . . . . . . . . . . . – 3.1Impairment loss on goodwill . . . . . . . . . . . . . . . . . . . . . . . . . . . . . – 1.3Difference in tax rate applied to subsidiaries . . . . . . . . . . . . . . . . . (2.2) 1.1Gain from remeasurement relating to business combination . . . . . (2.1) (0.8)Change of deferred tax assets and liabilities by the change of effective tax rate . . . . . . . . . . . . . . . . . . . . . . . . . . . . . . . . . . . . . (1.7) (0.4)
Other . . . . . . . . . . . . . . . . . . . . . . . . . . . . . . . . . . . . . . . . . . . . . . (0.7) (1.0)Actual tax rate . . . . . . . . . . . . . . . . . . . . . . . . . . . . . . . . . . . . . . . . . 46.0 (29.1)
The Company is subject to income taxes, residence taxes and deductible enterprise taxes. The statutory
effective tax rate for the fiscal year ended March 31, 2017 based on these taxes is 31.7% (for the fiscal year
ended March 31, 2016: 33.1%), except for foreign subsidiaries that are subject to income taxes at their
respective locations.
In Japan, as the Act on the Partial Revision of the Income Tax Act (Article 15, 2016) and the Local Tax Law
(Article 13, 2016) were enacted in the Diet on March 29, 2016, the statutory effective tax rate was changed
from the fiscal year on and after April 1, 2016.
SoftBank Group Corp. ANNUAL REPORT 2017 123Trajectory of
the Information RevolutionBringing the Future Forward
EssentialInformation
Management Organization
Corporate Information
Financial Section

(3) Movement of deferred tax assets and deferred tax liabilitiesThe movement of deferred tax assets and deferred tax liabilities is as follows:
For the fiscal year ended March 31, 2016
(Millions of yen)
As ofMarch 31, 2015
Recognized in profit or loss
Recognized in other comprehensive
incomeBusiness
combinationExchange
differences OtherAs of
March 31, 2016
Deferred tax assets Property, plant and equipment . . . . . . . . . . . . . . . . . . . . . . . . . . . . . . . . . ¥ 72,624 ¥ 49,136 ¥ – ¥ 1,089 ¥ (4,047) ¥ 433 ¥ 119,235Accrued expenses and other liabilities . . . . . . . . . . . . . . . . . . . . . . . . . . . . 267,229 (51,870) 202 1,765 (7,760) (1,036) 208,530Net operating loss carryforwards and tax credit carryforwards1 . . . . . . . . . 127,548 (43,307) – 1,230 (5,054) 3 80,420Temporary difference associated with investment in subsidiaries, associates and joint ventures . . . . . . . . . . . . . . . . . . . . . . . . . . . . . . . . . 137 2,351 – – (20) – 2,468
Other . . . . . . . . . . . . . . . . . . . . . . . . . . . . . . . . . . . . . . . . . . . . . . . . . . . . 104,819 (20,643) 8 5 (2,082) 97 82,204
Total . . . . . . . . . . . . . . . . . . . . . . . . . . . . . . . . . . . . . . . . . . . . . . . . . . . 572,357 (64,333) 210 4,089 (18,963) (503) 492,857
Deferred tax liabilities FCC licenses . . . . . . . . . . . . . . . . . . . . . . . . . . . . . . . . . . . . . . . . . . . . . . . (1,508,886) (23,510) – – 95,552 – (1,436,844)Customer relationships . . . . . . . . . . . . . . . . . . . . . . . . . . . . . . . . . . . . . . . (216,238) 68,289 – (18,285) 8,194 – (158,040)Trademarks . . . . . . . . . . . . . . . . . . . . . . . . . . . . . . . . . . . . . . . . . . . . . . . (298,794) 510 – (9,759) 18,558 670 (288,815)Temporary difference associated with investment in subsidiaries, associates and joint ventures2 . . . . . . . . . . . . . . . . . . . . . . . . . . . . . . . . . (256,430) (114,516) 28,478 – 191 (8,154) (350,431)
Other . . . . . . . . . . . . . . . . . . . . . . . . . . . . . . . . . . . . . . . . . . . . . . . . . . . . (109,136) (69,186) (5,048) (3,596) 6,891 11,048 (169,027)
Total . . . . . . . . . . . . . . . . . . . . . . . . . . . . . . . . . . . . . . . . . . . . . . . . . . . (2,389,484) (138,413) 23,430 (31,640) 129,386 3,564 (2,403,157)
Net . . . . . . . . . . . . . . . . . . . . . . . . . . . . . . . . . . . . . . . . . . . . . . . . . . ¥(1,817,127) ¥(202,746) ¥23,640 ¥(27,551) ¥110,423 ¥ 3,061 ¥(1,910,300)
Notes:1. The Company recognizes deferred tax assets related to the entities that recorded a loss in either the fiscal year ended March 31, 2015 or 2016, in the amount of ¥10,306 million for the fiscal year ended March 31, 2016. Deferred tax assets are recognized to the extent that it is probable that taxable
profits will be available against which deductible temporary differences, net operating loss carryforwards and tax credit carryforwards can be utilized.2. The increase in deferred tax liabilities from “Temporary difference associated with investment in subsidiaries, associates and joint ventures” is mainly due to the recognition of deferred tax liabilities on temporary differences on investment which mainly arose from dilution gain from changes in equity
interest and income on equity method investments related to Alibaba. The amount of deferred tax liability recognized as of March 31, 2016 is ¥327,343 million.
SoftBank Group Corp. ANNUAL REPORT 2017 124Trajectory of
the Information RevolutionBringing the Future Forward
EssentialInformation
Management Organization
Corporate Information
Financial Section

For the fiscal year ended March 31, 2017(Millions of yen)
As ofMarch 31, 2016
Recognized in profit or loss
Recognized in other comprehensive
incomeBusiness
combination1Exchange
differences OtherAs of
March 31, 2017
Deferred tax assetsProperty, plant and equipment . . . . . . . . . . . . . . . . . . . . . . . . . . . . . . . . . ¥ 119,235 ¥ 5,282 ¥ – ¥ – ¥ 509 ¥ 2 ¥ 125,028Accrued expenses and other liabilities . . . . . . . . . . . . . . . . . . . . . . . . . . . . 208,530 (51,483) (27) 45 (2,032) (1,183) 153,850Net operating loss carryforwards and tax credit carryforwards2 . . . . . . . . . 80,420 (66,226) – 9,831 (4,465) 51 19,611Temporary difference associated with investment in subsidiaries, associates and joint ventures3 . . . . . . . . . . . . . . . . . . . . . . . . . . . . . . . . . 2,468 227,630 – – (2) – 230,096
Other . . . . . . . . . . . . . . . . . . . . . . . . . . . . . . . . . . . . . . . . . . . . . . . . . . . . 82,204 (15,949) 195 1,027 (298) 3,247 70,426Total . . . . . . . . . . . . . . . . . . . . . . . . . . . . . . . . . . . . . . . . . . . . . . . . . . . 492,857 99,254 168 10,903 (6,288) 2,117 599,011
Deferred tax liabilitiesFCC licenses . . . . . . . . . . . . . . . . . . . . . . . . . . . . . . . . . . . . . . . . . . . . . . . (1,436,844) (19,567) – – 3,960 – (1,452,451)Customer relationships . . . . . . . . . . . . . . . . . . . . . . . . . . . . . . . . . . . . . . . (158,040) 50,760 – (27,233) 1,686 – (132,827)Trademarks . . . . . . . . . . . . . . . . . . . . . . . . . . . . . . . . . . . . . . . . . . . . . . . (288,815) 1,070 – (1,100) 1,210 – (287,635)Technologies . . . . . . . . . . . . . . . . . . . . . . . . . . . . . . . . . . . . . . . . . . . . . . – 8,312 – (98,381) (1,089) – (91,158)Temporary difference associated with investment in subsidiaries, associates and joint ventures4 . . . . . . . . . . . . . . . . . . . . . . . . . . . . . . . . . (350,431) 333,388 849 – 32 5,757 (10,405)
Other . . . . . . . . . . . . . . . . . . . . . . . . . . . . . . . . . . . . . . . . . . . . . . . . . . . . (169,027) 51,564 (16,606) (832) 3,342 (29,362)*5 (160,921)Total . . . . . . . . . . . . . . . . . . . . . . . . . . . . . . . . . . . . . . . . . . . . . . . . . . . (2,403,157) 425,527 (15,757) (127,546) 9,141 (23,605) (2,135,397)
Net . . . . . . . . . . . . . . . . . . . . . . . . . . . . . . . . . . . . . . . . . . . . . . . . . . ¥(1,910,300) ¥524,781 ¥(15,589) ¥(116,643) ¥ 2,853 ¥(21,488) ¥(1,536,386)
(Thousands of U.S. dollars)
As ofMarch 31, 2016
Recognized in profit or loss
Recognized in other comprehensive
incomeBusiness
combination1Exchange
differences OtherAs of
March 31, 2017
Deferred tax assetsProperty, plant and equipment . . . . . . . . . . . . . . . . . . . . . . . . . . . . . . . . . $ 1,062,795 $ 47,081 $ – $ – $ 4,537 $ 18 $ 1,114,431Accrued expenses and other liabilities . . . . . . . . . . . . . . . . . . . . . . . . . . . 1,858,722 (458,891) (241) 401 (18,112) (10,545) 1,371,334Net operating loss carryforwards and tax credit carryforwards2 . . . . . . . . . 716,820 (590,302) – 87,628 (39,799) 455 174,802Temporary difference associated with investment in subsidiaries, associates and joint ventures3 . . . . . . . . . . . . . . . . . . . . . . . . . . . . . . . . . 21,998 2,028,969 – – (18) – 2,050,949
Other . . . . . . . . . . . . . . . . . . . . . . . . . . . . . . . . . . . . . . . . . . . . . . . . . . . . 732,722 (142,161) 1,738 9,154 (2,656) 28,942 627,739Total . . . . . . . . . . . . . . . . . . . . . . . . . . . . . . . . . . . . . . . . . . . . . . . . . . . 4,393,057 884,696 1,497 97,183 (56,048) 18,870 5,339,255
Deferred tax liabilities FCC licenses . . . . . . . . . . . . . . . . . . . . . . . . . . . . . . . . . . . . . . . . . . . . . . . (12,807,238) (174,409) – – 35,297 – (12,946,350)Customer relationships . . . . . . . . . . . . . . . . . . . . . . . . . . . . . . . . . . . . . . . (1,408,682) 452,447 – (242,740) 15,028 – (1,183,947)Trademarks . . . . . . . . . . . . . . . . . . . . . . . . . . . . . . . . . . . . . . . . . . . . . . . (2,574,338) 9,537 – (9,805) 10,785 – (2,563,821)Technologies . . . . . . . . . . . . . . . . . . . . . . . . . . . . . . . . . . . . . . . . . . . . . . – 74,089 – (876,914) (9,707) – (812,532)Temporary difference associated with investment in subsidiaries, associates and joint ventures4 . . . . . . . . . . . . . . . . . . . . . . . . . . . . . . . . . (3,123,549) 2,971,637 7,568 – 285 51,315 (92,744)
Other . . . . . . . . . . . . . . . . . . . . . . . . . . . . . . . . . . . . . . . . . . . . . . . . . . . . (1,506,613) 459,612 (148,017) (7,416) 29,790 (261,717)*5 (1,434,361)Total . . . . . . . . . . . . . . . . . . . . . . . . . . . . . . . . . . . . . . . . . . . . . . . . . . . (21,420,420) 3,792,913 (140,449) (1,136,875) 81,478 (210,402) (19,033,755)
Net . . . . . . . . . . . . . . . . . . . . . . . . . . . . . . . . . . . . . . . . . . . . . . . . . $(17,027,363) $4,677,609 $(138,952) $(1,039,692) $ 25,430 $(191,532) $(13,694,500)
SoftBank Group Corp. ANNUAL REPORT 2017 125Trajectory of
the Information RevolutionBringing the Future Forward
EssentialInformation
Management Organization
Corporate Information
Financial Section

Notes:1. The increase from “Business combination” is mainly due to the consolidation of Arm. The details are described in “(3) Arm” in “Note 5.
Business combinations.”2. The Company recognizes deferred tax assets related to the entities that recorded a loss in either the fiscal year ended March 31, 2016 or 2017,
in the amount of ¥11,062 million ($98,601 thousand) for the fiscal year ended March 31, 2017. Deferred tax assets are recognized to the extent that it is probable that taxable profits will be available against which deductible temporary differences, net operating loss carryforwards and tax credit carryforwards can be utilized.
3. The increase in deferred tax assets from “Temporary difference associated with investment in subsidiaries, associates and joint ventures” is due to the recognition of deferred tax assets on temporary differences on investment which arose from changes in the carrying amount on a tax basis, due to the sales of Alibaba shares to a subsidiary of the Company. The amount of deferred tax assets recognized as of March 31, 2017 is ¥229,980 million ($2,049,915 thousand).
4. The decrease in deferred tax liabilities from “Temporary difference associated with investment in subsidiaries, associates and joint ventures” is mainly due to the write-off of deferred tax liabilities on temporary differences on investment which arose from sales of Alibaba shares. The amount of deferred tax liabilities recognized as of March 31, 2017 is ¥7,747 million ($69,053 thousand).
5. The increase in deferred tax liabilities from “Other” is mainly due to the recognition of deferred tax liabilities of ¥38,979 million ($347,437 thousand) for taxable profits in the foreseeable future, resulting from the sales of Supercell shares to a foreign subsidiary of the Company. In addition, deferred tax expenses of ¥38,979 million ($347,437 thousand) is included in “Net income from discontinued operations” in the consolidated statement of income for the fiscal year ended March 31, 2017.
Deferred tax assets and liabilities in the consolidated statement of financial position are as follows:
(Millions of yen)(Thousands of
U.S. dollars)
As ofMarch 31, 2016
As ofMarch 31, 2017
As ofMarch 31, 2017
Deferred tax assets . . . . . . . . . . . . . . . . . . . . . . . ¥ 172,864 ¥ 404,994 $ 3,609,894Deferred tax liabilities . . . . . . . . . . . . . . . . . . . . . (2,083,164) (1,941,380) (17,304,394)
Net . . . . . . . . . . . . . . . . . . . . . . . . . . . . . . . . ¥(1,910,300) ¥(1,536,386) $(13,694,500)
(4) Deductible temporary differences, net operating loss carryforwards and tax credit carryforwards, unaccompanied by the recognition of deferred tax assets
Deductible temporary differences, net operating loss carryforwards, and tax credit carryforwards unaccompa-
nied by the recognition of deferred tax assets are as follows. The amounts below are on a tax basis.
(Millions of yen)(Thousands of
U.S. dollars)
As ofMarch 31, 2016
As ofMarch 31, 2017
As ofMarch 31, 2017
Deductible temporary differences . . . . . . . . . . . . ¥ 404,965 ¥ 609,386 $ 5,431,732Net operating loss carryforwards . . . . . . . . . . . . 954,868 852,142 7,595,525Tax credit carryforwards . . . . . . . . . . . . . . . . . . . 37,711 39,148 348,944
Total . . . . . . . . . . . . . . . . . . . . . . . . . . . . . . . . ¥1,397,544 ¥1,500,676 $13,376,201
Expiration of net operating loss carryforwards and tax credit carryforwards unaccompanied by recognition
of deferred tax assets is as follows. There is no deductible temporary difference with an expiry date.
(Millions of yen)(Thousands of
U.S. dollars)
Net operating loss carryforwards (tax basis)As of
March 31, 2016As of
March 31, 2017As of
March 31, 2017
1st year . . . . . . . . . . . . . . . . . . . . . . . . . . . . . . . ¥ 25,096 ¥ 18,692 $ 166,6102nd year . . . . . . . . . . . . . . . . . . . . . . . . . . . . . . 10,421 14,978 133,5063rd year . . . . . . . . . . . . . . . . . . . . . . . . . . . . . . . 6,198 21,021 187,3704th year . . . . . . . . . . . . . . . . . . . . . . . . . . . . . . . 10,679 20,621 183,8045th year and thereafter and no expiry date . . . . 902,474 776,830 6,924,235
Total . . . . . . . . . . . . . . . . . . . . . . . . . . . . . . . . ¥954,868 ¥852,142 $7,595,525
(Millions of yen)(Thousands of
U.S. dollars)
Tax credit carryforwards (tax basis)As of
March 31, 2016As of
March 31, 2017As of
March 31, 2017
1st year . . . . . . . . . . . . . . . . . . . . . . . . . . . . . . . ¥ 297 ¥ 8,254 $ 73,5722nd year . . . . . . . . . . . . . . . . . . . . . . . . . . . . . . 8,097 1,183 10,5453rd year . . . . . . . . . . . . . . . . . . . . . . . . . . . . . . . 1,189 2,438 21,7314th year . . . . . . . . . . . . . . . . . . . . . . . . . . . . . . . 2,449 2,598 23,1575th year and thereafter and no expiry date . . . . 25,679 24,675 219,939
Total . . . . . . . . . . . . . . . . . . . . . . . . . . . . . . . . ¥37,711 ¥39,148 $348,944
In addition to the above, total deductible temporary differences (before multiplying by the tax rate)
unaccompanied by the recognition of deferred tax assets related to the investment in subsidiaries, associates
and joint ventures as of March 31, 2017 are ¥2,652,745 million ($23,645,111 thousand) (as of March 31,
2016: ¥2,154,301 million).
(5) Taxable temporary differences unaccompanied by the recognition of deferred tax liabilities related to the investment in subsidiaries
Total taxable temporary differences (before multiplying by the tax rate) unaccompanied by the recogni-
tion of deferred tax liabilities related to the investment in subsidiaries as of March 31, 2017 are
¥1,645,736 million ($14,669,186 thousand) (as of March 31, 2016: ¥1,128,346 million).
SoftBank Group Corp. ANNUAL REPORT 2017 126Trajectory of
the Information RevolutionBringing the Future Forward
EssentialInformation
Management Organization
Corporate Information
Financial Section
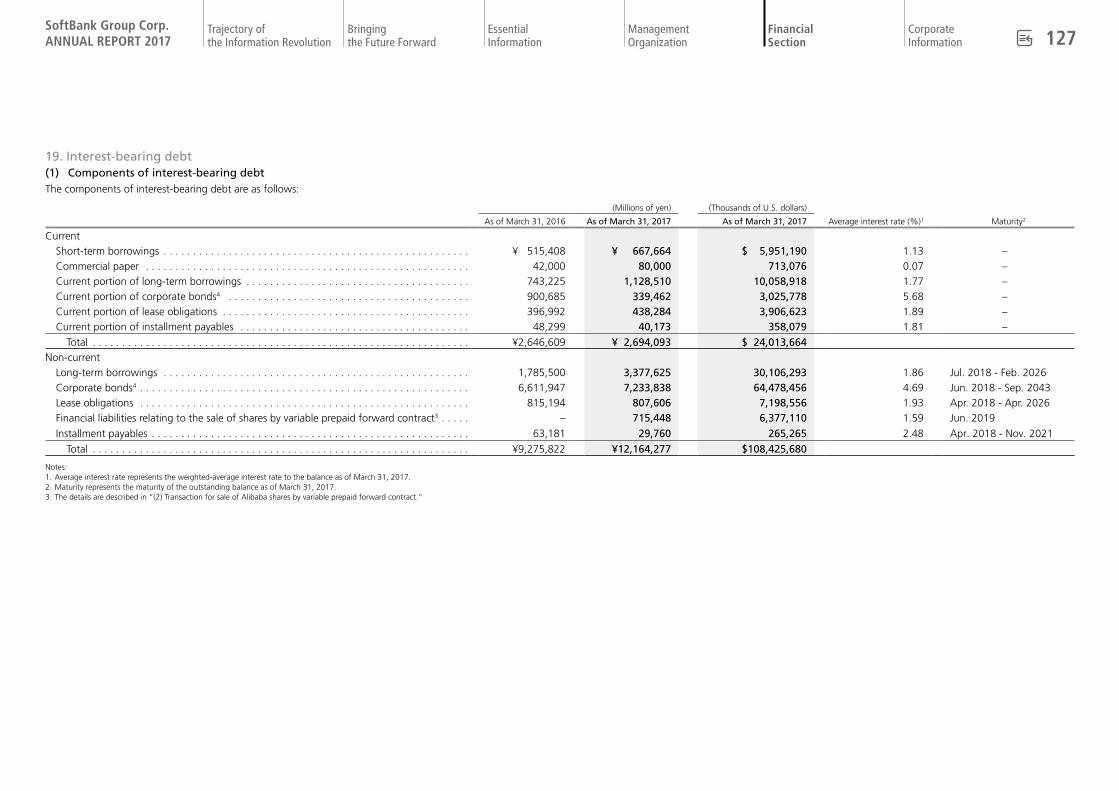
19. Interest-bearing debt(1) Components of interest-bearing debtThe components of interest-bearing debt are as follows:
(Millions of yen) (Thousands of U.S. dollars)
As of March 31, 2016 As of March 31, 2017 As of March 31, 2017 Average interest rate (%)1 Maturity2
CurrentShort-term borrowings . . . . . . . . . . . . . . . . . . . . . . . . . . . . . . . . . . . . . . . . . . . . . . . . . . . . ¥ 515,408 ¥ 667,664 $ 5,951,190 1.13 –Commercial paper . . . . . . . . . . . . . . . . . . . . . . . . . . . . . . . . . . . . . . . . . . . . . . . . . . . . . . . 42,000 80,000 713,076 0.07 –Current portion of long-term borrowings . . . . . . . . . . . . . . . . . . . . . . . . . . . . . . . . . . . . . . 743,225 1,128,510 10,058,918 1.77 –Current portion of corporate bonds4 . . . . . . . . . . . . . . . . . . . . . . . . . . . . . . . . . . . . . . . . . 900,685 339,462 3,025,778 5.68 –Current portion of lease obligations . . . . . . . . . . . . . . . . . . . . . . . . . . . . . . . . . . . . . . . . . . 396,992 438,284 3,906,623 1.89 –Current portion of installment payables . . . . . . . . . . . . . . . . . . . . . . . . . . . . . . . . . . . . . . . 48,299 40,173 358,079 1.81 –
Total . . . . . . . . . . . . . . . . . . . . . . . . . . . . . . . . . . . . . . . . . . . . . . . . . . . . . . . . . . . . . . . . ¥2,646,609 ¥ 2,694,093 $ 24,013,664Non-current
Long-term borrowings . . . . . . . . . . . . . . . . . . . . . . . . . . . . . . . . . . . . . . . . . . . . . . . . . . . . 1,785,500 3,377,625 30,106,293 1.86 Jul. 2018 - Feb. 2026Corporate bonds4 . . . . . . . . . . . . . . . . . . . . . . . . . . . . . . . . . . . . . . . . . . . . . . . . . . . . . . . . 6,611,947 7,233,838 64,478,456 4.69 Jun. 2018 - Sep. 2043Lease obligations . . . . . . . . . . . . . . . . . . . . . . . . . . . . . . . . . . . . . . . . . . . . . . . . . . . . . . . . 815,194 807,606 7,198,556 1.93 Apr. 2018 - Apr. 2026Financial liabilities relating to the sale of shares by variable prepaid forward contract3 . . . . . – 715,448 6,377,110 1.59 Jun. 2019
Installment payables . . . . . . . . . . . . . . . . . . . . . . . . . . . . . . . . . . . . . . . . . . . . . . . . . . . . . . 63,181 29,760 265,265 2.48 Apr. 2018 - Nov. 2021
Total . . . . . . . . . . . . . . . . . . . . . . . . . . . . . . . . . . . . . . . . . . . . . . . . . . . . . . . . . . . . . . . . ¥9,275,822 ¥12,164,277 $108,425,680
Notes:1. Average interest rate represents the weighted-average interest rate to the balance as of March 31, 2017. 2. Maturity represents the maturity of the outstanding balance as of March 31, 2017. 3. The details are described in “(2) Transaction for sale of Alibaba shares by variable prepaid forward contract.”
SoftBank Group Corp. ANNUAL REPORT 2017 127Trajectory of
the Information RevolutionBringing the Future Forward
EssentialInformation
Management Organization
Corporate Information
Financial Section
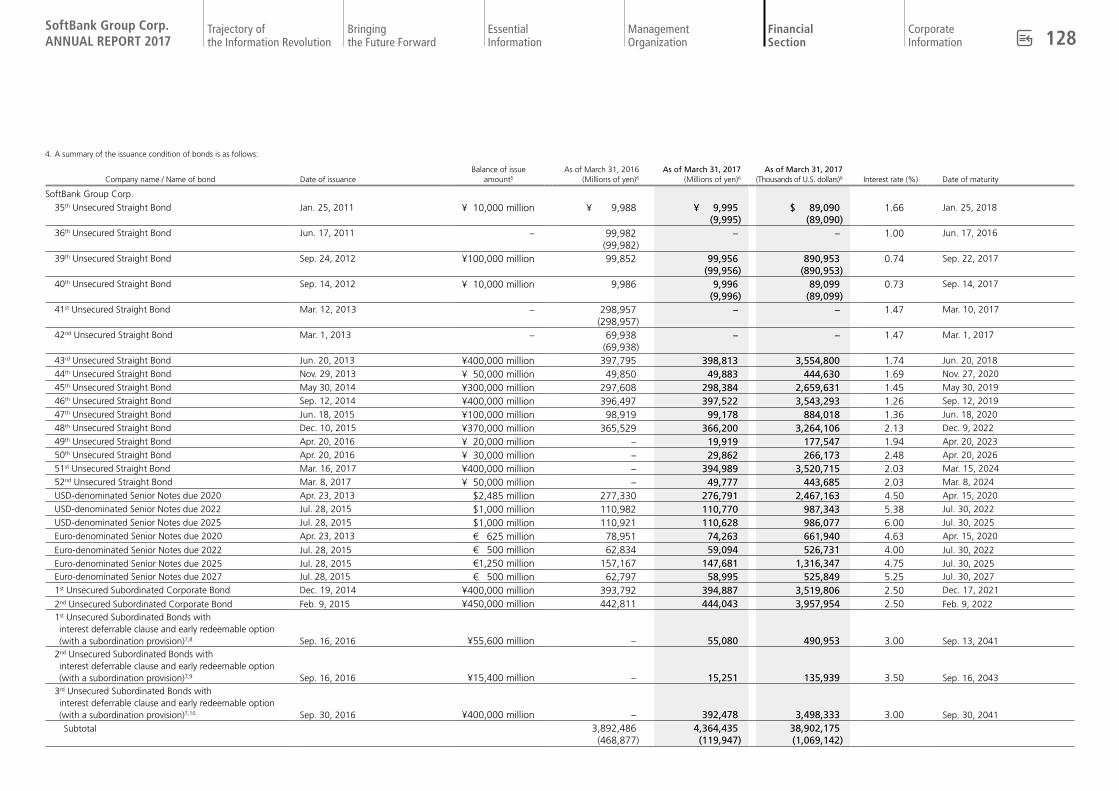
4. A summary of the issuance condition of bonds is as follows:
Company name / Name of bond Date of issuanceBalance of issue
amount5
As of March 31, 2016(Millions of yen)6
As of March 31, 2017(Millions of yen)6
As of March 31, 2017(Thousands of U.S. dollars)6 Interest rate (%) Date of maturity
SoftBank Group Corp.35th Unsecured Straight Bond Jan. 25, 2011 ¥ 10,000 million ¥ 9,988 ¥ 9,995
(9,995)$ 89,090
(89,090)1.66 Jan. 25, 2018
36th Unsecured Straight Bond Jun. 17, 2011 – 99,982(99,982)
– – 1.00 Jun. 17, 2016
39th Unsecured Straight Bond Sep. 24, 2012 ¥100,000 million 99,852 99,956(99,956)
890,953(890,953)
0.74 Sep. 22, 2017
40th Unsecured Straight Bond Sep. 14, 2012 ¥ 10,000 million 9,986 9,996(9,996)
89,099(89,099)
0.73 Sep. 14, 2017
41st Unsecured Straight Bond Mar. 12, 2013 – 298,957(298,957)
– – 1.47 Mar. 10, 2017
42nd Unsecured Straight Bond Mar. 1, 2013 – 69,938(69,938)
– – 1.47 Mar. 1, 2017
43rd Unsecured Straight Bond Jun. 20, 2013 ¥400,000 million 397,795 398,813 3,554,800 1.74 Jun. 20, 201844th Unsecured Straight Bond Nov. 29, 2013 ¥ 50,000 million 49,850 49,883 444,630 1.69 Nov. 27, 202045th Unsecured Straight Bond May 30, 2014 ¥300,000 million 297,608 298,384 2,659,631 1.45 May 30, 201946th Unsecured Straight Bond Sep. 12, 2014 ¥400,000 million 396,497 397,522 3,543,293 1.26 Sep. 12, 201947th Unsecured Straight Bond Jun. 18, 2015 ¥100,000 million 98,919 99,178 884,018 1.36 Jun. 18, 202048th Unsecured Straight Bond Dec. 10, 2015 ¥370,000 million 365,529 366,200 3,264,106 2.13 Dec. 9, 202249th Unsecured Straight Bond Apr. 20, 2016 ¥ 20,000 million – 19,919 177,547 1.94 Apr. 20, 202350th Unsecured Straight Bond Apr. 20, 2016 ¥ 30,000 million – 29,862 266,173 2.48 Apr. 20, 202651st Unsecured Straight Bond Mar. 16, 2017 ¥400,000 million – 394,989 3,520,715 2.03 Mar. 15, 202452nd Unsecured Straight Bond Mar. 8, 2017 ¥ 50,000 million – 49,777 443,685 2.03 Mar. 8, 2024USD-denominated Senior Notes due 2020 Apr. 23, 2013 $2,485 million 277,330 276,791 2,467,163 4.50 Apr. 15, 2020USD-denominated Senior Notes due 2022 Jul. 28, 2015 $1,000 million 110,982 110,770 987,343 5.38 Jul. 30, 2022USD-denominated Senior Notes due 2025 Jul. 28, 2015 $1,000 million 110,921 110,628 986,077 6.00 Jul. 30, 2025Euro-denominated Senior Notes due 2020 Apr. 23, 2013 € 625 million 78,951 74,263 661,940 4.63 Apr. 15, 2020
Euro-denominated Senior Notes due 2022 Jul. 28, 2015 € 500 million 62,834 59,094 526,731 4.00 Jul. 30, 2022Euro-denominated Senior Notes due 2025 Jul. 28, 2015 €1,250 million 157,167 147,681 1,316,347 4.75 Jul. 30, 2025Euro-denominated Senior Notes due 2027 Jul. 28, 2015 € 500 million 62,797 58,995 525,849 5.25 Jul. 30, 20271st Unsecured Subordinated Corporate Bond Dec. 19, 2014 ¥400,000 million 393,792 394,887 3,519,806 2.50 Dec. 17, 2021
2nd Unsecured Subordinated Corporate Bond Feb. 9, 2015 ¥450,000 million 442,811 444,043 3,957,954 2.50 Feb. 9, 20221st Unsecured Subordinated Bonds with interest deferrable clause and early redeemable option (with a subordination provision)7,8 Sep. 16, 2016 ¥55,600 million – 55,080 490,953 3.00 Sep. 13, 2041
2nd Unsecured Subordinated Bonds with interest deferrable clause and early redeemable option (with a subordination provision)7,9 Sep. 16, 2016 ¥15,400 million – 15,251 135,939 3.50 Sep. 16, 2043
3rd Unsecured Subordinated Bonds with interest deferrable clause and early redeemable option (with a subordination provision)7,10 Sep. 30, 2016 ¥400,000 million – 392,478 3,498,333 3.00 Sep. 30, 2041
Subtotal 3,892,486(468,877)
4,364,435(119,947)
38,902,175(1,069,142)
SoftBank Group Corp. ANNUAL REPORT 2017 128Trajectory of
the Information RevolutionBringing the Future Forward
EssentialInformation
Management Organization
Corporate Information
Financial Section

Company name / Name of bond Date of issuanceBalance of issue
amount5
As of March 31, 2016(Millions of yen)6
As of March 31, 2017(Millions of yen)6
As of March 31, 2017(Thousands of U.S. dollars)6 Interest rate (%) Date of maturity
Sprint Corporation
7.25% Notes due 2021 Sep. 11, 2013 $2,250 million ¥ 250,800 ¥ 250,207 $ 2,230,208 7.25 Sep. 15, 2021
7.875% Notes due 2023 Sep. 11, 2013 $4,250 million 473,274 471,965 4,206,837 7.88 Sep. 15, 2023
7.125% Notes due 2024 Dec. 12, 2013 $2,500 million 278,258 277,466 2,473,179 7.13 Jun. 15, 2024
7.625% Notes due 2025 Feb. 24, 2015 $1,500 million 166,942 166,449 1,483,635 7.63 Feb. 15, 2025
Subtotal 1,169,274 1,166,087 10,393,859
Sprint Communications, Inc.11
Export Development Canada Facility (Tranche 3) 12, 13 Dec. 17, 2014 $ 300 million 33,677 33,562 299,153 3.48 Dec. 17, 2019
Export Development Canada Facility (Tranche 4) 14 Dec. 15, 2015 – 28,120 – – 6.23 Dec. 15, 2017
6% Senior Notes due 2016 Nov. 20, 2006 – 228,186(228,186)
– – 6.00 Dec. 1, 2016
9.125% Senior Notes due 2017 Mar. 1, 2012 – 117,175(117,175)
– – 9.13 Mar. 1, 2017
8.375% Senior Notes due 2017 Aug. 13, 2009 $1,300 million 152,808 147,604(147,604)
1,315,661(1,315,661)
8.38 Aug. 15, 2017
9% Guaranteed Notes due 2018 Nov. 9, 2011 $3,000 million 367,908 355,457 3,168,348 9.00 Nov. 15, 2018
7% Guaranteed Notes due 2020 Mar. 1, 2012 $1,000 million 118,404 116,549 1,038,854 7.00 Mar. 1, 2020
7% Senior Notes due 2020 Aug. 14, 2012 $1,500 million 173,618 171,923 1,532,427 7.00 Aug. 15, 2020
11.5% Senior Notes due 2021 Nov. 9, 2011 $1,000 million 140,716 135,814 1,210,571 11.50 Nov. 15, 2021
9.25% Debentures due 202213 Apr. 15, 1992 $ 200 million 25,979 25,382 226,241 9.25 Apr. 15, 2022
6% Senior Notes due 2022 Nov. 14, 2012 $2,280 million 254,072 253,323 2,257,983 6.00 Nov. 15, 2022
Subtotal 1,640,663(345,361)
1,239,614(147,604)
11,049,238(1,315,661)
SoftBank Group Corp. ANNUAL REPORT 2017 129Trajectory of
the Information RevolutionBringing the Future Forward
EssentialInformation
Management Organization
Corporate Information
Financial Section

Company name / Name of bond Date of issuanceBalance of issue
amount5
As of March 31, 2016(Millions of yen)6
As of March 31, 2017(Millions of yen)6
As of March 31, 2017(Thousands of U.S. dollars)6 Interest rate (%) Date of maturity
Sprint Capital Corporation11
6.9% Senior Notes due 2019 May 6, 1999 $ 1,729 million ¥ 198,603 ¥ 196,611 $ 1,752,482 6.90 May 1, 2019
6.875% Senior Notes due 2028 Nov. 16, 1998 $ 2,475 million 260,812 260,563 2,322,515 6.88 Nov. 15, 2028
8.75% Senior Notes due 2032 Mar. 14, 2002 $ 2,000 million 240,571 239,029 2,130,574 8.75 Mar. 15, 2032
Subtotal 699,986 696,203 6,205,571
Clearwire Communications LLC11
14.75% First-Priority Senior Secured Notes due 201613 Jan. 27, 2012 – 36,374(36,374)
– – 14.75 Dec. 1, 2016
8.25% Exchangeable Notes due 2040 Dec. 8, 2010 $ 629 million 73,749(50,073)
71,761(71,761)
639,638(639,638)
8.25 Dec. 1, 2040
Subtotal 110,123(86,447)
71,761(71,761)
639,638(639,638)
Other companies
Straight Bond May 25, 2012 - Feb. 28, 2017 ¥35,200 million 100 35,200(150)
313,753(1,337)
0.04 – 0.70
May 25, 2017 - Feb. 28, 2024
Subtotal 100 35,200(150)
313,753(1,337)
Total ¥7,512,632(900,685)
¥7,573,300(339,462)
$67,504,234(3,025,778)
Notes:5. Balance of issue amount is as of March 31, 2017. 6. Figures in parentheses as of March 31, 2016 and March 31, 2017 represent the current portion.7. The interest rate stated above is at the time of issuance. The bond has a step-up coupon provision and its interest rate may increase in the future.8. The bond has an early redeemable option at the Company’s discretion from September 16, 2021 and each interest date after September 16, 2021.9. The bond has an early redeemable option at the Company’s discretion from September 16, 2023 and each interest date after September 16, 2023.10. The bond has an early redeemable option at the Company’s discretion from September 30, 2021 and each interest date after September 30, 2021.11. Sprint Communications, Inc., Sprint Capital Corporation and Clearwire Communications LLC are Sprint Corporation’s subsidiaries. 12. The interest rates are floating interest rates, and the above interest rates represent the rates as of March 31, 2017.13. Collateral is pledged against these bonds. The details are described in “(5) Assets pledged as collateral.” 14. The notes are redeemed early as of March 31, 2017. The interest rates are floating interest rates, and the above interest rates represent the rates at the time of redemption.
SoftBank Group Corp. ANNUAL REPORT 2017 130Trajectory of
the Information RevolutionBringing the Future Forward
EssentialInformation
Management Organization
Corporate Information
Financial Section

(2) Transaction for sale of Alibaba shares by variable prepaid forward contractOn June 10, 2016, West Raptor Holdings, LLC (“WRH LLC”), a wholly-owned subsidiary of the Company,
entered into a variable prepaid forward contract to sell Alibaba shares with a newly formed trust, Mandatory
Exchangeable Trust (the “Trust”), and received proceeds of ¥578,436 million ($5.4 billion) as advances
received on the sale.
The Trust, on the other hand, utilized Alibaba shares scheduled to be transferred from WRH LLC at the
time of settlement under the contract and issued $6.6 billion of Mandatory Exchangeable Trust Securities
(“Trust Securities”) which are mandatorily exchangeable into American depositary shares (“ADSs”) of Alibaba.
The proceeds from the sale received by WRH LLC from the Trust was $5.4 billion, which is after certain
amounts from the $6.6 billion total of Trust Securities were deducted in order to purchase U.S. Treasury
securities, which would fund distributions on the Trust Securities, and to cover expenses for the issuance of
the Trust Securities.
The settlement of the Alibaba shares based on the variable prepaid forward contract is conducted
concurrently with the exchange of Trust Securities. At the exchange date, which is expected to be the first
scheduled trading day after June 1, 2019, Trust Securities are exchanged for a certain number of ADSs,
determined by reference to the trading price of the ADSs at that time, and the number of Alibaba shares sold
by the variable prepaid forward contract is determined by this number of ADSs. A cap and a floor are set for
the number of shares settled, and the variable prepaid forward contract is classified as a hybrid financial
instrument with embedded derivatives of collar transaction.
The Company accounts for the variable prepaid forward contract by bifurcating the main contracts and
embedded derivatives. The Company received ¥578,436 million ($5,155,860 thousand) and initially recog-
nized ¥674,023 million ($6,007,871 thousand) as financial liabilities relating to the sale of shares through the
variable prepaid forward contract and ¥95,587 million ($852,010 thousand) as derivative assets. Subsequent
to initial recognition, financial liabilities relating to the sale of shares through the variable prepaid forward
contract are measured at amortized cost and embedded derivatives are measured at fair value; ¥715,448
million ($6,377,110 thousand) is recognized as financial liabilities relating to the sale of shares through the
variable prepaid forward contract in interest-bearing debt (non-current liabilities) and ¥143,935 million
($1,282,958 thousand) is recognized as derivative liabilities in other financial liabilities (non-current liabilities)
in the consolidated statement of financial position as of March 31, 2017; ¥232,729 million ($2,074,418
thousand) is recognized as a derivative loss in the consolidated statement of income for the fiscal year ended
March 31, 2017. The details are described in “(2) Financial risk management a. Market risk (b) Price risk” in
“Note 25. Financial instruments.”
WRH LLC has the option (“cash settlement option”) to settle the variable prepaid forward contract by
either delivering cash or a combination of cash and Alibaba shares. If WRH LLC elects the cash settlement
option, the cash equivalent to the fair value of the number of shares for the settlement, which is determined
by the transaction price of ADSs, will be paid.
Also, WRH LLC has the option (“early settlement option”) to settle the variable prepaid forward contract
prior to the scheduled settlement date. Settlement of the variable prepaid forward contract may be made prior
to the scheduled settlement date if WRH LLC elects the early settlement option or under certain circumstances.
Alibaba shares held by WRH LLC are pledged as collateral. The Company applies the equity method to
these shares and they are included in “Investments accounted for using the equity method” in the consoli-
dated statement of financial position as of March 31, 2017. The carrying amount of Alibaba shares pledged
as collateral by the Company is ¥154,440 million ($1,376,593 thousand) as of March 31, 2017.
Outline of the transaction
Note:In order to represent the main point of the transaction, the outline shows only the main components related to the transaction and the relation-ship between the Company and each company in a simplified manner.
(3) Financial covenantsa. Financial covenants on interest-bearing debts of SoftBank Group Corp.
SoftBank Group Corp.’s interest-bearing debt includes financial covenants and the major financial
covenants are as follows:
(a) The amount of SoftBank Group Corp.’s net assets at the end of the fiscal year must not fall below
75% of SoftBank Group Corp.’s net assets at the end of the previous year.
(b) The consolidated statement of financial position of the Company at the end of the fiscal year must
not show a net capital deficiency. The statement of financial position of SoftBank Corp. at the end
of the fiscal year must not show a net capital deficiency.
Approximately $5.4 billion for advances received for the sale of Alibaba shares
by variable prepaid forward contract
$6.6 billion for the total issuance amount of
Trust Securities
Alibaba shares pledged as collateral by variable prepaid forward contract
Offering of Mandatory Exchangeable Trust Securities (“Trust Securities”)
subsidiary
third party to SoftBank
West Raptor Holdings, LLC
Mandatory Exchangeable Trust
wholly-owned subsidiary
Investors
SoftBank Group Corp. ANNUAL REPORT 2017 131Trajectory of
the Information RevolutionBringing the Future Forward
EssentialInformation
Management Organization
Corporate Information
Financial Section

(c) In the Company’s consolidated financial statements, operating income (loss) or net income (loss)
attributable to the owner of the parent company must not result in losses for two consecutive years.
(d) Adjusted net interest-bearing debts1 or leverage ratios2 designated in the loan agreement must not
exceed certain respective amounts or numbers at the end of each annual reporting period and at
the end of the second quarter. The threshold amounts of adjusted net interest-bearing debts and
leverage ratios shall be softened when the balance of cash and cash equivalents and the fair value
of particular listed shares held by SoftBank Group Corp. exceed certain amounts, respectively.
Notes:1. Adjusted net interest-bearing debts:
Amounts deducting cash and cash equivalents from interest-bearing debts in the consolidated statement of financial position. Certain adjustments are made such as excluding certain listed subsidiaries such as Sprint from the subject.
2. Leverage ratio: Adjusted net interest-bearing debt / adjusted EBITDA3
3. Adjusted EBITDA: Certain adjustments are made to EBITDA such as excluding listed subsidiaries such as Sprint.
b. Financial covenants on interest-bearing debts of Sprint
Major covenants on the interest-bearing debt issued by Sprint are as follows:
(a) Holders of a portion ($24.1 billion) of interest-bearing debts of Sprint are provided with the right to
require Sprint to repurchase the interest-bearing debts if there is a change of control and if there is
a decline, to a certain extent, in ratings of the applicable interest-bearing debts by the Rating
Services.
(b) It is required that as of the last day of each quarter, Sprint’s ratio of total indebtedness1 to adjusted
EBITDA2 should not exceed a certain threshold level. Exceeding the ratio could result in the
maturities being accelerated. The limit for the ratio was 6.00 as of March 31, 2017.
Notes:1. Total indebtedness:
The sum of Sprint’s outstanding debt (excluding trade payables) and guarantee of indebtedness, with certain adjustments defined in contracts with lenders.
2. Adjusted EBITDA: Trailing four quarters EBITDA including adjustments defined in contract with lenders.
(4) Borrowings related to equity securities lending contractThe Company entered into a securities lending contract regarding stocks of certain subsidiaries. As of March
31, 2017, the amount of the received cash is recognized as short-term borrowings of ¥399,402 million
($3,560,050 thousand) (as of March 31, 2016: ¥149,050 million) and included in interest-bearing debt.
(5) Assets pledged as collateral Assets pledged as collateral for liabilities are as follows:
(Millions of yen)(Thousands of
U.S. dollars)
As of March 31, 2016
As ofMarch 31, 2017
As ofMarch 31, 2017
Cash and cash equivalents . . . . . . . . . . . . . . . . . ¥ 496 ¥ 325 $ 2,897Trade and other receivables . . . . . . . . . . . . . . . . 9,248 7,154 63,767Other financial assets (current)1 . . . . . . . . . . . . . 31,131 4,397 39,192Inventories . . . . . . . . . . . . . . . . . . . . . . . . . . . . . 2,704 2,818 25,118Property, plant and equipment . . . . . . . . . . . . . . 238,127 661,029 5,892,050Investments accounted for using the equity method2 . . . . . . . . . . . . . . . . . . . . . – 154,440 1,376,593Total . . . . . . . . . . . . . . . . . . . . . . . . . . . . . . . . ¥281,706 ¥830,163 $7,399,617
Liabilities related to these assets pledged as collateral are as follows:
(Millions of yen)(Thousands of
U.S. dollars)
As ofMarch 31, 2016
As ofMarch 31, 2017
As ofMarch 31, 2017
Trade and other payables1 . . . . . . . . . . . . . . . . . ¥ 21,623 ¥ 4,397 $ 39,192Interest-bearing debt
Short-term borrowings . . . . . . . . . . . . . . . . . . 6,695 179 1,596Current portion of long-term borrowings . . . . 82,031 204,426 1,822,141Long-term borrowings . . . . . . . . . . . . . . . . . . 80,082 79,071 704,796Financial liabilities relating to sale of shares by variable prepaid forward contract2 . . . . . . . . – 715,448 6,377,110Total . . . . . . . . . . . . . . . . . . . . . . . . . . . . . . ¥190,431 ¥1,003,521 $8,944,835
Other than the above, the following assets are pledged as collateral.
a. Sprint
As of March 31, 2016, approximately $13.6 billion (before consolidation adjustments) in the assets of
a subsidiary, Clearwire Communications LLC, is pledged as collateral for the $0.3 billion corporate
bond issued by Clearwire Communications LLC.
As of March 31, 2017, approximately $74.4 billion (before consolidation adjustments) in the assets
of Sprint is pledged as collateral for approximately the $8.3 billion borrowing and corporate bonds.
SoftBank Group Corp. ANNUAL REPORT 2017 132Trajectory of
the Information RevolutionBringing the Future Forward
EssentialInformation
Management Organization
Corporate Information
Financial Section

b. Brightstar
As of March 31, 2017, approximately $2.0 billion (before consolidation adjustments) (for the fiscal year
ended March 31, 2016: $2.8 billion) of the assets of Brightstar were pledged as collateral on the $0.7
billion (as of March 31, 2016: $0.7 billion) borrowing.
Notes:1. These are trade payables for Brightstar; “Derivative deposits” included in “Other financial assets (current)” that are pledged as collateral.2. The details are described in “(2) Transaction for sale of Alibaba shares by variable prepaid forward contract.”
(6) Assets with limited property rights Assets with limited property rights due to the installment purchase are as follows:
(Millions of yen)(Thousands of
U.S. dollars)
As ofMarch 31, 2016
As ofMarch 31, 2017
As ofMarch 31, 2017
Property, plant and equipment . . . . . . . . . . . . . . ¥109,602 ¥ 80,847 $720,626Intangible assets . . . . . . . . . . . . . . . . . . . . . . . . 35,286 26,376 235,101Other non-current assets . . . . . . . . . . . . . . . . . . 69 19 169
Total . . . . . . . . . . . . . . . . . . . . . . . . . . . . . . . . ¥144,957 ¥107,242 $955,896
Liabilities related to the assets with limited property rights above are as follows:
(Millions of yen)(Thousands of
U.S. dollars)
As ofMarch 31, 2016
As ofMarch 31, 2017
As ofMarch 31, 2017
Interest-bearing debtCurrent portion of installment payables . . . . . ¥ 41,538 ¥36,580 $326,054Installment payables . . . . . . . . . . . . . . . . . . . . 60,963 24,268 216,312
Total . . . . . . . . . . . . . . . . . . . . . . . . . . . . . . ¥102,501 ¥60,848 $542,366
Other than the above, the lessor retains the property rights of leased assets in finance lease obligations. The
details are described in “Note 12. Property, plant and equipment,” “Note 13. Goodwill and intangible assets”
and “Note 14. Leases.”
(7) Components of increase in short-term interest-bearing debt, netThe components of “Increase in short-term interest-bearing debt, net” in the consolidated statement of cash
flows are as follows:
(Millions of yen)(Thousands of
U.S. dollars)
Fiscal year endedMarch 31, 2016
Fiscal year endedMarch 31, 2017
Fiscal year endedMarch 31, 2017
Net increase of short-term borrowings . . . . . . . . ¥118,135 ¥322,216 $2,872,056Net increase of commercial paper . . . . . . . . . . . 10,000 38,000 338,711
Total . . . . . . . . . . . . . . . . . . . . . . . . . . . . . . . . ¥128,135 ¥360,216 $3,210,767
(8) Components of proceeds from long-term interest-bearing debtThe components of “Proceeds from long-term interest-bearing debt” in the consolidated statement of cash
flows are as follows:
(Millions of yen)(Thousands of
U.S. dollars)
Fiscal year endedMarch 31, 2016
Fiscal year endedMarch 31, 2017
Fiscal year endedMarch 31, 2017
Proceeds from long-term borrowings . . . . . . . . . ¥ 557,072 ¥2,715,725 $24,206,480Proceeds from issuance of corporate bonds . . . . 1,053,258 1,006,000 8,966,931Proceeds from sale-leaseback of newly acquired equipment . . . . . . . . . . . . . . . . . . . . . . . . . . . . 519,353 492,369 4,388,707
Proceeds from advances received for sale of shares by variable prepaid forward contract* . . – 578,436 5,155,860Total . . . . . . . . . . . . . . . . . . . . . . . . . . . . . . . . ¥2,129,683 ¥4,792,530 $42,717,978
Note:* The amount was received as advances for sale of Alibaba shares by variable prepaid forward contract. The variable prepaid forward contract is a
hybrid financial instrument. Regarding the proceeds of ¥578,436 million ($5,155,860 thousand), financial liabilities relating to the sale of shares through the variable prepaid forward contract and derivatives are accounted for and recorded separately. The details are described in “(2) Transaction for sale of Alibaba shares by variable prepaid forward contract.”
SoftBank Group Corp. ANNUAL REPORT 2017 133Trajectory of
the Information RevolutionBringing the Future Forward
EssentialInformation
Management Organization
Corporate Information
Financial Section
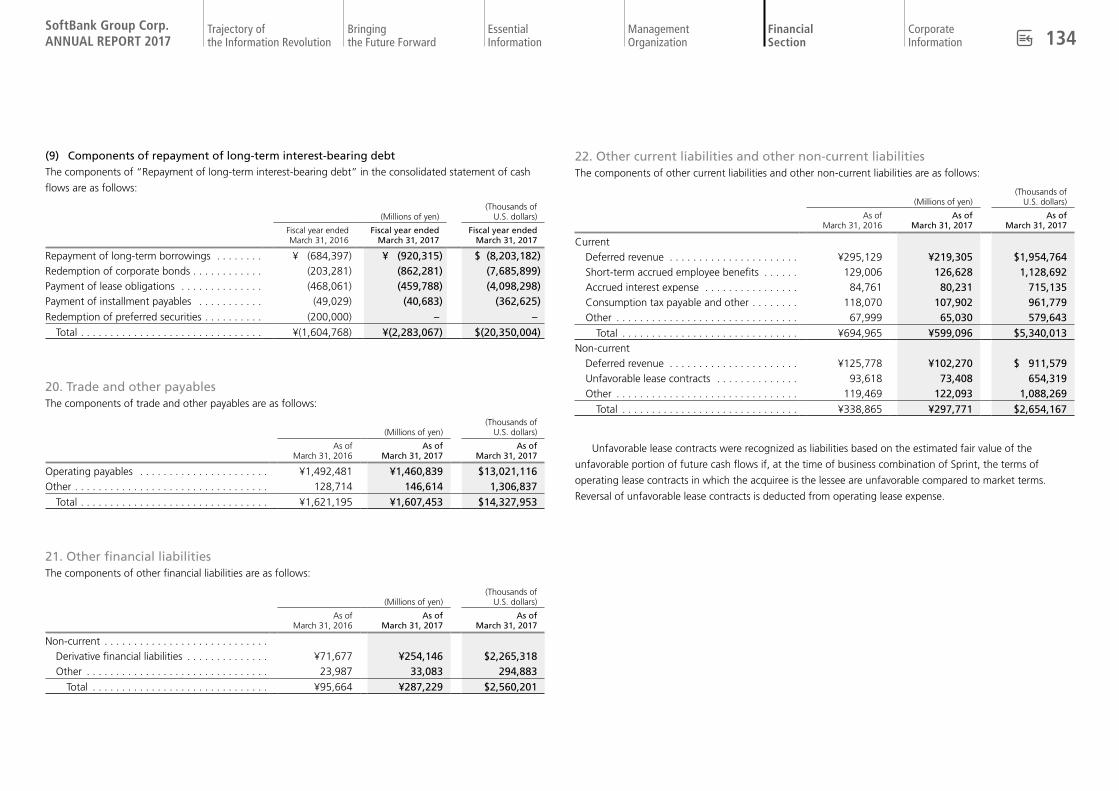
(9) Components of repayment of long-term interest-bearing debtThe components of “Repayment of long-term interest-bearing debt” in the consolidated statement of cash
flows are as follows:
(Millions of yen)(Thousands of
U.S. dollars)
Fiscal year endedMarch 31, 2016
Fiscal year endedMarch 31, 2017
Fiscal year endedMarch 31, 2017
Repayment of long-term borrowings . . . . . . . . ¥ (684,397) ¥ (920,315) $ (8,203,182)Redemption of corporate bonds . . . . . . . . . . . . (203,281) (862,281) (7,685,899)Payment of lease obligations . . . . . . . . . . . . . . (468,061) (459,788) (4,098,298)Payment of installment payables . . . . . . . . . . . (49,029) (40,683) (362,625)Redemption of preferred securities . . . . . . . . . . (200,000) – –
Total . . . . . . . . . . . . . . . . . . . . . . . . . . . . . . . ¥(1,604,768) ¥(2,283,067) $(20,350,004)
20. Trade and other payablesThe components of trade and other payables are as follows:
(Millions of yen)(Thousands of
U.S. dollars)
As ofMarch 31, 2016
As ofMarch 31, 2017
As ofMarch 31, 2017
Operating payables . . . . . . . . . . . . . . . . . . . . . . ¥1,492,481 ¥1,460,839 $13,021,116 Other . . . . . . . . . . . . . . . . . . . . . . . . . . . . . . . . . 128,714 146,614 1,306,837
Total . . . . . . . . . . . . . . . . . . . . . . . . . . . . . . . . ¥1,621,195 ¥1,607,453 $14,327,953
21. Other financial liabilitiesThe components of other financial liabilities are as follows:
(Millions of yen)(Thousands of
U.S. dollars)
As ofMarch 31, 2016
As ofMarch 31, 2017
As ofMarch 31, 2017
Non-current . . . . . . . . . . . . . . . . . . . . . . . . . . . .Derivative financial liabilities . . . . . . . . . . . . . . ¥71,677 ¥254,146 $2,265,318Other . . . . . . . . . . . . . . . . . . . . . . . . . . . . . . . 23,987 33,083 294,883
Total . . . . . . . . . . . . . . . . . . . . . . . . . . . . . . ¥95,664 ¥287,229 $2,560,201
22. Other current liabilities and other non-current liabilitiesThe components of other current liabilities and other non-current liabilities are as follows:
(Millions of yen)(Thousands of
U.S. dollars)
As ofMarch 31, 2016
As ofMarch 31, 2017
As ofMarch 31, 2017
CurrentDeferred revenue . . . . . . . . . . . . . . . . . . . . . . ¥295,129 ¥219,305 $1,954,764Short-term accrued employee benefits . . . . . . 129,006 126,628 1,128,692Accrued interest expense . . . . . . . . . . . . . . . . 84,761 80,231 715,135Consumption tax payable and other . . . . . . . . 118,070 107,902 961,779Other . . . . . . . . . . . . . . . . . . . . . . . . . . . . . . . 67,999 65,030 579,643
Total . . . . . . . . . . . . . . . . . . . . . . . . . . . . . . ¥694,965 ¥599,096 $5,340,013Non-current
Deferred revenue . . . . . . . . . . . . . . . . . . . . . . ¥125,778 ¥102,270 $ 911,579Unfavorable lease contracts . . . . . . . . . . . . . . 93,618 73,408 654,319Other . . . . . . . . . . . . . . . . . . . . . . . . . . . . . . . 119,469 122,093 1,088,269
Total . . . . . . . . . . . . . . . . . . . . . . . . . . . . . . ¥338,865 ¥297,771 $2,654,167
Unfavorable lease contracts were recognized as liabilities based on the estimated fair value of the
unfavorable portion of future cash flows if, at the time of business combination of Sprint, the terms of
operating lease contracts in which the acquiree is the lessee are unfavorable compared to market terms.
Reversal of unfavorable lease contracts is deducted from operating lease expense.
SoftBank Group Corp. ANNUAL REPORT 2017 134Trajectory of
the Information RevolutionBringing the Future Forward
EssentialInformation
Management Organization
Corporate Information
Financial Section

23. ProvisionsThe changes in the provisions are as follows:
(Millions of yen)
Asset retirement obligations
Restructuring provisions
Provision for loss on interest repayment
Provision for onerous contract Other Total
As of April 1, 2016 . . . . . . . . . . . . . . . . . . . . . . . . . . . . . . . . . . . . . . . . . . . . . . . . . . . . ¥ 81,875 ¥ 37,000 ¥20,281 ¥16,683 ¥19,157 ¥174,996Recognition of provisions . . . . . . . . . . . . . . . . . . . . . . . . . . . . . . . . . . . . . . . . . . . . . . . . 7,535 9,542 – 2,330 4,070 23,477Interest due to passage of time . . . . . . . . . . . . . . . . . . . . . . . . . . . . . . . . . . . . . . . . . . . 4,916 2,006 – – 700 7,622Used . . . . . . . . . . . . . . . . . . . . . . . . . . . . . . . . . . . . . . . . . . . . . . . . . . . . . . . . . . . . . . . (12,041) (15,972) (3,391) (4,430) (5,533) (41,367)Reversal of provisions . . . . . . . . . . . . . . . . . . . . . . . . . . . . . . . . . . . . . . . . . . . . . . . . . . . – (4,117) – – (413) (4,530)Change in estimate1 . . . . . . . . . . . . . . . . . . . . . . . . . . . . . . . . . . . . . . . . . . . . . . . . . . . . 32,528 1,690 – – 556 34,774Exchange differences . . . . . . . . . . . . . . . . . . . . . . . . . . . . . . . . . . . . . . . . . . . . . . . . . . . 850 (252) – – (192) 406Other . . . . . . . . . . . . . . . . . . . . . . . . . . . . . . . . . . . . . . . . . . . . . . . . . . . . . . . . . . . . . . . (57) – – – (229) (286)As of March 31, 2017 . . . . . . . . . . . . . . . . . . . . . . . . . . . . . . . . . . . . . . . . . . . . . . . . . . ¥115,606 ¥ 29,897 ¥16,890 ¥14,583 ¥18,116 ¥195,092
Current liabilities . . . . . . . . . . . . . . . . . . . . . . . . . . . . . . . . . . . . . . . . . . . . . . . . . . . . . . ¥ 20,221 ¥ 14,671 ¥ 2,788 ¥ 6,085 ¥12,597 ¥ 56,362Non-current liabilities . . . . . . . . . . . . . . . . . . . . . . . . . . . . . . . . . . . . . . . . . . . . . . . . . . . 95,385 15,226 14,102 8,498 5,519 138,730
Total . . . . . . . . . . . . . . . . . . . . . . . . . . . . . . . . . . . . . . . . . . . . . . . . . . . . . . . . . . . . . . ¥115,606 ¥ 29,897 ¥16,890 ¥14,583 ¥18,116 ¥195,092
(Thousands of U.S. dollars)
Asset retirementobligations
Restructuring provisions
Provision for loss on interest repayment
Provision for onerous contract Other Total
As of April 1, 2016 . . . . . . . . . . . . . . . . . . . . . . . . . . . . . . . . . . . . . . . . . . . . . . . . . . . . $ 729,789 $ 329,798 $180,774 $148,703 $170,754 $1,559,818Recognition of provisions . . . . . . . . . . . . . . . . . . . . . . . . . . . . . . . . . . . . . . . . . . . . . . . . 67,163 85,052 – 20,768 36,278 209,261Interest due to passage of time . . . . . . . . . . . . . . . . . . . . . . . . . . . . . . . . . . . . . . . . . . . 43,819 17,880 – – 6,239 67,938Used . . . . . . . . . . . . . . . . . . . . . . . . . . . . . . . . . . . . . . . . . . . . . . . . . . . . . . . . . . . . . . . (107,327) (142,366) (30,226) (39,486) (49,318) (368,723)Reversal of provisions . . . . . . . . . . . . . . . . . . . . . . . . . . . . . . . . . . . . . . . . . . . . . . . . . . . – (36,697) – – (3,681) (40,378)Change in estimate1 . . . . . . . . . . . . . . . . . . . . . . . . . . . . . . . . . . . . . . . . . . . . . . . . . . . . 289,937 15,064 – – 4,956 309,957Exchange differences . . . . . . . . . . . . . . . . . . . . . . . . . . . . . . . . . . . . . . . . . . . . . . . . . . . 7,576 (2,246) – – (1,711) 3,619Other . . . . . . . . . . . . . . . . . . . . . . . . . . . . . . . . . . . . . . . . . . . . . . . . . . . . . . . . . . . . . . . (509) – – – (2,040) (2,549)As of March 31, 2017 . . . . . . . . . . . . . . . . . . . . . . . . . . . . . . . . . . . . . . . . . . . . . . . . . . $1,030,448 $ 266,485 $150,548 $129,985 $161,477 $1,738,943
Current liabilities . . . . . . . . . . . . . . . . . . . . . . . . . . . . . . . . . . . . . . . . . . . . . . . . . . . . . . $ 180,239 $ 130,769 $ 24,851 $ 54,238 $112,283 $ 502,380Non-current liabilities . . . . . . . . . . . . . . . . . . . . . . . . . . . . . . . . . . . . . . . . . . . . . . . . . . . 850,209 135,716 125,697 75,747 49,194 1,236,563
Total . . . . . . . . . . . . . . . . . . . . . . . . . . . . . . . . . . . . . . . . . . . . . . . . . . . . . . . . . . . . . . $1,030,448 $ 266,485 $150,548 $129,985 $161,477 $1,738,943
Notes:1. Sprint reflected current market assessment of specific risk in the estimate of discount rate. As a result, the discount rate in Sprint decreased for the year ended March 31, 2017. With this change, the amount of “Provisions” and “Property, plant and equipment” in the consolidated statement of
financial position as of March 31, 2017 increased by ¥21,351 million ($202 million) and ¥13,920 million ($131 million) respectively. Also, the amount of “Cost of sales” in the consolidated statement of income for the year ended March 31, 2017 increased by ¥5,185 million ($49 million) and “Other operating loss” decreased by ¥2,246 million ($22 million).
2. SoftBank Corp. considered the demand of communication traffic, efficient operation of communication equipment and equipment replacement. As a result, it has become highly probable that certain communications equipment will be disposed, and SoftBank Corp. recognized asset retirement obligations. With this change, the amount of “Provisions” and “Property, plant and equipment” in the consolidated statement of financial position as of March 31, 2017 increased by ¥13,802 million ($123,023 thousand) and ¥11,418 million ($101,774 thousand) respectively. Also, the amount of “Cost of sales” in the consolidated statement of income for the year ended March 31, 2017 increased by ¥2,387 million ($21,276 thousand).
SoftBank Group Corp. ANNUAL REPORT 2017 135Trajectory of
the Information RevolutionBringing the Future Forward
EssentialInformation
Management Organization
Corporate Information
Financial Section
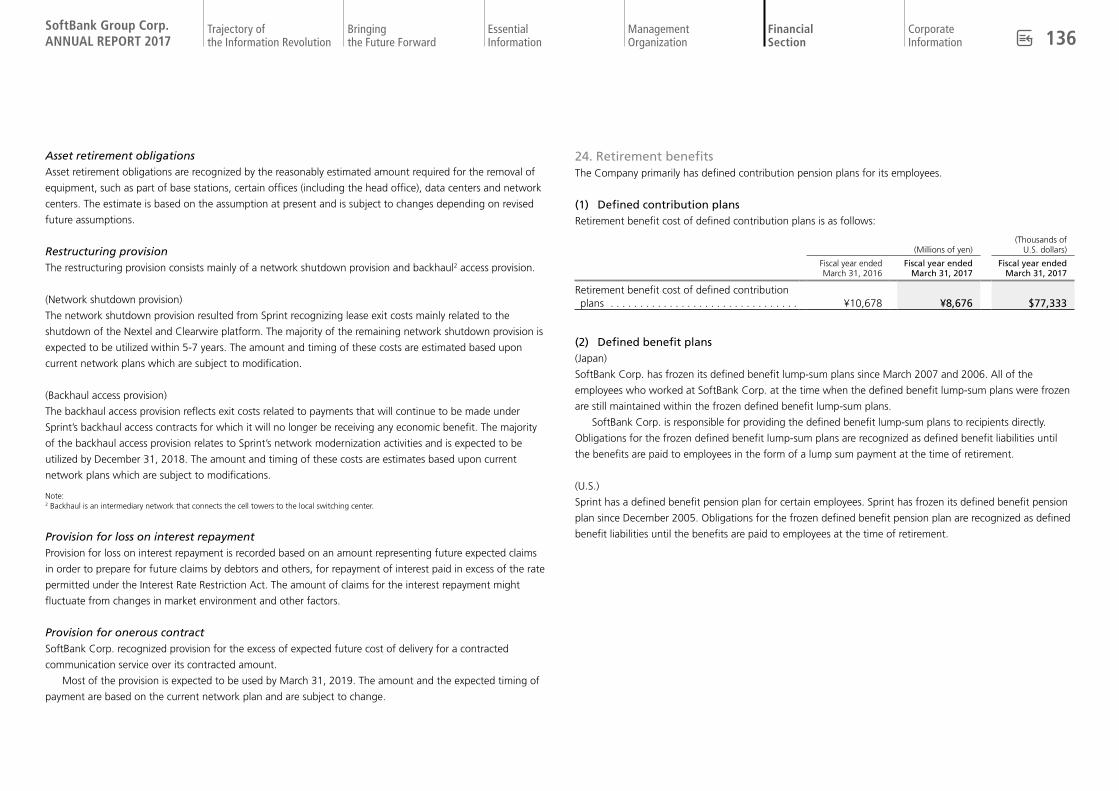
Asset retirement obligationsAsset retirement obligations are recognized by the reasonably estimated amount required for the removal of
equipment, such as part of base stations, certain offices (including the head office), data centers and network
centers. The estimate is based on the assumption at present and is subject to changes depending on revised
future assumptions.
Restructuring provisionThe restructuring provision consists mainly of a network shutdown provision and backhaul2 access provision.
(Network shutdown provision)
The network shutdown provision resulted from Sprint recognizing lease exit costs mainly related to the
shutdown of the Nextel and Clearwire platform. The majority of the remaining network shutdown provision is
expected to be utilized within 5-7 years. The amount and timing of these costs are estimated based upon
current network plans which are subject to modification.
(Backhaul access provision)
The backhaul access provision reflects exit costs related to payments that will continue to be made under
Sprint’s backhaul access contracts for which it will no longer be receiving any economic benefit. The majority
of the backhaul access provision relates to Sprint’s network modernization activities and is expected to be
utilized by December 31, 2018. The amount and timing of these costs are estimates based upon current
network plans which are subject to modifications.
Note:2 Backhaul is an intermediary network that connects the cell towers to the local switching center.
Provision for loss on interest repaymentProvision for loss on interest repayment is recorded based on an amount representing future expected claims
in order to prepare for future claims by debtors and others, for repayment of interest paid in excess of the rate
permitted under the Interest Rate Restriction Act. The amount of claims for the interest repayment might
fluctuate from changes in market environment and other factors.
Provision for onerous contractSoftBank Corp. recognized provision for the excess of expected future cost of delivery for a contracted
communication service over its contracted amount.
Most of the provision is expected to be used by March 31, 2019. The amount and the expected timing of
payment are based on the current network plan and are subject to change.
24. Retirement benefitsThe Company primarily has defined contribution pension plans for its employees.
(1) Defined contribution plansRetirement benefit cost of defined contribution plans is as follows:
(Millions of yen)(Thousands of
U.S. dollars)
Fiscal year endedMarch 31, 2016
Fiscal year endedMarch 31, 2017
Fiscal year endedMarch 31, 2017
Retirement benefit cost of defined contribution plans . . . . . . . . . . . . . . . . . . . . . . . . . . . . . . . . ¥10,678 ¥8,676 $77,333
(2) Defined benefit plans(Japan)
SoftBank Corp. has frozen its defined benefit lump-sum plans since March 2007 and 2006. All of the
employees who worked at SoftBank Corp. at the time when the defined benefit lump-sum plans were frozen
are still maintained within the frozen defined benefit lump-sum plans.
SoftBank Corp. is responsible for providing the defined benefit lump-sum plans to recipients directly.
Obligations for the frozen defined benefit lump-sum plans are recognized as defined benefit liabilities until
the benefits are paid to employees in the form of a lump sum payment at the time of retirement.
(U.S.)
Sprint has a defined benefit pension plan for certain employees. Sprint has frozen its defined benefit pension
plan since December 2005. Obligations for the frozen defined benefit pension plan are recognized as defined
benefit liabilities until the benefits are paid to employees at the time of retirement.
SoftBank Group Corp. ANNUAL REPORT 2017 136Trajectory of
the Information RevolutionBringing the Future Forward
EssentialInformation
Management Organization
Corporate Information
Financial Section

a. Changes in the present value of defined benefit obligations and the fair value of plan assets
Changes in the present value of defined benefit obligations and the fair value of plan assets are as
follows:
For the fiscal year ended March 31, 2016
(Millions of yen)
Japan U.S. Total
Defined benefit liabilities, net As of April 1, 2015 . . . . . . . . . . . . . . . . . ¥13,667 ¥ 114,615 ¥ 128,282
Changes in the present value of defined benefit obligations:As of April 1, 2015 . . . . . . . . . . . . . . . . 13,667 275,461 289,128
Business combination . . . . . . . . . . . . 2,024 – 2,024Service cost . . . . . . . . . . . . . . . . . . . . 351 33 384Interest cost . . . . . . . . . . . . . . . . . . . 112 11,269 11,381Remeasurements:
Actuarial gains (losses) arising from changes in demographic assumptions . . . . . . . . . . . . . . . . 2 (7,405) (7,403)
Actuarial gains (losses) arising from changes in financial assumptions . . . . . . . . . . . . . . . . 698 (3,872) (3,174)
Experience adjustments . . . . . . . . . 3 1,238 1,241Benefits paid . . . . . . . . . . . . . . . . . . . (1,071) (9,647) (10,718)Exchange differences . . . . . . . . . . . . – (17,098) (17,098)Other . . . . . . . . . . . . . . . . . . . . . . . . (185) (1,070) (1,255)
As of March 31, 2016 . . . . . . . . . . . . . 15,601 248,909 264,510
Changes in the fair value of plan assets:As of April 1, 2015 . . . . . . . . . . . . . . . . – (160,846) (160,846)
Interest income . . . . . . . . . . . . . . . . . – (6,597) (6,597)Remeasurements:
Return on plan assets . . . . . . . . . . – 9,196 9,196Benefits paid . . . . . . . . . . . . . . . . . . . – 8,411 8,411Employer contributions . . . . . . . . . . . – (743) (743)Exchange differences . . . . . . . . . . . . – 9,828 9,828
As of March 31, 2016 – (140,751) (140,751)
Defined benefit liabilities, netAs of March 31, 2016 . . . . . . . . . . . . . ¥15,601 ¥ 108,158 ¥ 123,759
For the fiscal year ended March 31, 2017
(Millions of yen)
Japan U.S. Total
Defined benefit liabilities, net As of April 1, 2016 . . . . . . . . . . . . . . . . . ¥15,601 ¥ 108,158 ¥ 123,759
Changes in the present value of defined benefit obligations:As of April 1, 2016 . . . . . . . . . . . . . . . . 15,601 248,909 264,510
Service cost . . . . . . . . . . . . . . . . . . . . 512 1 513Interest cost . . . . . . . . . . . . . . . . . . . . (5) 10,047 10,042Remeasurements:
Actuarial losses arising from changes in demographic assumptions . . . . – (3,687) (3,687)
Actuarial losses arising from changes in financial assumptions . . . . . . . . (89) (54) (143)
Experience adjustments . . . . . . . . . (2) (201) (203)Benefits paid . . . . . . . . . . . . . . . . . . . (752) (9,768) (10,520)Exchange differences . . . . . . . . . . . . . – (625) (625)Other . . . . . . . . . . . . . . . . . . . . . . . . . (132) (218) (350)
As of March 31, 2017 . . . . . . . . . . . . . . 15,133 244,404 259,537
Changes in the fair value of plan assets:As of April 1, 2016 . . . . . . . . . . . . . . . . – (140,751) (140,751)
Interest income . . . . . . . . . . . . . . . . . – (5,786) (5,786)Remeasurements:
Return on plan assets . . . . . . . . . . – (8,194) (8,194)Benefits paid . . . . . . . . . . . . . . . . . . . – 9,190 9,190Employer contributions . . . . . . . . . . . – (6,080) (6,080)Exchange differences . . . . . . . . . . . . . – 256 256
As of March 31, 2017 . . . . . . . . . . . . . . – (151,365) (151,365)
Defined benefit liabilities, netAs of March 31, 2017 . . . . . . . . . . . . . . ¥15,133 ¥ 93,039 ¥ 108,172
SoftBank Group Corp. ANNUAL REPORT 2017 137Trajectory of
the Information RevolutionBringing the Future Forward
EssentialInformation
Management Organization
Corporate Information
Financial Section
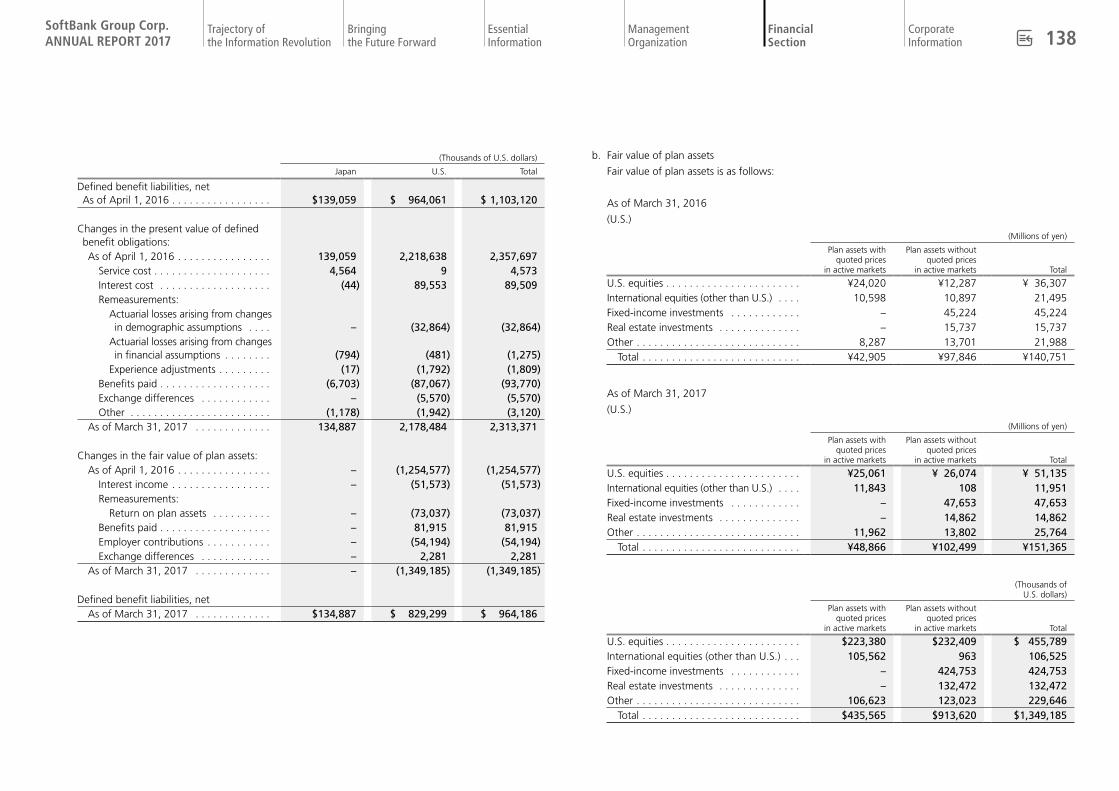
(Thousands of U.S. dollars)
Japan U.S. Total
Defined benefit liabilities, net As of April 1, 2016 . . . . . . . . . . . . . . . . . $139,059 $ 964,061 $ 1,103,120
Changes in the present value of defined benefit obligations:As of April 1, 2016 . . . . . . . . . . . . . . . . 139,059 2,218,638 2,357,697
Service cost . . . . . . . . . . . . . . . . . . . . 4,564 9 4,573Interest cost . . . . . . . . . . . . . . . . . . . (44) 89,553 89,509Remeasurements:
Actuarial losses arising from changes in demographic assumptions . . . . – (32,864) (32,864)
Actuarial losses arising from changes in financial assumptions . . . . . . . . (794) (481) (1,275)
Experience adjustments . . . . . . . . . (17) (1,792) (1,809)Benefits paid . . . . . . . . . . . . . . . . . . . (6,703) (87,067) (93,770)Exchange differences . . . . . . . . . . . . – (5,570) (5,570)Other . . . . . . . . . . . . . . . . . . . . . . . . (1,178) (1,942) (3,120)
As of March 31, 2017 . . . . . . . . . . . . . 134,887 2,178,484 2,313,371
Changes in the fair value of plan assets:As of April 1, 2016 . . . . . . . . . . . . . . . . – (1,254,577) (1,254,577)
Interest income . . . . . . . . . . . . . . . . . – (51,573) (51,573)Remeasurements:
Return on plan assets . . . . . . . . . . – (73,037) (73,037)Benefits paid . . . . . . . . . . . . . . . . . . . – 81,915 81,915Employer contributions . . . . . . . . . . . – (54,194) (54,194)Exchange differences . . . . . . . . . . . . – 2,281 2,281
As of March 31, 2017 . . . . . . . . . . . . . – (1,349,185) (1,349,185)
Defined benefit liabilities, netAs of March 31, 2017 . . . . . . . . . . . . . $134,887 $ 829,299 $ 964,186
b. Fair value of plan assets
Fair value of plan assets is as follows:
As of March 31, 2016
(U.S.)
(Millions of yen)
Plan assets withquoted prices
in active markets
Plan assets without quoted prices
in active markets Total
U.S. equities . . . . . . . . . . . . . . . . . . . . . . . ¥24,020 ¥12,287 ¥ 36,307International equities (other than U.S.) . . . . 10,598 10,897 21,495Fixed-income investments . . . . . . . . . . . . – 45,224 45,224Real estate investments . . . . . . . . . . . . . . – 15,737 15,737Other . . . . . . . . . . . . . . . . . . . . . . . . . . . . 8,287 13,701 21,988
Total . . . . . . . . . . . . . . . . . . . . . . . . . . . ¥42,905 ¥97,846 ¥140,751
As of March 31, 2017
(U.S.)
(Millions of yen)
Plan assets withquoted prices
in active markets
Plan assets without quoted prices
in active markets Total
U.S. equities . . . . . . . . . . . . . . . . . . . . . . . ¥25,061 ¥ 26,074 ¥ 51,135International equities (other than U.S.) . . . . 11,843 108 11,951Fixed-income investments . . . . . . . . . . . . – 47,653 47,653Real estate investments . . . . . . . . . . . . . . – 14,862 14,862Other . . . . . . . . . . . . . . . . . . . . . . . . . . . . 11,962 13,802 25,764
Total . . . . . . . . . . . . . . . . . . . . . . . . . . . ¥48,866 ¥102,499 ¥151,365
(Thousands of U.S. dollars)
Plan assets withquoted prices
in active markets
Plan assets without quoted prices
in active markets Total
U.S. equities . . . . . . . . . . . . . . . . . . . . . . . $223,380 $232,409 $ 455,789International equities (other than U.S.) . . . 105,562 963 106,525Fixed-income investments . . . . . . . . . . . . – 424,753 424,753Real estate investments . . . . . . . . . . . . . . – 132,472 132,472Other . . . . . . . . . . . . . . . . . . . . . . . . . . . . 106,623 123,023 229,646
Total . . . . . . . . . . . . . . . . . . . . . . . . . . . $435,565 $913,620 $1,349,185
SoftBank Group Corp. ANNUAL REPORT 2017 138Trajectory of
the Information RevolutionBringing the Future Forward
EssentialInformation
Management Organization
Corporate Information
Financial Section

The targeted investment allocation ratio is set based on an asset allocation policy for the invest-
ment portfolio of the pension plan to achieve a long-term nominal rate of return, net of fees, which
exceeds the plan’s long-term expected rate of return on investments for funding purposes.
The plan’s long-term expected rate of return on investments for funding purposes is 7.75% as of
March 31, 2017 (7.75% as of March 31, 2016). The current targeted investment allocation ratio is
disclosed below. Actual allocations are allowed to deviate from target allocation percentages within a
range for each asset class as defined in the investment policy.
Targeted investment allocation ratio (%)
As of March 31, 2016
As ofMarch 31, 2017
U.S. equities . . . . . . . . . . . . . . . . . . . . . . . . . . . . . . . . . . . . . . 38 38International equities (other than U.S.) . . . . . . . . . . . . . . . . . . 16 16Fixed-income investments . . . . . . . . . . . . . . . . . . . . . . . . . . . 28 28Real estate investments . . . . . . . . . . . . . . . . . . . . . . . . . . . . . 9 9Other . . . . . . . . . . . . . . . . . . . . . . . . . . . . . . . . . . . . . . . . . . . 9 9
c. Actuarial assumptions
The significant actuarial assumptions used to determine the present value of defined benefit obliga-
tions are as follows:
As of March 31, 2016 As of March 31, 2017
Japan U.S. Japan U.S.
Discount rate (%) . . . . . . 0.2 4.3 0.3 4.3
d. Sensitivity analysis
Sensitivity is analyzed at the end of the period based on the movement of reasonably estimable
assumptions. The sensitivity analysis assumes that actuarial assumptions other than those subject to
the analysis are constant, but in reality, the movement of other actuarial assumptions may change.
The effect of the movements in significant actuarial assumptions used to determine the defined
benefit obligations is as follows:
As of March 31, 2016
Effect on defined benefit obligations
Changes in rate Japan U.S. Total
Discount rate . . . 0.5% increase
Decrease of ¥604 million
Decrease of ¥16,902 million
Decrease of ¥17,506 million
0.5% decrease
Increase of ¥648 million
Increase of ¥19,944 million
Increase of ¥20,592 million
As of March 31, 2017
Effect on defined benefit obligations
Changes in rate Japan U.S. Total
Discount rate . . . 0.5% increase
Decrease of ¥538 million
Decrease of ¥16,380 million
Decrease of ¥16,918 million
0.5% decrease
Increase of ¥575 million
Increase of ¥18,511 million
Increase of ¥19,086 million
Effect on defined benefit obligations
Changes in rate Japan U.S. Total
Discount rate . . . 0.5% increase
Decrease of $4,796 thousand
Decrease of $146,002 thousand
Decrease of $150,798 thousand
0.5% decrease
Increase of $5,125 thousand
Increase of $164,997 thousand
Increase of $170,122 thousand
e. Effects on future cash flows
(a) Funding for the plan and expected contributions to the plan for the next fiscal year
(U.S.)
The policy is to contribute the necessary amount to the plan in order to meet the minimum funding
requirement, based on related regulations. The amount to be contributed to the plan for the year
ending March 31, 2018 is expected to be ¥4,936 million ($43,997 thousand).
(b) Maturity analysis of the defined benefit obligation
(Japan)
As of March 31, 2017, the weighted-average duration of the defined benefit obligation is 8.9 years.
(U.S.)
As of March 31, 2017, the weighted-average duration of the defined benefit obligation is 15.2 years.
SoftBank Group Corp. ANNUAL REPORT 2017 139Trajectory of
the Information RevolutionBringing the Future Forward
EssentialInformation
Management Organization
Corporate Information
Financial Section

25. Financial instruments(1) Capital managementOur policy is to realize and maintain optimum capital composition to maintain mid- and long-term sustainable
growth and maximize our corporate value.
Major indicators used for our capital management are as follows:
• Equity capital
• Equity capital ratio
Note: Equity capital is the amount of “Equity attributable to owners of the parent.” Equity capital ratio represents “Equity attributable to owners of the parent” divided by “Total liabilities and equity.”
Equity capital and the equity capital ratio are as follows:
(Millions of yen)(Thousands of
U.S. dollars)
As ofMarch 31, 2016
As ofMarch 31, 2017
As ofMarch 31, 2017
Equity capital . . . . . . . . . . . . . . . . . . . . . . . . . . . ¥2,613,613 ¥3,586,352 $31,966,771Equity capital ratio (%) . . . . . . . . . . . . . . . . . . . . 12.6 14.6
The Company is not subject to regulatory capital requirements imposed by outside institutions other than
general capital requirements under the Companies Act of Japan and other laws. Also, for details regarding
our financial covenants related to interest-bearing debt, please see “(3) Financial covenants” in “Note 19.
Interest-bearing debt”.
(2) Financial risk management As we operate in a wide range of markets, the Company faces a variety of financial risks (foreign exchange
risk, price risk, interest rate risk, credit risk, and liquidity risk) in its operations. The Company manages its risks
based on established policies to prevent and reduce these financial risks.
Derivative transactions entered into by the Company are conducted and controlled based on the Company’s
internal rules and procedures for derivative transactions and are limited to the extent of actual demands.
a. Market risk
(a) Foreign exchange risk
The Company is engaged in international businesses through investments, financial contributions
and the establishment of joint ventures. The Company undertakes transactions denominated in
foreign currencies with foreign parties and, through lending to and borrowings from foreign
subsidiaries. Consequently, there is foreign exchange risk that arises from changes in currency rates
mainly in the U.S. dollar, Indian Rupee, and British pound.
To manage this risk, the Company continuously monitors exchange rates and manages exchange
rate exposures. The Company also uses foreign currency forward contracts to hedge the risk.
i. Foreign exchange sensitivity analysis
Exposure to foreign exchange risk on financial instruments related to U.S. dollars and Indian Rupees,
our major foreign currencies, for subsidiaries whose functional currency is Japanese yen is as follows:
U.S. Dollar (Functional currency: Japanese yen)
(Millions of yen)(Thousands of
U.S. dollars)
As ofMarch 31, 2016
As ofMarch 31, 2017
As ofMarch 31, 2017
Net exposure affecting income before income tax [in asset position] . . . . . . . . . . . . . . . ¥86,102 ¥468,193 $4,173,215
Net exposure affecting other comprehensive income [in asset position] . . . . . . . . . . . . . . . 83,466 194,966 1,737,820
Indian Rupee (Functional currency: Japanese yen)
(Millions of yen)(Thousands of
U.S. dollars)
As ofMarch 31, 2016
As ofMarch 31, 2017
As ofMarch 31, 2017
Net exposure affecting income before income tax [in asset position] . . . . . . . . . . . . . . . ¥214,290 ¥116,169 $1,035,467
Other than the tables presented above, major exposure to foreign exchange risk on subsidiaries
whose functional currency is not Japanese yen is as follows:
U.S. Dollar (Functional currency: British pound)
(Millions of yen)(Thousands of
U.S. dollars)
As ofMarch 31, 2016
As ofMarch 31, 2017
As ofMarch 31, 2017
Net exposure affecting income before income tax [in (liability) asset position] . . . . . . . . ¥(386) ¥87,649 $781,255
SoftBank Group Corp. ANNUAL REPORT 2017 140Trajectory of
the Information RevolutionBringing the Future Forward
EssentialInformation
Management Organization
Corporate Information
Financial Section

ii. Foreign currency exchange contracts
Foreign currency exchange contracts are entered into, to reduce exposure to foreign exchange risk on the amount to be paid or received in certain transactions denominated in foreign currencies.
The details of foreign currency exchange contracts are as follows:
Foreign currency exchange contracts to which hedge accounting is applied
(Millions of yen) (Thousands of U.S. dollars)
As of March 31, 2016 As of March 31, 2017 As of March 31, 2017
Contract amounts(of which: maturing in
more than one year) Fair value
Contract amounts(of which: maturing in
more than one year) Fair value
Contract amounts(of which: maturing in
more than one year) Fair value
Foreign currency forward contracts . . . . . . . . . . . . . ¥ 571(–)
¥ (38)¥ 166
(–)¥ (3)
$ 1,479(–)
$ (27)
Currency swap contracts . . . . . . . . . . . . . . . . . . . . . 877,373(877,373)
(40,306)877,373
(877,373)(72,658)
7,820,421(7,820,421)
(647,633)
Total . . . . . . . . . . . . . . . . . . . . . . . . . . . . . . . . . . . ¥ 877,944(877,373)
¥(40,344)¥ 877,539(877,373)
¥(72,661)$ 7,821,900(7,820,421)
$(647,660)
The above foreign currency exchange contracts are designated as cash flow hedges.
Net exposure affecting income before income tax comprises the foreign exchange risk
exposures from monetary financial instruments denominated in a foreign currency (including those
used in internal transactions) whose exchange differences are recognized in profit or loss and the
foreign exchange risk exposures from derivatives related to forecast transactions.
Net exposure affecting other comprehensive income comprises the foreign exchange risk
exposures from available-for-sale financial assets whose exchange differences are recognized in
other comprehensive income and foreign exchange risk exposures from derivatives (cash flow
hedge) related to forecasted transactions.
The table below presents the effect of a 1% appreciation of the Japanese yen on income before
income tax and other comprehensive income (before tax effect) regarding the financial instruments
with the above foreign exchange risk exposure, assuming that all other factors are constant. The
analysis does not include the effect of translating assets and liabilities of foreign operations into the
presentation currency, which is detailed in “Note 29. Foreign currency exchange rates.”
U.S. Dollar
(Millions of yen)(Thousands of
U.S. dollars)
Fiscal year endedMarch 31, 2016
Fiscal year endedMarch 31, 2017
Fiscal year endedMarch 31, 2017
Decrease in income before income tax . . . . . . . . . . . . . . . . . . . ¥(861) ¥(4,682) $(41,733)
Decrease in other comprehensive income before tax effect . . . . . . . . . (835) (1,950) (17,381)
Indian Rupee
(Millions of yen)(Thousands of
U.S. dollars)
Fiscal year endedMarch 31, 2016
Fiscal year endedMarch 31, 2017
Fiscal year endedMarch 31, 2017
Decrease in income before income tax . . . . . . . . . . . . . . . . . . . . ¥(2,143) ¥(1,162) $(10,357)
The table below presents the effect of a 1% appreciation of the British pound against the U.S.
dollar on income before income tax:
U.S. Dollar
(Millions of yen)(Thousands of
U.S. dollars)
Fiscal year endedMarch 31, 2016
Fiscal year endedMarch 31, 2017
Fiscal year endedMarch 31, 2017
Increase (decrease) in income before income tax . . . . . . . . . . . . . . . . . . . . ¥4 ¥(876) $(7,808)
SoftBank Group Corp. ANNUAL REPORT 2017 141Trajectory of
the Information RevolutionBringing the Future Forward
EssentialInformation
Management Organization
Corporate Information
Financial Section

Foreign currency exchange contracts to which hedge accounting is not applied
(Millions of yen) (Thousands of U.S. dollars)
As of March 31, 2016 As of March 31, 2017 As of March 31, 2017
Contract amounts(of which: maturing in
more than one year) Fair value
Contract amounts(of which: maturing in
more than one year) Fair value
Contract amounts(of which: maturing in
more than one year) Fair value
Foreign currency forward contracts . . . . . . . . . . . . . ¥273,476(–)
¥ 9,445¥ 818,424
(–)¥ 2,213
$ 7,294,982(–)
$ 19,725
Currency swap contracts . . . . . . . . . . . . . . . . . . . . . 15,430(–)
15911,653
(–)(19)
103,868(–)
(169)
Foreign exchange margin transactions* . . . . . . . . . . 581,379(–)
17,113548,786
(–)13,398
4,891,577(–)
119,423
Total . . . . . . . . . . . . . . . . . . . . . . . . . . . . . . . . . . . ¥870,285(–)
¥26,717¥1,378,863
(–)¥15,592
$12,290,427(–)
$138,979
Note:* Foreign exchange margin transactions are operated by the subsidiary, YJFX, Inc.’s foreign exchange margin transactions business.
(b) Price risk
For the purpose of business strategy, the Company holds securities traded in active markets,
including listed stock, and is exposed to market price fluctuation risk.
To manage this risk, the Company continuously monitors the financial condition of security
issuers and stock market fluctuations.
i. Price sensitivity analysis
The table below presents the effect of a 10% decrease in market price regarding the securities
traded in active markets on income before income tax and other comprehensive income before tax
effect, assuming that all other factors are constant.
(Millions of yen)(Thousands of
U.S. dollars)
Fiscal year endedMarch 31, 2016
Fiscal year endedMarch 31, 2017
Fiscal year endedMarch 31, 2017
Decrease in income before income tax . . . . . . . . . . . . . . . . . . ¥ – ¥(32,843) $(292,744)
Decrease in other comprehensive income before tax effect . . . . . . . (7,381) (7,884) (70,274)
Also, the Company entered into a variable prepaid forward contract which is settled by Alibaba
shares held by the Company. The contract includes a collar transaction that a cap and floor are set
for the number of shares settled. The collar transaction is classified as a derivative instrument and
its fair value is affected by the price of Alibaba shares. Derivative gain and loss, which occurred
depending on fluctuation of the price of Alibaba shares, are recognized through profit or loss.
Fair value of the collar transaction is composed of intrinsic value and time value. The effect of a
10% increase in the price of Alibaba shares on income before income tax due to fluctuation of
intrinsic value is a loss of $800,000 thousand, assuming that all other factors are constant. In case
of consideration of time value, the impact of the loss is decreased.
Further, derivative gain and loss resulting from this collar transaction is fixed to a loss of
$900,000 thousand during three-year period from initial recognition date of the derivative
instruments, in June 2016, to settlement date of Alibaba shares.
The details of the variable prepaid forward contract and the collar transaction are described in
“(2) Transaction for sale of Alibaba shares by variable prepaid forward contract” in “Note 19.
Interest-bearing debt”.
SoftBank Group Corp. ANNUAL REPORT 2017 142Trajectory of
the Information RevolutionBringing the Future Forward
EssentialInformation
Management Organization
Corporate Information
Financial Section
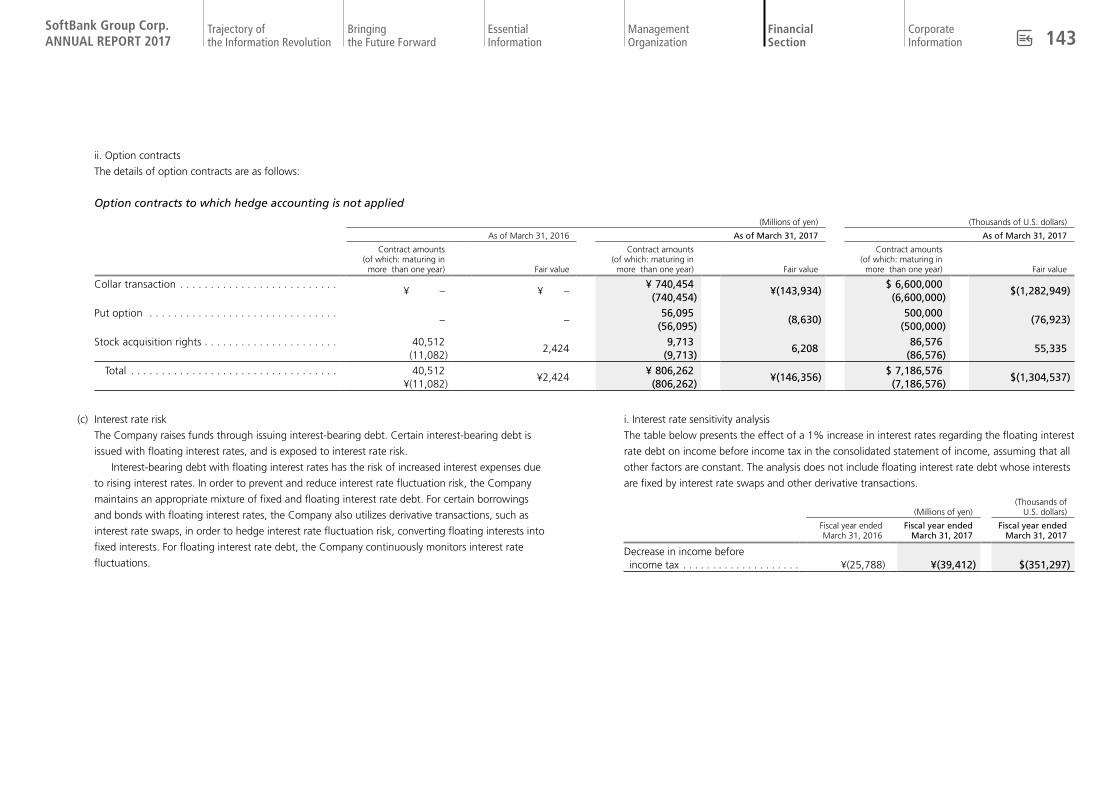
ii. Option contracts
The details of option contracts are as follows:
Option contracts to which hedge accounting is not applied
(Millions of yen) (Thousands of U.S. dollars)
As of March 31, 2016 As of March 31, 2017 As of March 31, 2017
Contract amounts(of which: maturing in
more than one year) Fair value
Contract amounts(of which: maturing in
more than one year) Fair value
Contract amounts(of which: maturing in
more than one year) Fair value
Collar transaction . . . . . . . . . . . . . . . . . . . . . . . . . .¥ – ¥ –
¥ 740,454(740,454)
¥(143,934)$ 6,600,000(6,600,000)
$(1,282,949)
Put option . . . . . . . . . . . . . . . . . . . . . . . . . . . . . . .– –
56,095(56,095)
(8,630)500,000
(500,000)(76,923)
Stock acquisition rights . . . . . . . . . . . . . . . . . . . . . . 40,512(11,082)
2,4249,713
(9,713)6,208
86,576(86,576)
55,335
Total . . . . . . . . . . . . . . . . . . . . . . . . . . . . . . . . . . 40,512¥(11,082)
¥2,424¥ 806,262(806,262)
¥(146,356)$ 7,186,576(7,186,576)
$(1,304,537)
(c) Interest rate risk
The Company raises funds through issuing interest-bearing debt. Certain interest-bearing debt is
issued with floating interest rates, and is exposed to interest rate risk.
Interest-bearing debt with floating interest rates has the risk of increased interest expenses due
to rising interest rates. In order to prevent and reduce interest rate fluctuation risk, the Company
maintains an appropriate mixture of fixed and floating interest rate debt. For certain borrowings
and bonds with floating interest rates, the Company also utilizes derivative transactions, such as
interest rate swaps, in order to hedge interest rate fluctuation risk, converting floating interests into
fixed interests. For floating interest rate debt, the Company continuously monitors interest rate
fluctuations.
i. Interest rate sensitivity analysis
The table below presents the effect of a 1% increase in interest rates regarding the floating interest
rate debt on income before income tax in the consolidated statement of income, assuming that all
other factors are constant. The analysis does not include floating interest rate debt whose interests
are fixed by interest rate swaps and other derivative transactions.
(Millions of yen)(Thousands of
U.S. dollars)
Fiscal year endedMarch 31, 2016
Fiscal year endedMarch 31, 2017
Fiscal year endedMarch 31, 2017
Decrease in income before income tax . . . . . . . . . . . . . . . . . . . . ¥(25,788) ¥(39,412) $(351,297)
SoftBank Group Corp. ANNUAL REPORT 2017 143Trajectory of
the Information RevolutionBringing the Future Forward
EssentialInformation
Management Organization
Corporate Information
Financial Section

ii. Interest rate contracts
The details of interest rate contracts are as follows:
Interest rate contracts to which hedge accounting is applied
(Millions of yen) (Thousands of U.S. dollars)
As of March 31, 2016 As of March 31, 2017 As of March 31, 2017
Contract amounts(of which: maturing in
more than one year) Fair value
Contract amounts(of which: maturing in
more than one year) Fair value
Contract amounts(of which: maturing in
more than one year) Fair value
Interest rate swap . . . . . . . . . . . . . . . . . . . . . . . . . . ¥ 10,500(10,500)
¥(75)¥ 234,880(224,880)
¥(250)$ 2,093,591(2,004,457)
$(2,228)
The above interest rate swap contract is designated as a cash flow hedge.
Interest rate contracts to which hedge accounting is not applied
(Millions of yen) (Thousands of U.S. dollars)
As of March 31, 2016 As of March 31, 2017 As of March 31, 2017
Contract amounts(of which: maturing in
more than one year) Fair value
Contract amounts(of which: maturing in
more than one year) Fair value
Contract amounts(of which: maturing in
more than one year) Fair value
Interest rate cap . . . . . . . . . . . . . . . . . . . . . . . . . . . . – –
¥ 132,945(132,945)
¥1,039$ 1,184,999(1,184,999)
$9,261
b. Credit risk
In the course of the Company’s business, trade and other receivables, and other financial assets (including deposits, equity securities and derivatives) are exposed to the credit risk of its counterparties.
In order to prevent and reduce the risk, the Company does not expose itself to significant concentrations of credit risk for such receivables and financial assets. To manage its credit risk, the Company performs due
date controls and balance controls for each customer in accordance with its internal customer credit management rules and regularly monitors major customers’ credit status.
The carrying amount of financial instruments, net of impairment, which is presented in the consolidated statement of financial position, as well as the amount of lending commitments and guaranteed obligations,
represents the Company’s maximum exposure to credit risk on financial assets. The value of collateral held and other credit enhancements are not included. The details of lending commitments and guaranteed obligations
are described in “(1) Lending commitments” and “(2) Credit guarantees” in “Note 46. Contingency.”
There were no financial or non-financial assets acquired as a result of foreclosure of collateral or enforcement of other credit enhancements during the years ended March 31, 2016 and 2017.
SoftBank Group Corp. ANNUAL REPORT 2017 144Trajectory of
the Information RevolutionBringing the Future Forward
EssentialInformation
Management Organization
Corporate Information
Financial Section
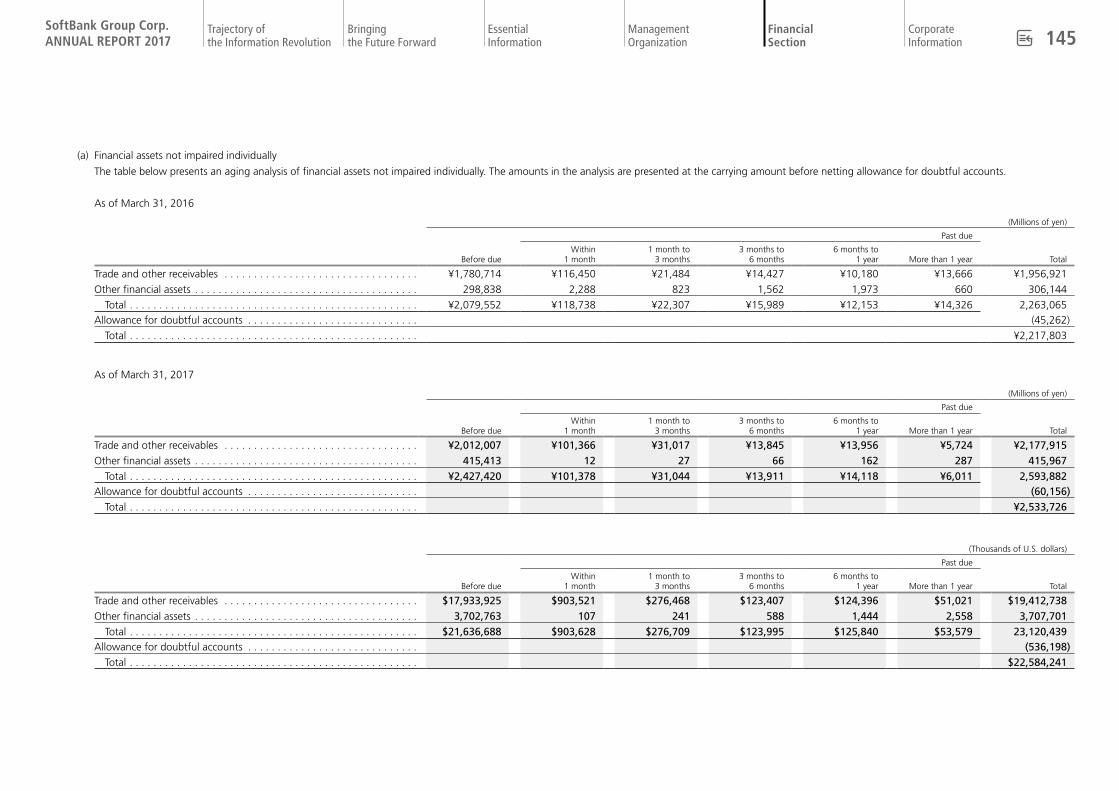
(a) Financial assets not impaired individually
The table below presents an aging analysis of financial assets not impaired individually. The amounts in the analysis are presented at the carrying amount before netting allowance for doubtful accounts.
As of March 31, 2016
(Millions of yen)
Past due
Before dueWithin
1 month1 month to
3 months3 months to
6 months6 months to
1 year More than 1 year Total
Trade and other receivables . . . . . . . . . . . . . . . . . . . . . . . . . . . . . . . . . ¥1,780,714 ¥116,450 ¥21,484 ¥14,427 ¥10,180 ¥13,666 ¥1,956,921
Other financial assets . . . . . . . . . . . . . . . . . . . . . . . . . . . . . . . . . . . . . . 298,838 2,288 823 1,562 1,973 660 306,144
Total . . . . . . . . . . . . . . . . . . . . . . . . . . . . . . . . . . . . . . . . . . . . . . . . . ¥2,079,552 ¥118,738 ¥22,307 ¥15,989 ¥12,153 ¥14,326 2,263,065Allowance for doubtful accounts . . . . . . . . . . . . . . . . . . . . . . . . . . . . . (45,262)
Total . . . . . . . . . . . . . . . . . . . . . . . . . . . . . . . . . . . . . . . . . . . . . . . . . ¥2,217,803
As of March 31, 2017
(Millions of yen)
Past due
Before dueWithin
1 month1 month to
3 months3 months to
6 months6 months to
1 year More than 1 year Total
Trade and other receivables . . . . . . . . . . . . . . . . . . . . . . . . . . . . . . . . . ¥2,012,007 ¥101,366 ¥31,017 ¥13,845 ¥13,956 ¥5,724 ¥2,177,915Other financial assets . . . . . . . . . . . . . . . . . . . . . . . . . . . . . . . . . . . . . . 415,413 12 27 66 162 287 415,967
Total . . . . . . . . . . . . . . . . . . . . . . . . . . . . . . . . . . . . . . . . . . . . . . . . . ¥2,427,420 ¥101,378 ¥31,044 ¥13,911 ¥14,118 ¥6,011 2,593,882Allowance for doubtful accounts . . . . . . . . . . . . . . . . . . . . . . . . . . . . . (60,156)
Total . . . . . . . . . . . . . . . . . . . . . . . . . . . . . . . . . . . . . . . . . . . . . . . . . ¥2,533,726
(Thousands of U.S. dollars)
Past due
Before dueWithin
1 month1 month to
3 months3 months to
6 months6 months to
1 year More than 1 year Total
Trade and other receivables . . . . . . . . . . . . . . . . . . . . . . . . . . . . . . . . . $17,933,925 $903,521 $276,468 $123,407 $124,396 $51,021 $19,412,738Other financial assets . . . . . . . . . . . . . . . . . . . . . . . . . . . . . . . . . . . . . . 3,702,763 107 241 588 1,444 2,558 3,707,701
Total . . . . . . . . . . . . . . . . . . . . . . . . . . . . . . . . . . . . . . . . . . . . . . . . . $21,636,688 $903,628 $276,709 $123,995 $125,840 $53,579 23,120,439Allowance for doubtful accounts . . . . . . . . . . . . . . . . . . . . . . . . . . . . . (536,198)
Total . . . . . . . . . . . . . . . . . . . . . . . . . . . . . . . . . . . . . . . . . . . . . . . . . $22,584,241
SoftBank Group Corp. ANNUAL REPORT 2017 145Trajectory of
the Information RevolutionBringing the Future Forward
EssentialInformation
Management Organization
Corporate Information
Financial Section

(b) Individually impaired financial assets
Individually impaired financial assets are as follows:
(Millions of yen)(Thousands of
U.S. dollars)
As ofMarch 31, 2016
As ofMarch 31, 2017
As ofMarch 31, 2017
Trade and other receivables . . . . . . . . ¥ 3,174 ¥ 7,137 $ 63,615Other financial assets . . . . . . . . . . . . . 32,588 28,909 257,679Allowance for doubtful accounts . . . . (34,882) (35,195) (313,709)
Total . . . . . . . . . . . . . . . . . . . . . . . . ¥ 880 ¥ 851 $ 7,585
(c) Allowance for doubtful accounts
The table below presents changes in the allowance for doubtful accounts. The allowance for
doubtful accounts is mainly for trade receivables to the customers and loans.
(Millions of yen)(Thousands of
U.S. dollars)
Fiscal year endedMarch 31, 2016
Fiscal year endedMarch 31, 2017
Fiscal year endedMarch 31, 2017
Balance at the beginning of the period . . . . . . . . . . . . . . . . . . . . ¥ 82,185 ¥ 80,144 $ 714,360Provisions . . . . . . . . . . . . . . . . . . . . 86,056 65,612 584,829Utilized . . . . . . . . . . . . . . . . . . . . . . (85,771) (50,078) (446,368)Other . . . . . . . . . . . . . . . . . . . . . . . (2,326) (327) (2,914)
Balance at the end of the period . . . . ¥ 80,144 ¥ 95,351 $ 849,907
Provisions for and reversal of doubtful accounts are recorded in “Selling, general and administra-
tive expenses” and “Other non-operating income (loss)” in the consolidated statement of income.
c. Liquidity risk
In order to prevent and reduce liquidity risk, the Company maintains access to diversified fundraising
sources including both indirect financing, such as bank loans and leases, and direct financing, such as
issuance of bonds and commercial paper and securitization, taking market conditions and its current/
non-current debt ratios into consideration. As for fund management, the Company invests its funds in
short-term deposits and a money management fund.
The Company also continuously monitors its forecasted and actual cash flows and liquid funds.
(a) Commitment lines of credit and other credit facilities
The Company has entered into commitment lines of credit and other credit facilities with various
financial institutions to reduce liquidity risk. The Company’s credit facilities are as follows:
(Millions of yen)(Thousands of
U.S. dollars)
As ofMarch 31, 2016
As ofMarch 31, 2017
As ofMarch 31, 2017
Credit facilities . . . . . . . . . . . . . . . . . . ¥3,035,457 ¥4,085,912 $36,419,574Drawn . . . . . . . . . . . . . . . . . . . . . . . . 2,255,182 3,406,044 30,359,604Undrawn . . . . . . . . . . . . . . . . . . . . . . ¥ 780,275 ¥ 679,868 $ 6,059,970
Note:
Certain commitments above contain financial covenants. Please see “(3) Financial covenants” in “Note 19. Interest-bearing debt” for details.
SoftBank Group Corp. ANNUAL REPORT 2017 146Trajectory of
the Information RevolutionBringing the Future Forward
EssentialInformation
Management Organization
Corporate Information
Financial Section
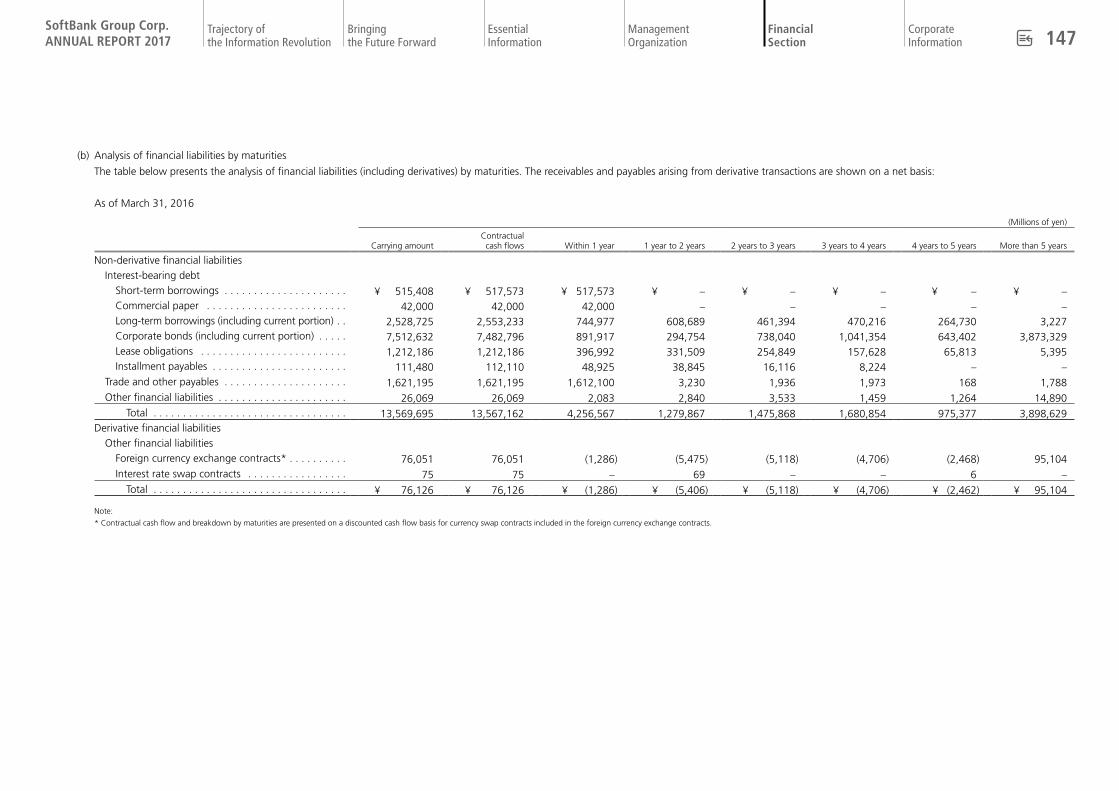
(b) Analysis of financial liabilities by maturities
The table below presents the analysis of financial liabilities (including derivatives) by maturities. The receivables and payables arising from derivative transactions are shown on a net basis:
As of March 31, 2016
(Millions of yen)
Carrying amountContractual cash flows Within 1 year 1 year to 2 years 2 years to 3 years 3 years to 4 years 4 years to 5 years More than 5 years
Non-derivative financial liabilitiesInterest-bearing debt
Short-term borrowings . . . . . . . . . . . . . . . . . . . . . ¥ 515,408 ¥ 517,573 ¥ 517,573 ¥ – ¥ – ¥ – ¥ – ¥ –Commercial paper . . . . . . . . . . . . . . . . . . . . . . . . 42,000 42,000 42,000 – – – – –Long-term borrowings (including current portion) . . 2,528,725 2,553,233 744,977 608,689 461,394 470,216 264,730 3,227Corporate bonds (including current portion) . . . . . 7,512,632 7,482,796 891,917 294,754 738,040 1,041,354 643,402 3,873,329Lease obligations . . . . . . . . . . . . . . . . . . . . . . . . . 1,212,186 1,212,186 396,992 331,509 254,849 157,628 65,813 5,395Installment payables . . . . . . . . . . . . . . . . . . . . . . . 111,480 112,110 48,925 38,845 16,116 8,224 – –
Trade and other payables . . . . . . . . . . . . . . . . . . . . . 1,621,195 1,621,195 1,612,100 3,230 1,936 1,973 168 1,788Other financial liabilities . . . . . . . . . . . . . . . . . . . . . . 26,069 26,069 2,083 2,840 3,533 1,459 1,264 14,890
Total . . . . . . . . . . . . . . . . . . . . . . . . . . . . . . . . . 13,569,695 13,567,162 4,256,567 1,279,867 1,475,868 1,680,854 975,377 3,898,629Derivative financial liabilities
Other financial liabilities Foreign currency exchange contracts* . . . . . . . . . . 76,051 76,051 (1,286) (5,475) (5,118) (4,706) (2,468) 95,104Interest rate swap contracts . . . . . . . . . . . . . . . . . 75 75 – 69 – – 6 –
Total . . . . . . . . . . . . . . . . . . . . . . . . . . . . . . . . . ¥ 76,126 ¥ 76,126 ¥ (1,286) ¥ (5,406) ¥ (5,118) ¥ (4,706) ¥ (2,462) ¥ 95,104
Note:
* Contractual cash flow and breakdown by maturities are presented on a discounted cash flow basis for currency swap contracts included in the foreign currency exchange contracts.
SoftBank Group Corp. ANNUAL REPORT 2017 147Trajectory of
the Information RevolutionBringing the Future Forward
EssentialInformation
Management Organization
Corporate Information
Financial Section

As of March 31, 2017(Millions of yen)
Carrying amountContractual cash flows Within 1 year 1 year to 2 years 2 years to 3 years 3 years to 4 years 4 years to 5 years More than 5 years
Non-derivative financial liabilitiesInterest-bearing debt
Short-term borrowings . . . . . . . . . . . . . . . . . . . . . . ¥ 667,664 ¥ 668,506 ¥ 668,506 ¥ – ¥ – ¥ – ¥ – ¥ –Commercial paper . . . . . . . . . . . . . . . . . . . . . . . . . . 80,000 80,000 80,000 – – – – –Long-term borrowings (including current portion) . . 4,506,135 4,558,688 1,132,653 1,955,143 584,852 373,082 79,281 433,677Corporate bonds (including current portion) . . . . . 7,573,300 7,575,400 336,591 736,620 1,044,869 671,946 1,229,618 3,555,756Lease obligations . . . . . . . . . . . . . . . . . . . . . . . . . . . 1,245,890 1,245,890 438,284 351,248 243,853 153,596 56,388 2,521Financial liability for variable prepaid forward contract . . . . . . . . . . . . . . . . . . . . . . . . . . . . . . . . . 715,448 740,454 – – 740,454 – – –
Installment payables . . . . . . . . . . . . . . . . . . . . . . . . 69,933 71,004 40,376 17,804 9,879 1,683 1,262 –Trade and other payables . . . . . . . . . . . . . . . . . . . . . . 1,607,453 1,607,453 1,585,746 11,021 8,558 1,804 91 233Other financial liabilities . . . . . . . . . . . . . . . . . . . . . . . 40,419 40,419 7,336 15,309 4,725 413 158 12,478
Total . . . . . . . . . . . . . . . . . . . . . . . . . . . . . . . . . . . 16,506,242 16,587,814 4,289,492 3,087,145 2,637,190 1,202,524 1,366,798 4,004,665Derivative financial liabilities
Other financial liabilities Foreign currency exchange contracts* . . . . . . . . . . 107,697 107,697 1,898 (4,108) (3,689) 3,064 (2,627) 113,159Option contracts . . . . . . . . . . . . . . . . . . . . . . . . . . . 152,564 152,564 – 8,629 143,935 – – –Interest rate contracts . . . . . . . . . . . . . . . . . . . . . . . 250 250 22 – – 5 223 –
Total . . . . . . . . . . . . . . . . . . . . . . . . . . . . . . . . . . . ¥ 260,511 ¥ 260,511 ¥ 1,920 ¥ 4,521 ¥ 140,246 ¥ 3,069 ¥ (2,404) ¥ 113,159
(Thousands of U.S. dollars)
Carrying amountContractual cash flows Within 1 year 1 year to 2 years 2 years to 3 years 3 years to 4 years 4 years to 5 years More than 5 years
Non-derivative financial liabilitiesInterest-bearing debt
Short-term borrowings . . . . . . . . . . . . . . . . . . . . . . $ 5,951,190 $ 5,958,695 $ 5,958,695 $ – $ – $ – $ – $ –Commercial paper . . . . . . . . . . . . . . . . . . . . . . . . . . 713,076 713,076 713,076 – – – – –Long-term borrowings (including current portion) . . 40,165,211 40,633,639 10,095,847 17,427,070 5,213,049 3,325,448 706,667 3,865,558Corporate bonds (including current portion) . . . . . 67,504,234 67,522,952 3,000,187 6,565,826 9,313,388 5,989,357 10,960,139 31,694,055Lease obligations . . . . . . . . . . . . . . . . . . . . . . . . . . . 11,105,179 11,105,179 3,906,622 3,130,832 2,173,572 1,369,070 502,612 22,471Financial liability for variable prepaid forward contract . . . . . . . . . . . . . . . . . . . . . . . . . . . . . . . . . 6,377,110 6,600,000 – – 6,600,000 – – –
Installment payables . . . . . . . . . . . . . . . . . . . . . . . . 623,344 632,891 359,890 158,695 88,056 15,001 11,249 –Trade and other payables . . . . . . . . . . . . . . . . . . . . . . 14,327,953 14,327,953 14,134,468 98,235 76,281 16,080 811 2,078Other financial liabilities . . . . . . . . . . . . . . . . . . . . . . . 360,272 360,272 65,389 136,456 42,116 3,682 1,408 111,221
Total . . . . . . . . . . . . . . . . . . . . . . . . . . . . . . . . . . . 147,127,569 147,854,657 38,234,174 27,517,114 23,506,462 10,718,638 12,182,886 35,695,383Derivative financial liabilities
Other financial liabilities Foreign currency exchange contracts* . . . . . . . . . . 959,952 959,952 16,918 (36,616) (32,882) 27,311 (23,416) 1,008,637Option contracts . . . . . . . . . . . . . . . . . . . . . . . . . . . 1,359,872 1,359,872 – 76,914 1,282,958 – – –Interest rate contracts . . . . . . . . . . . . . . . . . . . . . . . 2,228 2,228 196 – – 44 1,988 –
Total . . . . . . . . . . . . . . . . . . . . . . . . . . . . . . . . . . . $ 2,322,052 $ 2,322,052 $ 17,114 $ 40,298 $ 1,250,076 $ 27,355 $ (21,428) $ 1,008,637
Note:* Contractual cash flows and the breakdown by maturities are presented on a discounted cash flow basis for currency swap contracts included in the foreign currency exchange contracts.
In addition to the amounts presented above, the Company has lending commitments and guaranteed obligations, which are detailed in “(1) Lending commitments” and “(2) Credit guarantees” in “Note 46. Contingency.”
Average interest rates of the interest-bearing debts are described in “(1) Component of interest-bearing debt” in “Note 19. Interest-bearing debt.”
SoftBank Group Corp. ANNUAL REPORT 2017 148Trajectory of
the Information RevolutionBringing the Future Forward
EssentialInformation
Management Organization
Corporate Information
Financial Section

(3) Categories of financial instrumentsComponents of financial instruments (excluding cash and cash equivalents) by category are as follows:
As of March 31, 2016
(Millions of yen)
Financial assetsat FVTPL*
Derivatives designatedas hedges
Available-for-sale financial assets
Held-to-maturity investments Loans and receivables Total
Financial assetsCurrent assets
Trade and other receivables . . . . . . . . . . . . . . . . . . . . . . . . . . . . . . . . . . . . . . . ¥ – ¥ – ¥ – ¥ – ¥1,914,789 ¥1,914,789Other financial assets . . . . . . . . . . . . . . . . . . . . . . . . . . . . . . . . . . . . . . . . . . . 37,136 – 23,487 100 92,135 152,858
Non-current assetsOther financial assets . . . . . . . . . . . . . . . . . . . . . . . . . . . . . . . . . . . . . . . . . . . 308,493 31,297 344,299 – 286,785 970,874
Total . . . . . . . . . . . . . . . . . . . . . . . . . . . . . . . . . . . . . . . . . . . . . . . . . . . . . . ¥345,629 ¥31,297 ¥367,786 ¥100 ¥2,293,709 ¥3,038,521
Financial liabilities at FVTPL
Derivatives designatedas hedges
Financial liabilitiesat amortized cost Total
Financial liabilitiesCurrent liabilities
Interest-bearing debt . . . . . . . . . . . . . . . . . . . . . . . . . . . . . . . . . . . . . . . . . . . ¥ – ¥ – ¥ 2,646,609 ¥ 2,646,609Trade and other payables . . . . . . . . . . . . . . . . . . . . . . . . . . . . . . . . . . . . . . . . – – 1,621,195 1,621,195Other financial liabilities . . . . . . . . . . . . . . . . . . . . . . . . . . . . . . . . . . . . . . . . . 4,410 39 2,082 6,531
Non-current liabilitiesInterest-bearing debt . . . . . . . . . . . . . . . . . . . . . . . . . . . . . . . . . . . . . . . . . . . – – 9,275,822 9,275,822
Other financial liabilities . . . . . . . . . . . . . . . . . . . . . . . . . . . . . . . . . . . . . . . . . – 71,677 23,987 95,664
Total . . . . . . . . . . . . . . . . . . . . . . . . . . . . . . . . . . . . . . . . . . . . . . . . . . . . . . ¥ 4,410 ¥71,716 ¥13,569,695 ¥13,645,821
Note:* Among the financial assets at FVTPL, the amount of financial assets designated as financial assets at fair value through profit or loss is ¥306,070 million.
SoftBank Group Corp. ANNUAL REPORT 2017 149Trajectory of
the Information RevolutionBringing the Future Forward
EssentialInformation
Management Organization
Corporate Information
Financial Section

As of March 31, 2017
(Millions of yen)
Financial assetsat FVTPL1
Derivatives designatedas hedges
Available-for-sale financial assets
Held-to-maturity investments Loans and receivables Total
Financial assetsCurrent assets
Trade and other receivables . . . . . . . . . . . . . . . . . . . . . . . . . . . . . . . . . . . . . . . ¥ – ¥ – ¥ – ¥ – ¥2,121,619 ¥2,121,619Other financial assets . . . . . . . . . . . . . . . . . . . . . . . . . . . . . . . . . . . . . . . . . . . 23,373 – 574 276,120 494,622 794,689
Non-current assetsOther financial assets . . . . . . . . . . . . . . . . . . . . . . . . . . . . . . . . . . . . . . . . . . . 596,257 28,695 517,334 – 409,981 1,552,267
Total . . . . . . . . . . . . . . . . . . . . . . . . . . . . . . . . . . . . . . . . . . . . . . . . . . . . . . ¥619,630 ¥28,695 ¥517,908 ¥276,120 ¥3,026,222 ¥4,468,575
Financial liabilities at FVTPL
Derivatives designatedas hedges
Financial liabilitiesat amortized cost Total
Financial liabilitiesCurrent liabilities
Interest-bearing debt . . . . . . . . . . . . . . . . . . . . . . . . . . . . . . . . . . . . . . . . . . . ¥ 43,1642 ¥ – ¥ 2,650,929 ¥ 2,694,093Trade and other payables . . . . . . . . . . . . . . . . . . . . . . . . . . . . . . . . . . . . . . . . – – 1,607,453 1,607,453Other financial liabilities . . . . . . . . . . . . . . . . . . . . . . . . . . . . . . . . . . . . . . . . . 6,341 24 7,336 13,701
Non-current liabilities Interest-bearing debt . . . . . . . . . . . . . . . . . . . . . . . . . . . . . . . . . . . . . . . . . . . – – 12,164,277 12,164,277Other financial liabilities . . . . . . . . . . . . . . . . . . . . . . . . . . . . . . . . . . . . . . . . . 152,564 101,582 33,083 287,229
Total . . . . . . . . . . . . . . . . . . . . . . . . . . . . . . . . . . . . . . . . . . . . . . . . . . . . . . ¥202,069 ¥101,606 ¥16,463,078 ¥16,766,753
SoftBank Group Corp. ANNUAL REPORT 2017 150Trajectory of
the Information RevolutionBringing the Future Forward
EssentialInformation
Management Organization
Corporate Information
Financial Section

(Thousands of U.S. dollars)
Financial assetsat FVTPL1
Derivatives designatedas hedges
Available-for-sale financial assets
Held-to-maturity investments Loans and receivables Total
Financial assetsCurrent assets
Trade and other receivables . . . . . . . . . . . . . . . . . . . . . . . . . . . . . . . . . . . . . . . $ – $ – $ – $ – $18,910,946 $18,910,946Other financial assets . . . . . . . . . . . . . . . . . . . . . . . . . . . . . . . . . . . . . . . . . . . 208,334 – 5,116 2,461,182 4,408,789 7,083,421
Non-current assetsOther financial assets . . . . . . . . . . . . . . . . . . . . . . . . . . . . . . . . . . . . . . . . . . . 5,314,707 255,771 4,611,231 – 3,654,346 13,836,055
Total . . . . . . . . . . . . . . . . . . . . . . . . . . . . . . . . . . . . . . . . . . . . . . . . . . . . . . $5,523,041 $255,771 $4,616,347 $2,461,182 $26,974,081 $39,830,422
Financial liabilities at FVTPL
Derivatives designatedas hedges
Financial liabilitiesat amortized cost Total
Financial liabilitiesCurrent liabilities
Interest-bearing debt . . . . . . . . . . . . . . . . . . . . . . . . . . . . . . . . . . . . . . . . . . . $ 384,7402 $ – $ 23,628,924 $ 24,013,664Trade and other payables . . . . . . . . . . . . . . . . . . . . . . . . . . . . . . . . . . . . . . . . – – 14,327,953 14,327,953Other financial liabilities . . . . . . . . . . . . . . . . . . . . . . . . . . . . . . . . . . . . . . . . . 56,520 214 65,389 122,123
Non-current liabilitiesInterest-bearing debt . . . . . . . . . . . . . . . . . . . . . . . . . . . . . . . . . . . . . . . . . . . – – 108,425,680 108,425,680Other financial liabilities . . . . . . . . . . . . . . . . . . . . . . . . . . . . . . . . . . . . . . . . . 1,359,872 905,446 294,883 2,560,201
Total . . . . . . . . . . . . . . . . . . . . . . . . . . . . . . . . . . . . . . . . . . . . . . . . . . . . . . $1,801,132 $905,660 $146,742,829 $149,449,621
Notes:1. Among the financial assets at FVTPL, the amount of financial assets designated as financial assets at fair value through profit or loss is ¥589,250 million ($5,252,251 thousand).2. Regarding Handset Sale-Leaseback Tranche 2 financing obligation that Sprint implemented in May 2016, the Company designated it as a financial liability that is measured at fair value though profit or loss. This is a transaction with MLS which is a joint venture of the Company. The terms and
conditions of the transaction are negotiated and determined based on the market price and the content of transaction.
26. Fair value of financial instruments(1) Categorization by level within the fair value hierarchyFinancial instruments that are measured at fair value on a recurring basis after initial recognition are classified
into three levels of the fair value hierarchy based on the observability and significance of inputs used for the
measurement.
The fair value hierarchy is defined as follows in descending order of level:
Level 1: Fair value is measured using quoted prices (unadjusted) in active markets for identical assets or
liabilities.
Level 2: Fair value is measured using inputs other than Level 1 that are observable, either directly or
indirectly.
Level 3: Fair value is measured using unobservable inputs.
If the fair value measurement uses different levels of inputs, the fair value is categorized based on the
lowest level of input that is significant to the entire fair value measurement.
Transfers between levels of the fair value hierarchy are recognized as if they have occurred at the
beginning of each quarter.
There were no transfers between Level 1 and Level 2 during the fiscal years ended March 31, 2016
and 2017.
SoftBank Group Corp. ANNUAL REPORT 2017 151Trajectory of
the Information RevolutionBringing the Future Forward
EssentialInformation
Management Organization
Corporate Information
Financial Section

The table below presents financial instruments measured at fair value on a recurring basis by level within
the fair value hierarchy.
As of March 31, 2016
(Millions of yen)
Level 1 Level 2 Level 3 Total
Financial assetsEquity securities . . . . . . . . . . . . . . . . . . ¥73,807 ¥ – ¥549,480 ¥623,287Bonds . . . . . . . . . . . . . . . . . . . . . . . . . . – 8,273 1,548 9,821Derivative financial assets
Foreign currency exchange contracts . . – 62,424 – 62,424Stock acquisition rights . . . . . . . . . . . – – 2,424 2,424
Other . . . . . . . . . . . . . . . . . . . . . . . . . . – 27,736 19,020 46,756
Total . . . . . . . . . . . . . . . . . . . . . . . 73,807 98,433 572,472 744,712Financial liabilities
Derivative financial liabilitiesForeign currency exchange contracts . . – 76,051 – 76,051
Interest rate swap contracts . . . . . . . – 75 – 75
Total . . . . . . . . . . . . . . . . . . . . . . . ¥ – ¥76,126 ¥ – ¥ 76,126
As of March 31, 2017
(Millions of yen)
Level 1 Level 2 Level 3 Total
Financial assetsEquity securities . . . . . . . . . . . . . . . . . . ¥407,271 ¥ – ¥668,334 ¥1,075,605Bonds . . . . . . . . . . . . . . . . . . . . . . . . . . – 7,837 1,132 8,969Derivative financial assets
Foreign currency exchange contracts . . – 50,627 – 50,627Option contracts . . . . . . . . . . . . . . . . – – 6,208 6,208Interest rate contracts . . . . . . . . . . . . – 1,039 – 1,039
Other . . . . . . . . . . . . . . . . . . . . . . . . . . – 1,501 22,284 23,785Total . . . . . . . . . . . . . . . . . . . . . . . 407,271 61,004 697,958 1,166,233
Financial liabilitiesInterest-bearing borrowings . . . . . . . . . – – 43,164 43,164Derivative financial liabilities
Foreign currency exchange contracts . . – 107,697 – 107,697Option contracts . . . . . . . . . . . . . . . . – 152,564 – 152,564Interest rate contracts . . . . . . . . . . . . – 250 – 250
Total . . . . . . . . . . . . . . . . . . . . . . . ¥ – ¥260,511 ¥ 43,164 ¥ 303,675
(Thousands of U.S. dollars)
Level 1 Level 2 Level 3 Total
Financial assetsEquity securities . . . . . . . . . . . . . $3,630,190 $ – $5,957,162 $9,587,352Bonds . . . . . . . . . . . . . . . . . . . . . – 69,855 10,090 79,945Derivative financial assets
Foreign currency exchange contracts . . . . . . . . . . . . . . . . – 451,261 – 451,261
Option contracts . . . . . . . . . . . – – 55,335 55,335Interest rate contracts . . . . . . . – 9,260 – 9,260
Other . . . . . . . . . . . . . . . . . . . . . – 13,379 198,627 212,006Total . . . . . . . . . . . . . . . . . . 3,630,190 543,755 6,221,214 10,395,159
Financial liabilitiesInterest-bearing borrowings . . . . – – 384,740 384,740Derivative financial liabilities
Foreign currency exchange contracts . . . . . . . . . . . . . . . . – 959,952 – 959,952
Option contracts . . . . . . . . . . . – 1,359,871 – 1,359,871Interest rate contracts . . . . . . . – 2,229 – 2,229
Total . . . . . . . . . . . . . . . . . . $ – $2,322,052 $ 384,740 $2,706,792
SoftBank Group Corp. ANNUAL REPORT 2017 152Trajectory of
the Information RevolutionBringing the Future Forward
EssentialInformation
Management Organization
Corporate Information
Financial Section

The major valuation techniques for financial instruments measured at fair value on a recurring basis are as
follows:
a. Equity securities and bonds
Equity securities and bonds are measured using quoted prices in active markets for identical assets or
liabilities if such prices are available, and are classified as Level 1. Where such quoted prices in active
markets for identical assets or liabilities are not available, they are measured using quoted prices for
identical assets or liabilities in markets that are not active, quoted prices of comparable companies and
valuation techniques such as the discounted cash flow model. They are classified as Level 2 if all
significant inputs such as quoted prices and discount rates that are used for the measurement are
observable, whereas if inputs include significant unobservable inputs, they are classified as Level 3.
b. Derivative financial assets and derivative financial liabilities
The fair value of derivative financial instruments is measured using valuation techniques such as the
discounted cash flows model. Derivative financial instruments are classified as Level 2 if all significant
inputs such as foreign currency exchange rates and discount rates that are used for the measurement
are observable, whereas if inputs include significant unobservable inputs, they are classified as Level 3.
c. Interest-bearing debt
The fair value of interest-bearing debt is measured using the discounted cash flows model. The model
uses unobservable inputs, such as customer churn rates, customer upgrade probabilities, and the
likelihood that Sprint will elect the Exchange Option1 versus the termination option2 upon customer
upgrade, resulting in a Level 3 classification.
Notes:1. The option to transfer the title in the new device to the borrower in exchange for the title in the original device upon
customer upgrade, in order to continue the borrowings2. The option that Sprint terminates the borrowings
(2) Fair value measurements of financial instruments that are categorized as Level 3a. Valuation techniques and inputs
The following table shows information about the valuation techniques used and the significant
unobservable inputs used in the Level 3 fair value measurements.
Equity securities
Ranges of unobservable inputs
Valuation techniques Unobservable inputsAs of
March 31, 2016As of
March 31, 2017
Price of recent investment Discount for lack of marketability 10.0%–45.0% 10.0%–35.0%
Control premium 5.0%–10.0% 5.0%–10.0%
Discounted cash flow Cost of capital 16.9% –Perpetual growth rate 5.2% –Discount for lack of marketability 15.0% –
Discount for non-control interest 17.0% –
b. Sensitivity Analysis
Of the above unobservable inputs, perpetual growth rate and control premiums have a positive
correlation with the fair value of equity securities, whereas cost of capital, discount for non-controling
interest, and discount for lack of marketability have a negative correlation with the fair value of equity
securities.
c. Valuation processes
Fair value is measured by our personnel in the treasury and accounting departments based on internal
regulations, using the most appropriate valuation techniques and inputs that reflect the nature,
characteristics and risks of the financial instruments subject to fair value. The fair value of financial
instruments that require a high level of knowledge and experience for the valuation is measured by
external specialists if the amount of such financial instruments is material. The result of the measure-
ment conducted at the end of each quarter, including the valuation by the external specialists, is
reported to the Company’s Board of Directors after the analysis of fair value changes and other
contents are reviewed and approved by the head of the department.
SoftBank Group Corp. ANNUAL REPORT 2017 153Trajectory of
the Information RevolutionBringing the Future Forward
EssentialInformation
Management Organization
Corporate Information
Financial Section

d. Roll forward of financial instruments categorized as Level 3
Roll forward of financial instruments categorized as Level 3 is as follows:
For the fiscal year ended March 31, 2016
(Millions of yen)
Financial assets Equity securities BondsDerivative
financial assets Other
As of April 1, 2015 . . . . . . . . . . . . ¥242,754 ¥ 3,258 ¥1,144 ¥12,528Gains or losses
Net income . . . . . . . . . . . . . . . . 89,308 (7,528) 1,704 –Other comprehensive income . . . (18,629) (314) – 859
Purchases . . . . . . . . . . . . . . . . . . . . 247,508 1,292 363 6,271Sales . . . . . . . . . . . . . . . . . . . . . . . (11,361) (500) – (1,739)Transfers to Level 1 due to listing . . . (8,206) – – –Transfers to Level 3* . . . . . . . . . . . 17,067 6,812 – –Other . . . . . . . . . . . . . . . . . . . . . . . (8,961) (1,472) (787) 1,101
As of March 31, 2016 . . . . . . . . . . ¥549,480 ¥ 1,548 ¥2,424 ¥19,020
Gains or losses recognized in net income on financial instruments held at March 31, 2016 . . . . . . . . ¥ 85,536 ¥(7,786) ¥1,704 ¥ –
Note: * Equity securities are transferred from Level 1 to Level 3 and bonds are transferred from Level 2 to Level 3 as it became difficult to
obtain their observable inputs. Also, impairment losses for these equity securities and bonds are recognized after transferred to Level 3. The details are described in Note 1 in “Note 40. Other non-operating income and loss.”
For the fiscal year ended March 31, 2017
(Millions of yen)
Financial assetsEquity
securities BondsDerivative
financial assets Other
As of April 1, 2016 . . . . . . . . . . . . ¥ 549,480 ¥1,548 ¥2,424 ¥19,020Gains or losses
Net income . . . . . . . . . . . . . . . . (154,374) 9 3,821 (1,291)Other comprehensive income . . . 12,871 13 (37) 12
Purchases . . . . . . . . . . . . . . . . . . . . 262,627 251 – 9,342Sales . . . . . . . . . . . . . . . . . . . . . . . (4,435) (640) – (3,692)Transfers to Level 1 due to listing . . . (553) – – –Other . . . . . . . . . . . . . . . . . . . . . . . 2,718 (49) – (1,107)As of March 31, 2017 . . . . . . . . . . ¥ 668,334 ¥1,132 ¥6,208 ¥22,284Gains or losses recognized in net income on financial instruments held at March 31, 2017 . . . . . . . . ¥(153,340) ¥ – ¥3,821 ¥ (1,293)
(Millions of yen)
Financial liabilitiesInterest-bearing
debt
As of April 1, 2016 . . . . . . . . . . . . ¥ –Gains or losses
Net income . . . . . . . . . . . . . . . . 4,593Other comprehensive income . . . 1,111
Borrowings . . . . . . . . . . . . . . . . . . 115,116Repayments and Redemptions . . . . (77,656)As of March 31, 2017 ¥ 43,164Gains or losses recognized in net income on financial instruments held at March 31, 2017 . . . . . . . . ¥ 2,395
SoftBank Group Corp. ANNUAL REPORT 2017 154Trajectory of
the Information RevolutionBringing the Future Forward
EssentialInformation
Management Organization
Corporate Information
Financial Section

(Thousands of U.S. dollars)
Financial assetsEquity
securities BondsDerivative
financial assets Other
As of April 1, 2016 . . . . . . . . . . . . $ 4,897,763 $13,798 $21,606 $169,534Gains or losses
Net income . . . . . . . . . . . . . . . . (1,376,006) 81 34,059 (11,508)Other comprehensive income . . . 114,725 116 (330) 107
Purchases . . . . . . . . . . . . . . . . . . . . 2,340,913 2,237 – 83,269Sales . . . . . . . . . . . . . . . . . . . . . . . (39,531) (5,705) – (32,908)Transfers to Level 1 due to listing . . . (4,929) – – –Other . . . . . . . . . . . . . . . . . . . . . . . 24,227 (437) – (9,867)As of March 31, 2017 . . . . . . . . . . $ 5,957,162 $10,090 $55,335 $198,627Gains or losses recognized in net income on financial instruments held at March 31, 2017 . . . . . . . . $(1,366,788) $ – $34,059 $ (11,525)
(Thousands of U.S. dollars)
Financial liabilitiesInterest-bearing
debt
As of April 1, 2016 . . . . . . . . . . . . $ –Gains or losses
Net income . . . . . . . . . . . . . . . . 40,939Other comprehensive income . . . 9,903
Borrowings . . . . . . . . . . . . . . . . . . 1,026,081Repayments and Redemptions . . . . (692,183)As of March 31, 2017 . . . . . . . . . . $ 384,740Gains or losses recognized in net income on financial instruments held at March 31, 2017 . . . . . . . . $ 21,348
Gains or losses recognized in profit or loss are included in “Derivative gain (loss),” “Gain (loss) from
financial instruments at FVTPL,” and “Other non-operating income (loss)” in the consolidated
statement of income. Gains or losses recognized in other comprehensive income, net of tax, are
included in “Available-for-sale financial assets” and “Exchange differences on translating foreign
operations” in the consolidated statement of comprehensive income.
(3) Carrying amounts and fair values of financial instrumentsThe table below presents carrying amounts and fair values of financial instruments.
(Millions of yen) (Thousands of U.S. dollars)
As of March 31, 2016 As of March 31, 2017 As of March 31, 2017
Carrying amount Fair value Carrying amount Fair value Carrying amount Fair value
Non-currentInterest-bearing debt
Long-term borrowings . . . . . . . . . . . . . . . . . . . . . . . . . . . . . . . . . . . . . . . . . ¥1,785,500 ¥1,797,632 ¥ 3,377,625 ¥ 3,436,955 $ 30,106,293 $ 30,635,128Corporate bonds . . . . . . . . . . . . . . . . . . . . . . . . . . . . . . . . . . . . . . . . . . . . . 6,611,947 6,099,330 7,233,838 7,590,748 64,478,456 67,659,756Lease obligations . . . . . . . . . . . . . . . . . . . . . . . . . . . . . . . . . . . . . . . . . . . . . 815,194 817,057 807,606 818,686 7,198,556 7,297,317Installment payables . . . . . . . . . . . . . . . . . . . . . . . . . . . . . . . . . . . . . . . . . . . 63,181 64,280 29,760 30,908 265,265 275,497
Total . . . . . . . . . . . . . . . . . . . . . . . . . . . . . . . . . . . . . . . . . . . . . . . . . . . . . ¥9,275,822 ¥8,778,299 ¥11,448,829 ¥11,877,297 $102,048,570 $105,867,698
Financial instruments whose carrying amounts are reasonably similar to fair values are not included in the table above. Financial instruments that are measured at fair value on a recurring basis are also excluded because their
fair values are the same as their carrying amounts.
SoftBank Group Corp. ANNUAL REPORT 2017 155Trajectory of
the Information RevolutionBringing the Future Forward
EssentialInformation
Management Organization
Corporate Information
Financial Section

The major valuation techniques for fair value measurements of the above financial liabilities are as follows:
a. Long-term borrowings
Fair values of the non-current portion of long-term borrowings with floating interest rates are
measured based on the discounted cash flow method using observable inputs such as market interests,
and the measurement is categorized as Level 2. Fair values of the non-current portion of long-term
borrowings with fixed rates are measured based on the discounted cash flow method using an interest
rate including the credit spread that would be used for a borrowing with the same terms and maturity.
Those borrowings are categorized as Level 3.
b. Corporate bonds
Fair values of the non-current portion of corporate bonds are mainly categorized as Level 1 or Level 2.
When the fair value is measured using quoted prices in active markets for identical bonds, it is
categorized as Level 1. When the fair value is measured using quoted prices that are observable in
markets that are not active for identical bonds, it is categorized as Level 2. The fair value of corporate
bond categorized as Level 3 is immaterial.
c. Lease obligations
Fair values of the non-current portion of lease obligations are measured based on the discounted cash
flow method using an interest rate considering the period until payment and credit risk, and are
categorized as Level 2.
d. Installment payables
Fair values of the non-current portion of installment payables are measured based on the discounted
cash flow method using an interest rate adjusted for the remaining repayment period and credit risks,
and the measurement are categorized as Level 2.
27. Transfers of financial assetsThe Company enters into securitization transactions involving trade and installment receivables.
The major securitization transactions involve the securitization of receivables related to wireless service
charges due from subscribers and installment receivables recognized from the mobile handset sales business.
For each transaction, the Company transferred receivables to financial institutions and acquired cash and
subordinate interest in the transferred receivables for financing purposes. The receivables sold are not
derecognized because in each transaction, the Company retains subordinate interest and, therefore, substan-
tially retains all the risks and rewards of ownership of the transferred assets. Cash received from transferring
the receivables are included in “Interest-bearing debt” under current liabilities and non-current liabilities.
The following table presents the carrying amount of financial assets and related liabilities that are
transferred but do not meet the derecognition criteria, as well as the fair value where related liabilities have
recourse only to the transferred assets:
(Millions of yen)(Thousands of U.S.
dollars)
As ofMarch 31, 2016
As ofMarch 31, 2017
As ofMarch 31, 2017
Carrying amount of transferred assets . . . . . . . . ¥ 857,186 ¥1,020,257 $ 9,094,010Carrying amount of related liabilities . . . . . . . . . (624,563) (735,205) (6,553,213)
(Fair value of financial assets and financial liabilities where related liabilities have recourse only to the transferred assets)
Fair value of transferred assets . . . . . . . . . . . . . . ¥ 857,186 ¥1,020,257 $ 9,094,010Fair value of related liabilities . . . . . . . . . . . . . . . (624,096) (735,880) (6,559,230)
Net position . . . . . . . . . . . . . . . . . . . . . . . . . . ¥ 233,090 ¥ 284,377 $ 2,534,780
The difference between transferred assets and related liabilities is the subordinate interest which the
Company retains on securitization.
SoftBank Group Corp. ANNUAL REPORT 2017 156Trajectory of
the Information RevolutionBringing the Future Forward
EssentialInformation
Management Organization
Corporate Information
Financial Section
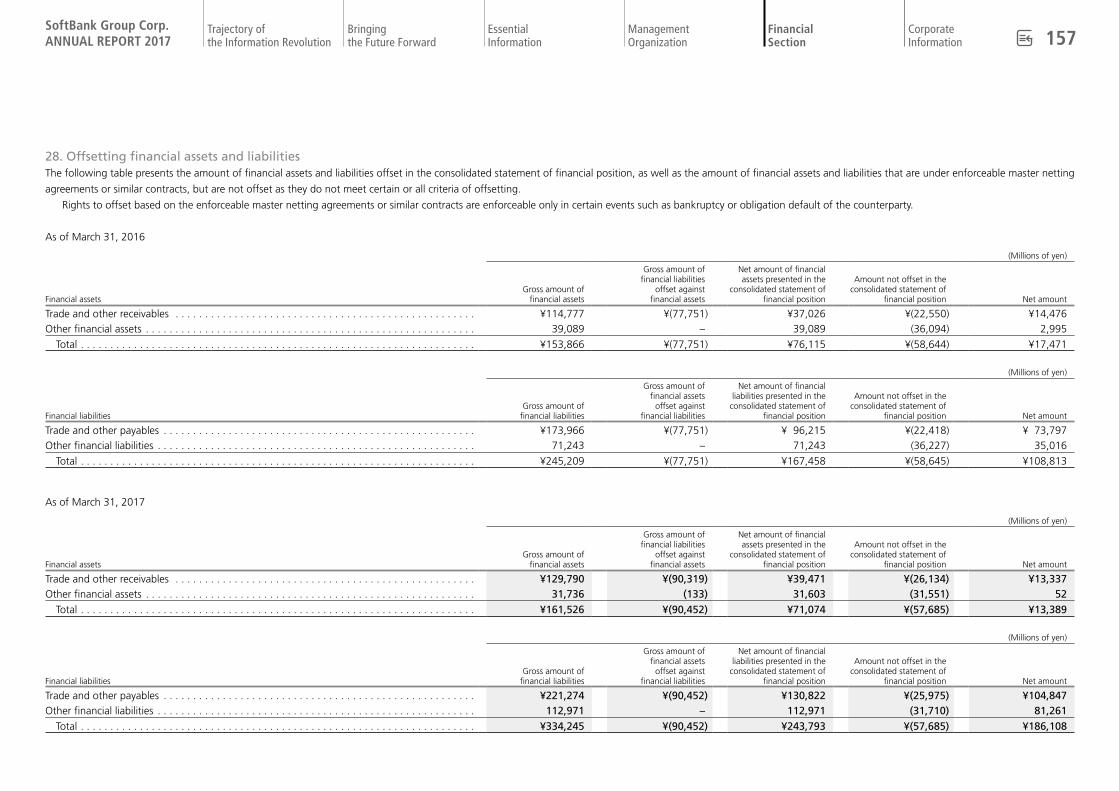
28. Offsetting financial assets and liabilitiesThe following table presents the amount of financial assets and liabilities offset in the consolidated statement of financial position, as well as the amount of financial assets and liabilities that are under enforceable master netting
agreements or similar contracts, but are not offset as they do not meet certain or all criteria of offsetting.
Rights to offset based on the enforceable master netting agreements or similar contracts are enforceable only in certain events such as bankruptcy or obligation default of the counterparty.
As of March 31, 2016
(Millions of yen)
Financial assetsGross amount of
financial assets
Gross amount offinancial liabilities
offset against financial assets
Net amount of financial assets presented in the
consolidated statement of financial position
Amount not offset in the consolidated statement of
financial position Net amount
Trade and other receivables . . . . . . . . . . . . . . . . . . . . . . . . . . . . . . . . . . . . . . . . . . . . . . . . . . . ¥114,777 ¥(77,751) ¥37,026 ¥(22,550) ¥14,476Other financial assets . . . . . . . . . . . . . . . . . . . . . . . . . . . . . . . . . . . . . . . . . . . . . . . . . . . . . . . . 39,089 – 39,089 (36,094) 2,995
Total . . . . . . . . . . . . . . . . . . . . . . . . . . . . . . . . . . . . . . . . . . . . . . . . . . . . . . . . . . . . . . . . . . . ¥153,866 ¥(77,751) ¥76,115 ¥(58,644) ¥17,471
(Millions of yen)
Financial liabilitiesGross amount of
financial liabilities
Gross amount offinancial assets
offset against financial liabilities
Net amount of financialliabilities presented in the
consolidated statement of financial position
Amount not offset in the consolidated statement of
financial position Net amount
Trade and other payables . . . . . . . . . . . . . . . . . . . . . . . . . . . . . . . . . . . . . . . . . . . . . . . . . . . . . ¥173,966 ¥(77,751) ¥ 96,215 ¥(22,418) ¥ 73,797Other financial liabilities . . . . . . . . . . . . . . . . . . . . . . . . . . . . . . . . . . . . . . . . . . . . . . . . . . . . . . 71,243 – 71,243 (36,227) 35,016
Total . . . . . . . . . . . . . . . . . . . . . . . . . . . . . . . . . . . . . . . . . . . . . . . . . . . . . . . . . . . . . . . . . . . ¥245,209 ¥(77,751) ¥167,458 ¥(58,645) ¥108,813
As of March 31, 2017
(Millions of yen)
Financial assetsGross amount of
financial assets
Gross amount offinancial liabilities
offset against financial assets
Net amount of financial assets presented in the
consolidated statement of financial position
Amount not offset in the consolidated statement of
financial position Net amount
Trade and other receivables . . . . . . . . . . . . . . . . . . . . . . . . . . . . . . . . . . . . . . . . . . . . . . . . . . . ¥129,790 ¥(90,319) ¥39,471 ¥(26,134) ¥13,337Other financial assets . . . . . . . . . . . . . . . . . . . . . . . . . . . . . . . . . . . . . . . . . . . . . . . . . . . . . . . . 31,736 (133) 31,603 (31,551) 52
Total . . . . . . . . . . . . . . . . . . . . . . . . . . . . . . . . . . . . . . . . . . . . . . . . . . . . . . . . . . . . . . . . . . . ¥161,526 ¥(90,452) ¥71,074 ¥(57,685) ¥13,389
(Millions of yen)
Financial liabilitiesGross amount of
financial liabilities
Gross amount offinancial assets
offset against financial liabilities
Net amount of financialliabilities presented in the
consolidated statement of financial position
Amount not offset in the consolidated statement of
financial position Net amount
Trade and other payables . . . . . . . . . . . . . . . . . . . . . . . . . . . . . . . . . . . . . . . . . . . . . . . . . . . . . ¥221,274 ¥(90,452) ¥130,822 ¥(25,975) ¥104,847Other financial liabilities . . . . . . . . . . . . . . . . . . . . . . . . . . . . . . . . . . . . . . . . . . . . . . . . . . . . . . 112,971 – 112,971 (31,710) 81,261
Total . . . . . . . . . . . . . . . . . . . . . . . . . . . . . . . . . . . . . . . . . . . . . . . . . . . . . . . . . . . . . . . . . . . ¥334,245 ¥(90,452) ¥243,793 ¥(57,685) ¥186,108
SoftBank Group Corp. ANNUAL REPORT 2017 157Trajectory of
the Information RevolutionBringing the Future Forward
EssentialInformation
Management Organization
Financial Section
Corporate Information

(Thousands of U.S. dollars)
Financial assetsGross amount of
financial assets
Gross amount offinancial liabilities
offset against financial assets
Net amount of financial assets presented in the
consolidated statement of financial position
Amount not offset in the consolidated statement of
financial position Net amount
Trade and other receivables . . . . . . . . . . . . . . . . . . . . . . . . . . . . . . . . . . . . . . . . . . . . . . . . . . . $1,156,877 $(805,054) $351,823 $(232,944) $118,879Other financial assets . . . . . . . . . . . . . . . . . . . . . . . . . . . . . . . . . . . . . . . . . . . . . . . . . . . . . . . . 282,877 (1,185) 281,692 (281,228) 464
Total . . . . . . . . . . . . . . . . . . . . . . . . . . . . . . . . . . . . . . . . . . . . . . . . . . . . . . . . . . . . . . . . . . . $1,439,754 $(806,239) $633,515 $(514,172) $119,343
(Thousands of U.S. dollars)
Financial liabilitiesGross amount of
financial liabilities
Gross amount offinancial assets
offset against financial liabilities
Net amount of financialliabilities presented in the
consolidated statement of financial position
Amount not offset in the consolidated statement of
financial position Net amount
Trade and other payables . . . . . . . . . . . . . . . . . . . . . . . . . . . . . . . . . . . . . . . . . . . . . . . . . . . . . $1,972,314 $(806,239) $1,166,075 $(231,526) $ 934,549Other financial liabilities . . . . . . . . . . . . . . . . . . . . . . . . . . . . . . . . . . . . . . . . . . . . . . . . . . . . . . 1,006,962 – 1,006,962 (282,646) 724,316
Total . . . . . . . . . . . . . . . . . . . . . . . . . . . . . . . . . . . . . . . . . . . . . . . . . . . . . . . . . . . . . . . . . . . $2,979,276 $(806,239) $2,173,037 $(514,172) $1,658,865
29. Foreign currency exchange ratesExchange rates of the major currencies used for translating the financial statements of foreign operations are
as follows:
(1) Rate at the end of the period
(Yen)
As of March 31, 2016
As of March 31, 2017
U.S. dollars . . . . . . . . . . . . . . . . . . . . . . . . . . . . . . . . . . . . . . . . . . . ¥112.68 ¥112.19British pound . . . . . . . . . . . . . . . . . . . . . . . . . . . . . . . . . . . . . . . . . . 161.92 140.08
(2) Average rate for the quarterFor the fiscal year ended March 31, 2016
(Yen)
Three months endedJune 30, 2015
Three months ended
September 30, 2015
Three months ended
December 31, 2015
Three months ended
March 31, 2016
U.S. dollars . . . . . . . . . . . . ¥121.34 ¥121.91 ¥121.07 ¥116.95
For the fiscal year ended March 31, 2017
(Yen)
Three months endedJune 30, 2016
Three months ended
September 30, 2016
Three months ended
December 31,2016
Three months ended
March 31, 2017
U.S. dollars . . . . . . . . . . . . ¥109.07 ¥102.91 ¥108.72 ¥113.76
(3) Foreign exchange sensitivity analysis for exchange differences on translating foreign operations
The table below presents the effect of a 1% appreciation of the Japanese yen against the U.S. dollar, British
pound and Chinese yuan, which are the main foreign currencies of the Company, regarding the translation of
assets, liabilities, and interests in net assets in foreign operations into the presentation currency, assuming that
all other factors are constant.
Impact of exchange differences on translating foreign operations (decrease in equity)
(Millions of yen)(Thousands of
U.S. dollars)
Fiscal year endedMarch 31, 2016
Fiscal year endedMarch 31, 2017
Fiscal year endedMarch 31, 2017
U.S. dollar . . . . . . . . . . . . . . . . . . . . . . . . . . . . . ¥(28,673) ¥(31,910) $(284,428)British pound . . . . . . . . . . . . . . . . . . . . . . . . . . . – (34,325) (305,954)Chinese yuan . . . . . . . . . . . . . . . . . . . . . . . . . . . (12,016) (13,362) (119,102)
SoftBank Group Corp. ANNUAL REPORT 2017 158Trajectory of
the Information RevolutionBringing the Future Forward
EssentialInformation
Management Organization
Financial Section
Corporate Information

30. Equity(1) Common stock
a. Shares authorized
The number of shares authorized to be issued is as follows:
(Thousands of shares)
March 31, 2016 March 31, 2017
Ordinary shares . . . . . . . . . . . . . . . . . . . . . . . . . . . . . . . . . . . 3,600,000 3,600,000
b. Shares issued
Changes in the number of shares issued are as follows:
(Thousands of shares)
Fiscal year endedMarch 31, 2016
Fiscal year endedMarch 31, 2017
Balance at the beginning of the year . . . . . . . . . . . . . . . . . . . 1,200,660 1,200,660Increase during the year . . . . . . . . . . . . . . . . . . . . . . . . . . . . . – –Decrease during the year3 . . . . . . . . . . . . . . . . . . . . . . . . . . . . – (100,000)Balance at the end of the year . . . . . . . . . . . . . . . . . . . . . . . . 1,200,660 1,100,660Notes:1. Shares issued by the Company is common stock with no par value.2. Shares issued have been fully paid.3. The Company retired 100,000 thousand shares of treasury stock on October 31, 2016.
(2) Capital surplusCapital surplus of the Company includes additional paid-in capital, which is legal capital surplus. Under the
Companies Act of Japan (the“Companies Act”), at least 50% of the proceeds upon issuance of equity
instruments shall be credited to common stock. The remainder of the proceeds shall be credited to additional
paid-in capital. The Companies Act permits, upon approval at the general meeting of shareholders, the
transfer of amounts from additional paid-in capital to common stock.
For the fiscal year ended March 31, 2016
The Company acquired an additional 24.1% shares of Supercell, a subsidiary of the Company, from existing
shareholders and the Company’s ownership in Supercell became 77.8%. In connection with this transaction,
¥120,847 million is deducted from capital surplus as “Changes in interests in subsidiaries.”
(3) Retained earningsRetained earnings of the Company include the reserve legally required as legal retained earnings. The
Companies Act provides that 10% of the dividend of retained earnings shall be appropriated as legal capital
surplus or as legal retained earnings until their aggregate amount equals 25% of common stock. The legal
retained earnings may be used to eliminate or reduce a deficit or be transferred to retained earnings upon
approval at the general meeting of shareholders.
(4) Treasury stockThe Companies Act provides for companies to purchase treasury stock and dispose of such treasury stock by
resolution of the Board of Directors. The amount of treasury stock purchased cannot exceed the amount
available for distribution to the shareholders which is determined by a specific formula.
Changes in treasury stock are as follows:
(Thousands of shares)
Fiscal year endedMarch 31, 2016
Fiscal year endedMarch 31, 2017
Balance at the beginning of the year . . . . . . . . . . . . . . . . . . . . . . . . . 11,463 53,760Increase during the year . . . . . . . . . . . . . . . . . . . . . . . . . . . . . . . . . . 42,873 58,073Decrease during the year . . . . . . . . . . . . . . . . . . . . . . . . . . . . . . . . . (576) (100,455)Balance at the end of the year . . . . . . . . . . . . . . . . . . . . . . . . . . . . . 53,760 11,378Notes:1. The number of shares of treasury stock acquired based on the resolution passed at the Board of Directors’ meeting for the fiscal year ended
March 31, 2017 was 58,069 thousand and total acquisition cost was ¥350,826 million ($3,127,070 thousand). (The number of shares of treasury stock acquired based on the resolution passed at the Board of Directors’ meeting for the fiscal year ended March 31, 2016 was 42,867 thousand, and total acquisition cost was ¥269,173 million.)
2. Based on the resolution passed at the Board of Directors’ meeting held on October 7, 2016, the Company retired its treasury stock of 100,000 thousand shares on October 31, 2016. As a result, “Retained earnings” and “Treasury stock” are decreased by ¥595,195 million ($5,305,241 thousand).
SoftBank Group Corp. ANNUAL REPORT 2017 159Trajectory of
the Information RevolutionBringing the Future Forward
EssentialInformation
Management Organization
Financial Section
Corporate Information

(5) Accumulated other comprehensive incomeThe changes in the accumulated other comprehensive income are as follows:
(Millions of yen)
Remeasurements of defined benefit plan
Available-for-sale financial assets Cash flow hedges
Exchange differenceson translating
foreign operations Total
As of April 1, 2015 . . . . . . . . . . . . . . . . . . . . . . . . . . . . . . . . . . . . . . . . . . . . . . . . . . . . . . . . . . . . ¥ – ¥14,524 ¥ (7,345) ¥ 533,207 ¥ 540,386Other comprehensive income (attributable to owners of the parent) . . . . . . . . . . . . . . . . . . . . . . 342 18,070 (32,743) (263,977) (278,308)
Transfer to retained earnings . . . . . . . . . . . . . . . . . . . . . . . . . . . . . . . . . . . . . . . . . . . . . . . . . . . (342) – – – (342)
As of March 31, 2016 . . . . . . . . . . . . . . . . . . . . . . . . . . . . . . . . . . . . . . . . . . . . . . . . . . . . . . . . . . – 32,594 (40,088) 269,230 261,736Other comprehensive income (attributable to owners of the parent) . . . . . . . . . . . . . . . . . . . . . . 10,140 (20,611) (4,789) (25,090) (40,350)Transfer to retained earnings . . . . . . . . . . . . . . . . . . . . . . . . . . . . . . . . . . . . . . . . . . . . . . . . . . . (10,140) – – – (10,140)
As of March 31, 2017 . . . . . . . . . . . . . . . . . . . . . . . . . . . . . . . . . . . . . . . . . . . . . . . . . . . . . . . . . . . ¥ – ¥ 11,983 ¥ (44,877) ¥ 244,140 ¥ 211,246
(Thousands of U.S. dollars)
Remeasurements of defined benefit plan
Available-for-sale financial assets Cash flow hedges
Exchange differenceson translating
foreign operations Total
As of March 31, 2016 . . . . . . . . . . . . . . . . . . . . . . . . . . . . . . . . . . . . . . . . . . . . . . . . . . . . . . . . . . . $ – $290,525 $(357,322) $2,399,768 $2,332,971Other comprehensive income (attributable to owners of the parent) . . . . . . . . . . . . . . . . . . . . . . 90,382 (183,715) (42,687) (223,638) (359,658)Transfer to retained earnings . . . . . . . . . . . . . . . . . . . . . . . . . . . . . . . . . . . . . . . . . . . . . . . . . . . (90,382) – – – (90,382)
As of March 31, 2017 . . . . . . . . . . . . . . . . . . . . . . . . . . . . . . . . . . . . . . . . . . . . . . . . . . . . . . . . . . $ – $106,810 $(400,009) $2,176,130 $1,882,931Note:The above amount is presented net of tax effect. The amount of income taxes on each item in other comprehensive income is described in “Note 41. Other comprehensive income.”
SoftBank Group Corp. ANNUAL REPORT 2017 160Trajectory of
the Information RevolutionBringing the Future Forward
EssentialInformation
Management Organization
Financial Section
Corporate Information
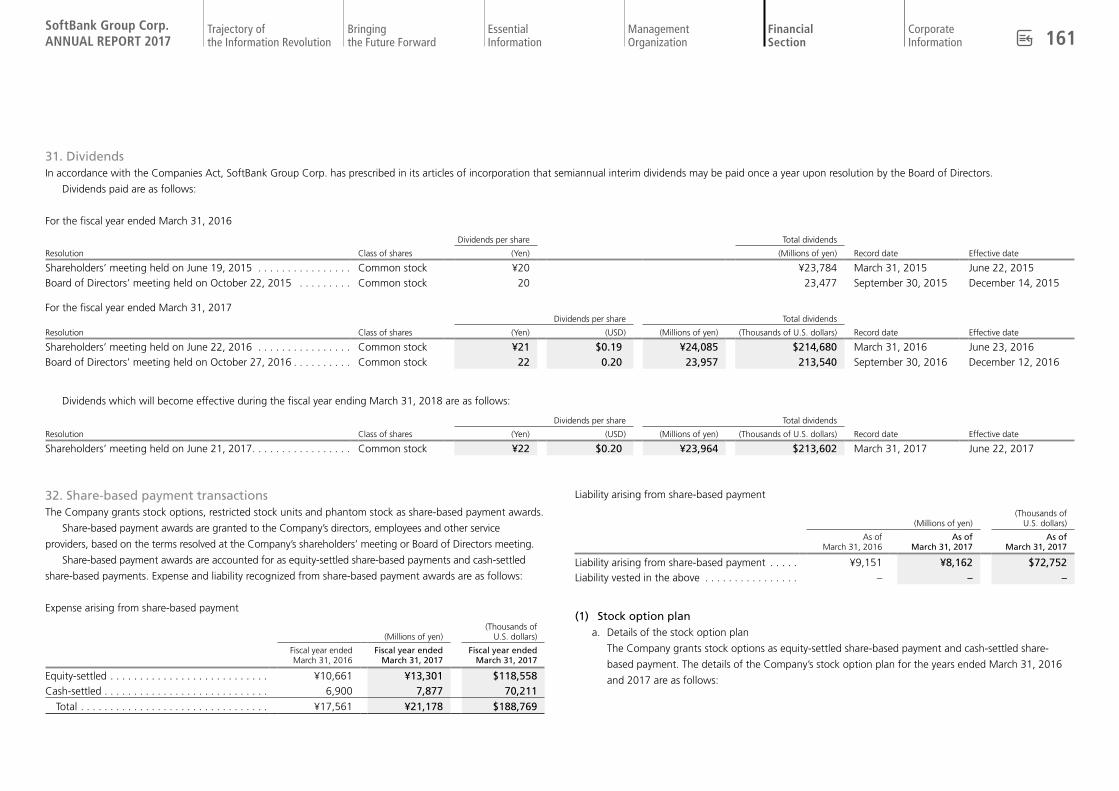
31. DividendsIn accordance with the Companies Act, SoftBank Group Corp. has prescribed in its articles of incorporation that semiannual interim dividends may be paid once a year upon resolution by the Board of Directors.
Dividends paid are as follows:
For the fiscal year ended March 31, 2016
Dividends per share Total dividends
Resolution Class of shares (Yen) (Millions of yen) Record date Effective date
Shareholders’ meeting held on June 19, 2015 . . . . . . . . . . . . . . . . Common stock ¥20 ¥23,784 March 31, 2015 June 22, 2015 Board of Directors’ meeting held on October 22, 2015 . . . . . . . . . Common stock 20 23,477 September 30, 2015 December 14, 2015
For the fiscal year ended March 31, 2017Dividends per share Total dividends
Resolution Class of shares (Yen) (USD) (Millions of yen) (Thousands of U.S. dollars) Record date Effective date
Shareholders’ meeting held on June 22, 2016 . . . . . . . . . . . . . . . . Common stock ¥21 $0.19 ¥24,085 $214,680 March 31, 2016 June 23, 2016Board of Directors’ meeting held on October 27, 2016 . . . . . . . . . . Common stock 22 0.20 23,957 213,540 September 30, 2016 December 12, 2016
Dividends which will become effective during the fiscal year ending March 31, 2018 are as follows:
Dividends per share Total dividends
Resolution Class of shares (Yen) (USD) (Millions of yen) (Thousands of U.S. dollars) Record date Effective date
Shareholders’ meeting held on June 21, 2017 . . . . . . . . . . . . . . . . . Common stock ¥22 $0.20 ¥23,964 $213,602 March 31, 2017 June 22, 2017
32. Share-based payment transactionsThe Company grants stock options, restricted stock units and phantom stock as share-based payment awards.
Share-based payment awards are granted to the Company’s directors, employees and other service
providers, based on the terms resolved at the Company’s shareholders’ meeting or Board of Directors meeting.
Share-based payment awards are accounted for as equity-settled share-based payments and cash-settled
share-based payments. Expense and liability recognized from share-based payment awards are as follows:
Expense arising from share-based payment
(Millions of yen)(Thousands of
U.S. dollars)
Fiscal year endedMarch 31, 2016
Fiscal year ended March 31, 2017
Fiscal year ended March 31, 2017
Equity-settled . . . . . . . . . . . . . . . . . . . . . . . . . . . ¥10,661 ¥13,301 $118,558Cash-settled . . . . . . . . . . . . . . . . . . . . . . . . . . . . 6,900 7,877 70,211
Total . . . . . . . . . . . . . . . . . . . . . . . . . . . . . . . . ¥17,561 ¥21,178 $188,769
Liability arising from share-based payment
(Millions of yen)(Thousands of
U.S. dollars)
As of March 31, 2016
As of March 31, 2017
As of March 31, 2017
Liability arising from share-based payment . . . . . ¥9,151 ¥8,162 $72,752Liability vested in the above . . . . . . . . . . . . . . . . – – –
(1) Stock option plana. Details of the stock option plan
The Company grants stock options as equity-settled share-based payment and cash-settled share-
based payment. The details of the Company’s stock option plan for the years ended March 31, 2016
and 2017 are as follows:
SoftBank Group Corp. ANNUAL REPORT 2017 161Trajectory of
the Information RevolutionBringing the Future Forward
EssentialInformation
Management Organization
Financial Section
Corporate Information

(a) SoftBank Group Corp.
SoftBank Group Corp. grants stock options to its directors and employees. Shares granted by the
exercise of stock options are those issued by SoftBank Group Corp.
Year issued / Name Grant date Due date for exercise
2010 - 6th Stock Acquisition Rights1 . . . . . . . August 27, 2010 June 30, 2017
2013 - 7th Stock Acquisition Rights2 . . . . . . . July 31, 2013 June 30, 2021
2016 July Stock Acquisition Rights3 . . . . . . . . July 28, 2016 July 31, 2022
2017 February Stock Acquisition Rights3 . . . . February 27, 2017 February 28, 2023Notes: 1. Vesting condition
A person entitled to the vested stock acquisition rights (“entitled person”) is able to exercise these rights only when all the following conditions are satisfied:a. total free cash flows in the consolidated statement of cash flows for the years ended in March 2010, 2011 and 2012 in the
Annual Securities Report filed by SoftBank Group Corp. based on Financial Instruments and Exchange Act exceed ¥1.0 trillion;b. net interest-bearing debt in the consolidated balance sheet for the year ended in March 2012 in the Annual Securities Report
filed by SoftBank Group Corp. based on Financial Instruments and Exchange Act is less than ¥0.97 trillion; and,c. total operating income in the consolidated statement of income for the years ended in March 2011 and 2012 in the Annual
Securities Report filed by SoftBank Group Corp. based on Financial Instruments and Exchange Act exceeds ¥1.1 trillion.
The amount of the stock acquisition rights exercisable by an entitled person is limited as prescribed in “a” through “d” below. Fractional points, if any, of the exercisable stock acquisition rights are rounded down.a. from July 1, 2012 through June 30, 2013: 25% of the allocated amount of stock acquisition rightsb. from July 1, 2013 through June 30, 2014: 50% of the allocated amount of stock acquisition rights along with the stock
acquisition rights exercised in the period “a” abovec. from July 1, 2014 through June 30, 2015: 75% of the allocated amount of stock acquisition rights along with the stock
acquisition rights exercised in the period “a” and “b” aboved. from July 1, 2015 through June 30, 2017: 100% of the allocated amount of stock acquisition rights along with the stock
acquisition rights exercised in the period “a” through “c” above
Vesting requires continuous service from the grant date to the vesting date. When an eligible person retires, vested acquisition rights are forfeited.
2. Vesting conditionThe stock acquisition rights expired as the rights were unable to meet the vesting condition. The vesting condition is as follows;
A person entitled to vested stock acquisition rights (“entitled person”) is able to exercise these rights only when operating income in the consolidated statement of income for the year ended in March 2016 in the Annual Securities Report to be filed by SoftBank Group Corp. based on the Financial Instruments and Exchange Act in June 2016 (“target index”) exceeds 1.2 trillion Yen (“target amount”). SoftBank Group Corp. may change the target index or target amount within a reasonable range due to changes in accounting policies or other factors, if necessary.The amount of the stock acquisition rights exercisable in the period “a” through “c” below by an entitled person who was granted and allocated stock acquisition rights of 10,000 or more in total, is limited as below. Fractional points, if any, of the exercisable stock acquisition rights are rounded down.a. from July 1, 2016 to June 30, 2017: 25% of the allocated amount of stock acquisition rightsb. from July 1, 2017 to June 30, 2018: 50% of the allocated amount of stock acquisition rights along with the stock acquisition
rights exercised in the period “a” abovec. from July 1, 2018 to June 30, 2021: 100% of the allocated amount of stock acquisition rights along with the stock acquisition
rights exercised in the period “a” and “b” above
Vesting requires continuous service from the grant date to the vesting date. When an eligible person retires, vested acquisition rights are forfeited.
3. Vesting conditionStock options vest when the service period requirements are met, and the vesting period is 2 years.Vesting requires continuous service from the grant date to the vesting date. When an eligible person retires, vested acquisition rights are forfeited.
(b) Sprint
Sprint grants stock options to its directors, employees and other service providers. Shares granted
by the exercise of stock options are those issued by Sprint Corporation.
Year issued / Name Grant date Due date for exercise
Nextel Incentive Equity Plan . . . . . . . . From May 24, 2004 through May 26, 2005
From May 24, 2014 through May 26, 2015
1997 Long-term Incentive Program . . . From February 8, 2005 through February 27, 2007
From February 8, 2015 through February 27, 2017
2007 Omnibus Incentive Plan . . . . . . From July 9, 2007 through May 31, 2015
From July 9, 2017 through May 31, 2025
2015 Omnibus Incentive Plan . . . . . . . From August 25, 2015 through February 2, 2017
From August 25, 2025 through February 2, 2027
Note: Vesting conditionGenerally, stock options vest when service period requirements are met. The vesting period is generally 3 years and vests each period equally.
(c) Supercell
Supercell grants stock options to its employees. Shares granted by the exercise of stock options are
those issued by Supercell Oy. Also, in July 2016, Supercell was excluded from the scope of
consolidation.
Year issued / Name Grant date Due date for exercise
Supercell Oy Share option program . . . . . . . From March 31, 2011 through April 1, 2014
From September 17, 2014 through March 31, 2021
Note:Vesting conditionStock options vest when service period requirements are met. The vesting period is within 4 years. 25% of options vest after 1 year from the conclusion of the share payment contract or the beginning of service. The residual options vest each month equally over the next 3 years.
(d) Brightstar
Brightstar grants stock options as equity-settled share-based payments and cash-settled share-
based payments to its directors, employees and other service providers.
Year issued / Name Grant date Due date for exercise
Brightstar Global Group Inc. 2006 Stock Incentive Plan1 . . . . . . . . . . . . .
From July 12, 2006 through January 21, 2014
From July 12, 2016 through January 21, 2024
Brightstar Global Group Inc. 2016 Stock Incentive Plan2 . . . . . . . . . . . . . March 15, 2016
From January 1, 2017 through February 28, 2017
SoftBank Group Corp. ANNUAL REPORT 2017 162Trajectory of
the Information RevolutionBringing the Future Forward
EssentialInformation
Management Organization
Financial Section
Corporate Information

Notes:1. Vesting condition Generally, stock options vest when the service period requirements are met. Rights vest equally over a 4 year period. Brightstar
Corp. has the option to settle either by Brightstar Global Group Inc. shares or cash when options are exercised and those are accounted for as equity-settled share-based payments. Shares granted by the exercise of stock options are those issued by Brightstar Global Group Inc.
2. Vesting condition Stock options vest when the service period requirements are met. The vesting period is within 1 year. Brightstar Corp. has the
option to settle either by Brightstar Global Group Inc. shares or cash when options are exercised and those are accounted for as cash-settled share-based payments.
(e) Yahoo Japan Corporation
Yahoo Japan Corporation grants stock options to its directors and employees. Shares granted by
the exercise of stock options are those issued by Yahoo Japan Corporation.
Year issued / Name Grant date Due date for exercise
2006 1 From September 6, 2006 through February 7, 2007
From August 23, 2016 through January 24, 2017
2007 1 From May 8, 2007 through February 13, 2008
From April 24, 2017 through January 30, 2018
2008 1 From May 9, 2008 through February 10, 2009
From April 25, 2018 through January 27, 2019
2009 1 From May 12, 2009 through February 10, 2010
From April 28, 2019 through January 27, 2020
2010 1 From May 11, 2010 through February 8, 2011
From April 27, 2020 through January 25, 2021
2011 1 From June 3, 2011 through February 17, 2012
From May 20, 2021 through February 3, 2022
20121st 1
2nd 2
From May 16, 2012 through March 1, 2013
From May 2, 2022 through February 28, 2023
20131st 3
2nd 4
From May 17, 2013 through November 19, 2013
From May 16, 2023 through November 18, 2023
20141st 4 May 26, 2014 May 25, 2024
Notes:1. Vesting condition Rights are mainly starting to vest in stages after 2 years from the grant date. One-half of the total grant vests after 2 years from
the grant date, and one fourth grant vests per year for the subsequent 2 years. Vesting requires continuous service from the grant date to the vesting date. When an eligible person retires, vested acquisition rights are forfeited.
2. Vesting condition Rights vest according to the amount of operating income achieved as specified in either (i) or (ii) below in the period from the
fiscal year ended in March 2014 through the fiscal year ending in March 2019. (i) If the operating income exceeds ¥250 billion Period of achievement: By fiscal year March 2016 Exercisable ratio: 20% Period of achievement: By fiscal year March 2017 Exercisable ratio: 14% Period of achievement: By fiscal year March 2018 Exercisable ratio: 8%
Period of achievement: By fiscal year March 2019 Exercisable ratio: 2%
(ii) If the operating income exceeds ¥330 billion Period of achievement: By fiscal year March 2016 Exercisable ratio: 80% Period of achievement: By fiscal year March 2017 Exercisable ratio: 56% Period of achievement: By fiscal year March 2018 Exercisable ratio: 32% Period of achievement: By fiscal year March 2019 Exercisable ratio: 8%
Vesting requires continuous service from the grant date to the vesting date. When an eligible person retires, vested acquisition rights are forfeited.
3. Vesting condition Rights vest according to the amount of operating income achieved as specified in either (i) or (ii) below in the period from the
fiscal year ended in March 2014 through the fiscal year ending in March 2019. (i) If the operating income exceeds ¥250 billion Exercisable ratio: 20% (ii) If the operating income exceeds ¥330 billion Exercisable ratio: 80%
Vesting requires continuous service from the grant date to the vesting date. When an eligible person retires, vested acquisition rights are forfeited.
4. Vesting condition Rights vest once the operating income for the fiscal year exceeds ¥330 billion in either of the period from the fiscal year ended in
March 2015 through the fiscal year ending in March 2019. Vesting requires continuous service from the grant date to the vesting date. When an eligible person retires, vested acquisition rights are forfeited.
b. Fair value of stock options granted during the period
Weighted-average fair value and fair value measurement, at the measurement date of the stock
options granted during the period are as follows:
(a) SoftBank Group Corp.
The weighted-average fair value at the measurement date of the stock options granted during the
period is ¥1,318 ($11.75).
Fair value is measured as follows:
Fiscal year ended March 31, 2017
Year issued / Name2016 July stock
acquisition rights2017 February stock
acquisition rights
Valuation method used Black-Scholes model Black-Scholes model(Yen) (USD) (Yen) (USD)
Key inputs and assumptions:
Weighted-average stock price . . . . ¥5,366 $47.83 ¥8,393 $74.81Weighted-average exercise price . . . ¥6,159 $54.90 ¥8,891 $79.25Volatility of stock price* . . . . . . . . . 39.87% 38.38%Estimated residual period . . . . . . . . 4 years 4 years
Estimated dividend . . . . . . . . . . . . . ¥41/per
share$0.37/per
share¥44/per
share$0.39/per
shareRisk-free interest rate . . . . . . . . . . . (0.38)% (0.15)%
Note:* Volatility of the stock price is calculated based on the performance of the stock price for the most recent period depending on the
period to maturity.
SoftBank Group Corp. ANNUAL REPORT 2017 163Trajectory of
the Information RevolutionBringing the Future Forward
EssentialInformation
Management Organization
Financial Section
Corporate Information

(b) Sprint
The weighted-average fair value at the measurement date of the stock options granted during the
period is $2.23.
Fair value is measured as follows:
Fiscal year ended March 31, 2017
Year issued / Name 2015 Omnibus incentive plan
Valuation method used Black-Scholes modelKey inputs and assumptions:
Weighted-average stock price . . . . . . . . . . . . . . . . . . . . . . . . $3.79Weighted-average exercise price . . . . . . . . . . . . . . . . . . . . . . . $3.72Volatility of stock price* . . . . . . . . . . . . . . . . . . . . . . . . . . . . . 64.47%Estimated residual period . . . . . . . . . . . . . . . . . . . . . . . . . . . . 6 yearsEstimated dividend . . . . . . . . . . . . . . . . . . . . . . . . . . . . . . . . . –Risk-free interest rate . . . . . . . . . . . . . . . . . . . . . . . . . . . . . . . 1.48%
Note:* Volatility of stock price is calculated based on an implied volatility, measured by the stock price and option price of Sprint at the
calculation date.
c. Changes in stock options during the period and the condition of stock options at the period end
Changes in stock options during the period and the condition of stock options at the period end are
as follows:
(a) SoftBank Group Corp.
Fiscal year ended March 31, 2016 Fiscal year ended March 31, 2017
Number of shares
Weighted-average
exercise price(Yen)
Number of shares
Weighted- average
exercise price (Yen) (USD)
Beginning balance – Unexercised . . . . . . . . . . . . 11,495,500 ¥4,516 689,700 ¥2,625 $23.40
Granted . . . . . . . . . . . . . . . . – – 4,364,000 6,218 55.42Forfeited . . . . . . . . . . . . . . . . (10,229,800) 4,750 (12,000) 4,098 36.53Exercised . . . . . . . . . . . . . . . (576,000) 2,625 (455,300) 2,625 23.40Ending balance – Unexercised . . . . . . . . . . . . . 689,700 2,625 4,586,400 6,040 53.84
Ending balance – Exercisable . . . . . . . . . . . . . 689,700 ¥2,625 227,400 ¥2,625 $23.40
(b) Sprint
Fiscal year ended March 31, 2016 Fiscal year ended March 31, 2017
Number ofshares
Weighted-average
exercise price(USD)
Number ofshares
Weighted- average
exercise price (USD)
Beginning balance – Unexercised . . . . . . . . . . . . 39,861,827 $ 5.34 40,742,546 $4.69
Granted . . . . . . . . . . . . . . . . 12,290,437 4.66 12,075,685 3.72Forfeited . . . . . . . . . . . . . . . . (6,735,629) 5.42 (3,410,819) 4.62Exercised . . . . . . . . . . . . . . . . (1,439,758) 2.43 (11,653,873) 3.93Matured . . . . . . . . . . . . . . . (3,234,331) 12.06 (574,253) 7.96Ending balance – Unexercised . . . . . . . . . . . . 40,742,546 4.69 37,179,286 4.57
Ending balance – Exercisable . . . . . . . . . . . . . 20,866,540 $ 4.10 16,852,255 $4.74
The unexercised options as of March 31, 2017 are as follows:
Range of exercise price (USD) Number of sharesWeighted-average exercise price(USD)
Weighted-average remaining contract
period (year)
$ 0.00 – $3.00 . . . . . . . . . . . . . . . . 2,923,458 $2.08 5.25 3.01 – 4.00 . . . . . . . . . . . . . . . . 13,050,212 3.43 7.58 4.01 – 5.00 . . . . . . . . . . . . . . . . 12,947,337 4.65 7.36 5.01 – 6.00 . . . . . . . . . . . . . . . . 3,859,625 5.61 6.47 6.01 – 7.00 . . . . . . . . . . . . . . . . 756,646 6.21 9.42 7.01 – 10.00 . . . . . . . . . . . . . . . 3,642,008 8.92 7.31
Total . . . . . . . . . . . . . . . . . . . . . . 37,179,286 $4.57 7.22
SoftBank Group Corp. ANNUAL REPORT 2017 164Trajectory of
the Information RevolutionBringing the Future Forward
EssentialInformation
Management Organization
Financial Section
Corporate Information

(c) Supercell
Fiscal year ended March 31, 2016 Fiscal year ended March 31, 2017
Number of shares
Weighted- average
exercise price (EUR)
Number of shares
Weighted-average
exercise price (EUR)
Beginning balance – Unexercised . . 1,854,701 €5.24 1,062,495 € 5.78Granted . . . . . . . . . . . . . . . . . . . . . – – – –Forfeited . . . . . . . . . . . . . . . . . . . . (462,279) 5.47 (220,164) 3.85Exercised . . . . . . . . . . . . . . . . . . . . . (329,927) 3.17 (139,385) 17.91Decrease due to loss of control* . . . – – (702,946) 3.98Ending balance – Unexercised . . . . . 1,062,495 5.78 – –Ending balance – Exercisable . . . . . . 318,972 €4.34 – € –
Note:* In July 2016, Supercell was excluded from the scope of consolidation.
(d) Brightstar
Fiscal year ended March 31, 2016 Fiscal year ended March 31, 2017
Number ofshares
Weighted- average
exercise price(USD)
Number ofshares
Weighted- average
exercise price(USD)
Beginning balance – Unexercised . . . . . . . . . . . . 1,464,993 $27.51 609,920 $14.00
Granted . . . . . . . . . . . . . . . . 366,772 5.45 – –Repurchased* . . . . . . . . . . . . (621,367) 28.85 – –Forfeited . . . . . . . . . . . . . . . (600,478) 26.37 (10,000) 33.25Matured . . . . . . . . . . . . . . . . – – (376,483) 6.06Ending balance – Unexercised . . . . . . . . . . . . 609,920 14.00 223,437 26.53
Ending balance – Exercisable . . . . . . . . . . . . . 206,898 $26.33 217,812 $26.46
Note: * Brightstar Corp. repurchased outstanding stock options held by existing employees for cash consideration of $1.00 per stock
option in December 2015
The unexercised options as of March 31, 2017, are as follows:
Range of exercise price (USD) Number of shares
Weighted- average
exercise price(USD)
Weighted- average remaining
contract period (year)
$15.00 . . . . . . . . . . . . . . . . . . . . . . 34,000 $15.00 2.06 20.00 . . . . . . . . . . . . . . . . . . . . . . 8,500 20.00 0.32 29.00 . . . . . . . . . . . . . . . . . . . . . . 180,937 29.00 5.76
Total . . . . . . . . . . . . . . . . . . . . . . 223,437 $26.53 4.99
(e) Yahoo Japan Corporation
Fiscal year ended March 31, 2016 Fiscal year ended March 31, 2017
Number of shares
Weighted- average
exercise price(Yen)
Number of shares
Weighted- average
exercise price (Yen) (USD)
Beginning balance – Unexercised . . . . . . . . . . . . 65,586,700 ¥429 63,973,500 ¥429 $3.82
Granted . . . . . . . . . . . . . . . . – – – – –Forfeited . . . . . . . . . . . . . . . . (1,260,700) 450 (2,088,700) 445 3.97Exercised . . . . . . . . . . . . . . . (346,400) 331 (286,200) 347 3.09Matured . . . . . . . . . . . . . . . (6,100) 680 (343,300) 471 4.20Ending balance – Unexercised . . . . . . . . . . . 63,973,500 429 61,255,300 429 3.82
Ending balance – Exercisable . . . . . . . . . . . . . 3,522,500 ¥360 2,899,300 ¥346 $3.08
The unexercised options as of March 31, 2017 are as follows:
Range of exercise price
(Yen)
Range of exercise price
(USD)Number of
shares
Weighted- average
exercise price(Yen)
Weighted- average
exercise price(USD)
Weighted- average
remaining contract period
(year)
¥201 – ¥300 $1.79 – $2.67 841,200 ¥270 $2.41 4.4 301 – 400 2.68 – 3.56 24,797,500 324 2.89 5.8 401 – 500 3.57 – 4.46 10,962,200 486 4.33 5.9 501 – 600 4.47 – 5.35 24,654,400 514 4.58 6.6
Total . . . . . . . . . . . . . . . . . . 61,255,300 ¥429 $3.82 6.1
SoftBank Group Corp. ANNUAL REPORT 2017 165Trajectory of
the Information RevolutionBringing the Future Forward
EssentialInformation
Management Organization
Financial Section
Corporate Information

d. Stock options exercised during the period
Weighted-average stock prices at the date exercised, for those stock options that were exercised
during the period are as follows:
(a) SoftBank Group Corp.
Fiscal year ended March 31, 2016 Fiscal year ended March 31, 2017
Year issued/ Name
Number of shares exercised
Weighted - average
stock price at exercise
(Yen) Year issued / Name
Number of shares exercised
Weighted- average
stock price at exercise
(Yen) (USD)
2010 - 6th Stock Acquisition Rights 576,000 ¥7,021
2010 - 6th Stock Acquisition Rights 455,300 ¥7,291 $64.99
(b) Sprint
Fiscal year ended March 31, 2016 Fiscal year ended March 31, 2017
Year issued/ Name
Number of shares exercised
Weighted- average
stock price at exercise
(USD) Year issued / Name
Numberof shares exercised
Weighted- average
stock price at exercise
(USD)
2007 Omnibus Incentive Plan . . . 1,439,758 $4.41
2007 Omnibus Incentive Plan . . . 11,566,044 $7.33
2015 Omnibus Incentive Plan . . . 87,829 $7.50
(c) Yahoo Japan Corporation
Fiscal year ended March 31, 2016 Fiscal year ended March 31, 2017
Year issued/ Name
Number of shares exercised
Weighted-average
stock price at exercise
(Yen) Year issued / Name
Number of shares exercised
Weighted- average
stock price at exercise
(Yen) (USD)
2006 9,900 ¥550 2006 31,600 ¥491 $4.382007 34,400 530 2007 51,200 525 4.682008 49,900 523 2008 22,900 505 4.502009 46,000 505 2009 37,300 510 4.552010 80,500 508 2010 58,000 521 4.642011 116,500 504 2011 69,100 501 4.472012 9,200 500 2012 16,100 501 4.47
Note:
Weighted-average stock price at exercise is not calculated for the Supercell Stock option plan since
Supercell Oy shares are not publicly traded.
(2) Restricted stock unit planThe Company adopts restricted stock unit (“RSU”) plans where the Company grants stocks, the transfer of
which is restricted for a certain period until vested, and is accounted for as equity-settled share-based
payment.
The details of the Company’s RSU plans for the years ended March 31, 2016 and 2017 are as follows:
a. Sprint
Sprint grants shares of Sprint Corporation as RSUs to its directors, employees and other service providers.
The fair value of the RSU is generally measured based on the closing price of the stock on the
date of grant.
RSU generally has performance and service requirements or service requirements only, with vesting
periods ranging from one to three years.
During the year ended March 31, 2017, Sprint granted performance-based RSUs that will be
earned upon the achievement of certain market conditions, which are based on the Sprint share price.
The fair value of these market-based RSUs is estimated at the date of grant using the Monte Carlo
valuation methodology, which incorporates into the valuation the possibility that the market condition
may not be satisfied. These market-based RSUs will vest 50% over four years from the grant date and
50% over five years from the grant date.
The number of RSUs granted for the fiscal year ended March 31, 2017 was 54,729,219 units. The
weighted-average fair value of RSUs granted for the fiscal year ended March 31, 2017 was $5.64 per
unit.
b. Galaxy Investment Holdings, Inc.
Galaxy Investment Holdings, Inc. grants RSUs to its director with the option to settle either by Sprint
Corporation shares held by Galaxy Investment Holdings, Inc. or cash. As Galaxy Investment Holdings,
Inc. has the option to settle by cash instead of Sprint Corporation shares, this RSU grant has been
accounted for as an equity-settled share-based payment. The fair value of the RSUs is measured based
on the stock price as of the date of the grant.
RSU vests equally each year over four years, with continuous service required through each
vesting date.
c. Supercell
Supercell grants shares of Supercell Oy as RSU to its employees. The RSU plan is accounted for as an
equity-settled share-based payment even though Supercell has the option to settle some of the RSU in
cash when the options are exercised instead of Supercell Oy shares. RSU granted for the fiscal year
ended March 31, 2017 was 12,000 units. The fair value of the RSU is intrinsic value measured using
the discount cash flow method or guideline public companies method. The weighted-average fair
value of the RSU granted for the fiscal year ended March 31, 2017 was €102.35 per unit.
SoftBank Group Corp. ANNUAL REPORT 2017 166Trajectory of
the Information RevolutionBringing the Future Forward
EssentialInformation
Management Organization
Financial Section
Corporate Information

RSU vests equally each year over four years, with continuous service required through each
vesting date.
Also, in July 2016, Supercell was excluded from the scope of consideration.
(3) Phantom stockThe Company adopts phantom stock awards where the Company pays in cash based on the stock price at the
vesting date, and they are accounted for as cash-settled share-based payments.
The details of phantom stock for the fiscal years ended March 31, 2016 and 2017 are as follows:
SoftBank Group Corp., SB Group US, Inc., and SoftBank Holdings, Inc.
SoftBank Group Corp., SB Group US, Inc., and SoftBank Holdings, Inc. granted phantom stock, which is
based on the shares of SoftBank Group Corp., to their directors, employees, and other service providers.
It requires one to have continued employment from the grant date through the vesting date. The amount
of settlement at the vesting date is determined based on the share per unit. The details of vesting conditions
are as follows:
The number of units and vesting conditions as of March 31, 2017
unit Vesting condition
3,278,641 The initial vesting date is four years from the first date of service. A quarter of the total vests on the initial vesting date and quarter of the total vests every two years thereafter.
740,691 It vests fully when five years pass from the first date of the service period.
2,206,900 Vesting periods are mainly four or five years from the first date of service, or service provided, and vests over those periods.
33. Net salesThe components of net sales are as follows:
(Millions of yen)(Thousands of
U.S. dollars)
Fiscal year endedMarch 31, 2016
Fiscal year endedMarch 31, 2017
Fiscal year endedMarch 31, 2017
Domestic Telecommunications segmentTelecom service revenue . . . . . . . . . . . . . . . . . ¥2,395,925 ¥2,413,429 $21,511,980Products and other sales . . . . . . . . . . . . . . . . . 710,930 743,396 6,626,223
Total . . . . . . . . . . . . . . . . . . . . . . . . . . . . . . 3,106,855 3,156,825 28,138,203Sprint segment
Telecom service revenue . . . . . . . . . . . . . . . . . 3,501,532 3,120,616 27,815,456Products and other sales . . . . . . . . . . . . . . . . . 186,966 338,526 3,017,435
Total . . . . . . . . . . . . . . . . . . . . . . . . . . . . . . 3,688,498 3,459,142 30,832,891Yahoo Japan segment
Net sales from rendering of services . . . . . . . . 461,420 519,350 4,629,200Net sales from sale of goods . . . . . . . . . . . . . . 181,460 322,231 2,872,190
Total . . . . . . . . . . . . . . . . . . . . . . . . . . . . . . 642,880 841,581 7,501,390Distribution segment . . . . . . . . . . . . . . . . . . . . . . 1,345,856 1,228,051 10,946,172Arm segment . . . . . . . . . . . . . . . . . . . . . . . . . . . – 112,901 1,006,337Other . . . . . . . . . . . . . . . . . . . . . . . . . . . . . . . . . 97,688 102,504 913,665
Total . . . . . . . . . . . . . . . . . . . . . . . . . . . . . . ¥8,881,777 ¥8,901,004 $79,338,658
SoftBank Group Corp. ANNUAL REPORT 2017 167Trajectory of
the Information RevolutionBringing the Future Forward
EssentialInformation
Management Organization
Financial Section
Corporate Information

34. Cost of sales and selling, general and administrative expensesThe components of cost of sales and selling, general and administrative expenses are as follows:
(Millions of yen)(Thousands of
U.S. dollars)
Fiscal year endedMarch 31, 2016
Fiscal year endedMarch 31, 2017
Fiscal year endedMarch 31, 2017
Cost of goods sold . . . . . . . . . . . . . . . . . . . . . . . ¥(2,370,094) ¥(2,433,370) $(21,689,723)Depreciation and amortization . . . . . . . . . . . . . . (1,373,467) (1,465,609) (13,063,633)Sales commissions and sales promotion expenses . . . . . . . . . . . . . . . . . . . . . (1,073,036) (954,998) (8,512,327)
Employees and directors benefit cost . . . . . . . . . (558,433) (569,414) (5,075,443)Operating lease expenses . . . . . . . . . . . . . . . . . . (471,057) (494,579) (4,408,405)Telecommunications equipment usage fees . . . . (513,411) (429,176) (3,825,439)Service outsourcing expenses . . . . . . . . . . . . . . . (282,074) (290,681) (2,590,971)Other . . . . . . . . . . . . . . . . . . . . . . . . . . . . . . . . . (1,251,487) (1,111,662) (9,908,745)
Total . . . . . . . . . . . . . . . . . . . . . . . . . . . . . . . . ¥(7,893,059) ¥(7,749,489) $(69,074,686)
“Depreciation and amortization” includes disposal of “Property, plant and equipment” and “Intangible
assets” as well as amortization of long-term prepaid expenses which are recorded in “Other non-current
assets” in the consolidated statement of financial position.
35. Other operating loss The components of other operating income and loss are as follows:
(Millions of yen)(Thousands of
U.S. dollar)
Fiscal year endedMarch 31, 2016
Fiscal year ended March 31, 2017
Fiscal year ended March 31, 2017
Sprint segment:Gain on spectrum license exchange1 . . . . . . . . ¥ – ¥ 36,385 $ 324,316Loss on disposal of property, plant, and equipment2 . . . . . . . . . . . . . . . . . . . . . . . . . . (37,032) (55,727) (496,720)
Loss on contract termination3 . . . . . . . . . . . . . – (15,399) (137,258)U.S. state tax charge . . . . . . . . . . . . . . . . . . . . – (10,600) (94,483)Legal reserves . . . . . . . . . . . . . . . . . . . . . . . . . (23,437) (4,209) (37,517)Severance costs associated with reduction in the workforce . . . . . . . . . . . . . . . . . . . . . . . . (26,079) (2,277) (20,296)
Impairment loss on non-current assets4 . . . . . . (19,881) – –Other . . . . . . . . . . . . . . . . . . . . . . . . . . . . . . . (10,271) (8,201) (73,099)
Yahoo Japan segment:Loss on disaster5 . . . . . . . . . . . . . . . . . . . . . . . – (13,006) (115,928)Other . . . . . . . . . . . . . . . . . . . . . . . . . . . . . . . – 2,269 20,225
Distribution segment:
Impairment loss on goodwill6 . . . . . . . . . . . . . – (30,260) (269,721)Impairment loss on non-current assets7 . . . . . . (13,633) – –Other . . . . . . . . . . . . . . . . . . . . . . . . . . . . . . . (2,833) – –
Arm segment:
Acquisition-related costs8 . . . . . . . . . . . . . . . . – (25,780) (229,789)Company-wide:
Expense resulting from resignation of director9 . . . . . . . . . . . . . . . . . . . . . . . . . . . . – (8,847) (78,857)
Other:
Impairment loss on assets10 . . . . . . . . . . . . . . . – (8,051) (71,763)Other . . . . . . . . . . . . . . . . . . . . . . . . . . . . . . . (6,086) – –
Total . . . . . . . . . . . . . . . . . . . . . . . . . . . . . . ¥(139,252) ¥(143,703) $(1,280,890)Notes: 1. License exchange gain resulting from the exchange of certain spectrum licenses, which is recorded as FCC licenses in intangible assets, with
other carriers (non-cash transaction). 2. Loss mainly resulting from the write-off of leased devices associated with lease cancellations prior to scheduled customer lease terms where
customers did not return the devices to Sprint. In fiscal year ended March 31, 2016, ¥6,684 million of loss was recognized upon the sale of devices to Mobile Leasing Solutions, LLC under the Handset Sale-Leaseback transaction. Regarding the Handset Sale-Leaseback transaction, the details are described in “Note 14. Leases.”
3. Loss mainly resulting from termination of wholesale contracts with NTELOS Holdings Corp. 4. Impairments are primarily related to cell site construction costs that are no longer expected to be used as a result of changes in Sprint’s
network plans.
SoftBank Group Corp. ANNUAL REPORT 2017 168Trajectory of
the Information RevolutionBringing the Future Forward
EssentialInformation
Management Organization
Financial Section
Corporate Information

5. In February 2017, a fire incident occurred at a logistics center of ASKUL, namely, ASKUL Logi PARK Tokyo Metropolitan. The fire inflicted damage on ASKUL’s non-current assets and inventories resulting in a temporary operation shutdown. The loss from the fire incident consists of ¥10,230 million ($91,185 thousand) of damage on non-current assets, ¥2,510 million ($22,373 thousand) of destroyed inventories, and ¥266 million ($2,371 thousand) of related costs.
6. Goodwill of Brightstar had been allocated in its entirety to Brightstar (a group of cash-generating units), which had bundled five cash-generat-ing units (Brightstar’s US and Canada region, Latin America region, Asia & Oceania region, SoftBank Commerce & Service Corp., and Europe and Africa region); however, in March 2017, its goodwill was reallocated to Brightstar, which bundled four cash-generating units, except for SoftBank Commerce & Service Corp., due to the decision to reorganize the Distribution segment. As impairment indicators existed, the impairment test was conducted on goodwill and intangible assets with indefinite useful lives. As a result, the recoverable amount of goodwill was less than its carrying amount, and therefore, ¥30,260 million ($269,721 thousand) of impairment loss on goodwill was recorded as “Other operating loss”. Value in use was used as the recoverable amount and calculated by discounting the management-approved estimated future cash flow plan of the four cash-generating units by 10.97% - 16.17%, the weighted-average capital cost before tax.
7. As a result of revising the business plan of the Brightstar’s Latin America region, the recoverable amount became negative and, therefore, the carrying amount related to the cash-generating unit was reduced to ¥0. Impairment loss on property, plant, and equipment was ¥8,070 million and impairment loss on intangible assets was ¥5,563 million.Value in use was used as the recoverable amount and calculated by discounting management approved estimated future cashflow plan by 22.11%, weighted average capital cost before tax.
8. Expenses arising from the business combination of Arm. The details of the business combination are described in “(3) Arm” in “Note 5. Business combinations”.
9. Expenses resulting from the resignation of Nikesh Arora from his position as a director. The details are described in “(2) Remuneration for major executives” in “Note 45. Related party transactions.”
10. As a result of revising the business plan of SoftBank Robotics Corp., the recoverable amount was less than its carrying amount, and therefore the related carrying amount of assets was reduced to its recoverable amount of ¥3,471 million ($30,939 thousand) determined based on its value in use.
36. Finance costThe components of finance cost are as follows:
(Millions of yen)(Thousands of
U.S. dollars)
Fiscal year endedMarch 31, 2016
Fiscal year endedMarch 31, 2017
Fiscal year endedMarch 31, 2017
Interest expense* . . . . . . . . . . . . . . . . . . . . . . . . ¥(440,744) ¥(467,311) $(4,165,353)Note:* Interest expense was mainly from financial liabilities measured at amortized cost.
37. Gain on sales of shares of associatesFor the fiscal year ended March 31, 2017
The Company sold a portion of its Alibaba shares to Alibaba, Gamlight Pte Ltd, a wholly-owned subsidiary of
GIC Private Limited, and Aranda Investments Pte. Ltd., a wholly-owned subsidiary of Temasek Holdings Private
Limited on June 13, 2016, and to Alibaba Partnership* on July 11, 2016. As a result of the transactions,
¥ 234,418 million ($2,089,473 thousand) was recorded as a gain on sales of shares of associates.
The aggregate amount of its sale was ¥ 359,704 million ($3.4 billion), of which the sale price for Alibaba
was ¥ 212,920 million ($2.0 billion). The sale price was determined by negotiation with reference to the
market price of Alibaba shares.Note:* Alibaba Partnership is not an associate of Alibaba.
38. Derivative gain and lossFor the fiscal year ended March 31, 2017
Derivative loss of ¥232,729 million ($2,074,418 thousand) was recorded related to a collar transaction
included in a variable prepaid forward contract. The details of the variable prepaid forward contract are
described in “(2) Transaction for sale of Alibaba shares by variable prepaid forward contract” in “Note 19.
Interest-bearing debt”
39. Gain and loss from financial instruments at FVTPLFor the fiscal year ended March 31, 2017
Loss from financial instruments at FVTPL mainly consists of changes in fair value of preferred stock invest-
ments, including embedded derivatives, such as ANI Technologies Pvt. Ltd and Jasper Infotech Private Limited
in India, designated as financial assets at FVTPL.
40. Other non-operating income and lossThe components of other non-operating income and loss are as follows:
(Millions of yen)(Thousands of
U.S. dollars)
Fiscal year endedMarch 31, 2016
Fiscal year endedMarch 31, 2017
Fiscal year endedMarch 31, 2017
Foreign currency exchange gain and loss . . . . . . . ¥ (41,414) ¥ 53,336 $ 475,408Impairment loss on securities1 . . . . . . . . . . . . . . . (32,759) (6,098) (54,354)Dilution gain from changes in equity interest2 . . . . 14,903 77,540 691,149Loss relating to loss of control3 . . . . . . . . . . . . . . – (79,278) (706,641)Impairment loss on assets classified as held for sale4 . . . . . . . . . . . . . . . . . . . . . . . . . . . . . . . . . – (42,540) (379,178)
Provision of allowance for doubtful accounts1 . . . (21,253) (60) (535)Other . . . . . . . . . . . . . . . . . . . . . . . . . . . . . . . . . 16,531 4,519 40,280
Total . . . . . . . . . . . . . . . . . . . . . . . . . . . . . . . . ¥ (63,992) ¥ 7,419 $ 66,129Notes:1. Shares and loans related to investments of PT Trikomsel Oke Tbk. in Indonesia were impaired as the investment amounts and the loans amount
were not expected to be collected. As a result, impairment loss on securities and provision of allowance for doubtful accounts totaling ¥38,185 million were recorded for the fiscal year ended March 31, 2016.
2. Gain arising from changes in Alibaba’s equity interest held by the Company mainly due to the exercise of stock options issued by Alibaba and the allocation of new shares to a third party.
3. On February 24, 2017, the Company entered into an agreement with Foxconn Technology Group in Taiwan to establish a joint venture through its wholly-owned subsidiary, SOFTBANK GROUP CAPITAL APAC PTE. LTD. SOFTBANK GROUP CAPITAL APAC PTE. LTD. accordingly issued new ordinary shares to Foxconn (Far East) Limited on March 3, 2017, and changed its name to Foxconn Ventures Pte. Ltd. as of the same date. As a result of the transaction, the percentage of voting rights of Foxconn Ventures Pte. Ltd. held by the Company was reduced to 45.5% and the entity has become an equity method associate and no longer qualified as a consolidated subsidiary of the Company from March 3, 2017. The loss relating to the loss of control resulting from the transaction was ¥79,278 million ($706,641 thousand). Of this amount, the amount that was transferred from accumulated other comprehensive income to net loss due to the loss of control was ¥131,529 million ($1,172,377 thousand) and the gain from remeasurement relating to applying the equity method was ¥52,251 million ($465,737 thousand).
SoftBank Group Corp. ANNUAL REPORT 2017 169Trajectory of
the Information RevolutionBringing the Future Forward
EssentialInformation
Management Organization
Financial Section
Corporate Information

4. The Company transferred a portion of its GungHo shares to assets classified as held for sale as the Company tendered in a Tender Offer by GungHo in the three month period ended June 30, 2016. Accordingly, the carrying amounts of the shares were reduced to the fair values after deducting expenses arising from the sale (Tender Offer price), and ¥42,540 million ($379,178 thousand) was recorded as an impairment loss on assets classified as held for sale. As a result of the transaction, GungHo is no longer qualified as an equity method associate in the three month period ended September 30, 2016. The details are described in “(1)GungHo” in “Note 42. Discontinued operations.”
41. Other comprehensive incomeThe table below presents the amount arising during the year, reclassification adjustments to profit or loss and
the income tax effect of each item in other comprehensive income.
For the fiscal year ended March 31, 2016
(Millions of yen)
Amount arising during the year
Reclassification adjustments Before tax effect Income tax effect After tax effect
Items that will not be reclassified to profit or loss Remeasurements of defined benefit plan . . . . . . . . . . . . . . . . . . . . . . . . . . . . . . . . . . . . . . . . ¥ 140 ¥ – ¥ 140 ¥ 202 ¥ 342
Total . . . . . . . . . . . . . . . . . . . . . . . . . . . . . . . . . . . . . . . . . . . . . . . . . . . . . . . . . . . . . . . . . . 140 – 140 202 342Items that may be reclassified subsequently to profit or loss
Available-for-sale financial assets . . . . . . . . . . . . . . . . . . . . . . . . . . . . . . . . . . . . . . . . . . . . . . (32,338) 32,685 347 (5,253) (4,906)Cash flow hedges . . . . . . . . . . . . . . . . . . . . . . . . . . . . . . . . . . . . . . . . . . . . . . . . . . . . . . . . . . (91,449) 59,223 (32,226) 234 (31,992)Exchange differences on translating foreign operations . . . . . . . . . . . . . . . . . . . . . . . . . . . . . (328,860) – (328,860) 39,125 (289,735)
Share of other comprehensive income of associates . . . . . . . . . . . . . . . . . . . . . . . . . . . . . . . . 38,760 (450) 38,310 (10,668) 27,642Total . . . . . . . . . . . . . . . . . . . . . . . . . . . . . . . . . . . . . . . . . . . . . . . . . . . . . . . . . . . . . . . . . . (413,887) 91,458 (322,429) 23,438 (298,991)
Total other comprehensive income . . . . . . . . . . . . . . . . . . . . . . . . . . . . . . . . . . . . . . . . . . . . . . . ¥(413,747) ¥91,458 ¥(322,289) ¥ 23,640 ¥(298,649)
For the fiscal year ended March 31, 2017
(Millions of yen)
Amount arising during the year
Reclassification adjustments Before tax effect Income tax effect After tax effect
Items that will not be reclassified to profit or lossRemeasurements of defined benefit plan . . . . . . . . . . . . . . . . . . . . . . . . . . . . . . . . . . . . . . . . . ¥ 12,227 ¥ – ¥12,227 ¥ (27) ¥12,200
Total . . . . . . . . . . . . . . . . . . . . . . . . . . . . . . . . . . . . . . . . . . . . . . . . . . . . . . . . . . . . . . . . . . 12,227 – 12,227 (27) 12,200Items that may be reclassified subsequently to profit or loss
Available-for-sale financial assets . . . . . . . . . . . . . . . . . . . . . . . . . . . . . . . . . . . . . . . . . . . . . . . 21,204 908 22,112 (16,484) 5,628Cash flow hedges . . . . . . . . . . . . . . . . . . . . . . . . . . . . . . . . . . . . . . . . . . . . . . . . . . . . . . . . . . (32,479) 24,930 (7,549) 95 (7,454)Exchange differences on translating foreign operations . . . . . . . . . . . . . . . . . . . . . . . . . . . . . . (185,792) 175,002 (10,790) (9,710) (20,500)Share of other comprehensive income of associates. . . . . . . . . . . . . . . . . . . . . . . . . . . . . . . . . (41,130) 190 (40,940) 10,537 (30,403)
Total . . . . . . . . . . . . . . . . . . . . . . . . . . . . . . . . . . . . . . . . . . . . . . . . . . . . . . . . . . . . . . . . . . (238,197) 201,030 (37,167) (15,562) (52,729)Total other comprehensive income . . . . . . . . . . . . . . . . . . . . . . . . . . . . . . . . . . . . . . . . . . . . . . . ¥(225,970) ¥201,030 ¥(24,940) ¥(15,589) ¥(40,529)
SoftBank Group Corp. ANNUAL REPORT 2017 170Trajectory of
the Information RevolutionBringing the Future Forward
EssentialInformation
Management Organization
Financial Section
Corporate Information
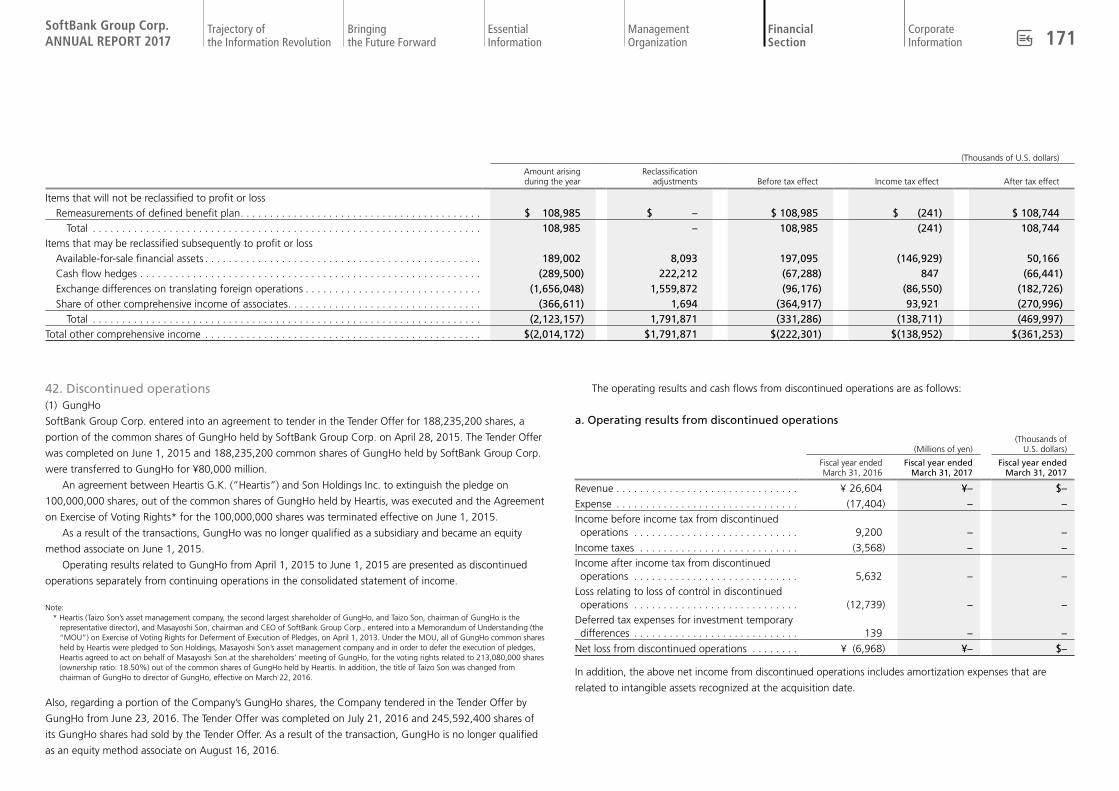
(Thousands of U.S. dollars)
Amount arising during the year
Reclassification adjustments Before tax effect Income tax effect After tax effect
Items that will not be reclassified to profit or lossRemeasurements of defined benefit plan . . . . . . . . . . . . . . . . . . . . . . . . . . . . . . . . . . . . . . . . . $ 108,985 $ – $ 108,985 $ (241) $ 108,744
Total . . . . . . . . . . . . . . . . . . . . . . . . . . . . . . . . . . . . . . . . . . . . . . . . . . . . . . . . . . . . . . . . . . 108,985 – 108,985 (241) 108,744Items that may be reclassified subsequently to profit or loss
Available-for-sale financial assets . . . . . . . . . . . . . . . . . . . . . . . . . . . . . . . . . . . . . . . . . . . . . . . 189,002 8,093 197,095 (146,929) 50,166Cash flow hedges . . . . . . . . . . . . . . . . . . . . . . . . . . . . . . . . . . . . . . . . . . . . . . . . . . . . . . . . . . (289,500) 222,212 (67,288) 847 (66,441)Exchange differences on translating foreign operations . . . . . . . . . . . . . . . . . . . . . . . . . . . . . . (1,656,048) 1,559,872 (96,176) (86,550) (182,726)Share of other comprehensive income of associates. . . . . . . . . . . . . . . . . . . . . . . . . . . . . . . . . (366,611) 1,694 (364,917) 93,921 (270,996)
Total . . . . . . . . . . . . . . . . . . . . . . . . . . . . . . . . . . . . . . . . . . . . . . . . . . . . . . . . . . . . . . . . . . (2,123,157) 1,791,871 (331,286) (138,711) (469,997)Total other comprehensive income . . . . . . . . . . . . . . . . . . . . . . . . . . . . . . . . . . . . . . . . . . . . . . . $(2,014,172) $1,791,871 $(222,301) $(138,952) $(361,253)
42. Discontinued operations(1) GungHo
SoftBank Group Corp. entered into an agreement to tender in the Tender Offer for 188,235,200 shares, a
portion of the common shares of GungHo held by SoftBank Group Corp. on April 28, 2015. The Tender Offer
was completed on June 1, 2015 and 188,235,200 common shares of GungHo held by SoftBank Group Corp.
were transferred to GungHo for ¥80,000 million.
An agreement between Heartis G.K. (“Heartis”) and Son Holdings Inc. to extinguish the pledge on
100,000,000 shares, out of the common shares of GungHo held by Heartis, was executed and the Agreement
on Exercise of Voting Rights* for the 100,000,000 shares was terminated effective on June 1, 2015.
As a result of the transactions, GungHo was no longer qualified as a subsidiary and became an equity
method associate on June 1, 2015.
Operating results related to GungHo from April 1, 2015 to June 1, 2015 are presented as discontinued
operations separately from continuing operations in the consolidated statement of income.
Note: * Heartis (Taizo Son’s asset management company, the second largest shareholder of GungHo, and Taizo Son, chairman of GungHo is the
representative director), and Masayoshi Son, chairman and CEO of SoftBank Group Corp., entered into a Memorandum of Understanding (the “MOU”) on Exercise of Voting Rights for Deferment of Execution of Pledges, on April 1, 2013. Under the MOU, all of GungHo common shares held by Heartis were pledged to Son Holdings, Masayoshi Son’s asset management company and in order to defer the execution of pledges, Heartis agreed to act on behalf of Masayoshi Son at the shareholders’ meeting of GungHo, for the voting rights related to 213,080,000 shares (ownership ratio: 18.50%) out of the common shares of GungHo held by Heartis. In addition, the title of Taizo Son was changed from chairman of GungHo to director of GungHo, effective on March 22, 2016.
Also, regarding a portion of the Company’s GungHo shares, the Company tendered in the Tender Offer by
GungHo from June 23, 2016. The Tender Offer was completed on July 21, 2016 and 245,592,400 shares of
its GungHo shares had sold by the Tender Offer. As a result of the transaction, GungHo is no longer qualified
as an equity method associate on August 16, 2016.
The operating results and cash flows from discontinued operations are as follows:
a. Operating results from discontinued operations
(Millions of yen)(Thousands of
U.S. dollars)
Fiscal year endedMarch 31, 2016
Fiscal year endedMarch 31, 2017
Fiscal year endedMarch 31, 2017
Revenue . . . . . . . . . . . . . . . . . . . . . . . . . . . . . . . ¥ 26,604 ¥– $–Expense . . . . . . . . . . . . . . . . . . . . . . . . . . . . . . . (17,404) – –Income before income tax from discontinued operations . . . . . . . . . . . . . . . . . . . . . . . . . . . . 9,200 – –
Income taxes . . . . . . . . . . . . . . . . . . . . . . . . . . . (3,568) – –Income after income tax from discontinued operations . . . . . . . . . . . . . . . . . . . . . . . . . . . . 5,632 – –
Loss relating to loss of control in discontinued operations . . . . . . . . . . . . . . . . . . . . . . . . . . . . (12,739) – –
Deferred tax expenses for investment temporary differences . . . . . . . . . . . . . . . . . . . . . . . . . . . . 139 – –
Net loss from discontinued operations . . . . . . . . ¥ (6,968) ¥– $–
In addition, the above net income from discontinued operations includes amortization expenses that are
related to intangible assets recognized at the acquisition date.
SoftBank Group Corp. ANNUAL REPORT 2017 171Trajectory of
the Information RevolutionBringing the Future Forward
EssentialInformation
Management Organization
Financial Section
Corporate Information

b. Cash flows from discontinued operations
(Millions of yen)(Thousands of
U.S. dollars)
Fiscal year endedMarch 31, 2016
Fiscal year endedMarch 31, 2017
Fiscal year endedMarch 31, 2017
Net cash provided by operating activities . . . . . . ¥16,051 ¥– $–Net cash used in investing activities . . . . . . . . . . (735) – –Net cash used in financing activities . . . . . . . . . . (86) – –
Total . . . . . . . . . . . . . . . . . . . . . . . . . . . . . . . . ¥15,230 ¥– $–
(2) Supercell
The Company entered into a definitive agreement with Tencent Holdings Limited and its affiliate (the “Tencent
affiliate”), Supercell and other parties on June 21, 2016 to sell all of its shares of Supercell to the Tencent
affiliate. The shares were transferred on July 29, 2016, and as of the date of transfer of the shares, Supercell
was excluded from the scope of consolidation.
Operating results related to Supercell for the fiscal year ended March 31, 2016 and 2017, are presented
separately from continuing operations, as discontinued operations, in the consolidated statements of income.
The operating results and cash flows from discontinued operations are as follows:
a. Operating results from discontinued operations
(Millions of yen)(Thousands of
U.S. dollars)
Fiscal year endedMarch 31, 2016
Fiscal year endedMarch 31, 2017
Fiscal year endedMarch 31, 2017
Revenue . . . . . . . . . . . . . . . . . . . . . . . . . . . . . . . ¥271,772 ¥ 80,735 $ 719,627Expense . . . . . . . . . . . . . . . . . . . . . . . . . . . . . . . (185,169) (46,075) (410,687)Income before income tax from discontinued operations . . . . . . . . . . . . . . . . . . . . . . . . . . . . 86,603 34,660 308,940
Income taxes . . . . . . . . . . . . . . . . . . . . . . . . . . . (17,878) (6,414) (57,171)Income after income tax from discontinued operations . . . . . . . . . . . . . . . . . . . . . . . . . . . . 68,725 28,246 251,769
Gain on sales of discontinued operations . . . . . . – 636,216 5,670,880Income taxes recognized from sales of discontinued operations . . . . . . . . . . . . . . . . . . – (109,663) (977,476)
Net income from discontinued operations . . . . . ¥ 68,725 ¥554,799 $4,945,173
In addition, the above net income from discontinued operations includes amortization expenses that are
related to intangible assets recognized at the acquisition date.
b. Cash flows from discontinued operations
(Millions of yen)(Thousands of
U.S. dollars)
Fiscal year endedMarch 31, 2016
Fiscal year endedMarch 31, 2017
Fiscal year endedMarch 31, 2017
Net cash provided by operating activities . . . . . . ¥107,071 ¥44,065 $392,771Net cash provided by (used in) investing activities 17,055 (166) (1,480)Net cash used in financing activities . . . . . . . . . . (32,578) (17,557) (156,493)
Total . . . . . . . . . . . . . . . . . . . . . . . . . . . . . . . . ¥ 91,548 ¥26,342 $234,798
43. Earnings per shareBasic earnings per share and diluted earnings per share are as follows:
(1) Basic earnings per share
(Millions of yen)(Thousands of
U.S. dollars)
Fiscal year endedMarch 31, 2016
Fiscal year endedMarch 31, 2017
Fiscal year endedMarch 31, 2017
Net income used in the calculation of basic earnings per share
Net income attributable to owners of the parentContinuing operations . . . . . . . . . . . . . . . . . . ¥435,957 ¥ 877,902 $ 7,825,136
Net income attributable to owners of the parentDiscontinued operations . . . . . . . . . . . . . . . . . 38,215 548,406 4,888,190
Total . . . . . . . . . . . . . . . . . . . . . . . . . . . . . . ¥474,172 ¥1,426,308 $12,713,326
(Thousands of shares)
Weighted-average number of ordinary shares . . . 1,178,098 1,108,237
(Yen) (USD)
Basic earnings per shareContinuing operations . . . . . . . . . . . . . . . . . . ¥370.05 ¥ 792.16 $ 7.06Discontinued operations . . . . . . . . . . . . . . . . . 32.44 494.85 4.41
Total . . . . . . . . . . . . . . . . . . . . . . . . . . . . . . ¥402.49 ¥1,287.01 $11.47
SoftBank Group Corp. ANNUAL REPORT 2017 172Trajectory of
the Information RevolutionBringing the Future Forward
EssentialInformation
Management Organization
Financial Section
Corporate Information
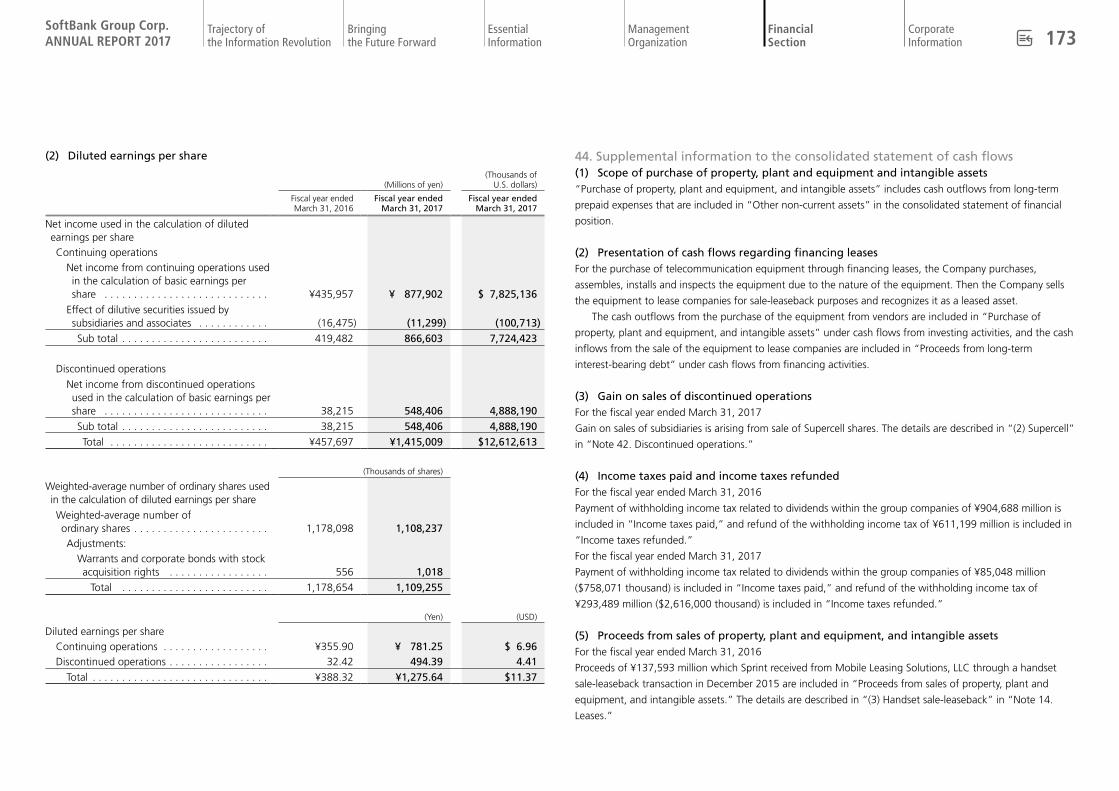
(2) Diluted earnings per share
(Millions of yen)(Thousands of
U.S. dollars)
Fiscal year endedMarch 31, 2016
Fiscal year endedMarch 31, 2017
Fiscal year endedMarch 31, 2017
Net income used in the calculation of diluted earnings per shareContinuing operations
Net income from continuing operations used in the calculation of basic earnings per share . . . . . . . . . . . . . . . . . . . . . . . . . . . . ¥435,957 ¥ 877,902 $ 7,825,136
Effect of dilutive securities issued by subsidiaries and associates . . . . . . . . . . . . (16,475) (11,299) (100,713)Sub total . . . . . . . . . . . . . . . . . . . . . . . . . 419,482 866,603 7,724,423
Discontinued operations
Net income from discontinued operations used in the calculation of basic earnings per share . . . . . . . . . . . . . . . . . . . . . . . . . . . . 38,215 548,406 4,888,190Sub total . . . . . . . . . . . . . . . . . . . . . . . . . 38,215 548,406 4,888,190 Total . . . . . . . . . . . . . . . . . . . . . . . . . . . ¥457,697 ¥1,415,009 $12,612,613
(Thousands of shares)
Weighted-average number of ordinary shares used in the calculation of diluted earnings per share
Weighted-average number of ordinary shares . . . . . . . . . . . . . . . . . . . . . . . 1,178,098 1,108,237Adjustments:
Warrants and corporate bonds with stock acquisition rights . . . . . . . . . . . . . . . . . 556 1,018 Total . . . . . . . . . . . . . . . . . . . . . . . . . 1,178,654 1,109,255
(Yen) (USD)
Diluted earnings per shareContinuing operations . . . . . . . . . . . . . . . . . . ¥355.90 ¥ 781.25 $ 6.96Discontinued operations . . . . . . . . . . . . . . . . . 32.42 494.39 4.41
Total . . . . . . . . . . . . . . . . . . . . . . . . . . . . . . ¥388.32 ¥1,275.64 $11.37
44. Supplemental information to the consolidated statement of cash flows(1) Scope of purchase of property, plant and equipment and intangible assets“Purchase of property, plant and equipment, and intangible assets” includes cash outflows from long-term
prepaid expenses that are included in “Other non-current assets” in the consolidated statement of financial
position.
(2) Presentation of cash flows regarding financing leasesFor the purchase of telecommunication equipment through financing leases, the Company purchases,
assembles, installs and inspects the equipment due to the nature of the equipment. Then the Company sells
the equipment to lease companies for sale-leaseback purposes and recognizes it as a leased asset.
The cash outflows from the purchase of the equipment from vendors are included in “Purchase of
property, plant and equipment, and intangible assets” under cash flows from investing activities, and the cash
inflows from the sale of the equipment to lease companies are included in “Proceeds from long-term
interest-bearing debt” under cash flows from financing activities.
(3) Gain on sales of discontinued operationsFor the fiscal year ended March 31, 2017
Gain on sales of subsidiaries is arising from sale of Supercell shares. The details are described in “(2) Supercell”
in “Note 42. Discontinued operations.”
(4) Income taxes paid and income taxes refundedFor the fiscal year ended March 31, 2016
Payment of withholding income tax related to dividends within the group companies of ¥904,688 million is
included in “Income taxes paid,” and refund of the withholding income tax of ¥611,199 million is included in
“Income taxes refunded.”
For the fiscal year ended March 31, 2017
Payment of withholding income tax related to dividends within the group companies of ¥85,048 million
($758,071 thousand) is included in “Income taxes paid,” and refund of the withholding income tax of
¥293,489 million ($2,616,000 thousand) is included in “Income taxes refunded.”
(5) Proceeds from sales of property, plant and equipment, and intangible assetsFor the fiscal year ended March 31, 2016
Proceeds of ¥137,593 million which Sprint received from Mobile Leasing Solutions, LLC through a handset
sale-leaseback transaction in December 2015 are included in “Proceeds from sales of property, plant and
equipment, and intangible assets.” The details are described in “(3) Handset sale-leaseback” in “Note 14.
Leases.”
SoftBank Group Corp. ANNUAL REPORT 2017 173Trajectory of
the Information RevolutionBringing the Future Forward
EssentialInformation
Management Organization
Financial Section
Corporate Information

(6) Proceeds from sales and redemption of investments For the fiscal year ended March 31, 2017
Proceeds related to sales of Alibaba shares of ¥359,704 million ($3.4 billion) are included. The details are
described in “Note 37. Gain on sales of shares of associates.”
(7) Decrease and increase from loss of control over subsidiariesFor the fiscal year ended March 31, 2016
Decrease from loss of control over subsidiaries is the amount of cash and cash equivalents held by GungHo at
the time of loss of control.
For the fiscal year ended March 31, 2017
The relation between proceeds received for sale of Supercell shares and increase from loss of control over
subsidiaries and components of assets and liabilities at the date of loss of control over Supercell are as
follows:
a. The relation between proceeds received for sale of Supercell shares and increase from loss of control over
subsidiaries
(Millions of yen)
(Thousand of U.S. dollars)
Proceeds received for sale . . . . . . . . . . . . . . . . . . . . . . . . . . . . . ¥769,844 $6,861,966The amount of receivables for sale . . . . . . . . . . . . . . . . . . . . . . (19,693) (175,533)Cash and cash equivalents held at the time of loss of control . . (27,143) (241,938)Effect of exchange rate changes from the date of loss of control* . . . . . . . . . . . . . . . . . . . . . . . . . . . . . . . . . . . . . . . (884) (7,879)
Increase from loss of control over subsidiaries . . . . . . . . . . . . . . ¥722,124 $6,436,616
Note:* Effect of exchange rate changes from the date of loss of control to the date of payment on the amount of receivable for sale as
of the date of loss of control.
b. The components of assets and liabilities as of the date of loss of control
(Millions of yen)(Thousand of
U.S. dollars)
At the date of loss of control
(July 29, 2016)
At the date of loss of control
(July 29, 2016)
The components of assets:Current assets . . . . . . . . . . . . . . . . . . . . . . . . . . . . . . . . . . . ¥125,523 $1,118,843Game titles . . . . . . . . . . . . . . . . . . . . . . . . . . . . . . . . . . . . . 47,636 424,601Goodwill . . . . . . . . . . . . . . . . . . . . . . . . . . . . . . . . . . . . . . . 84,487 753,071Other non-current assets . . . . . . . . . . . . . . . . . . . . . . . . . . . 6,077 54,167
The components of liabilities:Deferred revenue (current) . . . . . . . . . . . . . . . . . . . . . . . . . . 96,919 863,883Other current liabilities . . . . . . . . . . . . . . . . . . . . . . . . . . . . 5,593 49,853Non-current liabilities . . . . . . . . . . . . . . . . . . . . . . . . . . . . . ¥ 23,778 $ 211,944
(8) Payments for purchase of subsidiaries’ interests from non-controlling interestsFor the fiscal year ended March 31, 2016
“Payments for purchase of subsidiaries’ interests from non-controlling interests” is mainly due to the
additional purchase of shares of Supercell and Sprint from existing shareholders.
(9) Significant non-cash transactionsSignificant non-cash investing and financing activities are as follows:
(Millions of yen)(Thousands of
U.S. dollars)
Fiscal year endedMarch 31, 2016
Fiscal year endedMarch 31, 2017
Fiscal year endedMarch 31, 2017
Transfer of leased devices from inventories to property, plant and equipment . . . . . . . . . . . . . ¥389,480 ¥317,180 $2,827,168
Embedded derivative included in a variable prepaid forward contract* . . . . . . . . . . . . . . . . – 95,587 852,010
Note:* The details are described in “(2) Transaction for sales of Alibaba shares by variable prepaid forward contract” in “Note 19. Interest-bearing
debt.”
In addition to the above, ASKUL Corporation has become a subsidiary of the Company for the fiscal year
ended March 31, 2016 and the transaction related to this business combination is classified as a non-cash
transaction because it was conducted by ASKUL Corporation’s acquisition of its own treasury stock. The
details are described in “Note 5. Business combinations.”
SoftBank Group Corp. ANNUAL REPORT 2017 174Trajectory of
the Information RevolutionBringing the Future Forward
EssentialInformation
Management Organization
Financial Section
Corporate Information
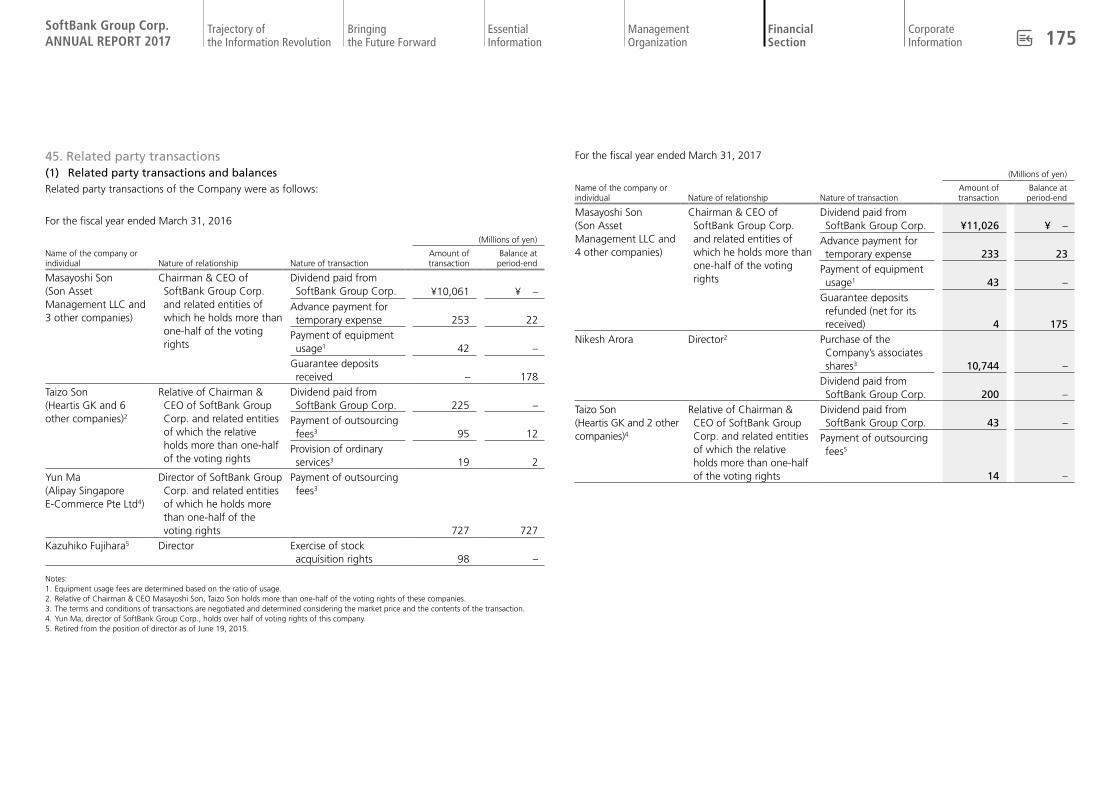
45. Related party transactions(1) Related party transactions and balancesRelated party transactions of the Company were as follows:
For the fiscal year ended March 31, 2016
(Millions of yen)
Name of the company or individual Nature of relationship Nature of transaction
Amount of transaction
Balance at period-end
Masayoshi Son (Son Asset Management LLC and 3 other companies)
Chairman & CEO of SoftBank Group Corp. and related entities of which he holds more than one-half of the voting rights
Dividend paid from SoftBank Group Corp. ¥10,061 ¥ –
Advance payment for temporary expense 253 22
Payment of equipment usage1 42 –
Guarantee deposits received – 178
Taizo Son(Heartis GK and 6 other companies)2
Relative of Chairman & CEO of SoftBank Group Corp. and related entities of which the relative holds more than one-half of the voting rights
Dividend paid from SoftBank Group Corp. 225 –
Payment of outsourcing fees3 95 12
Provision of ordinary services3 19 2
Yun Ma (Alipay Singapore E-Commerce Pte Ltd4)
Director of SoftBank Group Corp. and related entities of which he holds more than one-half of the voting rights
Payment of outsourcing fees3
727 727Kazuhiko Fujihara5 Director Exercise of stock
acquisition rights 98 –
Notes: 1. Equipment usage fees are determined based on the ratio of usage.2. Relative of Chairman & CEO Masayoshi Son, Taizo Son holds more than one-half of the voting rights of these companies.3. The terms and conditions of transactions are negotiated and determined considering the market price and the contents of the transaction. 4. Yun Ma, director of SoftBank Group Corp., holds over half of voting rights of this company. 5. Retired from the position of director as of June 19, 2015.
For the fiscal year ended March 31, 2017
(Millions of yen)
Name of the company or individual Nature of relationship Nature of transaction
Amount of transaction
Balance at period-end
Masayoshi Son (Son Asset Management LLC and 4 other companies)
Chairman & CEO of SoftBank Group Corp. and related entities of which he holds more than one-half of the voting rights
Dividend paid from SoftBank Group Corp. ¥11,026 ¥ –
Advance payment for temporary expense 233 23
Payment of equipment usage1 43 –
Guarantee deposits refunded (net for its received) 4 175
Nikesh Arora Director2 Purchase of the Company’s associates shares3 10,744 –
Dividend paid from SoftBank Group Corp. 200 –
Taizo Son(Heartis GK and 2 other companies)4
Relative of Chairman & CEO of SoftBank Group Corp. and related entities of which the relative holds more than one-half of the voting rights
Dividend paid from SoftBank Group Corp. 43 –
Payment of outsourcing fees5
14 –
SoftBank Group Corp. ANNUAL REPORT 2017 175Trajectory of
the Information RevolutionBringing the Future Forward
EssentialInformation
Management Organization
Financial Section
Corporate Information

(Thousands of U.S. dollars)
Name of the company or individual Nature of relationship Nature of transaction
Amount of transaction
Balance at period-end
Masayoshi Son (Son Asset Management LLC and 4 other companies)
Chairman & CEO of SoftBank Group Corp. and related entities of which he holds more than one-half of the voting rights
Dividend paid from SoftBank Group Corp. $98,280 $ –
Advance payment for temporary expense 2,077 205
Payment of equipment usage1 383 –
Guarantee deposits refunded (net for its received) 36 1,560
Nikesh Arora Director2 Purchase of the Company’s associates shares3 95,766 –
Dividend paid from SoftBank Group Corp. 1,783 –
Taizo Son(Heartis GK and 2 other companies)4
Relative of Chairman & CEO of SoftBank Group Corp. and related entities of which the relative holds more than one-half of the voting rights
Dividend paid from SoftBank Group Corp. 383 –
Payment of outsourcing fees5
125 –
Notes: 1. Equipment usage fees are determined based on the ratio of usage.2. Retired from the position of Representative Director, President&COO as of June 22, 2016.3. At the time of retirement of the officer, the Company purchased the shares of associate companies which were granted to him in December
2014. Purchase price by the Company was determined based on negotiation with reference to the recent transaction price.4. Relative of Chairman & CEO Masayoshi Son, Taizo Son holds over half of the voting rights of these companies.5. The terms and conditions of transactions are negotiated and determined considering the market price and the contents of the transaction.
(2) Remuneration for major executives Remuneration for major executives is as follows:
(Millions of yen)(Thousands of
U.S. dollars)
Fiscal year endedMarch 31, 2016
Fiscal year endedMarch 31, 2017
Fiscal year endedMarch 31, 2017
Short-term benefits . . . . . . . . . . . . . . . . . . . . . . . ¥ 7,038 ¥ 2,093 $ 18,656Share-based payments . . . . . . . . . . . . . . . . . . . . 5,821 4,860 43,319Expenses resulting from the resignation of director . . . . . . . . . . . . . . . . . . . . . . . . . . . . . . . – 8,847 78,857
Retirement benefits . . . . . . . . . . . . . . . . . . . . . . . 4 9 81Total . . . . . . . . . . . . . . . . . . . . . . . . . . . . . . . . ¥12,863 ¥15,809 $140,913
Notes: 1. Remuneration for major executives represents remuneration for the directors of SoftBank Group Corp. (including external directors) and the
directors at the significant subsidiaries. Marcelo Claure, CEO of Sprint, and Simon Segars, CEO of Arm, are the directors at the significant subsidiaries. Simon Segars became the director at the significant subsidiaries because the Company had completed to acquire 100% of ownership of Arm on September 5, 2016.
2. The amount of remuneration to Nikesh Arora, which is included in the table above is as follows: For the fiscal year ended March 31, 2016: ¥8,042 million (Short-term benefits of ¥5,375 million and share-based compensation of ¥2,667 million) For the fiscal year ended March 31, 2017: ¥10,346 million ($92,219 thousand) (Short-term benefits of ¥303 million ($2,701 thousand), share-based compensation of ¥1,196 million ($10,660 thousand), and resignation
expense of ¥8,847 million ($78,857 thousand)) Nikesh Arora retired from the position of director of SoftBank Group Corp. at the closing of the Annual General Meeting of Shareholders
held on June 22, 2016. Resignation expenses consist of expenses in which payment amounts are defined and expenses in which payment amounts are to be defined
depending on the future share price of SoftBank Group Corp. shares. Expenses based on the share price will be settled in two installments, scheduled on June 2017 and March 2018. Payment amount will be determined based on the share price of June 2017 and March 2018. The Company measured the expenses based on the SoftBank Group Corp. share price as of June 30, 2016, and recorded the entire expenses for the three-month period ended June 30, 2016. The expenses will be remeasured every quarter end based on the stock price of SoftBank Group Corp. until the determination of payment amount, and the changes will be recognized through profit and loss. The expenses were ¥3,830 million ($34,139 thousand) for the fiscal year ended March 31, 2017.
In addition to the above resignation expenses, the Company purchased the shares of associate companies from Nikesh Arora, which were previously granted to him in December 2014. The details are described in ”(1) Related party transactions and balances.”
46. Contingency(1) Lending commitments The details of lending commitments, which are mainly related to cashing service incidental to the credit card
business, are as follows:
(Millions of yen)(Thousands of
U.S. dollars)
As ofMarch 31, 2016
As ofMarch 31, 2017
As ofMarch 31, 2017
Lending commitments . . . . . . . . . . . . . . . . . . . . ¥196,937 ¥313,688 $2,796,042Funded . . . . . . . . . . . . . . . . . . . . . . . . . . . . . . . . 9,355 13,967 124,494Unfunded . . . . . . . . . . . . . . . . . . . . . . . . . . . . . . ¥187,582 ¥299,721 $2,671,548
Also, maturities of unfunded lending commitments are within 1 year because they are payable on demand.
(2) Credit guaranteesGuarantees that the Company provides when loans are taken from affiliate financial institutions to individuals
regarding the credit guarantee business are as follows:
(Millions of yen)(Thousands of
U.S. dollars)
As ofMarch 31, 2016
As ofMarch 31, 2017
As ofMarch 31, 2017
Total amount of financial guarantee contract . . . ¥13,822 ¥16,632 $148,249Guarantee balance . . . . . . . . . . . . . . . . . . . . . . . 10,418 12,997 115,848
Also, maturities of guarantee balance for credit guarantee are within 1 year because they are payable on
demand.
SoftBank Group Corp. ANNUAL REPORT 2017 176Trajectory of
the Information RevolutionBringing the Future Forward
EssentialInformation
Management Organization
Financial Section
Corporate Information

(3) LitigationSoftBank Group Corp. and certain subsidiaries are currently party to a number of pending legal and
administrative proceedings. As it is difficult to reasonably estimate the final results of such matters, reserves
have not been recorded. Based on the information currently available, we do not expect that the results of
these proceedings will have a material adverse effect on our financial position or results of operations.
a. Litigation in which SoftBank Corp. is involved as a party
(a) On April 30, 2015, SoftBank Corp. filed a lawsuit with the Tokyo District Court against Japan Post
Information Technology Co., Ltd. (“JPiT”), claiming for payment of remuneration, etc., for additional
services provided in connection with the installation of telecommunication lines, etc., that were
ordered by JPiT in relation to a project to migrate the communication network connecting approxi-
mately 27,000 sites (postal offices, etc.) existing countrywide to a new network, the 5th PNET.
Pursuant to a contract dated February 7, 2013, SoftBank Corp. was requested by JPiT to carry
out, among other services, installation services for telecommunication lines for Japan Post Group’s
business sites existing countrywide. SoftBank Corp. performed such services, and upon JPiT’s
request, SoftBank Corp. also performed services that exceeded the scope of services stipulated in
the contract.
Although SoftBank Corp. negotiated with JPiT over an extended period regarding the remu-
neration, etc. (approximately ¥14.9 billion), for these additional services, SoftBank Corp. and JPiT
were unable to arrive at a settlement. Accordingly, SoftBank Corp. duly filed the lawsuit, claiming
for payment of remuneration, etc., for such additional services.
(b) On April 30, 2015, JPiT filed a lawsuit against SoftBank Corp. and Nomura Research Institute, Ltd.
(“NRI”) as co-defendants.
In this lawsuit, JPiT alleges that SoftBank Corp. and NRI delayed performance, etc., of the
ordered services related to the project for migration to the 5th PNET mentioned in (a) above, and
alleges that such delay caused damages to JPiT (¥16.15 billion). JPiT made joint and several claims
against both SoftBank Corp. and NRI for such alleged damages.
SoftBank Corp. intends to fully contest JPiT’s claims in this lawsuit.
The order to consolidate lawsuit (b) above with lawsuit (a) above was made on July 29, 2015.
SoftBank Corp. modified the amount of claim from approximately ¥14.9 billion to approximately
¥20.4 billion on November 13, 2015, and also modified the amount of claim from approximately
¥20.4 billion to approximately ¥22.3 billion on October 12, 2016, as a result of a review of the
remuneration etc. with respect to additional services regarding the lawsuit (a) above.
b. Legal and administrative proceedings to which Sprint and its subsidiaries are party
(a) In March 2009, a stockholder brought suit, Bennett v. Sprint Nextel Corp., in the U.S. District Court
for the District of Kansas (the “Bennett case”), alleging that Sprint Communications and three of
its former officers violated Section 10(b) of the Exchange Act and Rule 10b-5 by failing to
adequately disclose certain alleged operational difficulties subsequent to the Sprint-Nextel merger,
and by purportedly issuing false and misleading statements regarding the write-down of goodwill.
The district court granted final approval of a settlement in August 2015, which did not have a
material impact on our financial statements. Five stockholder derivative suits related to the Bennett
case were filed against Sprint Communications and certain present and/or former officers and
directors. The first, Murphy v. Forsee, was filed in state court in Kansas on April 8, 2009, was
moved to federal court, and was stayed by the court pending resolution of the motion to dismiss
the Bennett case; the second, Randolph v. Forsee, filed on July 15, 2010, in the state court in
Kansas, was moved to federal court, and was remanded back to state court; the third, Ross-
Williams v. Bennett, et al., was filed in state court in Kansas on February 1, 2011; the fourth, Price
v. Forsee, et al., was filed in state court in Kansas on April 15, 2011; and the fifth, Hartleib v.
Forsee, et. al., was filed in federal court in Kansas on July 14, 2011. These cases were essentially
stayed while the Bennett case was pending, and Sprint has reached an agreement in principle to
settle the matters, by agreeing to some governance provisions and by paying plaintiffs' attorneys
fees in an immaterial amount. The court approved the settlement, but reduced the plaintiff's
attorneys fees; the attorneys fees issue is on appeal.
(b) On April 19, 2012, the New York Attorney General filed a complaint alleging that Sprint
Communications had fraudulently failed to collect and pay more than $100 million in New York
sales taxes on receipts from its sale of wireless telephone services since July 2005. The complaint
also seeks recovery of triple damages under the State False Claims Act, as well as penalties and
interest. Sprint Communications moved to dismiss the complaint on June 14, 2012. On July 1,
2013, the court entered an order denying the motion to dismiss in large part, although it did
dismiss certain counts or parts of certain counts. Sprint Communications appealed that order and
the intermediate appellate court affirmed the order of the trial court. On October 20, 2015, the
Court of Appeals of New York affirmed the decision of the appellate court that the tax statute
requires Sprint Communications to collect and remit the disputed taxes. Sprint Communications’
petition for certiorari to the US Supreme Court on grounds of federal preemption was denied.
Through the year ended March 31, 2017, Sprint Communications accrued approximately $200
million in association with this matter. The parties are now engaged in discovery in the trial court.
Sprint Communications will continue to defend this matter vigorously.
Eight related stockholder derivative suits have been filed against Sprint Communications and
certain current and former officers and directors. Each suit alleges generally that the individual
defendants breached their fiduciary duties to Sprint Communications and its stockholders by
allegedly permitting, and failing to disclose, the actions alleged in the suit filed by the New York
Attorney General. One suit, filed by the Louisiana Municipal Police Employees Retirement System,
was dismissed by a federal court. Two suits were filed in state court in Johnson County, Kansas,
and one of those suits was dismissed as premature and five suits are pending in federal court in
Kansas. The remaining Kansas suits have been stayed pending resolution of the New York Attorney
SoftBank Group Corp. ANNUAL REPORT 2017 177Trajectory of
the Information RevolutionBringing the Future Forward
EssentialInformation
Management Organization
Financial Section
Corporate Information
General's suit.
(c) Sprint Communications is also a defendant in a complaint filed by several stockholders of Clearwire
Corporation asserting claims for breach of fiduciary duty by Sprint Communications and related
claims and otherwise challenging the Clearwire acquisition. ACP Master, LTD., et al. v. Sprint Nextel
Corp., et al., was filed on April 26, 2013, in Chancery Court in Delaware. Plaintiffs in the ACP
Master, LTD. suit have also filed suit requesting an appraisal of the fair value of their Clearwire
stock. A trial related to those cases took place in October 2016 and November 2016; the parties
have submitted their post-trial briefing, and oral argument was held on April 25, 2017. Sprint
Communications, Inc. is awaiting a decision on such cases.
(d) Sprint is currently involved in numerous court actions alleging that Sprint is infringing various
patents. Most of these cases effectively seek only monetary damages. A small number of these
cases are brought by companies that sell products and seek injunctive relief as well. These cases
have progressed to various degrees and a small number may go to trial if they are not otherwise
resolved. Adverse resolution of these cases could require Sprint to pay significant damages, cease
certain activities, or cease selling the relevant products and services. In many circumstances, Sprint
would be indemnified for monetary losses that it incurs with respect to the actions of its suppliers
or service providers.
(e) In October 2013, the FCC Enforcement Bureau began to issue notices of apparent liability (“NALs”)
to other Lifeline providers, imposing fines for intracarrier duplicate accounts identified by the
government during its audit function. Those audits also identified a small percentage of potentially
duplicative intracarrier accounts related to Sprint’s Assurance Wireless business. No NAL has yet
been issued with respect to Sprint, and Sprint does not know if one will be issued.
Further, Sprint is not able to reasonably estimate the amount of any claim for penalties that
might be asserted.
(f) Various other suits, inquiries, proceedings, and claims, either asserted or unasserted, including
purported class actions typical for a large business enterprise and intellectual property matters, are
possible or pending against Sprint or its subsidiaries. During the year ended March 31, 2017, Sprint
recorded a $103 million charge associated with a state tax matter. If Sprint’s interpretation of
certain laws or regulations, including those related to various federal or state matters, such as sales,
use or property taxes, or other charges, were found to be mistaken, it could result in payments by
Sprint.
c. Legal and administrative proceedings to which Brightstar Corp. and its subsidiaries are party
Brightstar Corp. and its subsidiaries are party to various legal and administrative proceedings globally
and particularly in Latin American countries, including disputes relating to tax, labor, contract, and
other currently pending matters. This litigation mainly consists of five administrative proceedings
initiated by tax authorities in Brazil against the subsidiary of Brightstar Corp. involving failure by such
entity to pay a portion of taxes owed due to, e.g., differences in understanding between such entity
and the tax authorities, for which such authorities have claimed an aggregate of $120 million. One of
these five administrative proceedings has been filed; however, a subsidiary of Brightstar Corp. has filed
an Annulment Action in October 2015 requesting that the case be returned to the administrative level.
47. Purchase commitments(1) Conditional commitments on investment in WorldVu Satellites Limited (“OneWeb”) and
Intelsat S.A. (“Intelsat”) and a conditional service purchase commitment with OneWebThe Company had investments of $0.68 billion and $1.73 billion in OneWeb and Intelsat, respectively, as of
March 31, 2017. Such investments are intended to support the construction of satellite communication
systems and operations to provide affordable, high-speed, low-latency Internet to rural and remote communi-
ties around the world.
In accordance with a share purchase agreement between the Company and OneWeb with a total
investment amount of $1 billion, the Company invested $0.32 billion in the fiscal year ended March 31, 2017,
and further invested $0.15 billion in April 2017. With respect to the remaining conditional investment
commitment of $0.53 billion, the Company will invest such amount upon OneWeb obtaining certain
financing and approvals from relevant regulatory authorities.
The total investment of $1.73 billion in Intelsat was subject to the consummation of the merger between
OneWeb and Intelsat (the “Merger”) and the receipt of approvals from relevant regulatory authorities. As
Intelsat was unable to reach an agreement with certain existing Intelsat bondholders on the terms of
proposed debt exchange offers, which was a condition to the Merger, the Company’s conditional investment
commitment in Intelsat terminated and, consequently, the Company will no longer be investing in Intelsat.
In addition, the Company has a conditional purchase commitment of $4 billion for satellite communica-
tion service capacity to the OneWeb group as of March 31, 2017. The minimum payment of $4 billion is
subject to OneWeb achieving certain service levels, which are set forth in two stages and include, among
other things, the positioning of a particular number of satellites on prescribed orbital planes in operation. An
initial payment of $0.5 billion will be made within 12 months of OneWeb completing the first service level,
and the remaining $3.5 billion will be paid within 48 months of OneWeb completing the second service level.
(2) Commitment to acquire Fortress Investment Group LLC (“Fortress”)The Company will acquire 100% of the outstanding shares of Fortress for approximately $3.3 billion. The
closing of the acquisition is subject to the satisfaction of customary conditions, such as certain regulatory
approvals. The Company is planning to bring in partners for a portion of the investment following the closing
of this acquisition.
With regard to the acquisition above, on June 12, 2017, the Company entered into a new credit
agreement in relation to a 5 year $1.4 billion term loan facility and 4.5 year $90 million revolving facility with
financial institutions. The shares of Fortress and the shares of subsidiaries (a holding company) that will hold
the shares of Fortress will be pledged as collateral of the new credit agreement.
SoftBank Group Corp. ANNUAL REPORT 2017 178Trajectory of
the Information RevolutionBringing the Future Forward
EssentialInformation
Management Organization
Financial Section
Corporate Information
(3) OtherExcept for the above (1) and (2), the Company had commitments to purchase services and goods of
¥1,613,695 million ($14,383,590 thousand) as of March 31, 2017 (March 31, 2016: ¥1,496,500 million).
Purchase commitments are mainly outstanding contracts related to purchases of telecommunications
equipment, purchases of mobile handsets, connection with other telecommunications operators, and
investments.
48. Subsequent events(1) Investment in Xiaoju Kuaizhi Inc. (“Kuaizhi”)An overseas subsidiary of SoftBank Group Corp. made a total investment of $5.0 billion in Kuaizhi, the
operator of a taxi allocation service in China, as of May 26, 2017. Kuaizhi is not classified as a subsidiary or an
associate of the Company after the investment.
The impact of this agreement on the operating results as of March 31, 2018, has not been determined at
present.
(2) SoftBank Vision Fund’s First Major ClosingSoftBank Vision Fund (the “Fund”) established by an overseas subsidiary of the Company completed its first
major closing on May 20, 2017 with $93.2 billion of committed capital (“Initial Closing”). In addition to
SoftBank Group Corp., the investors in the Fund (the “Limited Partners”) also include the Public Investment
Fund of the Kingdom of Saudi Arabia, the Mubadala Investment Company of the United Arab Emirates,
Apple, Foxconn Technology Group, Qualcomm Incorporated, and Sharp Corporation or their respective
affiliates. The final closing of the Fund is expected to occur no later than six months following the Initial
Closing. Under the Initial Closing, SoftBank Group Corp. has committed a maximum of $28 billion of capital,
which includes the In-kind Contribution (defined below), and the other Limited Partners have committed a
maximum aggregate amount of $65.2 billion of capital for the Fund.
a. Summary of the Fund
The arrival of the Singularity, the point at which Artificial Intelligence (AI) exceeds human intelligence,
will redefine every industry, and is expected to greatly expand existing business opportunities and to
create new ones. The Fund has been established to firmly grasp these business opportunities. The Fund
will invest mainly in companies that have superior technologies or business models, and are expected
to experience strong growth.
The Company will pursue maximizing returns in the Fund, while maintaining its own sustainable
growth, as an investor in the Fund for a minimum of twelve years’ duration.
An overseas subsidiary of the Company will manage the Fund as its general partner, and it will be
advised by another overseas subsidiary in the U.K. following that entity’s registration with the UK
Financial Conduct Authority, (the “Investment Management Company”). The investment decisions of
the Fund will be made based on the decisions of the Investment Committee, which is expected to be
established at the Investment Management Company, and since the Company has control as stipulated
in IFRS 10 “Consolidated Financial Statements” over the Fund through these subsidiaries, the Fund will
be consolidated by the Company.
Therefore, the results of operations, assets and liabilities of the Fund will be included in the
Company’s consolidated financial statements. The portfolio companies that the Company is deemed to
control under IFRS are treated as subsidiaries of the Company and their results of operations, assets
and liabilities are included in the consolidated financial statements of the Company. In principle, other
investments in the Fund are measured at fair value at the end of each quarter, and the change is
recognized in profit or loss.
b. Transfer of the partial shares of Arm
The Company will contribute approximately 24.99% of the total number of issued shares of Arm (the
“Arm Shares”) to the Fund, by an in-kind contribution (the “In-kind Contribution”) in satisfaction of
approximately US $8.2 billion of the Company’s US $28 billion commitment to the Fund.
When the Fund draws down a portion of its committed capital from its Limited Partners (a “Capital
Call”), the Company will be obligated to contribute a portion of the Arm Shares with a value equiva-
lent to the amount of the Capital Call issued to the Company. After (and to the extent that) the
aggregate amount of Capital Call issued to the Company exceeds approximately $8.2 billion, the
aggregate value of the In-kind Contribution, the Company will contribute cash in satisfaction of Capital
Calls. The In-kind Contribution will be effected through the transfer of Arm shares to the Fund, subject
to the satisfaction of preconditions related to regulatory approvals prescribed in the Fund documents.
Such conditions include clearance from the Committee on Foreign Investments in the United States in
respect of the transfer of the Arm Shares. Pending delivery of the Arm Shares to the Fund following
satisfaction of such conditions, a relevant portion of the Arm Shares will be pledged in favor of the
Fund.
After the completion of the In-kind Contribution of Arm Shares, Arm will continue to be a
consolidated subsidiary of the Company.
c. Impact on the Consolidated Financial Results
The impact from the Transactions on the consolidated financial results for the fiscal year ending March
31, 2018 has not yet been determined.
49. Approval of consolidated financial statementsThe consolidated financial statements have been approved by the Company’s CEO, Masayoshi Son, as of June
21, 2017.
SoftBank Group Corp. ANNUAL REPORT 2017 179Trajectory of
the Information RevolutionBringing the Future Forward
EssentialInformation
Management Organization
Financial Section
Corporate Information