The Fracture Energy of Bimaterial Interfaces of Fracture/Final paper...The Fracture Energy of...
12
Materials"Science and Engineering, A126 (1990) 53-64 53 The Fracture Energy of Bimaterial Interfaces A. G. EVANS, M. ROHLE, B. J. DALGLEISH and R G. CHARALAMBIDES Materials Department, College of Engineering, University of California, Santa Barbara, CA 93106 (U.S.A.) (Received April 21, 1989) Abstract This article describes a framework applicable to the measurement and interpretation of the fracture energy of bimaterial interfaces. A major conclusion of this study is that the fracture energy F i is non- unique and usually exhibits values substantially larger than the thermodynamic "work of adhe- sion". The non-uniqueness is related to the mode mixity (shear and opening) effects experienced by interface cracks, as characterized by the phase angle ~p of loading; typically, F i is found to increase as ~p increases. These trends are attributed to crack shielding caused by roughness of the interface frac- ture surface, to material non-linearity etc. The phase angle is, in turn, influenced by the choice of test specimen, resulting in values of F i that differ between specimens in a manner attributed to the locus of F i with ~p. Preliminary models that relate Fi to roughness, plasticity, segregation etc. are described, leading to insights concerning micro- structural aspects" of "weak" and "strong" inter- faces. 1. Introduction The fracture energy F i of interfaces between dissimilar materials exerts a critical influence on many problems of technological importance, particularly the mechanical properties of com- posites [1-3] and the decohesion of films and coatings [3-7], as well as the strength of bonds [8, 9]. The specific role of the fracture energy is first outlined for several of these problems, as needed to provide a conceptual framework for studies of F i. Subject to this background and with the adop- tion of a practicable mechanics formulation for characterizing interface cracks, methods for measuring F i on bimaterial systems of interest are described. Experimental measurements and observations of interface fractures are presented, as well as atomistic, chemical and microstructural features of typical interfaces. Preliminary attempts are then made to relate Fi to the salient characteristics of interfaces, using the appropriate models. The conceptual framework for addressing the interface fracture energy derives from notions already established for interpreting the fracture energy of brittle solids [10, 11]. The most basic contribution to Fi, which often leverages all others, is the work Wad of adhesion and the effect on that quantity of segregants at the interface, as given by [10] F0 = W,,j-- 2 (Ag~ °- Ag~°)c~ (1) i where ci is the concentration of segregant per unit area of interface and Ag o is the Gibbs free energy of segregation. The subscript i refers to the interface and s to the free surface. For a planar interface in a system having constituents with linear constitutive characteristics [11] F i = ~F~I (2) where ~ is a quantity (14 ~-< 10) which charac- terizes the non-equilibrium thermodynamic state of the surface created by fracture. Non-linearity of either constituent, and non-planarity of the interface introduces other multiplicative contri- butions to F~, based on crack shielding and dissi- pation. The roughness related shielding is manifest in a parameter [12] EH 2 z = (3) L F0 where H is the amplitude of roughness, L the wavelength of roughness and E is Young's modu- lus. Plasticity occurring in one of the bonded layers can cause plastic dissipation, governed by a 0921-5093/90/$3.50 © Elsevier Sequoia/Printed in The Netherlands
Transcript of The Fracture Energy of Bimaterial Interfaces of Fracture/Final paper...The Fracture Energy of...
Materials" Science and Engineering, A126 (1990) 53-64 53
The Fracture Energy of Bimaterial Interfaces
A. G. EVANS, M. ROHLE, B. J. DALGLEISH and R G. CHARALAMBIDES
Materials Department, College of Engineering, University of California, Santa Barbara, CA 93106 (U.S.A.)
(Received April 21, 1989)
Abstract
This article describes a framework applicable to the measurement and interpretation of the fracture energy of bimaterial interfaces. A major conclusion of this study is that the fracture energy F i is non- unique and usually exhibits values substantially larger than the thermodynamic "work of adhe- sion". The non-uniqueness is related to the mode mixity (shear and opening) effects experienced by interface cracks, as characterized by the phase angle ~p of loading; typically, F i is found to increase as ~p increases. These trends are attributed to crack shielding caused by roughness of the interface frac- ture surface, to material non-linearity etc. The phase angle is, in turn, influenced by the choice of test specimen, resulting in values of F i that differ between specimens in a manner attributed to the locus of F i with ~p. Preliminary models that relate Fi to roughness, plasticity, segregation etc. are described, leading to insights concerning micro- structural aspects" of "weak" and "strong" inter- faces.
1. Introduction
The fracture energy F i of interfaces between dissimilar materials exerts a critical influence on many problems of technological importance, particularly the mechanical properties of com- posites [1-3] and the decohesion of films and coatings [3-7], as well as the strength of bonds [8, 9]. The specific role of the fracture energy is first outlined for several of these problems, as needed to provide a conceptual framework for studies of F i. Subject to this background and with the adop- tion of a practicable mechanics formulation for characterizing interface cracks, methods for measuring F i on bimaterial systems of interest are described. Experimental measurements and observations of interface fractures are presented,
as well as atomistic, chemical and microstructural features of typical interfaces. Preliminary attempts are then made to relate Fi to the salient characteristics of interfaces, using the appropriate models.
The conceptual framework for addressing the interface fracture energy derives from notions already established for interpreting the fracture energy of brittle solids [10, 11]. The most basic contribution to Fi, which often leverages all others, is the work Wad of adhesion and the effect on that quantity of segregants at the interface, as given by [10]
F0 = W,,j -- 2 (Ag~ ° - Ag~°)c~ (1) i
where c i is the concentration of segregant per unit area of interface and Ag o is the Gibbs free energy of segregation. The subscript i refers to the interface and s to the free surface. For a planar interface in a system having constituents with linear constitutive characteristics [11]
F i = ~F~I (2)
where ~ is a quantity (14 ~-< 10) which charac- terizes the non-equilibrium thermodynamic state of the surface created by fracture. Non-linearity of either constituent, and non-planarity of the interface introduces other multiplicative contri- butions to F~, based on crack shielding and dissi- pation. The roughness related shielding is manifest in a parameter [12]
EH 2 z = (3 )
L F0
where H is the amplitude of roughness, L the wavelength of roughness and E is Young's modu- lus. Plasticity occurring in one of the bonded layers can cause plastic dissipation, governed by a
0921-5093/90/$3.50 © Elsevier Sequoia/Printed in The Netherlands
54
non-dimensional parameter [13, 14]
EF0 = y2 h (4)
where Y is the yield strength and h the thickness of the ductile layer. The plastic dissipation is multiplicative with F 0 provided that the materials involved have viscoplastic properties that allow a strong singularity to be retained at the crack tip [10, 15]. Otherwise, the crack tip blunts and there is no energy release through the crack tip, result- ing in a mechanism of interface fracture that may be insensitive to Wad.
The measured fracture energy thus typically incorporates several contributions, each of which must be evaluated and understood in order to control the mechanical behavior of interfaces in composites, coatings, bonds etc. The intent of the present article is to provide an assessment of the present status of this topic.
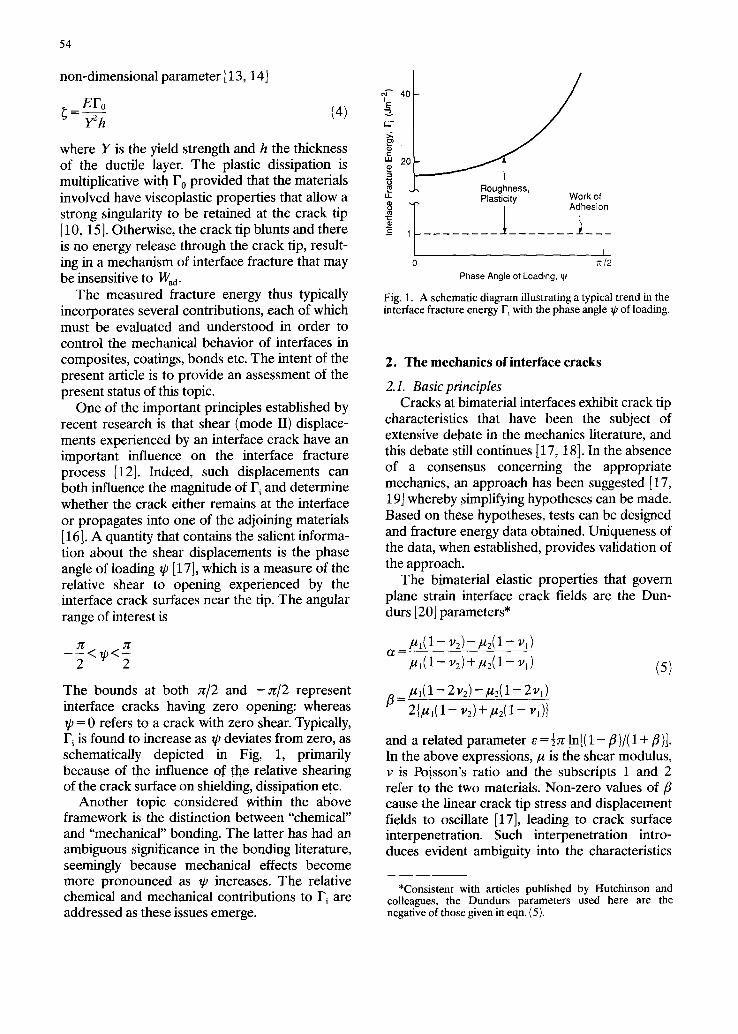
One of the important principles established by recent research is that shear (mode II) displace- ments experienced by an interface crack have an important influence on the interface fracture process [12]. Indeed, such displacements can both influence the magnitude of F i and determine whether the crack either remains at the interface or propagates into one of the adjoining materials [16]. A quantity that contains the salient informa- tion about the shear displacements is the phase angle of loading ~0 [17], which is a measure of the relative shear to opening experienced by the interface crack surfaces near the tip. The angular range of interest is
Yg YC
2 W<2
The bounds at both z~/2 and - : r / 2 represent interface cracks having zero opening: whereas
= 0 refers to a crack with zero shear. Typically, Fi is found to increase as ~p deviates from zero, as schematically depicted in Fig, 1, primarily because of the influence of the relative shearing of the crack surface on shielding, dissipation etc.
Another topic considered within the above framework is the distinction between "chemical" and "mechanical" bonding. The latter has had an ambiguous significance in the bonding literature, seemingly because mechanical effects become more pronounced as ~0 increases. The relative chemical and mechanical contributions to F i a r e
addressed as these issues emerge.
E
g klJ
ID
40
20
Roughness, Plasticity Work of
t Adhesion . . . . . . . .
I 0 r~/2
Phase Angle of Loading, II/
Fig. 1. A schematic diagram illustrating a typical trend in the interface fracture energy F i with the phase angle ~p of loading.
2. The mechanics of interface cracks
2. I. Basic principles Cracks at bimaterial interfaces exhibit crack tip
characteristics that have been the subject of extensive debate in the mechanics literature, and this debate still continues [17, 18]. In the absence of a consensus concerning the appropriate mechanics, an approach has been suggested [17, 19] whereby simplifying hypotheses can be made. Based on these hypotheses, tests can be designed and fracture energy data obtained. Uniqueness of the data, when established, provides validation of the approach.
The bimaterial elastic properties that govern plane strain interface crack fields are the Dun- durs [20] parameters*
~ = /AI(1 -- 'y2) --/.~2( 1 -- '111)
,UI(1-- V2)+/~2(1-- V 1)
p,(1 - 2v2)-pa(1 - 2Vl)
2 { / . £ 1 ( 1 - '1.,2)-[-/A2( 1 -- I.'1) }
(5)
and a related parameter e = ½zr !n[( 1 -/3)/( 1 +/3 )]. In the above expressions,/~ is the shear modulus, v is Poisson's ratio and the subscripts 1 and 2 refer to the two materials. Non-zero values of fl cause the linear crack tip stress and displacement fields to oscillate [17], leading to crack surface interpenetration. Such interpenetration intro- duces evident ambiguity into the characteristics
*Consistent with articles published by Hutchinson and colleagues, the Dundurs parameters used here are the negative of those given in eqn. (5).
J /
-0.1 . . . . .
• Ti, Zr, Hf, V, Nb • Ta, Cr, Mo, W
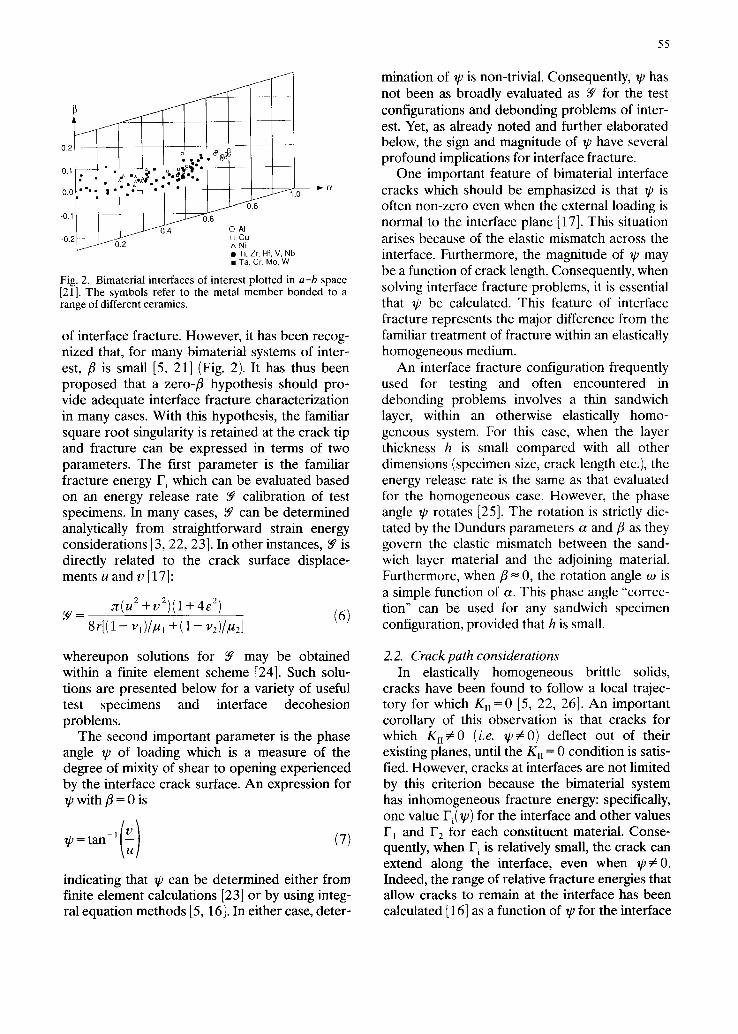
Fig. 2. Bimaterial interfaces of interest plotted in a-b space [21]. The symbols refer to the metal member bonded to a range of different ceramics.
of interface fracture. However, it has been recog- nized that, for many bimaterial systems of inter- est, fl is small [5, 21] (Fig. 2). It has thus been proposed that a zero-fl hypothesis should pro- vide adequate interface fracture characterization in many cases. With this hypothesis, the familiar square root singularity is retained at the crack tip and fracture can be expressed in terms of two parameters. The first parameter is the familiar fracture energy F i which can be evaluated based on an energy release rate Y calibration of test specimens. In many cases, Y can be determined analytically from straightforward strain energy considerations [3, 22, 23]. In other instances, Y is directly related to the crack surface displace- ments u and v [17]:
y r ( u 2 + v 2 ) ( l + 4 e 2) = ( 6 )
8r[( 1 - v, )//U 1 +(1 -- 'IJe)//U2]
whereupon solutions for ~ may be obtained within a finite element scheme [24]. Such solu- tions are presented below for a variety of useful test specimens and interface decohesion problems.
The second important parameter is the phase angle ~p of loading which is a measure of the degree of mixity of shear to opening experienced by the interface crack surface. An expression for
with fl = 0 is
indicating that ~0 can be determined either from finite element calculations [23] or by using integ- ral equation methods [5, 16]. In either case, deter-
55
mination of ~p is non-trivial. Consequently, ~p has not been as broadly evaluated as Y for the test configurations and debonding problems of inter- est. Yet, as already noted and further elaborated below, the sign and magnitude of ~p have several profound implications for interface fracture.
One important feature of bimaterial interface cracks which should be emphasized is that ~p is often non-zero even when the external loading is normal to the interface plane [17]. This situation arises because of the elastic mismatch across the interface. Furthermore, the magnitude of ~p may be a function of crack length. Consequently, when solving interface fracture problems, it is essential that ~p be calculated. This feature of interface fracture represents the major difference from the familiar treatment of fracture within an elastically homogeneous medium.
An interface fracture configuration frequently used for testing and often encountered in debonding problems involves a thin sandwich layer, within an otherwise elastically homo- geneous system. For this case, when the layer thickness h is small compared with all other dimensions (specimen size, crack length etc.), the energy release rate is the same as that evaluated for the homogeneous case. However, the phase angle ~p rotates [25]. The rotation is strictly dic- tated by the Dundurs parameters a and fl as they govern the elastic mismatch between the sand- wich layer material and the adjoining material. Furthermore, when fl = 0, the rotation angle w is a simple function of a. This phase angle "correc- tion" can be used for any sandwich specimen configuration, provided that h is small.
2. 2. Crack path considerations In elastically homogeneous brittle solids,
cracks have been found to follow a local trajec- tory for which K n = 0 [5, 22, 26]. An important corollary of this observation is that cracks for which K I I ¢ 0 (i.e. ~p#0) deflect out of their existing planes, until the Kn = 0 condition is satis- fied. However, cracks at interfaces are not limited by this criterion because the bimaterial system has inhomogeneous fracture energy: specifically, one value Fi( /p) for the interface and other values F~ and F 2 for each constituent material. Conse- quently, when F i is relatively small, the crack can extend along the interface, even when ~p# 0. Indeed, the range of relative fracture energies that allow cracks to remain at the interface has been calculated [16] as a function of ~p for the interface
56
1.2
L:- 1.0
0.8 . .c
0.6 0
I'--
2 0.4
n" 0 . 2
I -K" I UJJJJJJ JJJJJJJJJl- ,nte,ace
' ~ Substrate Cracking ~ = - 0.5
Cracking
0 I I 7t14 ~/2
(a) Phase Angle of Loading, ~i
~l/i<O IKI r F >> r S
I " K i l l = ] '" ~ ."k ;N-'~ ''~- Interface
~/~'- 11 i~ ~ ~ "4nterface
~ - 0 . 4 " ~ / / / " .~ Interface Crack ing
-~ 0.2 n -
{ { { { { -/t /8 0 ~/8 ~/4 3/t/2 /1:/2 (b) Phase Angle of Loading, ~i
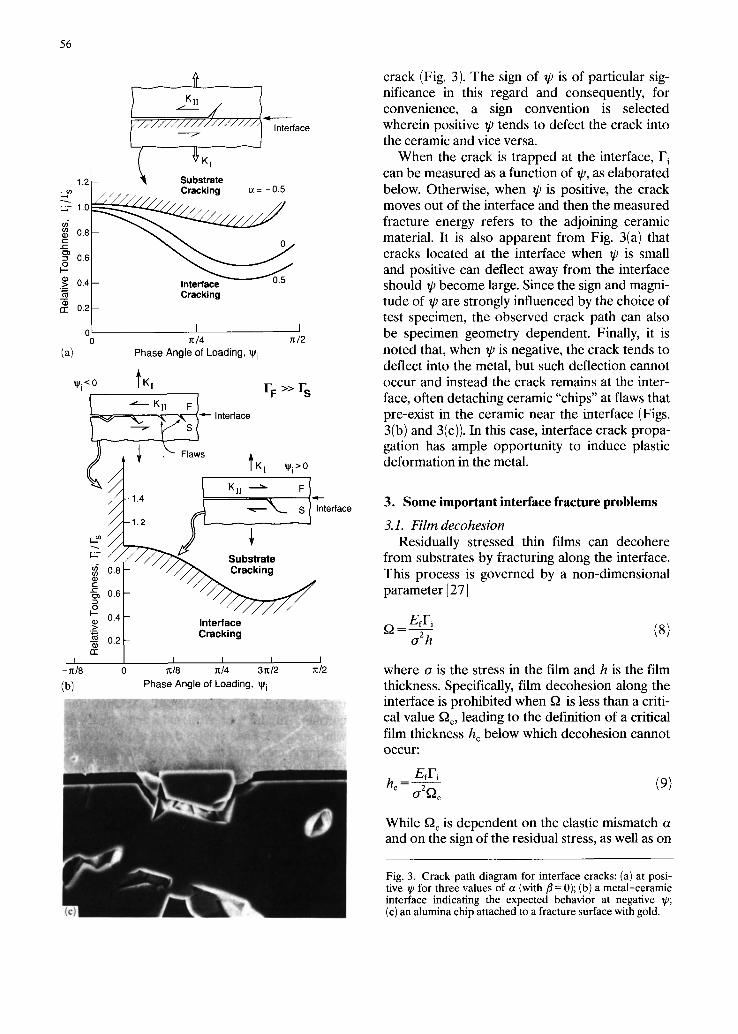
crack (Fig. 3). The sign of V is of particular sig- nificance in this regard and consequently, for convenience, a sign convention is selected wherein positive V tends to defect the crack into the ceramic and vice versa.
When the crack is trapped at the interface, F~ can be measured as a function of V, as elaborated below. Otherwise, when ~p is positive, the crack moves out of the interface and then the measured fracture energy refers to the adjoining ceramic material. It is also apparent from Fig. 3(a) that cracks located at the interface when V is small and positive can deflect away from the interface should V become large. Since the sign and magni- tude of V are strongly influenced by the choice of test specimen, the observed crack path can also be specimen geometry dependent. Finally, it is noted that, when V is negative, the crack tends to deflect into the metal, but such deflection cannot occur and instead the crack remains at the inter- face, often detaching ceramic "chips" at flaws that pre-exist in the ceramic near the interface (Figs. 3(b) and 3(c)). In this case, interface crack propa- gation has ample opportunity to induce plastic deformation in the metal.
3. Some important interface fracture problems
3.1. Film decohesion Residually stressed thin films can decohere
from substrates by fracturing along the interface. This process is governed by a non-dimensional parameter [27]
EfFi Q = (8>
where o is the stress in the film and h is the film thickness. Specifically, film decohesion along the interface is prohibited when fl is less than a criti- cal value tic, leading to the definition of a critical film thickness hc below which decohesion cannot OCCUr:
EfFi h~- ty2f~ (9)
While ~c is dependent on the elastic mismatch a and on the sign of the residual stress, as well as on
Fig. 3. Crack path diagram for interface cracks: (a) at posi- tive V for three values of a (with fl = 0); (b) a metal-ceramic interface indicating the expected behavior at negative V; (c) an alumina chip attached to a fracture surface with gold.

2.0
o i . 8
1.6
1.4 E
~ 1 . 2
1.0
-~0.8
0 0.6
.~ 0.4
0 0.2
~ = - 0 . 8
- 0 . 6
0.4
- 0 . 2
0.0
0.2 0.4 0.6 " - - - ' - - ' - - - ' - - 0.8
I I I I I I I I I 7 0.01 0.02 0.03 0.04 0.05 0.06 0.07 0.08 0.09 0.10
Relative Film Thickness, h/H
Fig. 4. Trends in decohesion number for films on a brittle substrate.
the substrate yield strength, its magnitude is typically of the order of unity [27] (Fig. 4).
The importance of the interface fracture energy to decohesion, evident from eqn. (9), is qualified by its dependence on the phase angle W. The sign and magnitude of ~ depend on the sign of the residual stress in the film (tension or com- pression) and the mode of delamination. For films in tension, delamination occurs from edges, holes or splits in the film [4, 5, 27] and, in all cases, ~0 is of the order of 50 ° (for fl = 0). For films in com- pression, edge decohesion occurs with ~p= 90 ° (i.e. a strictly mode II-III process), whereas buckling-induced decohesion occurs for ~p in the range from 0 ° to about 50 °, depending on the interface crack radius [6]. The prediction of the critical film thickness using eqn. (9) thus, in general, requires that F~ be known over a wide range of ~.
3.2. Debonding in brittle matrix composites Fiber reinforcement of brittle matrices (cer-
amics and/or intermetallics) leading to high toughness can only be accomplished if debonding between matrix and fiber occurs at the crack front [1, 2] (Fig. 5(a)). Such debonding requires that t he ratio FJFf, where Ff is the mode I fracture energy of the fiber, be small [16] (less than 0.25 (Fig. 5(b)). Furthermore, the phase angle associated with the debonding process is of the order of 45 ° (Fig. 5b). Consequently, a prerequisite for high toughness in brittle matrix composites is that F~/Ff satisfies the debonding requirement of Fig. 5, with F~ being evaluated at ~p=45 °. Following crack front debonding, further debonding is typically required in the crack wake [1, 28] (Fig. 5(a)). In this case, the extent of debonding is
~ KI
7"' iiii~i ,l",,--Sliding
."./~t ~. - -
Crack ~ Wake ~ Front Debonding Debonding
~5~555 ~
(a)
I 0.5
Interface
ii.o
I -o.5
Elastic Mismatch, oz
57
I 1.0
67.5
c~J
"7
45 ~g
I I I -0.5 0 0.5 1.0
(b) Elastic Mismatch, ot
Fig. 5. (a) A schematic diagram illustrating crack front debonding in fiber-reinforced brittle materials; (b) A crack front debond diagram.
governed by Fi at large values of 73 (-'90°). Furthermore, the specific phase angle needed to address wake debonding is sensitive to the resid- ual strain. Compressive residual strain normal to the interface gives values of ~0- 90 ° and causes stable debonding. Conversely, tensile residual stress encompasses the range - 50 ° < ~p < 70 °. Again, therefore, knowledge of F i over a wide range of phase angles is needed to understand debonding in composites.
58
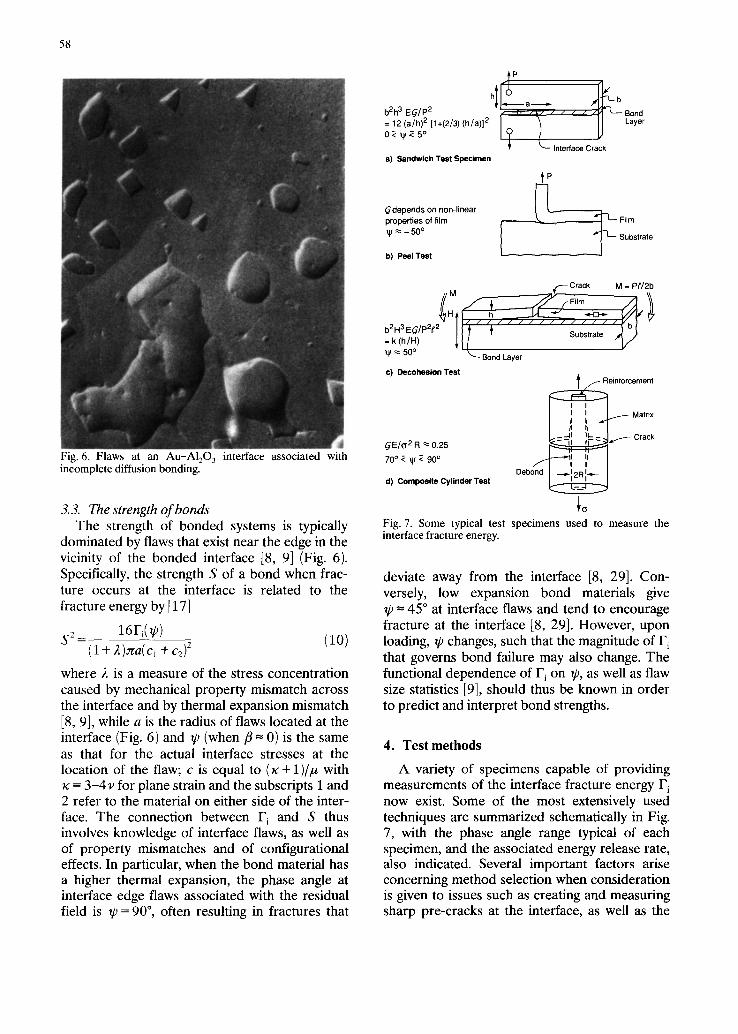
Fig. 6. Flaws at an Au-A120~ interface associated with incomplete diffusion bonding.
3.3. The strength of bonds The strength of bonded systems is typically
dominated by flaws that exist near the edge in the vicinity of the bonded interface [8, 9] (Fig. 6). Specifically, the strength S of a bond when frac- ture occurs at the interface is related to the fracture energy by [17]
$2 _ 16Fi(/p) (1 + 2)~ra(cl + c2) 2 (10)
where ~. is a measure of the stress concentration caused by mechanical property mismatch across the interface and by thermal expansion mismatch [8, 9], while a is the radius of flaws located at the interface (Fig. 6) and ~p (when fl ~ 0) is the same as that for the actual interface stresses at the location of the flaw; c is equal to ( r + 1)//a with ~7 = 3 - 4 v for plane strain and the subscripts 1 and 2 refer to the material on either side of the inter- face. The connection between F i and S thus involves knowledge of interface flaws, as well as of property mismatches and of configurational effects. In particular, when the bond material has a higher thermal expansion, the phase angle at interface edge flaws associated with the residual field is ~p = 90 °, often resulting in fractures that
b2h3 I~(~/P 2 ~ ' . -a ~. / / /
Interface Crack a) Sandwich Test Specimen
~P
Gdepends on non-linear ~ / properties of film ~ i ~ Film
"~ - 50° ~ ' ~ l L-- Substrate ]
b) Peel Test
Crack M = PH2b M Film / ~
. . . . . . soJs.rC.e" = (50 ol
~. k.... Bond Layer
c) Decohesion Test ~ 1 Reinf°rcement
I I I f Ma,.x I I
_ .-II II,- _ . ....-- Crack ~E /o 2 a ~- 0.25 ~ ' - I ! ! r ' ~
70 ° z v ~ 90 ° ~ - - - - ~ l ;; I I oe ond
d) Composite Cylinder Test
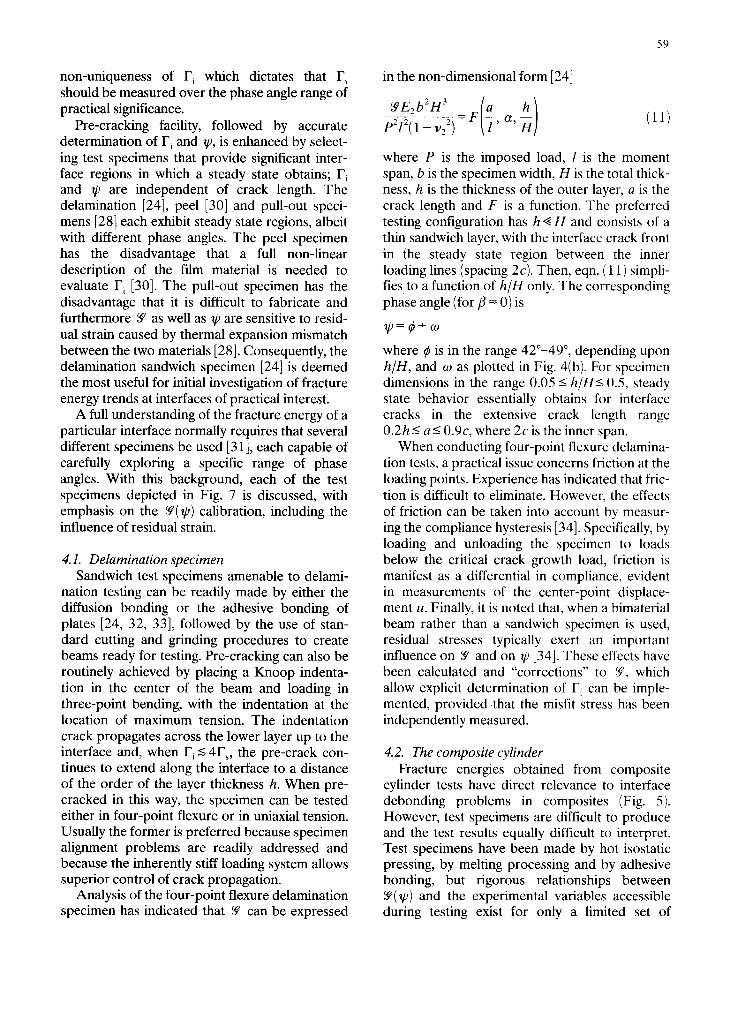
Fig. 7. Some typical test specimens used to measure the interface fracture energy.
deviate away from the interface [8, 29]. Con- versely, low expansion bond materials give ~p = 45 ° at interface flaws and tend to encourage fracture at the interface [8, 29]. However, upon loading, ~0 changes, such that the magnitude of F~ that governs bond failure may also change. The functional dependence of F i on ~p, as well as flaw size statistics [9], should thus be known in order to predict and interpret bond strengths.
4. Test methods
A variety of specimens capable of providing measurements of the interface fracture energy F~ now exist. Some of the most extensively used techniques are summarized schematically in Fig. 7, with the phase angle range typical of each specimen, and the associated energy release rate, also indicated. Several important factors arise concerning method selection when consideration is given to issues such as creating and measuring sharp pre-cracks at the interface, as well as the
non-uniqueness of F i which dictates that F~ should be measured over the phase angle range of practical significance.
Pre-cracking facility, followed by accurate determination of F i and W, is enhanced by select- ing test specimens that provide significant inter- face regions in which a steady state obtains; F~ and 73 are independent of crack length. The delamination [24], peel [30] and pull-out speci- mens [28] each exhibit steady state regions, albeit with different phase angles. The peel specimen has the disadvantage that a full non-linear description of the film material is needed to evaluate F i [30]. The pull-out specimen has the disadvantage that it is difficult to fabricate and furthermore ~¢ as well as Va are sensitive to resid- ual strain caused by thermal expansion mismatch between the two materials [28]. Consequently, the delamination sandwich specimen [24] is deemed the most useful for initial investigation of fracture energy trends at interfaces of practical interest.
A full understanding of the fracture energy of a particular interface normally requires that several different specimens be used [31], each capable of carefully exploring a specific range of phase angles. With this background, each of the test specimens depicted in Fig. 7 is discussed, with emphasis on the Y(Va) calibration, including the influence of residual strain.
4.1. Delamination specimen Sandwich test specimens amenable to delami-
nation testing can be readily made by either the diffusion bonding or the adhesive bonding of plates [24, 32, 33], followed by the use of stan- dard cutting and grinding procedures to create beams ready for testing. Pre-cracking can also be routinely achieved by placing a Knoop indenta- tion in the center of the beam and loading in three-point bending, with the indentation at the location of maximum tension. The indentation crack propagates across the lower layer up to the interface and, when F~ ~ 4Fs, the pre-crack con- tinues to extend along the interface to a distance of the order of the layer thickness h. When pre- cracked in this way, the specimen can be tested either in four-point flexure or in uniaxial tension. Usually the former is preferred because specimen alignment problems are readily addressed and because the inherently stiff loading system allows superior control of crack propagation.
Analysis of the four-point flexure delamination specimen has indicated that ~q can be expressed
59
in the non-dimensional form [24]
,11, p212( 1 - v22)
where P is the imposed load, l is the moment span, b is the specimen width, H is the total thick- ness, h is the thickness of the outer layer, a is the crack length and F is a function. The preferred testing configuration has h ~ H and consists of a thin sandwich layer, with the interface crack front in the steady state region between the inner loading lines (spacing 2c). Then, eqn. ( 11 ) simpli- fies to a function of h/H only. The corresponding phase angle (for fl = 0) is
V,=¢+0~
where ¢ is in the range 420-49 °, depending upon h/H, and o~ as plotted in Fig. 4(b). For specimen dimensions in the range 0.05 -< h/H <- 0.5, steady state behavior essentially obtains for interface cracks in the extensive crack length range 0.2h_< a<_ 0.9c, where 2c is the inner span.
When conducting four-point flexure delamina- tion tests, a practical issue concerns friction at the loading points. Experience has indicated that fric- tion is difficult to eliminate. However, the effects of friction can be taken into account by measur- ing the compliance hysteresis [34]. Specifically, by loading and unloading the specimen to loads below the critical crack growth load, friction is manifest as a differential in compliance, evident in measurements of the center-point displace- ment u. Finally, it is noted that, when a bimaterial beam rather than a sandwich specimen is used, residual stresses typically exert an important influence on ~q and on ~p [34]. These effects have been calculated and "corrections" to ~q, which allow explicit determination of F~ can be imple- mented, provided that the misfit stress has been independently measured.
4.2. The composite cylinder Fracture energies obtained from composite
cylinder tests have direct relevance to interface debonding problems in composites (Fig. 5). However, test specimens are difficult to produce and the test results equally difficult to interpret. Test specimens have been made by hot isostatic pressing, by melting processing and by adhesive bonding, but rigorous relationships between fq(~p) and the experimental variables accessible during testing exist for only a limited set of
60
bimaterial interfaces. Specifically, when the resid- ual stress normal to the interface is tensile [28] and the debond surfaces are sufficiently smooth that the crack surface contact zone is small compared with the debond length d, a steady state debond- ing condition has been identified. Steady state is established when d>-R (the "fiber" radius) such that ~q has the form [28]
Y r 2 (12) EfRe 2 = r l + ~c2z'+ 7¢3
where r = t /Efe, with t being the applied stress on the fiber, e the misfit strain and Ki, i= 1, 2, 3, coefficients that depend on the elastic mismatch a (Table 1 ) and the relative "fiber" volume f. The phase angle of loading is typically large and depends somewhat on a.
4.3. The peel test The peel test has practical utility for thin flexi-
ble films on substrates [30]. For such cases, most of the metal and polymer films of interest undergo non-linear deformation. This defor- mation provides a major contribution to the work done by the steady-state peel force Ps and this work needs to be quantified in order to use Ps to evaluate F i. The magnitude of the plastic dissipa- tion and of the residual strain energy in the film have been calculated, allowing Fi to be deduced, provided that the non-linear constitutive prop-
TABLE 1 Energy release rate parameters for residually stressed composites ( f = 0.2)
a k I k 2 k 3
0.3 0.189 - 0 . 2 8 0 0.152 0.0 0.314 - 0.370 0.200
- 0.3 1.486 - 0.430 0.228
erties of the film material are known. It is also apparent that 7) is negative. The negative sign of the phase angle has the implication that, for ductile-tough films, the debond crack is induced to propagate within the interface rather than to extend into the substrate. Interface debonding is thus observed even when the interface fracture energy F i is well in excess of that for the substrate (see Fig. 3).
The above behavior can be modified when appreciable residual stress pre-exists within the film, especially when the residual force is of the same order as the peel force. Specifically, the residual stress contributes directly to the steady state energy release rate and modifies the phase angle of loading. The energy release rate is enhanced by both tensile and compressive resid- ual stress, but the negative phase angle caused by peeling is reduced by residual tension and enhanced by residual compression.
4.4. Other methods Conventional testing procedures such as com-
pact tension tests (Fig. 7) and bend tests can be used to obtain information about F i a t 7) = 0, if a thin sandwich configuration is adopted [35]. Then, as already noted, Y is the same as that for the elastically homogeneous material and ~p is rotated by to. However, it is emphasized that an effective pre-cracking approach and a method capable of in situ crack length measurements are needed to obtain valid measurements of F i.
5. Fracture energy data
There are relatively few unqualified measure- ments of the fracture energy of bimaterial inter- faces, wherein effects on ~9(~0) of residual stress, friction etc. have been rigorously analyzed. Con-
TABLE 2 Fracture energy ofbimaterial interfaces
Bimaterial pair Phase angle Fi Test method (deg) (J m - 2)
Sil ica-polymer [31 ] 0 5 Double cantilever beam 70 25 Cylinder
A1203-glass [37] 0-1 ° 8 + 1 Bend 50 8 + 1 Delamination
SiC-Si [7] - - 5.5 Thin film buckling Cu-Si [30] - - 5.5 Peel Cu-glass [35] 5 1-10 Double cantilever beam Au-sapph i re (0001 ) [36] 50 20 + 4 Delamination P t - sapphi re (0001 ) [37] 50 40 + 4 Delamination Cu(Cr)-polymide [30] - - 200 + 30 Peel Nb-AI203 - 5 80 5- 30 Notch bend
61
ALLOY SIDE .I. v | , INTERFACE SIDE
HOLE
N U C L E A T I O N
AT
INTERFACE
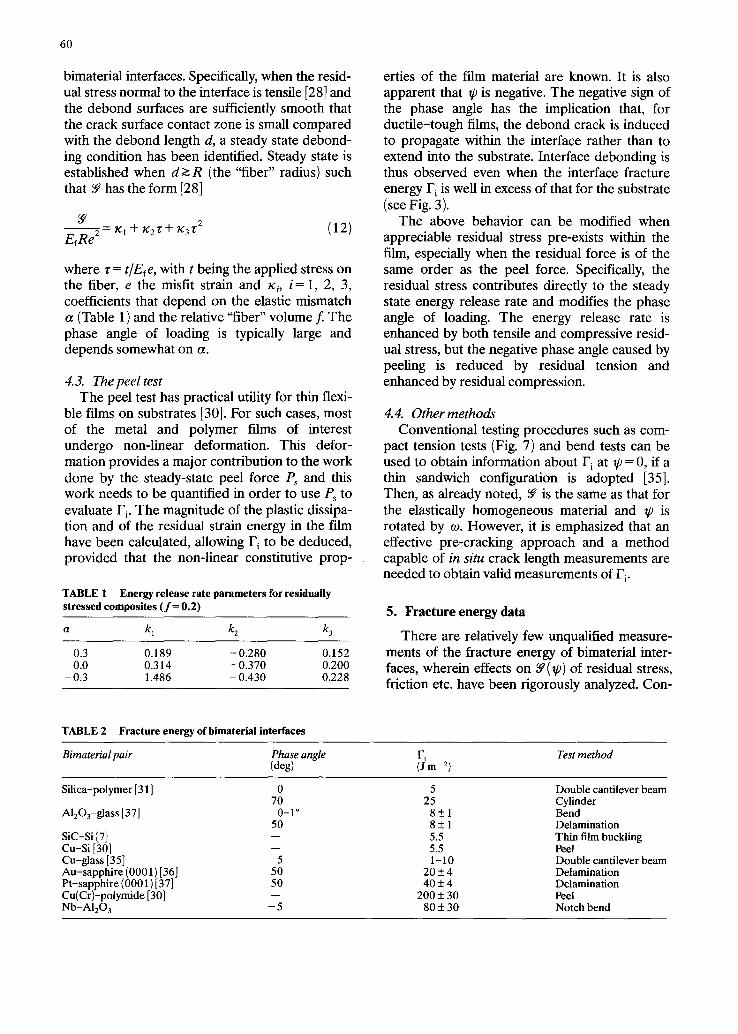
Fig. 8. The fracture behavior of AI-AI203 bonds: (a) fracture in the AI203 near the interface for AI-4at.%Mg alloy; (b) matching fracture surfaces for ductile fracture in the aluminum when "pure" aluminum is used for bonding.
sequently, a general picture of trends in F i with the structure and "microstructure" of the inter- face does not yet exist. Values of F i deemed to be reasonably rigorous are summarized in Table 2. The only material system which has been studied over a considerable range of phase angles is a model "elastic" system con- sisting of glass bonded with polymer [31]. This system exhibits a fracture energy that increases as ~p approaches :r/2. The trend in F~ with ~p has
been tentatively attributed to roughness effects as elaborated in the following section.
Some results obtained for three ductile-brittle bonded systems provide insight regarding the role of plasticity. Specifically, for two systems, Cu-glass [35] and Au-sapphire [36], Fi is large (about 10-20 J m -2 (Table 2)) compared with the work of adhesion and, furthermore, interface fracture involves crack blunting and bridging of the crack surface by ligaments of ductile material
62
(Fig. 8). The latter is indicative of a crack shield- ing contribution to F i. The studies on the latter system also reveal a paradox. Specifically, slip in the metal, evident in the form of slip steps on the crack surface, seemingly causes crack blunting; nevertheless, brittle interface crack extension still occurs.
The third system of interest is AI-AI203. Frac- ture in this system never occurs along the inter- face [32], indicating that F i exceeds the fracture energy of the constituent materials. Instead, frac- ture occurs in the Al203 (Fig. 8(a)) when the yield strength of the aluminum alloy is high and the aluminum layer is thin, resulting in a fracture energy essentially the same as that for AlzO 3. Alternatively, when the aluminum is relatively soft, it fractures by a classic ductile dimple mechanism (Fig. 8(b)). In the latter case, the inter- face nevertheless influences the measured frac- ture energy by acting as sites for hole nucleation (Fig. 8(b)), such that the process may be regarded as a ductile interface fracture process.
Finally, a significant body of knowledge is available on the Nb-Al203 system [33, 38, 39]. For this system, the interface fracture energies have been estimated using sandwich specimens in bending, with a phase angle of about - 5 °. The results, while not rigorously valid, because notches were used rather than pre-cracks, are believed to be of the correct order. The values obtained (Table 2) for sapphire (0001) bonded to single-crystal Nb(110), being in the range 70-110 J m -2, are typically larger than the basal plane fracture energy F i (~ 20 J m -z) of sapphire and much larger than Wad (= 1 J m -2 for this inter- face). Observations of the interface also indicate that it is facetted but that the facet amplitude is small (heights, 2.3-50/k). Plastic flow in the niobium is also found to accompany interface fracture as evident from dislocations observed in the transmission electron microscope. Further-
more , electron backscattering studies in the scanning electron microscope have revealed the existence of bands of plasticity in the niobium on (110).
6. Interface fracture models
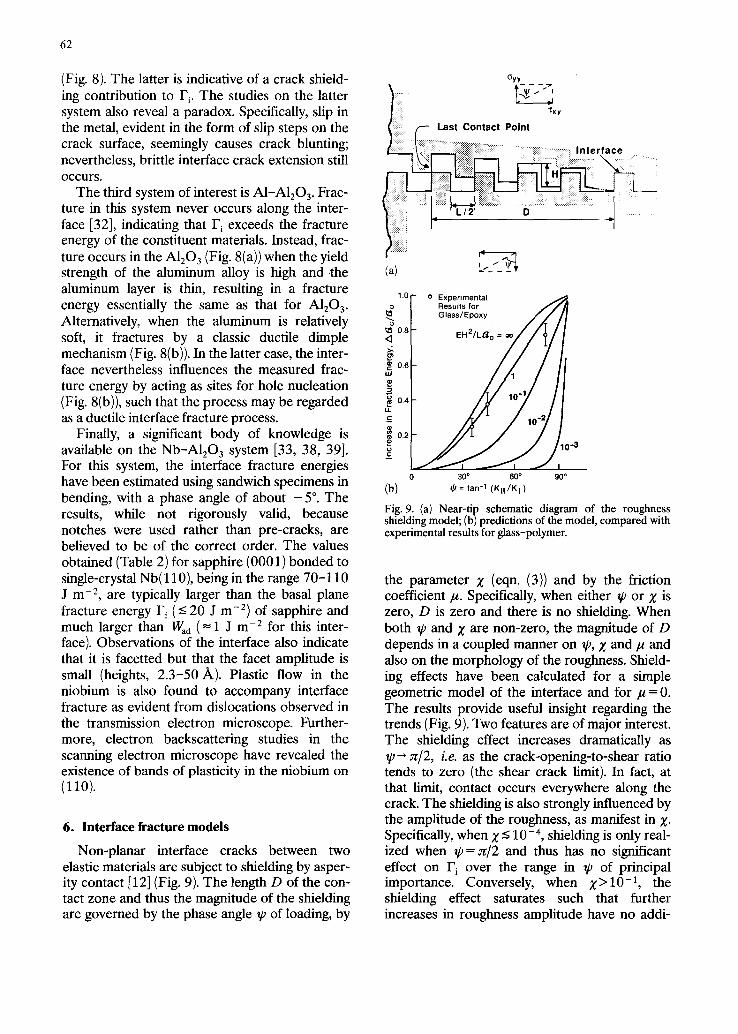
Non-planar interface cracks between two elastic materials are subject to shielding by asper- ity contact [12] (Fig. 9). The length D of the con- tact zone and thus the magnitude of the shielding are governed by the phase angle ~p of loading, by
Oyy
(a)
1.0 r- o Experimental o / Results for / / ' ~
/ / / I °"F '""'°°7//V/
t///J 0.6
i 0 4 -1
/ / , / //,o, 0 30 ° 60 ° 90 °
(b) ~ = tan -1 (KII/KI)
Fig. 9. (a) Near-tip schematic diagram of the roughness shielding model; (b) predictions of the model, compared with experimental results for glass-polymer.
the parameter g (eqn. (3)) and by the friction coefficient kt. Specifically, when either ~p or Z is zero, D is zero and there is no shielding. When both 7) and g are non-zero, the magnitude of D depends in a coupled manner on % Z and kt and also on the morphology of the roughness. Shield- ing effects have been calculated for a simple geometric model of the interface and for kt = 0. The results provide useful insight regarding the trends (Fig. 9). Two features are of major interest. The shielding effect increases dramatically as ~po ~/2, i.e. as the crack-opening-to-shear ratio tends to zero (the shear crack limit). In fact, at that limit, contact occurs everywhere along the crack. The shielding is also strongly influenced by the amplitude of the roughness, as manifest in g. Specifically, when g ~ 10-4, shielding is only real- ized when ~p = :t/2 and thus has no significant effect on F i over the range in ~p of principal importance. Conversely, when Z > I 0 -1, the shielding effect saturates such that further increases in roughness amplitude have no addi-
tional influence o n F i. Roughness-induced shield- ing is a possible source of the trend in F i with ~p measured for the glass-polymer system [31] (Table 2). Finally, it is noted that the fracture energy at ~p = 0 may be regarded as the "chemi- cal" bonding, while the increment in F i as ~p increases can be considered as a "mechanical" contribution.
Plastic deformation of the metal undoubtedly provides a major contribution to F~ for each of the metal-ceramic systems indicated in Table 2. However, adequate models have yet to be devel- oped and await guidance from the mechanics of elastic-plastic interface cracks. Nevertheless, some brief remarks are appropriate. Crack shielding by intact ligaments can be simply modelled [35] based on observations of the plas- tic stretch u of the ligaments and the flow strength Y of the metal, such that the increase in fracture energy is
AFi ~ fYu , (13)
where f is the area fraction of ligaments on the interface fracture surface. However, predictions of the interface conditions that give bridging and of the effects of the interface on the plastic stretch, which would be needed to understand this phenomenon, have yet to be attempted. Nevertheless, it is noted that u, scales with h Y/EF o, giving the non-dimensional parameter expressed in eqn. (4).
Crack blunting by slip is another integral aspect of the effect of plasticity. When blunting occurs, the crack tip stresses reduce to a small multiple of the metal flow stresst. Interface frac- ture then seems to require activation of a brittle crack, whereupon the fracture energy may depend on near-interface flaws, as well as the flow stress of the metal. Finally, attention is drawn to the problem of whether an interface crack either blunts or remains sharp, an issue that relates to the paradox noted above for the A1203-Au interface. The problem involves both stationary cracks which may blunt by dislocation ejection from the crack tip, and dynamic cracks which can remain "sharp" when the viscoplastic properties of the metal exhibit high strain rate sensitivity [10]. Further study of these effects is clearly needed.
tAnalogy with homogeneous metals [40] indicates that the peak stress should be of the order of (3-6) Y.
63
Finally, some brief remarks are made concern- ing the crack path. In particular, reference to the Nb-AI203 system indicates that the crack remains at the interface, even though F~ is more than twice the fracture energy of the sapphire. An interpretation of this behavior is based upon recognition that ~p is negative (~ -5°), because the shear modulus for niobium is much smaller than that for A1203. Such negativity of ~p, as already noted, tends to trap the crack at the inter- face. Plastic deformation is thereby encouraged in the niobium, resulting in the relatively large F~. However, the interface fracture mechanism involving such plasticity is not yet understood.
Another noteworthy feature of the Nb-A1203 system is that Fi is expected to diminish for rapidly moving interface cracks, because of the strong rate sensitivity of plastic flow in niobium [33]. Consequently, Fi may become smaller than the fracture energy of sapphire when the crack becomes unstable, further enforcing the prefer- ence for interface fracture.
7. Concluding remarks
Techniques for measuring the interface frac- ture energy over a wide range of phase angles now exist, as relevant to debonding problems of practical significance. Consequently, it is now possible to conduct a systematic study of trends in the fracture energy for a variety of interfaces and to develop models that relate Fi(~p) to micro- structure. It is already apparent that F i is typically much larger than the work Waa of adhesion, indi- cating that extrinsic contributions to F i must be sought and understood. Two contributions have been identified: roughness-induced shielding and plastic dissipation. The non-dimensional param- eters that govern these effects have been estab- lished and their role in governing F i for different interfaces has been afforded preliminary atten- tion. Other components of F i such as reaction product layers, with associated residual strain and segregation, also remain to be rigorously under- stood.
References
1 A.G. Evans, Mater Sci., Eng., A107 (1989) 227. 2 A. G. Evans, M. Y. He and J. W. Hutchinson, J. Am.
Ceram. Soc., 72 (1989) 2300. 3 K. Kendall, J. Mater. Sci., 11 (1976) 638. 4 M.S. Hu and A. G. Evans, Acta Metall., 37(1989) 917. 5 Z. Suo and J. W. Hutchinson, Mater. Sci. Eng., A107
64
(1989) 135. 6 A. G. Evans and J. W. Hutchinson, Int. J. Solids Struct.,
20 (1984)455. 7 A. S. Argon, V. Gupta, H. S. Landis and J. A. Cornie,
Mater. Sci. Eng., A107 (1989) 41. 8 H. C. Cao, M. D. Thouless and A. G. Evans, Acta Metall.,
36 (1988) 2037. 9 B. J. Dalgleish, M. C. Lu and A. G. Evans, Acta Metall.,
36 (1988)2029. 10 J. R. Rice and J. S. Wang, Mater. Sci. Eng., A107 (1989)
23. 11 R. M. Cannon, R. M. Fisher and A. G. Evans, in R. J.
Nemanich, P. S. Ho and S. S. Lane (eds.), Thin Films-- Interfaces and Phenomena, Materials Research Society Syrup. Proc., Vol. 54, Materials Research Society, Pitts- burgh, PA, 1986, p. 799.
12 A. G. Evans and J. W. Hutchinson, Acta Metall., 37 (1989) 909.
13 P.G. Charalarnbides, unpublished research, 1989. 14 J.W. Hutchinson, unpublished research, 1989. 15 C.Y. Hui and H. Reidel, Int. J. Fraet., 17(1981) 409. 16 M.Y. He and J. W. Hutchinson, J. Appl. Mech., 56 (1989)
270. 17 J.R. Rice, J. Appl. Mech., 55 (1988) 98. 18 M. Comninou and D. Schmueser, J. Appl. Mech., 46
(1979) 345. 19 J. W. Hutchinson, M. E. Mear and J. R. Rice, J. Appl.
Mech., 109(1987) 828. 20 J. Dundurs, Mathematical Theory of Dislocation,
American Society of Mechanical Engineers, New York, 1969, p. 70.
21 T. Suga, Ph.D. Thesis, University of Stuttgart, 1984. 22 M. D. Thouless, A. G. Evans, M. E Ashby and J. W.
Hutchinson, Acta Metall., 35 (1987) 1333.
23 P. G. Charalambides, J. Lund, R. M. McMeeking and A. G. Evans, J. Appl. Mech., 111 (1987) 77.
24 P. Matos, P. G. Charalambides, M. D. Drory and R. M. McMeeking, Int. J. Fract., in the press.
25 Z. Suo and J. W. Hutchinson, Int. J. Fract., in the press. 26 M. S. Hu, M. D. Thouless and A. G. Evans, Acta Metall.,
35 (1988) 1301. 27 A. G. Evans, M. S. Hu and M. D. Drory, J. Mater., 3
(1988) 1043. 28 P. G. Charalambides and A. G. Evans, J. Am. Ceram.
Soc., 72 (1989) 746. 29 A. Bartlett, M. Riihle and A. G. Evans, to be published. 30 K. S. Kim and N. Aravas, Int. J. Solids Struct., 24 (1988)
417. 31 H.C. Cao and A. G. Evans, Mech. Mater., 7(1989) 295. 32 B. J. Dalgleish, K. P. Trumble and A. G. Evans, Acta
Metall., 37(1989) 1923. 33 M. Riihle and A. G. Evans, in E D. Lemkey, S. G.
Fisbman, A. G. Evans and J. R. Strife (eds.), High Temperature/High Performance Composites, Materials Research Society Symp. Proc., Voi. 120, Materials Research Society, Pittsburgh, PA, 1988, p. 293.
34 P. G. Charalambides, H. C. Cao, J. Lund and A. G. Evans, Mech. Mater., 8 (1990) 269.
35 T. S. Oh, J. Rodel, R. M. Cannon and R. O. Ritcbie, Acta Metall., 36 (1988) 2083.
36 I. Reimanis, B. J. Dalgleish, M. Riihle and A. G, Evans, to be published.
37 I. Reimanis and B. J. Dalgleish, unpublished research, 1990.
38 W. Mader and M. Riihle, Acta Metall., 37 (1989) 853. 39 A. G. Evans, M. R/ihle, S. Schmauder and M. C. Lu, Acta
Metall., 34 (1986) 1643. 40 R.M. McMeeking, J. Mech. Phys. Solids, 25 (1977) 357.