The formation of SOA and chemical tracer compounds from ... · The formation of SOA and chemical...
16
Atmos. Chem. Phys., 12, 8711–8726, 2012 www.atmos-chem-phys.net/12/8711/2012/ doi:10.5194/acp-12-8711-2012 © Author(s) 2012. CC Attribution 3.0 License. Atmospheric Chemistry and Physics The formation of SOA and chemical tracer compounds from the photooxidation of naphthalene and its methyl analogs in the presence and absence of nitrogen oxides T. E. Kleindienst 1 , M. Jaoui 2 , M. Lewandowski 1 , J. H. Offenberg 1 , and K. S. Docherty 2 1 National Exposure Research Laboratory, U.S. Environmental Protection Agency, Research Triangle Park, North Carolina 27711, USA 2 Alion Science and Technology, P.O. Box 12313, Research Triangle Park, North Carolina 27709, USA Correspondence to: T. E. Kleindienst ([email protected]) Received: 14 March 2012 – Published in Atmos. Chem. Phys. Discuss.: 11 May 2012 Revised: 5 September 2012 – Accepted: 6 September 2012 – Published: 27 September 2012 Abstract. Laboratory smog chamber experiments have been carried out to investigate secondary organic aerosol (SOA) formation from the photooxidation of naphthalene and its methyl analogs, 1- and 2-methylnaphthalene (1-MN and 2- MN, respectively). Laboratory smog chamber irradiations were conducted in a flow mode to ensure adequate collec- tion of the aerosol at reasonably low reactant concentrations and in the presence and absence of nitrogen oxides. Phthalic acid and methyl analogs were identified following BSTFA derivatization of the aerosol extract. These compounds were examined to determine whether they could serve as rea- sonable molecular tracers to estimate the contributions of these precursors to ambient PM 2.5 . Measurements were also made to determine aerosol parameters from secondary or- ganic aerosol from naphthalene, 1-MN, and 2-MN. A mass fraction approach was used to establish factors which could be applied to phthalic acid concentrations in ambient aerosols, assuming a negligible contribution from primary sources. Phthalic anhydride uptake (and hydroly- sis) was tested and found to represent a moderate filter ar- tifact in filter measurements with and without in-line denud- ers. This study provided the opportunity to examine differ- ences using authentic standards for phthalic acid compared to surrogate standards. While the mass fraction based on a surrogate compounds was somewhat lower, the differences are largely unimportant. For naphthalene, mass fractions of 0.0199 (recommended for ambient samples) and 0.0206 were determined in the presence and absence of nitrogen oxides, respectively, based on phthalic acid standards. The mass fractions determined from the laboratory data were applied to ambient samples where phthalic acid was found and expressed “as naphthalene” since phthalic acid was found to be produced in the particle phase from other methylnaphthalenes. The mass fraction values were applied to samples taken during the 2005 SOAR Study in Riverside, CA and 2010 CalNex Study in Pasadena. In both studies an undetermined isomer of methylphthalic acid was detected in addition to phthalic acid. Laboratory experiment reten- tion times and mass spectra suggest that the major precur- sor for this compound is 2-MN. For the CalNex Study, SOC values for the 2-ring precursor PAHs (as naphthalene) were found to range from below the detection limit to 20 ngC m -3 which with the laboratory mass fraction data suggests an up- per limit of approximately 1 μg m -3 for SOA due to 2-ring PAHs. Temporal data over the course of the one-month Cal- Nex study suggest that primary sources of phthalic acid were probably negligible during this study period. However, the values must still be considered upper limits given a potential hydrolysis reaction or uptake of phthalic anhydride (subse- quently hydrolyzed) onto the collection media. 1 Introduction PM 2.5 is composed of a wide variety of organic and inor- ganic components of primary and secondary origin. A review of the literature shows that the inorganic composition of am- bient PM 2.5 is reasonably well established and the sources Published by Copernicus Publications on behalf of the European Geosciences Union.
Transcript of The formation of SOA and chemical tracer compounds from ... · The formation of SOA and chemical...
Atmos. Chem. Phys., 12, 8711–8726, 2012www.atmos-chem-phys.net/12/8711/2012/doi:10.5194/acp-12-8711-2012© Author(s) 2012. CC Attribution 3.0 License.
AtmosphericChemistry
and Physics
The formation of SOA and chemical tracer compounds from thephotooxidation of naphthalene and its methyl analogs in thepresence and absence of nitrogen oxides
T. E. Kleindienst1, M. Jaoui2, M. Lewandowski1, J. H. Offenberg1, and K. S. Docherty2
1National Exposure Research Laboratory, U.S. Environmental Protection Agency, Research Triangle Park,North Carolina 27711, USA2Alion Science and Technology, P.O. Box 12313, Research Triangle Park, North Carolina 27709, USA
Correspondence to:T. E. Kleindienst ([email protected])
Received: 14 March 2012 – Published in Atmos. Chem. Phys. Discuss.: 11 May 2012Revised: 5 September 2012 – Accepted: 6 September 2012 – Published: 27 September 2012
Abstract. Laboratory smog chamber experiments have beencarried out to investigate secondary organic aerosol (SOA)formation from the photooxidation of naphthalene and itsmethyl analogs, 1- and 2-methylnaphthalene (1-MN and 2-MN, respectively). Laboratory smog chamber irradiationswere conducted in a flow mode to ensure adequate collec-tion of the aerosol at reasonably low reactant concentrationsand in the presence and absence of nitrogen oxides. Phthalicacid and methyl analogs were identified following BSTFAderivatization of the aerosol extract. These compounds wereexamined to determine whether they could serve as rea-sonable molecular tracers to estimate the contributions ofthese precursors to ambient PM2.5. Measurements were alsomade to determine aerosol parameters from secondary or-ganic aerosol from naphthalene, 1-MN, and 2-MN.
A mass fraction approach was used to establish factorswhich could be applied to phthalic acid concentrations inambient aerosols, assuming a negligible contribution fromprimary sources. Phthalic anhydride uptake (and hydroly-sis) was tested and found to represent a moderate filter ar-tifact in filter measurements with and without in-line denud-ers. This study provided the opportunity to examine differ-ences using authentic standards for phthalic acid comparedto surrogate standards. While the mass fraction based on asurrogate compounds was somewhat lower, the differencesare largely unimportant. For naphthalene, mass fractions of0.0199 (recommended for ambient samples) and 0.0206 weredetermined in the presence and absence of nitrogen oxides,respectively, based on phthalic acid standards.
The mass fractions determined from the laboratory datawere applied to ambient samples where phthalic acid wasfound and expressed “as naphthalene” since phthalic acidwas found to be produced in the particle phase from othermethylnaphthalenes. The mass fraction values were appliedto samples taken during the 2005 SOAR Study in Riverside,CA and 2010 CalNex Study in Pasadena. In both studies anundetermined isomer of methylphthalic acid was detectedin addition to phthalic acid. Laboratory experiment reten-tion times and mass spectra suggest that the major precur-sor for this compound is 2-MN. For the CalNex Study, SOCvalues for the 2-ring precursor PAHs (as naphthalene) werefound to range from below the detection limit to 20 ngC m−3
which with the laboratory mass fraction data suggests an up-per limit of approximately 1 µg m−3 for SOA due to 2-ringPAHs. Temporal data over the course of the one-month Cal-Nex study suggest that primary sources of phthalic acid wereprobably negligible during this study period. However, thevalues must still be considered upper limits given a potentialhydrolysis reaction or uptake of phthalic anhydride (subse-quently hydrolyzed) onto the collection media.
1 Introduction
PM2.5 is composed of a wide variety of organic and inor-ganic components of primary and secondary origin. A reviewof the literature shows that the inorganic composition of am-bient PM2.5 is reasonably well established and the sources
Published by Copernicus Publications on behalf of the European Geosciences Union.

8712 T. E. Kleindienst et al.: The formation of SOA and chemical tracer compounds
have been identified. However, while numerous organic com-pounds have been identified in field studies (e.g., Pio et al.,2001), the fraction of identified organic species in ambientPM2.5 samples remains low, complicating efforts to identifyprimary and secondary organic sources. Organic tracer-basedsource apportionment methods have been employed to deter-mine the contributions of specific primary organic sources toambient organic carbon concentrations (Schauer et al., 1996).The determination of secondary sources of organic aerosol inPM2.5 remains problematic.
Recent studies have identified organic compounds foundin PM2.5 with identical tracer compounds produced in labo-ratory irradiations of isoprene (Edney et al., 2005), monoter-penes (Jaoui et al., 2005; Claeys et al., 2007; Szmigielski etal., 2007), sesquiterpenes (Jaoui et al., 2007), and aromatichydrocarbons (Kleindienst et al., 2004). These findings haveled to the development of an organic tracer-based method(Kleindienst et al., 2007) for apportioning secondary organiccarbon (SOC) from the mass fraction of the identified tracercompounds to SOA formed from single-component labora-tory irradiations of each hydrocarbon (HC) given above. Themethod appeared to give a reasonable apportioning of sec-ondary precursors in the eastern United States where bio-genic hydrocarbons have been found to be the major sum-mertime precursors for SOA (Lewandowski et al., 2008).
Recent work has indicated that this approach, and simi-lar methods, might not be sufficient to help understand SOAformation in areas with strong anthropogenic influences (de-Gouw et al., 2005). A classic view of SOA formation hasbeen based on the generation of secondary aerosol productsfrom aromatic hydrocarbons and monoterpenes by an ab-sorptive gas-particle partitioning mechanism (Odum et al.,1996). This approach to SOA formation has the advantagethat model parameters can be generated readily from labora-tory experiments to provide an experimental basis for SOAformation yields, which can then be used to predict SOA for-mation in an air quality model.
Limitations of the classic SOA model, however, have be-come apparent as a result of comparisons with field mea-surements (Pun et al., 2003). Other possible volatile or-ganic compound (VOC) precursors not considered in theclassic partitioning method (SOA from aromatic hydrocar-bons and monoterpenes) may contribute to ambient SOA.For some precursors that potentially have high SOA yields(e.g., sesquiterpenes, polyaromatic hydrocarbons (PAHs)), itis also difficult to predict SOA contributions given uncertain-ties in the emission rates. Heterogeneous processes also arenot considered in the classic SOA model (Hallquist et al.,2009).
Field data have also shown the limitations of the classicmodel for SOA formation in real atmospheres. During the2002 New England Air Quality Study, deGouw et al. (2005)found that the composition of submicron particulate organicmatter (POM) was highly dependent on the atmospheric pro-cessing. Measurements over a two-day period, which fol-
lowed emissions from east coast US cities, showed corre-lations between POM and isopropyl nitrate, suggesting an-thropogenic precursors for POM. Further measurements bydeGouw et al. (2008) during the 2004 ICARTT study againindicated the source of POM was unexplained anthropogenicsources, although more than one-third of the POM could beexplained as processed emissions of aromatic hydrocarbons.
Unexplained ambient aerosol generally has been found tobe highly oxygenated and cannot be reconciled by knownbiogenic sources. Heald et al. (2005) found that levels of or-ganic carbon (OC) in the free troposphere (a.s.l.: 2–6.5 km)had average carbon levels of 4 µg m−3, which were between10 and 100 times higher than that predicted using GEOS-Chem with a conventional SOA formation mechanism, thatis, the two-product model. Robinson et al. (2007) found thatthe precursors giving rise to unexplained POM could comefrom moderate to high molecular weight hydrocarbons pro-duced in diesel combustion processes. Gas-phase precursorswere expected to result from the particle-gas phase parti-tioning upon dilution of the exhaust, which could then reactand recondense onto preexisting particulate matter follow-ing oxidation in the atmosphere. However, these emissionsformed upon dilution are not readily quantifiable using stan-dard analytical techniques and typically are not included inemission inventories. Accompanying experimental data in-dicated that these emissions could be efficient producers ofSOA even in the presence of nitric oxide. These findings areconsistent with those of Volkamer et al. (2007), who deter-mined during the MILAGRO Study in Mexico City that evenfirst-generation products of relatively small molecules suchas glyoxal can be efficient producers of SOA during earlystages of photooxidation.
Such studies suggest that anthropogenic hydrocarbons,such as gas-phase PAHs, could be playing a role in produc-ing measurable SOA. Naphthalene and its methyl-substitutedanalogs are by far the most volatile 2-ring PAHs, and theyare readily detected in diesel exhaust (Schauer et al., 1999).Naphthalene concentrations in urban atmospheres have beenreported as high as 1600 ng m−3 in Los Angeles (Reisen andArey, 2005). Similar to the reactions of OH+ aromatic hy-drocarbons, its dominant loss mechanism is ring cleavagethat leads to dicarbonyl products in the gas phase and otherring-retaining coproducts. Subsequent reactions of the pri-mary products has been found to generate phthalic anhy-dride (Wang et al., 2007), which possibly hydrolyzes hetero-geneously to form phthalic acid (PhA). Detection of PhA inambient PM2.5 has been broadly reported (e.g., Fraser et al.,2003).
Particle-phase compounds from the photooxidation ofnaphthalene have been explored to determine the extent towhich PhA is formed, with the intent of possibly using it as atracer compound in ambient samples. Up until now, PhA hasbeen considered mainly in terms of its correlation with SOAin ambient samples (Schauer et al., 2002; Fraser et al., 2003;Fine et al., 2004). While PhA has been detected in laboratory
Atmos. Chem. Phys., 12, 8711–8726, 2012 www.atmos-chem-phys.net/12/8711/2012/

T. E. Kleindienst et al.: The formation of SOA and chemical tracer compounds 8713
and field samples, no attempt has been made to use it to es-timate the contribution of two-ring precursor compounds tomeasured SOA. Moreover, the possibility of primary sourcesof PhA, such as from plasticizers, could diminish the value ofsuch a tracer in air sheds where source information is missing(Kautzman et al., 2010). These authors have suggested thatother compounds detected in ambient and laboratory samples(e.g., 4-nitro-1-naphthol) could be used as tracer compoundsbecause they are unlikely to be found from primary aerosolsources. However, approaches using liquid chromatographyto estimate tracer concentrations in atmospheric samples arehighly dependent on availability of authentic standards lim-iting its use in source attribution applications. Thus, the re-search conducted to date has provided only aerosol parame-terization to be used in air quality models.
The present work examines tracer compounds gener-ated from the photooxidation of naphthalene and 1- and 2-methylnaphthalene (1-MN and 2-MN) in the presence andabsence of oxides of nitrogen (NOx). The SOA mass frac-tion approach used follows closely that described by Klein-dienst et al. (2007) in which smog chamber irradiations areconducted of a single component hydrocarbon precursor inair mixtures, which photolytically generates hydroxyl radi-cals (OH). The laboratory-determined mass fraction of thetracer compound to the measured SOA (or SOC) is then ap-plied to ambient PM2.5 samples to estimate the contributionof precursor hydrocarbon. For many of the experiments con-ducted for tracer analysis, measurements were also obtainedfor the organic mass to organic carbon ratios (OM/OC), or-ganic aerosol yields, and the apparent volatility of the com-posite aerosol.
2 Experimental methods
Most of the laboratory and field measurement methods havebeen described previously (Kleindienst et al., 2007, 2009).Experiments to measure SOA and associated tracer com-pounds formed from naphthalene, 1-MN, and 2-MN werecarried out in a 14.5 m3 stainless-steel chamber with wallscoated with TFE Teflon. For the laboratory experiments inthis work, the chamber was operated as a continuous stirredtank reactor (CSTR), that is, as a flow-mode reactor (alsoknown as a dynamic-mode reactor). In this mode, reactantswere added to a manifold using mass flow controllers whilethe effluent obtained for analysis was withdrawn continu-ously. The average residence time in the chamber was 5.1 h,and the reaction mixture was brought to steady-state beforesampling began. The photolytic system had four banks of40 fluorescent bulbs consisting of a combination of UVA-340 bulbs (Q-Panel, Cleveland, OH) and standard UV bulbs(GE F40-BL), which provided nearly complete actinic cover-age. For experiments requiring the photolysis of H2O2, UV-sunlamps (UV-313) were added to the irradiation system to
increase the intensity of the radiation from 280 to 320 nm(Kleindienst et al., 2009).
The reactant generation system provided constant sourcesof zero air, gas-phase reactants, water vapor, and seedaerosol. The seed aerosol was generated by nebulizing a10 mg l−1 aqueous solution of ammonium sulfate. Nitric ox-ide (NO) was obtained from a high-pressure cylinder of 1 %NO in N2. Naphthalene and the methylnaphthalenes werepurchased from Aldrich Chemical Co. (Milwaukee, WI) atthe highest purity available and used without further purifi-cation. All solvents were obtained from Burdick and Jack-son (Muskegon, MI) and specified as GC2 quality. BSTFAreagent (with 1 % trimethylchlorosilane) used for OH deriva-tization was also obtained from Aldrich Chemical Co.
Hydrocarbon reactants were added by two differentmeans. 1-MN, which is a liquid at room temperature, wasvaporized by passing air through the thermostated liquid inan impinger. For naphthalene and 2-MN, which are solids atroom temperature, air was passed over the pure compound tosweep the sublimated vapor into the chamber in a controlledfashion. Heated lines obviated the likelihood of reactant con-densation in the transfer lines. A relative humidity (RH) gen-erator with a computer-controlled peristaltic pump and high-temperature vaporizer was used to add water vapor preciselyto the chamber for experiments where NOx was injected as areactant. The chamber was operated at 25◦C during the ex-periments.
Hydroxyl radicals (OH) initiated the oxidation of the hy-drocarbon reactants. For experiments with oxides of nitro-gen (NOx) present, OH was produced from the photolysisof methyl nitrite or by the conventional chain-propagatingmechanism, which generates OH via the reaction of NO withHO2. In experiments with NOx, the chamber was operated at30 % RH. For experiments without NOx, OH was generatedfrom the photolysis of hydrogen peroxide (H2O2) with thechamber operated without added water vapor (RH< 3 %).
Compounds added or generated in the chamber were mea-sured using a variety of analytical methods. Oxides of ni-trogen were measured using a Monitor Labs, Inc. Model8840 oxides of nitrogen chemiluminescence analyzer. Hy-drocarbon reactant concentrations were measured by gaschromatography-flame ionization detection (GC-FID) with adouble focusing cryogenic system. These samples were col-lected in a sampling loop held at−180◦C and then flashheated to 260◦C to inject the analytes onto the head ofthe GC column. A semi continuous GC system (HP 5890,Hewlett Packard, Palo Alto, CA) was also used to measureorganic compounds in the chamber and inlet manifold on a20-min duty cycle. Temperature and RH were measured us-ing a digital thermo hygrometer (Model RH411, Omega En-gineering, Inc., Stamford, CT).
Aerosol chemical and physical properties were measuredusing a variety of continuous and integrated methods. Or-ganic carbon concentrations were measured using an au-tomated, semicontinuous elemental carbon-organic carbon
www.atmos-chem-phys.net/12/8711/2012/ Atmos. Chem. Phys., 12, 8711–8726, 2012

8714 T. E. Kleindienst et al.: The formation of SOA and chemical tracer compounds
(EC-OC) instrument (Sunset Laboratories; Tigard, OR).Since elemental carbon was not present in these systems,the measured total carbon was equivalent to SOC. The in-strument operated at a flow rate of 8 l min−1 with a samplecollection time of 30 min. The analysis was conducted usinga thermooptical analytical technique (Birch and Cary, 1996)with the instrument operated on a 45-min duty cycle. In addi-tion to SOC, the OM concentration (numerically equivalentto the chamber SOA) was determined by gravimetric analysisof a filter sample collection. The OM masses were correctedby subtracting the seed aerosol mass of 1 µg m−3.
The volatility of the photochemically produced organicaerosol was determined using the volatility differential mo-bility analysis (VDMA) technique, which uses a size mobil-ity particle scanner (SMPS) to measure the volume distribu-tion of the chamber aerosol (Offenberg et al., 2006). Thisvolatility parameter,1H eff
vap, is used in this context simplyas an operational parameter to represent the change in thevolatility of composite aerosol as a function of temperature.Unlike techniques that use tandem differential mobility ana-lyzers (DMAs), this method uses a 25-cm heated line coupledto the inlet to measure the integrated volume over the entireSMPS size range (18–931 nm). The technique is feasible be-cause the aerosol volume remains constant over the courseof the irradiation at steady state. The use of the technique isidentical to that described in earlier publications (e.g., Klein-dienst et al., 2009).
Individual organic compounds in the particle phase weredetermined using gas chromatography-mass spectroscopy(GC-MS) analysis of filter samples. For consistency withprevious measurements, aerosol measurements from labo-ratory samples were made using Teflon-impregnated, glass-fiber (TIGF) filters, whereas field sample measurements weremade using quartz filters, which could be prone to gas-phaseuptake of organic compounds. Thus, to evaluate the possi-ble effect of gas-phase phthalic anhydride on the filter re-sults, Experiment ER579 (Table 1) used a sampling train thatconsisted of organic denuders followed by 47-mm TIGF orquartz filters. In an additional configuration, an extractabledenuder was used containing eight concentric glass tubescoated with the XAD-4 solid phase adsorbent (Gundel et al.,1995). Experiment ER579 also consisted of comparing side-by-side TGIF and quartz filters. Further details regardingthese sampling configurations and denuder extract analysisare given by Kleindienst et al. (2004, 2009). For the presentexperiment, it should be noted that the analysis measures ph-thalic acid, whereas the putative interfering compound sub-ject to uptake is phthalic anhydride.
Individual organic compounds from the denuder or thechamber aerosol were determined by derivatization withN,O-bis(trimethylsilyl) trifluoroacetamide (BSTFA; Jaoui etal., 2004). Reactions of BSTFA with hydroxylated groupsform a trimethyl silyl (TMS) derivative which improvesthe chromatography of tracer peaks that might otherwisetail considerably. Laboratory filter samples were Soxhlet-
extracted with dichloromethane for 6 h or sonicated in 1:
1 (v/v) dichloromethane/methanol mixture for 1 h. Priorto the extraction, 20 µg each ofcis-ketopinic acid (KPA)and d50-tetracosane were added as internal standards. Ex-tracts were dried and then derivatized with 250 µl of BSTFAwith 1 % TMCS as a catalyst and 100 µl of pyridine. Sam-ples were heated to complete the derivatization reaction andthen injected onto the GC without a further reduction involume. Filters from the field samples were extracted bySoxhlet extraction for 24 h using 125 ml of a 1: 1 (v/v)dichloromethane/methanol mixture. Prior to the extraction,cis-ketopinic acid and tetracosane-d50 were added as internaland recovery standards, respectively. Filter extracts were ro-tary evaporated to 1 ml and then evaporated to dryness withultrazero nitrogen.
Each derivatized extract for both laboratory and field sam-ples were analyzed by GC-ion trap mass spectrometer (GC-ITMS; Thermoquest Model GCQ+, Austin, TX). Sampleswere injected into the heated inlet and separated using anRTx-5MS column (60-m length× 0.25-mm i.d.× 0.25-µm film thickness; Restek, Inc., Bellefonte, PA). GC op-erating conditions were identical to those described previ-ously (Kleindienst et al., 2010a). Sample detection and anal-ysis was conducted in either the positive electron ionization(EI) or chemical ionization (CI) modes with methane as thereagent gas over am/z range between 70 and 975 Da. Us-ing the EI mode is feasible for this tracer compound sincestandards are readily available or can be easily produced inthe laboratory. Here, the calibrations for the laboratory ex-periments have been based on external PhA standards andonly the CI data are presented. For the field samples, the trac-ers were typically analyzed from the total ion chromatogram(TIC) or, in cases where co-elutions occurred, by a selectedion technique using five molecular ions as previously de-scribed (Kleindienst et al., 2007). The use of the five-ion-to-TIC calibration factor tend to provide more consistent con-centration estimates than those from a single ion. TIC areaswere then used to determine the SOA tracer concentrations inng m−3. For PhA, the five ions used werem/z 295, 221, 311,339, and 351 corresponding to the respective fragments andadducts of (M-15), (M-89), (M+1), (M+29), and (M+41). Inaddition, methyl phthalic acid (MPhA; see below) was alsodetected in the laboratory samples from aerosol produced inthe 1-MN and 2-MN photooxidation and in selected cases infield sample extracts. For 2MPhA-2, the only MPhA isomerdetected in field samples, the five ions used werem/z 309,235, 325, 351, and 365 corresponding to the respective frag-ments and adducts indicated above.
Results from two field studies are also included which ap-ply the laboratory findings to ambient tracer data. The firstset was taken during the 2005 Study of Organic Aerosolsin Riverside (SOAR-1; Docherty et al., 2008). In the sam-pling scheme for the filter collection, aerosol was compos-ited for multiple days over identical times periods (05:00–10:00; 10:00–15:00; 15:00–20:00; and 20:00–05:00; PDT)
Atmos. Chem. Phys., 12, 8711–8726, 2012 www.atmos-chem-phys.net/12/8711/2012/

T. E. Kleindienst et al.: The formation of SOA and chemical tracer compounds 8715
Table 1.Initial conditions for experiments producing SOA from naphthalene photooxidations. The experiments were conducted with chamberoperated in a dynamic (i.e., flow) mode, except for ER457 and ER458 which were conducted in a batch mode. All experiments with NOxwere conducted at a relative humidity of 30 % and no water vapor was added to experiments without NOx (RH< 3 %).
Expt No.a Purpose HC (ppmC) CH3ONO (ppm) NO (ppm) H2O2 (ppm)
ER457 Tracer 0.75 0.191 0.606 –ER458 Tracer 1.95 0.163 0.599 –ER459-1 Tracer, Parameter 1.01 0.136 0.303 –ER459-2 Tracer, Parameter 1.01 0.136 0.152 –ER512 Tracer, Parameter 2.35 – 0.295b –ER539 Parameter 1.74 – 0.260b –ER579 Parameter, putative phthalic anhydride uptake 0.97 – 0.242b –ER460-1a Tracer 1.03 – – 4.4ER460-1b Tracer, Parameter 1.03 – – 4.1ER460-2 Tracer, Parameter 1.03 – – 2.1ER461-1a Tracer, Parameter 0.24 – – 4.4ER461-1b Tracer 0.24 – – 4.4
a Partsa andb represent parallel filters from the same experiment;b Initial [NOx] equivalent to [NO].
for weekend and weekday periods. In a second study, fil-ter samples were taken during the 2010 California Researchat the Nexus of Air Quality and Climate Change (CalNex)Study. Daily filter samples were collected over 23-h periodsfrom midnight to 11:00 p.m. (PDT) from 15 May–15 June2010. Additional information on the CalNex study can befound, for example, in Washenfelder et al. (2011).
3 Results
Irradiations were conducted using naphthalene, 1-MN, and2-MN as hydrocarbon reactants and OH as the oxidant inthe presence and absence of NOx. For most experiments inthe presence of NOx, OH radicals were produced initiallythrough the photolysis of methyl nitrite. While methyl nitriteis not strictly essential since the naphthalene reacts rapidlywith OH, the chain propagating processes in its NOx irradi-ations are not robust due to organic chain terminating pro-cesses, and thus the addition of methyl nitrite helps to en-sure that the extent of reaction is sufficiently high to pro-duce a highly oxidized aerosol. For experiments in the ab-sence of NOx, OH radicals were generated from the photoly-sis of hydrogen peroxide. Initial naphthalene concentrationsranged from 0.2–2.4 ppmC (20–240 ppb). For respective ex-periments in the absence and presence of NOx, NOy (whichincludes CH3ONO) values from 0.2–0.8 ppm and H2O2 val-ues from 2–4 ppm were used. The exact initial conditions forthe experiments are given in Table 1. A more limited num-ber of experiments were performed with the two monomethylnaphthalene isomers. However, for both methyl analogs, ex-periments were also performed in the presence and absenceof NOx with initial conditions provided in Table 2.
Steady-state chamber concentrations of the reacted naph-thalene, NOy, and O3, where applicable, are given in theupper portion of Table 3. For experiments without NOx,the photolysis of H2O2 was the only source of OH, sinceOH cannot be generated by catalytic means in these typesof photochemical systems not involving NOx. The reactednaphthalene is determined from the difference of the ini-tial and steady-state naphthalene concentrations. For theseexperiments, the reacted naphthalene concentration rangewas 0.24–0.86 ppmC. The random uncertainty in the reactednaphthalene and methyl naphthalenes result from the repro-ducibility of both the initial and steady-state hydrocarbonsvalues by gas chromatography and is estimated to range be-tween 30 and 50 % due to the relatively low volatility of thesecompounds.
Also shown in Table 3 are steady-state chamber concen-trations for five experiments with NOx present in the reac-tant mixture. Even in the cases with CH3ONO being used togenerate OH initially, a modest fraction of the NO initiallypresent (0.03–0.33) remained under steady-state conditions.Substantial levels of NOx but relatively little ozone were alsoproduced at steady state as seen in Table 3. Given the modeststeady-state concentrations of NO, it is unlikely under theseconditions that peroxy-peroxy radical (RO2-HO2 and RO2-RO2) reactions were occurring substantially, and thus SOAformation observed were due to reactions occurring in thepresence of NO.
With the chamber operated in a steady-state mode, a con-stant aerosol source was maintained for initial conditionsgiven in Tables 1 and 2. The major aerosol parameters mea-sured, including SOA and SOC, are given in Table 3. Uncer-tainties in the SOC values are taken from the reproducibilityof the semicontinuous measurement and are typically betterthan 10 % for a single run, although this does not include
www.atmos-chem-phys.net/12/8711/2012/ Atmos. Chem. Phys., 12, 8711–8726, 2012

8716 T. E. Kleindienst et al.: The formation of SOA and chemical tracer compounds
Table 2. Initial conditions for laboratory irradiations of 1- and 2-methylnaphthalenes. The experiments were conducted with chamber oper-ated in a dynamic (i.e., flow) mode.
Expt No. HC Purpose C11H10 (ppmC) NO (ppm) H2O2 (ppm)
ER-467 1-MN Parameter, Tracer 0.763 – 4ER-470 1-MN Parameter, Tracer 0.821 0.180 –ER-468 2-MN Parameter, Tracer 1.01 – 4ER-469-1 2-MN Parameter, Tracer 0.944 0.299 –ER-469-2 2-MN Parameter, Tracer 0.944 0.186 –
Table 3. Steady-state parameters determined from SOA produced by the naphthalene, 1-MN, and 2-MN laboratory photooxidations. TheSOA and SOC yields, the OM/OC ratio, and1Heff
vap were determined from the chamber concentrations. Reacted and formation values werecorrected for chamber losses.
Reacted HC Reacted HCa NOx O3 SOA SOC OM/OC 1Heffbvap YSOA Y c
SOC(ppmC) (µg m−3) (ppm) (ppm) (µg m−3) (µgC m−3) (kJ mol−1)
Naphthalene
ER459-1d 0.72 375.0 0.281 0.007 100.3 46.9 2.14 15.1 0.27 0.13ER459-2 0.79 409.7 0.111 0.045 118.3 60.3 1.96 – 0.29 0.16ER512-1 1.44 749.4 0.232 0.012 132.2 59.3 2.23 – 0.18 0.08ER512-2 1.49 775.2 0.254 0.002 82.6 40.3 2.05 – 0.11 0.06ER539-1 0.64 333.2 0.201 0.013 84.7 49 1.73 – 0.25 0.16ER539-2 0.65 339.7 0.195 0.013 89.2 53.6 1.66 – 0.26 0.17ER539-3 0.64 332.6 0.190 0.015 94.2 54.1 1.74 – 0.28 0.17ER579-1 0.54 281.2 0.220 0.002 38.9 – – – 0.14 –ER579-2 0.59 306.0 0.215 0.002 – 22.9 – – – 0.08ER460-1e 0.86 445.3 – – 158 85.2 1.86 17.9 0.36 0.20ER460-2e 0.82 427.6 – – 131.7 71.0 1.86 19.3 0.31 0.18ER461-1e 0.24 123.4 – – 22.4 9.71 2.31 21.3 0.18 0.08
1-MN
ER-467e 0.48 252.4 – – 102.4 56.1 1.83 17.4 0.41 0.24ER-470 0.41 213.1 0.130 0.005 42.8 16.1 2.66 15.7 0.20 0.08
2-MN
ER-468e 0.61 321.9 – – 204.4 110 1.86 15.0 0.64 0.37ER-469-1 0.51 267.3 0.265 0.002 36.9 10.4 3.45f – 0.13 0.04ER-469-2 0.50 262.7 0.136 0.008 41.2 18.6 2.22 19.9 0.16 0.08
a Reacted HC as carbon multiply values by 0.9325.b Measurements made over temperature range 50–250◦C.c YSOC= SOC/1HCC.d Flow-mode experiments are represented by two part numbers where the first part (e.g., ER459) represents an individual experiment and the second part (−1, −2, etc.) representsa distinct sampling period or change of conditions within the experiment.e Measurements made without NOx present in the system.f Probably outlier due to lowYSOC.
possible systematic error. For OM, the uncertainties are de-termined from the reproducibility of side-by-side filter mea-surements which are typically better than 5 %. An estimate ofthe systematic errors due to minor changes in reactant con-centrations, minor variations in chamber temperature, andother similar factors bring the total uncertainty to between15 and 25 % for these parameters. OM/OC values were thendetermined from the corrected data and given in Table 3. Forexperiments in the absence of NOx, OM/OC values ranged
between 1.86 and 2.31 with an average value of 2.01. Simi-larly in the presence of NOx, the measured values were be-tween 1.66 and 2.33 with an average value of 1.93. For 1-MNand 2-MN only single measurements were made for OM/OCwhich are found in Table 3 and exclude a likely outlier inExperiment ER-469-1.
From the organic aerosol produced in the naphthalene pho-tooxidation in the absence and presence of NOx, an effectiveenthalpy of vaporization was determined for the laboratory
Atmos. Chem. Phys., 12, 8711–8726, 2012 www.atmos-chem-phys.net/12/8711/2012/

T. E. Kleindienst et al.: The formation of SOA and chemical tracer compounds 8717
aerosol in selected experiments as described above. The val-ues were obtained from the slope of a plot of lnV vs.T −1 which when multiplied by the Gas Constant,R, givesa 1H eff
vap. These values of1H effvap are summarized in Ta-
ble 3. For the experiments without NOx present,1H effvap
ranges between 21.3 and 17.9 kJ mol−1 with an average value19.5 kJ mol−1. For the single experiments with NOx where1H eff
vap was measure, a value of 15.1 kJ mol−1 was deter-mined. These values are consistent with the ranges of val-ues measured from aerosol generated in the photooxidationof alkylbenzenes (Offenberg et al., 2006).
The aerosol yield was determined for both organic massand organic carbon. SOA masses were determined from thegravimetric mass formed during the irradiation. Organic car-bon was determined by averaging the 30-min collectionsfrom the OC-EC instrument over the same period of time thatthe gravimetric mass was collected on filters. Similarly, thereacted hydrocarbon was obtained from the difference be-tween the input concentration and the steady-state concen-tration over the same time period during the irradiations. Forexperiments using a flow mode reactor, the SOC yield (YSOC)
and the SOA (YSOA) are determined from the following re-spective relationships:
YSOC= SOC/1HCC (1)
YSOA = SOA/1HC (2)
where SOC is the organic carbon concentration and1HCCis the reacted naphthalene carbon (determined by multiply-ing 1HC by 0.9375). SOA and SOC were also corrected forwall loss to the chamber which had previously been deter-mined for organic aerosol to be 0.067 h−1. Uncertainties inthe yield come from the combination of experimental uncer-tainties in the SOC and SOA values and the reacted naphtha-lene concentrations discussed earlier.
Yields for the experiments conducted in either the pres-ence or absence of NOx are found in Table 3. For naphtha-lene, most of the measurements were made in experimentswith NOx and show values within approximately a factorof two regardless of the organic mass present. Other fac-tors, including the total NOx present in the system at steady-state, as well as the presence of methyl nitrite in the sys-tem, did not help in explaining the results. Thus, the varia-tion in these measurements is thought to be due mainly tothe inherent variability of the factors composing the yieldcalculation while recognizing that two of the experiments(ER 512-2 and ER579-1) might represent outliers. Naphtha-lene yield measurements without NOx were more consistentand systematically higher than the measurements with NOx.YSOA values were determined for resulting SOA levels from22–158 µg m−3 and ranged between 0.18 and 0.036; YSOCranged between 0.08 and 0.20. For the two systems at sim-ilar SOA concentrations, the yields tended to be higher forexperiments without NOx, although not outside the limit ofuncertainty. With NOx present, reactions of naphthalene tend
to generate carbonyl products which is expected to lower thedegree of SOC formation over the time scale of these ex-periments. However, in these experiments, there is no con-clusive evidence thatYSOA was lower at the lower SOAconcentrations. For the experiments with the methyl naph-thalenes (1-MN and 2-MN), only a few measurements weremade and the yields were higher in the absence of NOx thanwith NOx in the system. In addition, flow- mode experimentswithout NOx were prone to producing high levels of aerosol(> 100 µg m−3).
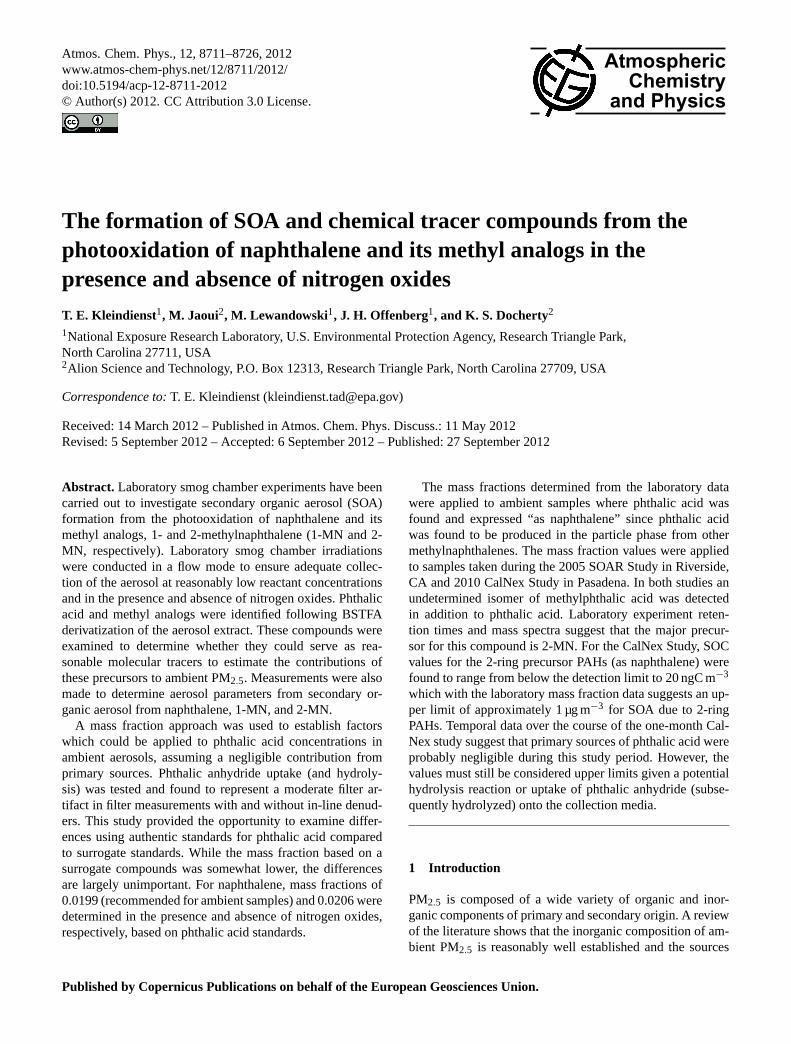
The major particulate-phase product produced in the naph-thalene oxidation was phthalic acid which is an aromaticdiacid (1,2-dicarboxybenzene) having a compound molec-ular weight (MC) of 166 g mol−1 and a derivative molec-ular weight (M) of 310 g mol−1. The derivatized com-pound is easily detected from the extracts of the aerosolphase. Both the electron ionization and the chemical ion-ization mass spectra of the derivative are presented inFig. 1. For the CI spectra, a full set of fragments andadducts are detected. Characteristic ions of the derivativesare m/z 73 [Si-(CH3)3]+, 75 [HO=Si(CH3)2]+ and 147[(CH3)2Si=OSi(CH3)3]+; the pseudo molecular ions whichinclude M+147 [M+ (CH3)2Si=OSi(CH3)3]+, M+73 [M+
Si-(CH3)3]+, M+41 [M+SiCH]+, M+29 [M+C2H5]+,M+1 [M+H]+, M-15 [M-CH3]+, and the base ion – M-89 [M-OSi(CH3)3]+ are also all present (Jaoui et al., 2004).In general, CI mass spectrum from the laboratory samplesshow stronger adduct formation than do the field sampleswhere the M-15 and M-89 fragments dominate. In additionto phthalic acid, field and laboratory samples often show thepresence of isophthalic acid (IPhA; 1,3-dicarboxybenzene)and terephthalic acid (TPhA; 1,4-dicarboxybenzene), both ofwhich regularly show dominate M-15 base ions (comparedto the PhA base ion of M-89). For the EI spectra of phthalicacid, the two most intense peaks result from the character-istic ionsm/z 73 andm/z 147 (base ion). Other minor ionsincluding M+147, M+73, M-15, and M-89 all of which haveintensities of about 10 % of the base ion. For measurementsusing EI, an authentic standard which has been derivatizedis essential for retention time comparison to the field analytefor identification and quantification.
The napthalene irradiations, both with or without NOxpresent, produced phthalic acid in the aerosol phase as thechemical constituent with the highest yield. Table 4 givesabsolute PhA concentrations together with the SOA massformed in each experiment with calibrations based on au-thentic PhA standards. The mass fraction in each case isin the low single-digit percent range regardless of condi-tions. For experiments without NOx, the mass fractions av-eraged 0.0201 ± 0.0027 giving a relative standard deviationof less than 15 %. The mass fraction with NOx averaged0.0199 ± 0.0084. The relative standard deviation of 40 % ap-pears to be due to the different initial conditions of the ex-periments, including the fact that some were conducted withCH3ONO in the system. Mass fractions for phthalic acid
www.atmos-chem-phys.net/12/8711/2012/ Atmos. Chem. Phys., 12, 8711–8726, 2012

8718 T. E. Kleindienst et al.: The formation of SOA and chemical tracer compounds
Table 4.Phthalic acid concentrations (ng m−3) and mass fractions from laboratory irradiations of naphthalene. Since the mass fraction is arelative parameter, values are uncorrected for chamber losses.
Expt No. SOA mass Phthalic acida Phthalic acidb Methylphthalic acida SOA mass SOA mass fraction(µg m−3) (µg m−3) (µg m−3) (µg m−3) fractiona b
C10H8 w-NOx
ER457c 111.7 2.64 2.34 0.0236 0.0209ER458c 101.1 3.20 2.96 0.0316 0.0293ER459-1 71.0 0.73 0.19 0.0103 0.0027d
ER459-2 92.4 1.28 2.24 0.0139 0.0243ER512 92.9 1.85 0.72 0.0199 0.0078Avg. ± S.D. 0.0199 ± 0.0084 0.0206 ± 0.0092
C10H8 w/o-NOx
ER460-1ae 119.3 2.31 1.91 0.0193 0.0160ER460-1be 127.4 2.66 1.87 0.0209 0.0147ER460-2 113.8 2.32 1.90 0.0204 0.0167ER461-1ae 17.6 0.25 0.0142ER461-1be 19.9 0.38 0.0189Avg. ± S.D. 0.0188 ± 0.0027 0.0158 ± 0.0010
1-C11H10
ER467f 77.0 0.48 0.67 0.26 0.0062 0.0087ER470-1 32.6 0.29 0.37 0.02 0.0089 0.0113ER470-2 62.6 0.21 0.89 0.02 0.0034 0.0142
2-C11H10
ER468f 160.2 0.91 0.29 0.29 0.0057 0.0018ER469-1 27.3 1.58 0.79 0.27 0.0579 0.0289ER469-2 31.3 0.67 0.35 0.09 0.214 0.0113
a Based on PhA calibration.b Based on KPA calibration.c Static- (aka, batch-) mode experiment.d Not used in average (outlier).e Parallel sample from a single samplingperiod.f NOx absent from reactant mixture.
which were based on KPA as the calibration standard werereasonably consistent with those based on the PhA standardsas seen in the adjoining columns in Table 4. For applica-tion with ambient PhA (ng m−3), a mass fraction of 0.0199should be used in conjunction with the mass fractions ofKleindienst et al. (2007).
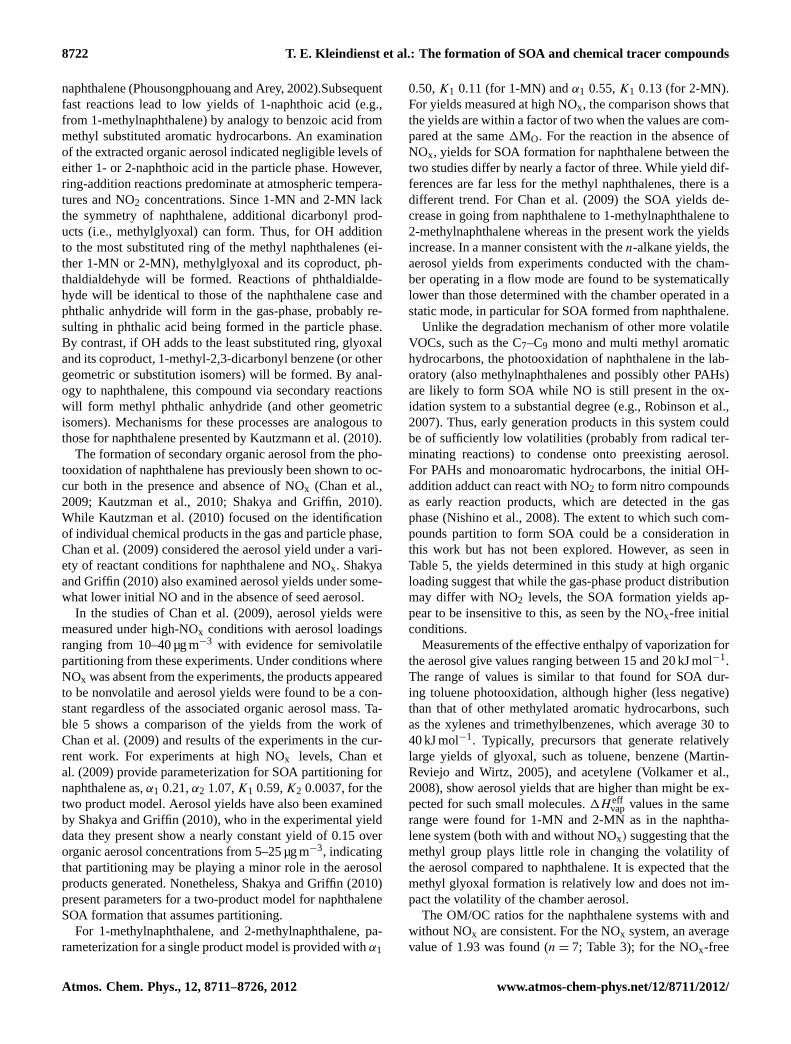
Experiments from the photooxidation of 1-MN and 2-MNproduced in addition to phthalic acid, several isomers ofmethyl phthalic acid. The different isomers (1MPhA-1 to -3;and 2MPhA-1 to -2) are formed for individual photooxida-tion of 1-MN and 2-MN and are most clearly distinguishedfor irradiations without NOx in the system. Figure 2 presentsGC chromatograms of the four isomers, two from each irra-diation in the absence of NOx. At the present time it is notpossible to ascribe the positions of the methyl group withrespect to the two acid groups since neat standards are notavailable.
Measurements were made in the laboratory to examine thepotential role of gas phase phthalic anhydride in interferingwith the filter measurements of phthalic acid. The experi-ments were designed to be an upper bound estimate for the
gas-phase artifact for the filter collection of particle-boundphthalic acid in the presence of gas-phase phthalic anhy-dride. The experiments also examined the difference betweenphthalic acid collection on quartz filters (for field measure-ments) and glass-fiber filters (laboratory measurements). Theexperiments indicated that for a molar ratio of approximatelytwenty times more phthalic anhydride in the gas-phase thanphthalic acid in the particle phase an increase of approxi-mately 40 % of phthalic acid was detected on the quartz fil-ters. Moreover, there was a negligible difference (ca. 4 %)between use of TGIF and quartz filters for parallel samplingconfigurations.
The relevance in these aromatic diacids can be seen fromsamples taken during two recent field studies conducted inSouthern California. Figure 3 shows a selected ion chro-matogram from a composited derivatized sample taken dur-ing the Study of Organic Aerosols in Riverside (SOAR-1)conducted in 2005 in Riverside, CA (Docherty et al., 2008).For this figure, the M-15 ion has been extracted (m/z 295for PhA, IPhA, TPhA andm/z 309 for 2MPhA-2) to clearlyshow the presence of the compounds in the field sample. A
Atmos. Chem. Phys., 12, 8711–8726, 2012 www.atmos-chem-phys.net/12/8711/2012/

T. E. Kleindienst et al.: The formation of SOA and chemical tracer compounds 8719
41
(a)
(b)
m/z
Rel
ativ
e ab
unda
nce
(c)
(d)
Fig. 1. Electronic ionization(a) and chemical ionization(b) mass spectra of phthalic acid from the GC-MS analysis of aerosol in Ex-periment ER512 and CI mass spectra of(c) 2-methylphthalic acid-isomer-2 (2MPhA-2; see text) from laboratory experiment, ER468and (d) from the SOAR field study (see text). The major characteristic ions of the BSTFA derivatives,m/z 73 [Si-(CH3)3]+ and 147[(CH3)2Si=OSi(CH3)3]+, are seen to dominate the EI spectrum leaving the identifying fragments and adduct peaks at intensities typicallyless than 20 % of the base ion.
comparison of the retention times of the MPhA peak rela-tive to phthalic acid (in Fig. 2) indicates that the isomer seenin the field sample is 2MPhA-2. Similarly, other compositedsamples during this study showed the presence of these com-pounds.
Phthalic acid and MPhA were quantified for compositedsampling periods during this study as presented in Fig. 4.Separate composites were taken for three 5-h time periodsduring the day and a single 9-h period at night. Sampleswere also segregated according to weekend and weekdayperiods. Weekday concentrations for PhA ranged from 2–10 ng m−3 and peak values occurred in the 15:00–20:00 h pe-riod; by contrast, much higher levels of PhA (5–30 ng m−3)
were measured from the weekend samples with peak values
occurring during the 10:00–15:00 h period. These trends aresimilar to the findings of Stone et al. (2009) for compositeSOA. MPhA given in Fig. 2 as the 2MPhA-2 isomer typi-cally followed the PhA time profiles with concentrations afactor of 5–10 lower.
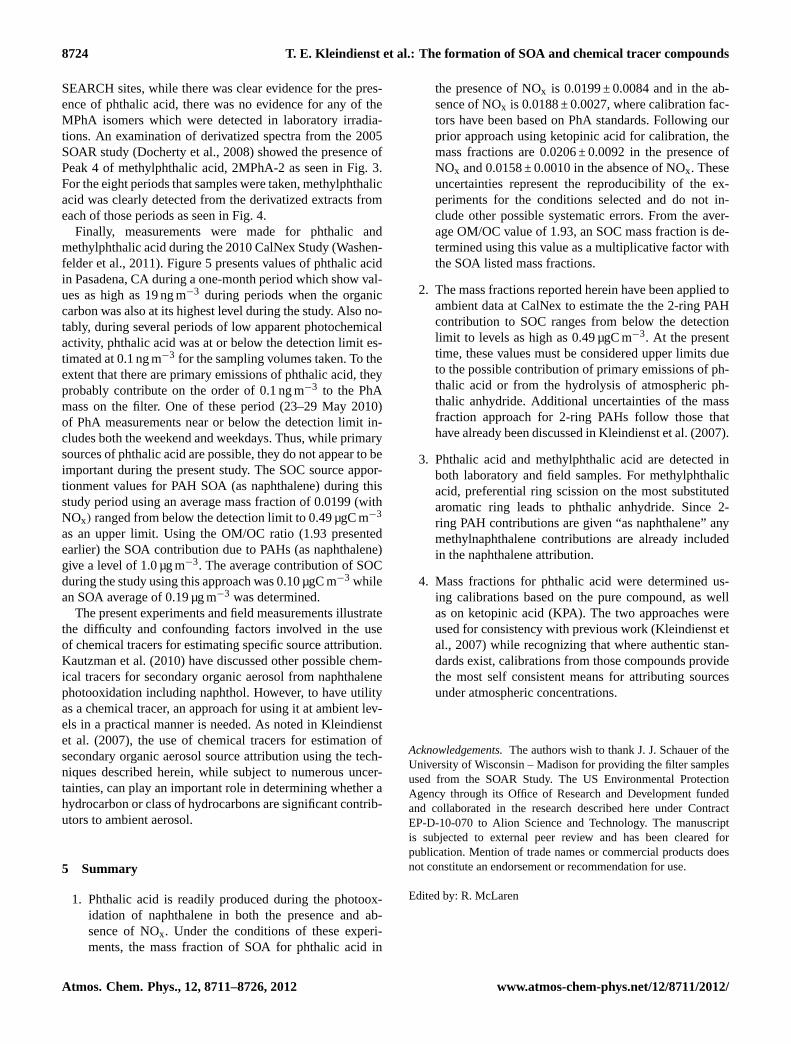
The presence of phthalic acid and MPhA was also detectedin filter samples taken during the CalNex Study conductedin Pasadena, CA during May and June of 2010. Sampleswere taken during 30 consecutive days during which PhAand MPhA were only seen during periods of relatively highphotochemical activity. Figure 5 gives the profile of the am-bient concentrations of PhA which peaked above 5 ng m−3
during three periods in the study. In addition, during periodsof low activity, PhA concentrations were found to be below
www.atmos-chem-phys.net/12/8711/2012/ Atmos. Chem. Phys., 12, 8711–8726, 2012

8720 T. E. Kleindienst et al.: The formation of SOA and chemical tracer compounds
42
(IP
hA
)
(Ph
A)
(2M
Ph
A-1
)
(2M
Ph
A-2
)
*
* Rel
ativ
e ab
unda
nce
Retention Time (min)
*
*
* *
* *
(1M
Ph
A-3
)
(Ph
A)
(IP
hA
)
(1M
Ph
A-1
) (1
MP
hA-
2)
* * *
(Ph
A)
(Ph
A)
(1M
Ph
A-1
) (1
MP
hA
-2)
(IP
hA
iso
mer
) (1
MP
hA-
3)
Fig. 2. The relative abundance vs. retention times are presented for the GC-MS chromatograms of the TMS-derivatives of phthalic acid(PhA), isophthalic acid (IPhA), 1-methylphthalic acid (1MPhA-1 to -3) and 2-methylphthalic acid (2MPhA-1 to -2) isomers from the pho-tooxidation of 1-MN (top: absence of NOx, bottom: presence of NOx) and 2-MN (middle: absence of NOx) from ER467, ER470, andER468, respectively. The peaks are scaled using the M-15 peak (m/z 295 for PA andm/z 309 for 1MPhA-1 to -3 and 2MPhA-1 to -2). Forthe experiments in the presence of NOx the ratio of the6 MPhA to PhA is considerably lower using the ion scaling shown here. (*) representpeaks having similar mass spectra as 1MPhA or 2MPhA.
the detection limit of approximately 0.1 ng m−3. Again, this2MPhA-2 isomer was the only methyphthalic acid isomer de-tected in these ambient samples.
4 Discussion
Polycyclic aromatic hydrocarbons have been found to beemitted from the combustion of fossil-fuels, for example,through diesel exhaust emissions (Schauer et al., 1999).Compounds with fewer than four fused-rings are generallyfound almost exclusively in the gas phase with the naph-thalene concentration typically being higher than the sum ofall other PAHs. The gas-phase oxidation of naphthalene hasbeen addressed in several studies. Similar to benzene, thenaphthalene reacts (during the day) by the addition of hy-droxyl radicals (OH) to the aromatic ring, here at either the1- or 2-position. Unlike benzene, the rate constant for the
reaction is extremely high at 2.4 × 10⁻¹¹ cm3 molec−1 s−1
(Biermann et al., 1985). The initial carbon-center radical canadd O2 or NO2 depending on the NO2 concentration presentyielding potentially different gas-phase product distributions(see below). Reaction products lead to both ring-retainingand ring- cleavage products. Ring cleavage products tend topredominate under conditions where NO reacts with the ini-tially formed peroxy radicals. The major product from theprimary reaction is 2-formylcinnamaldehyde with a reportedyield of 0.56 (Nishino et al., 2009a). This compound, whilereacting extremely rapidly with OH, is also highly prone tophotolysis at actinic wavelengths.
Acyclic ring-cleavage products have also been reported al-though at relatively low yield. Thus, the photooxidation ofnaphthalene has been found to generate glyoxal as a primaryproduct at yields of 0.05 (Nishino et al., 2009b). The coprod-uct of this reaction, phthaldialdehyde (i.e., 1,2-dialdehydic
Atmos. Chem. Phys., 12, 8711–8726, 2012 www.atmos-chem-phys.net/12/8711/2012/

T. E. Kleindienst et al.: The formation of SOA and chemical tracer compounds 8721
43
Rel
ativ
e ab
unda
nce
Retention Time (min)
Fig. 3. GC-MS chromatogram vs. retention time for a sample taken during the SOAR Study in Riverside, CA in 2005. The chromatogrampresents the TMS-derivatives of the PhA isomers and methyl phthalic acid from a composited sample taken weekdays between 05:00–10:00a.m. Peaks are scaled by the M-15 ion intensities and include(a) phthalic acid;(b) isophthalic acid;(c) terephthalic acid (presumed, coelutedwith an interfering compound); and(d) the single methylphthalic acid isomer (2MPhA-2) which was detected.
44
Fig. 4.Time profiles for the TMS-derivatives of phthalic acid (PhA;ng m−3) and 2-methylphthalic acid (2MPhA-2; see Fig. 2) duringthe 2005 SOAR Study in CA. Calibrations for both compounds arebased on external PhA standards. SOA upper limit contributions “asnaphthalene” can be determined from dividing the PhA values bythe SOA mass fraction from Table 4.
benzene) has also been detected. While secondary formationof glyoxal is also possible from a secondary reaction of OHwith 2-formylcinnamaldehyde, the phthaldialdehyde appearsto be formed only in the primary reaction of naphthalene.Phthaldialdehyde has been found to undergo further reactionwith OH to generate phthalic anhydride (Wang et al., 2007)which appears to be relatively stable in the absence of hy-drolysis.
45
Fig. 5. Time profiles for the TMS-derivatives of phthalic acid(ng m−3; left scale) and methylphthalic acid (right scale) during the2010 CalNex Study in Pasadena, CA. Negligible levels of phthalicacid during the periods between 23–29 May and 9–11 June 2010are indicative of the likely negligible emissions of phthalic acid andmethylphthalic acid during this study. Calibrations for both com-pounds are based on external PhA standards. SOA upper limit con-tributions “as naphthalene” can be determined from dividing thePhA values by the SOA mass fraction of 0.0199 from Table 4.
For the two methyl naphthalenes, in the addition reac-tion to the aromatic ring, OH can also react by abstract-ing a hydrogen atom (H-atom) from the substituent methylgroup. The OH rate constants for methyl naphthalenes havebeen found to be about a factor of two higher than that for
www.atmos-chem-phys.net/12/8711/2012/ Atmos. Chem. Phys., 12, 8711–8726, 2012
8722 T. E. Kleindienst et al.: The formation of SOA and chemical tracer compounds
naphthalene (Phousongphouang and Arey, 2002).Subsequentfast reactions lead to low yields of 1-naphthoic acid (e.g.,from 1-methylnaphthalene) by analogy to benzoic acid frommethyl substituted aromatic hydrocarbons. An examinationof the extracted organic aerosol indicated negligible levels ofeither 1- or 2-naphthoic acid in the particle phase. However,ring-addition reactions predominate at atmospheric tempera-tures and NO2 concentrations. Since 1-MN and 2-MN lackthe symmetry of naphthalene, additional dicarbonyl prod-ucts (i.e., methylglyoxal) can form. Thus, for OH additionto the most substituted ring of the methyl naphthalenes (ei-ther 1-MN or 2-MN), methylglyoxal and its coproduct, ph-thaldialdehyde will be formed. Reactions of phthaldialde-hyde will be identical to those of the naphthalene case andphthalic anhydride will form in the gas-phase, probably re-sulting in phthalic acid being formed in the particle phase.By contrast, if OH adds to the least substituted ring, glyoxaland its coproduct, 1-methyl-2,3-dicarbonyl benzene (or othergeometric or substitution isomers) will be formed. By anal-ogy to naphthalene, this compound via secondary reactionswill form methyl phthalic anhydride (and other geometricisomers). Mechanisms for these processes are analogous tothose for naphthalene presented by Kautzmann et al. (2010).
The formation of secondary organic aerosol from the pho-tooxidation of naphthalene has previously been shown to oc-cur both in the presence and absence of NOx (Chan et al.,2009; Kautzman et al., 2010; Shakya and Griffin, 2010).While Kautzman et al. (2010) focused on the identificationof individual chemical products in the gas and particle phase,Chan et al. (2009) considered the aerosol yield under a vari-ety of reactant conditions for naphthalene and NOx. Shakyaand Griffin (2010) also examined aerosol yields under some-what lower initial NO and in the absence of seed aerosol.
In the studies of Chan et al. (2009), aerosol yields weremeasured under high-NOx conditions with aerosol loadingsranging from 10–40 µg m−3 with evidence for semivolatilepartitioning from these experiments. Under conditions whereNOx was absent from the experiments, the products appearedto be nonvolatile and aerosol yields were found to be a con-stant regardless of the associated organic aerosol mass. Ta-ble 5 shows a comparison of the yields from the work ofChan et al. (2009) and results of the experiments in the cur-rent work. For experiments at high NOx levels, Chan etal. (2009) provide parameterization for SOA partitioning fornaphthalene as,α1 0.21,α2 1.07,K1 0.59,K2 0.0037, for thetwo product model. Aerosol yields have also been examinedby Shakya and Griffin (2010), who in the experimental yielddata they present show a nearly constant yield of 0.15 overorganic aerosol concentrations from 5–25 µg m−3, indicatingthat partitioning may be playing a minor role in the aerosolproducts generated. Nonetheless, Shakya and Griffin (2010)present parameters for a two-product model for naphthaleneSOA formation that assumes partitioning.
For 1-methylnaphthalene, and 2-methylnaphthalene, pa-rameterization for a single product model is provided withα1
0.50,K1 0.11 (for 1-MN) andα1 0.55,K1 0.13 (for 2-MN).For yields measured at high NOx, the comparison shows thatthe yields are within a factor of two when the values are com-pared at the same1MO. For the reaction in the absence ofNOx, yields for SOA formation for naphthalene between thetwo studies differ by nearly a factor of three. While yield dif-ferences are far less for the methyl naphthalenes, there is adifferent trend. For Chan et al. (2009) the SOA yields de-crease in going from naphthalene to 1-methylnaphthalene to2-methylnaphthalene whereas in the present work the yieldsincrease. In a manner consistent with then-alkane yields, theaerosol yields from experiments conducted with the cham-ber operating in a flow mode are found to be systematicallylower than those determined with the chamber operated in astatic mode, in particular for SOA formed from naphthalene.
Unlike the degradation mechanism of other more volatileVOCs, such as the C7–C9 mono and multi methyl aromatichydrocarbons, the photooxidation of naphthalene in the lab-oratory (also methylnaphthalenes and possibly other PAHs)are likely to form SOA while NO is still present in the ox-idation system to a substantial degree (e.g., Robinson et al.,2007). Thus, early generation products in this system couldbe of sufficiently low volatilities (probably from radical ter-minating reactions) to condense onto preexisting aerosol.For PAHs and monoaromatic hydrocarbons, the initial OH-addition adduct can react with NO2 to form nitro compoundsas early reaction products, which are detected in the gasphase (Nishino et al., 2008). The extent to which such com-pounds partition to form SOA could be a consideration inthis work but has not been explored. However, as seen inTable 5, the yields determined in this study at high organicloading suggest that while the gas-phase product distributionmay differ with NO2 levels, the SOA formation yields ap-pear to be insensitive to this, as seen by the NOx-free initialconditions.
Measurements of the effective enthalpy of vaporization forthe aerosol give values ranging between 15 and 20 kJ mol−1.The range of values is similar to that found for SOA dur-ing toluene photooxidation, although higher (less negative)than that of other methylated aromatic hydrocarbons, suchas the xylenes and trimethylbenzenes, which average 30 to40 kJ mol−1. Typically, precursors that generate relativelylarge yields of glyoxal, such as toluene, benzene (Martin-Reviejo and Wirtz, 2005), and acetylene (Volkamer et al.,2008), show aerosol yields that are higher than might be ex-pected for such small molecules.1H eff
vap values in the samerange were found for 1-MN and 2-MN as in the naphtha-lene system (both with and without NOx) suggesting that themethyl group plays little role in changing the volatility ofthe aerosol compared to naphthalene. It is expected that themethyl glyoxal formation is relatively low and does not im-pact the volatility of the chamber aerosol.
The OM/OC ratios for the naphthalene systems with andwithout NOx are consistent. For the NOx system, an averagevalue of 1.93 was found (n = 7; Table 3); for the NOx-free
Atmos. Chem. Phys., 12, 8711–8726, 2012 www.atmos-chem-phys.net/12/8711/2012/

T. E. Kleindienst et al.: The formation of SOA and chemical tracer compounds 8723
Table 5.Comparison of aerosol yields for SOAYSOA from PAH photooxidations for different initial NOx conditions.
PAH YSOA YSOA Shakya and YSOA(Chan et al., 2009)a (Chan et al., 2009)b Griffin (2010) (this study)
Naphthalene (high NOx) 0.24 0.49 (0.08–0.16)c avg: 0.13 0.28d
1-Methylnaphthalene (high NOx) 0.31 0.46 (0.03–0.22) 0.202-Methylnaphthalene (high NOx) 0.36 0.51 (0.04–0.13) 0.15Naphthalenee (low NOx) 0.73 0.73 – 0.281-Methylnaphthalenee (low NOx) 0.68 0.68 – 0.412-Methylnaphthalenee (low NOx) 0.58 0.58 – 0.64
a Aerosol yield at1MO 15 µg m−3; chamber operated in static mode;b aerosol yield at1MO 100 µg m−3; c1MO 4–18 µg m−3, apparent constant yield with1MO; d 0.14 ppm; CH3ONO, 0.3 ppm NO with chamber in dynamic mode, for1MO 100 µg m−3; e products found to be nonvolatile and SOA yield isconstant at all1MO.
system, values ranged between 1.9–2.3 giving an averagevalue of 2.0 1 (n = 3). While averaging the two conditionsgiven an overall average of 1.97, under relevant atmosphericconditions, the value with NOx present should be used. Val-ues in the same range were found for 1-MN and 2-MN in theNOx-free system although the number of data points is ex-tremely small and suggests that the methyl group plays littlerole in changing the oxygen content of the aerosol. At thepresent time, there does not appear to be literature data tocompare to.
As noted, phthalic anhydride has been found to form asa secondary product at relatively high yields for naphthalene(Wang et al., 2007). It seems plausible that particle-phase ph-thalic acid is generated from the hydrolysis of phthalic an-hydride (Chan et al., 2009) involving aerosol liquid wateror possibly surface-adsorbed water. We have thus exploredthe use of phthalic acid as a tracer compound representativeof SOA (and SOC) from the photooxidation of naphthaleneboth in the absence and presence of NOx. Measurements ofthe phthalic acid yield have been made leading to a massfraction of phthalic acid as given in Table 4. In this analy-sis, some caution must be exercised due to the possible ap-pearance of outliers, for example, in experiment ER 459-1the phthalic acid concentration appears to be systematicallylow using a standard based on KPA. The phthalic acid yieldscan then used in conjunction with in field samples to estimatecontributions of SOA (and SOC) from naphthalene, methyl-naphthalene, and possibly other 2-ring, gas-phase PAHs, in asource attribution approach similar to that of Kleindienst etal. (2007).
In this work, we have sought to evaluate multiple meansfor establishing PhA tracer concentrations that would allowgreater utility for using the laboratory-produced mass frac-tion values without an over reliance on specific methodsfor measuring PhA concentrations. This has been done forseveral reasons: (1) standards are readily produced for ph-thalic acid, in contrast to many tracer compounds from otherprecursors (e.g., most classes of biogenic hydrocarbons) forwhich standards are typically not available. (2) Determina-tion of tracer concentrations for phthalic acid (and methyl
phthalic acid) are generally within the method uncertaintyusing either a neat standard or a general surrogate compoundsuch as ketopinic acid, as seen in Table 4. (3) Other inves-tigators (e.g., Hu et al., 2008) have already shown the use-fulness of determining precursor contributions to secondaryorganic aerosol using alternate means of determining tracerconcentrations. These investigations have shown that the usethe laboratory-based mass fractions (e.g., Kleindienst et al.,2007) while still using their own laboratory protocols for de-termining the tracer concentrations (ng m−3) in the aerosolsample. Overall, the results have been reasonable.
Phthalic acid has been recognized as a chemical con-stituent in PM2.5 in ambient atmospheres over the pasttwenty years. Fine et al. (1994) suggested its use as a poten-tial chemical tracer, although at that time only in a qualitativesense. As discussed by Kleindienst et al. (2007) the use of achemical constituent as a tracer compound for secondary or-ganic aerosol using the mass fraction approach is subject to anumber of potential uncertainties including: (1) the possibil-ity that the tracer compound(s) also has a primary source; (2)laboratory mass fractions are different from those found inambient air; (3) secondary reaction of the tracer compound;(4) filter uptake of gas-phase compounds that can be con-verted to the chemical tracer; (5) differences in mass frac-tions from other 2-ring PAHs contributing to the observedPhA levels; and (6) the possibility of the gas-phase hydrol-ysis of phthalic anhydride which could make the tracer con-centration be sensitive to the relative humidity in the ambi-ent environment. The final point is unique to phthalic acidsince the anhydride form of other acidic tracers is generallynot recognized though theoretically possible for some of thetracer compounds (Kleindienst et al., 2007).
Conditions and results for tracer measurements have al-ready been presented for the SEARCH sites (Kleindienstet al., 2010a) with the contribution of PAHs using phthalicacid recently being added to the total aerosol masses (SOAor SOC; Kleindienst et al., 2010b). Notably, these findingshelped reduce a negative intercept (Kleindienst et al., 2010a;Fig. 1) from a plot of OC vs. reconstructed OC from pri-mary and secondary SOC. In the derivatized spectra of the
www.atmos-chem-phys.net/12/8711/2012/ Atmos. Chem. Phys., 12, 8711–8726, 2012
8724 T. E. Kleindienst et al.: The formation of SOA and chemical tracer compounds
SEARCH sites, while there was clear evidence for the pres-ence of phthalic acid, there was no evidence for any of theMPhA isomers which were detected in laboratory irradia-tions. An examination of derivatized spectra from the 2005SOAR study (Docherty et al., 2008) showed the presence ofPeak 4 of methylphthalic acid, 2MPhA-2 as seen in Fig. 3.For the eight periods that samples were taken, methylphthalicacid was clearly detected from the derivatized extracts fromeach of those periods as seen in Fig. 4.
Finally, measurements were made for phthalic andmethylphthalic acid during the 2010 CalNex Study (Washen-felder et al., 2011). Figure 5 presents values of phthalic acidin Pasadena, CA during a one-month period which show val-ues as high as 19 ng m−3 during periods when the organiccarbon was also at its highest level during the study. Also no-tably, during several periods of low apparent photochemicalactivity, phthalic acid was at or below the detection limit es-timated at 0.1 ng m−3 for the sampling volumes taken. To theextent that there are primary emissions of phthalic acid, theyprobably contribute on the order of 0.1 ng m−3 to the PhAmass on the filter. One of these period (23–29 May 2010)of PhA measurements near or below the detection limit in-cludes both the weekend and weekdays. Thus, while primarysources of phthalic acid are possible, they do not appear to beimportant during the present study. The SOC source appor-tionment values for PAH SOA (as naphthalene) during thisstudy period using an average mass fraction of 0.0199 (withNOx) ranged from below the detection limit to 0.49 µgC m−3
as an upper limit. Using the OM/OC ratio (1.93 presentedearlier) the SOA contribution due to PAHs (as naphthalene)give a level of 1.0 µg m−3. The average contribution of SOCduring the study using this approach was 0.10 µgC m−3 whilean SOA average of 0.19 µg m−3 was determined.
The present experiments and field measurements illustratethe difficulty and confounding factors involved in the useof chemical tracers for estimating specific source attribution.Kautzman et al. (2010) have discussed other possible chem-ical tracers for secondary organic aerosol from naphthalenephotooxidation including naphthol. However, to have utilityas a chemical tracer, an approach for using it at ambient lev-els in a practical manner is needed. As noted in Kleindienstet al. (2007), the use of chemical tracers for estimation ofsecondary organic aerosol source attribution using the tech-niques described herein, while subject to numerous uncer-tainties, can play an important role in determining whether ahydrocarbon or class of hydrocarbons are significant contrib-utors to ambient aerosol.
5 Summary
1. Phthalic acid is readily produced during the photoox-idation of naphthalene in both the presence and ab-sence of NOx. Under the conditions of these experi-ments, the mass fraction of SOA for phthalic acid in
the presence of NOx is 0.0199 ± 0.0084 and in the ab-sence of NOx is 0.0188 ± 0.0027, where calibration fac-tors have been based on PhA standards. Following ourprior approach using ketopinic acid for calibration, themass fractions are 0.0206 ± 0.0092 in the presence ofNOx and 0.0158 ± 0.0010 in the absence of NOx. Theseuncertainties represent the reproducibility of the ex-periments for the conditions selected and do not in-clude other possible systematic errors. From the aver-age OM/OC value of 1.93, an SOC mass fraction is de-termined using this value as a multiplicative factor withthe SOA listed mass fractions.
2. The mass fractions reported herein have been applied toambient data at CalNex to estimate the the 2-ring PAHcontribution to SOC ranges from below the detectionlimit to levels as high as 0.49 µgC m−3. At the presenttime, these values must be considered upper limits dueto the possible contribution of primary emissions of ph-thalic acid or from the hydrolysis of atmospheric ph-thalic anhydride. Additional uncertainties of the massfraction approach for 2-ring PAHs follow those thathave already been discussed in Kleindienst et al. (2007).
3. Phthalic acid and methylphthalic acid are detected inboth laboratory and field samples. For methylphthalicacid, preferential ring scission on the most substitutedaromatic ring leads to phthalic anhydride. Since 2-ring PAH contributions are given “as naphthalene” anymethylnaphthalene contributions are already includedin the naphthalene attribution.
4. Mass fractions for phthalic acid were determined us-ing calibrations based on the pure compound, as wellas on ketopinic acid (KPA). The two approaches wereused for consistency with previous work (Kleindienst etal., 2007) while recognizing that where authentic stan-dards exist, calibrations from those compounds providethe most self consistent means for attributing sourcesunder atmospheric concentrations.
Acknowledgements.The authors wish to thank J. J. Schauer of theUniversity of Wisconsin – Madison for providing the filter samplesused from the SOAR Study. The US Environmental ProtectionAgency through its Office of Research and Development fundedand collaborated in the research described here under ContractEP-D-10-070 to Alion Science and Technology. The manuscriptis subjected to external peer review and has been cleared forpublication. Mention of trade names or commercial products doesnot constitute an endorsement or recommendation for use.
Edited by: R. McLaren
Atmos. Chem. Phys., 12, 8711–8726, 2012 www.atmos-chem-phys.net/12/8711/2012/

T. E. Kleindienst et al.: The formation of SOA and chemical tracer compounds 8725
References
Biermann, H. W., Mac Leod, H, Atkinson, R., Winer, A. M., andPitts Jr., J. N.: Kinetics of the gas-phase reactions of the OHradical-initiated reactions of naphthalene and the C1- and C2-alkylnaphthalenes, Environ. Sci. Technol., 41, 2803–2810, 2007.
Birch, M. E. and Cary, R. A.: Elemental carbon-based method formonitoring occupational exposures to particulate diesel exhaust,Aerosol Sci. Technol., 25, 221–241, 1996.
California Air Resources Board: Ambient Concentrations of Poly-cyclic Aromatic Hydrocarbons (PAHs) at Selected Locations inCalifornia, Research Note No. 89-1, 1989.
Chan, A. W. H., Kautzman, K. E., Chhabra, P. S., Surratt, J. D.,Chan, M. N., Crounse, J. D., Kurten, A., Wennberg, P. O.,Flagan, R. C., and Seinfeld, J. H.: Secondary organic aerosolformation from photooxidation of naphthalene and alkylnaph-thalenes: implications for oxidation of intermediate volatility or-ganic compounds (IVOCs), Atmos. Chem. Phys., 9, 3049–3060,doi:10.5194/acp-9-3049-2009, 2009.
Claeys, M., Szmigielski, R., Kourtchev, I., Van der Veken, P.,Vermeylen, R., Maenhaut, W., Jaoui, M., Kleindienst, T. E.,Lewandowski, M., Offenberg, J. H., and Edney, E. O.: Hy-droxydicarboxylic acids: Markers for secondary organic aerosolfrom the photooxidation ofα-pinene, Environ. Sci. Technol., 41,6828–6834, 2007.
deGouw, J. A., Middlebrook, A. M., Warneke, C., Goldan, P.D., Kuster, W. C., Roberts, J. M., Fehsenfeld, F. C., Worsnop,D. R., Canagaratna, M. R., Pszenny, A. A. P., Keene, W. C.,Marchewka, M., Bertman, S. B., and Bates, T. S.: Budget of or-ganic carbon in a polluted atmosphere: Results from the NewEngland Air Quality Study in 2002, J. Geophys. Res., 110,D16305, doi.10.1029/2004JD005623, 2005.
deGouw, J. A., Brock, C. A., Atlas, E. L., Bates, T. S., Fehsen-feld, F. C., Goldan, P. D., Holloway, J. S., Kuster, W. C., Lerner,B. M., Matthew, B. M., Middlebrook, A. M., Onasch, T. B.,Peltier, R. E., Quinn, P. K., Senff, C. J., Stohl, A., Sullivan, A.P., Trainer, M., Warneke, C., Weber, R. J., and Williams, E. J.:Sources of particulate matter in the northeastern United Statesin summer: 1. Direct emissions and secondary formation of or-ganic matter in urban plumes, J. Geophys. Res., 113, D08301,doi:10.1029/2007JD009243, 2008.
Docherty, K. S., Stone, E. A., Ulbrich, I. M., DeCarlo, P. F., Snyder,D. C., Schauer, J. J., Peltier, R. E., Weber, R. J., Murphy, S. M.,Seinfeld, J. H., Grover, B. D., Eatough, D. J., and Jimenez, J.L.: Apportionment of Primary and secondary organic aerosols inSouthern California during the 2005 Study of Organic Aerosolsin Riverside (SOAR-1), Environ. Sci. Technol., 42, 7655–7662,2008.
Edney, E. O., Kleindienst, T. E., Jaoui, M., Lewandowski, M., Of-fenberg, J. H., Wang, W., and Claeys, M.: Formation of 2-methyltetrols and 2-methylglyceric acid in secondary organic aerosolfrom laboratory irradiated isoprene/NOx/SO2/air mixtures andtheir detection in ambient PM2.5 samples collected in the easternU.S., Atmos. Environ., 39, 5281–5289, 2005.
Fine, P. M., Chakrabarti, B., Krudysz, M., Schauer, J. J., andSioutas, C.: Diurnal variations of individual organic compoundconstituents of ultrafine and accumulation mode particulate mat-ter in the Los Angeles basin, Environ. Sci. Technol., 38, 1296–1304, 2004.
Fraser, M. P., Cass, G. R., and Simoneit, B. R. T.: Air quality modelevaluation data for organics. 6. C3-C24 organic acids, Environ.Sci. Technol., 37, 446–453, 2003.
Gundel, L. A., Lee, V. C., Mahanama, K. R. R., Stevens, R. K.,and Daisey, J. M.: Direct determination of the phase distributionof semi-volatile polycyclic aromatic hydrocarbons using annulardenuders, Atmos. Environ., 29, 1719–1733, 1995.
Hallquist, M., Wenger, J. C., Baltensperger, U., Rudich, Y., Simp-son, D., Claeys, M., Dommen, J., Donahue, N. M., George,C., Goldstein, A. H., Hamilton, J. F., Herrmann, H., Hoff-mann, T., Iinuma, Y., Jang, M., Jenkin, M. E., Jimenez, J. L.,Kiendler-Scharr, A., Maenhaut, W., McFiggans, G., Mentel, Th.F., Monod, A., Prevot, A. S. H., Seinfeld, J. H., Surratt, J. D.,Szmigielski, R., and Wildt, J.: The formation, properties and im-pact of secondary organic aerosol: current and emerging issues,Atmos. Chem. Phys., 9, 5155–5236,doi:10.5194/acp-9-5155-2009, 2009.
Heald, C. L., Jacobs, D. J., Park, R. J., Russell, L. M., Huebert, B. J.,Seinfeld, J. H., Liao, H., and Weber, R. J.: A large organic aerosolsource in the free troposphere missing from current models, Geo-phy. Res. Lett., 32, L18809,doi:10.1029/2005GL023831, 2005.
Hu, D., Bian, Q., Li, T. W. Y., Lau, A. K. H., and Yu, J.Z., Contributions of isoprene, monoterpenes,β-caryophyllene,and toluene to secondary organic aerosols in Hong Kong dur-ing the Summer of 2006, J. Geophys. Res., 113, D22206,doi:10.1029/2008JD010437, 2008.
Jaoui, M., Kleindienst, T. E., Lewandowski, and Edney, E. O.: Iden-tification and quantification of aerosol polar oxygenated com-pounds bearing carboxylic or hydroxyl groups. 1. Method de-velopment, Anal. Chem., 76, 4765–4778, 2004.
Jaoui, M., Kleindienst, T. E., Lewandowski, M., Offenberg, J. H.,and Edney, E. O.: Identification and quantification of aerosolpolar oxygenated compounds bearing carboxylic or hydroxylgroups. 2. Organic tracer compounds from monoterpenes, En-viron. Sci. Technol., 39, 5661–5673, 2005.
Jaoui, M., Lewandowski, M., Kleindienst, T. E., Offenberg, J. H.,and Edney, E. O.: beta-caryophyllinic acid: An atmospherictracer for beta-caryophyllene secondary organic aerosol, Geo-phys. Res. Lett., 34, L05816,doi:10.1029/2006GL028827, 2007.
Kautzman, K. E., Surratt, J. D., Chan, M. N., Chan, A. W. H.,Hersey, S. P., Chhabra, P. S., Dalleska, N. F., Wennberg, P. O.,Flagan, R. C., and Seinfeld, J. H.: Chemical composition of gas-and aerosol-phase products from the photooxidation of naphtha-lene, J. Phys. Chem. A, 114, 913–934, 2010.
Kleindienst, T. E., Conver, T. S., McIver, C. D., and Edney, E. O.:Determination of secondary organic aerosol products from thephotooxidation of toluene and their implication in PM2.5, J. At-mos. Chem., 47, 79–100, 2004.
Kleindienst, T. E., Jaoui, M., Lewandowski, M., Offenberg, J. H.,Lewis, C. W., Bhave, P. V., and Edney, E. O.: Estimates of thecontributions of biogenic and anthropogenic hydrocarbons tosecondary organic aerosol at a southeastern US location, Atmos.Environ., 41, 8288–8300, 2007.
Kleindienst, T. E., Lewandowski, M., Offenberg, J. H., Jaoui, M.,and Edney, E. O.: The formation of secondary organic aerosolfrom the isoprene + OH reaction in the absence of NOx, At-mos. Chem. Phys., 9, 6541–6558,doi:10.5194/acp-9-6541-2009,2009.
www.atmos-chem-phys.net/12/8711/2012/ Atmos. Chem. Phys., 12, 8711–8726, 2012

8726 T. E. Kleindienst et al.: The formation of SOA and chemical tracer compounds
Kleindienst, T. E., Lewandowski, M., Offenberg, J. H., Edney, E. O.,Jaoui, M., Zheng, M., Ding, X., and Edgerton, E. S.: Contributionof primary and secondary sources to organic aerosol and PM2.5at SEARCH Network Sites, J. Air Waste Manage. Assoc., 60,1388–1399, 2010a.
Kleindienst, T. E., Lewandowski, M., Offenberg, J. H., Jaoui, M.,and Docherty, K. S.: Investigations of tracers from naphthaleneand its methyl analogs. Presented at the annual conference of theAmerican Association for Aerosol Research Annual Conference,Portland, OR, 24–28 October, 2010b.
Lewandowski, M., Jaoui, M., Offenberg, J. H., Kleindienst, T. E.,Edney, E. O., Sheesley, R. J., and Schauer, J. J.: Primary andsecondary contribution to ambient PM in the Midwestern UnitedStates, Environ. Sci. Technol., 42, 3303–3309, 2008.
Martin-Reviejo, M. and Wirtz, K.: Is benzene a precursor for sec-ondary organic aerosol?, Environ. Sci. Technol., 39, 1045–1054,2005.
Nishino, N., Arey, J., and Atkinson, R.: Formation of nitro prod-ucts from the gas-phase OH radical-initiated reactions of toluene,naphthalene, and biphenyl: Effect of NO2 concentration, Envi-ron. Sci. Technol., 42, 9203–9209, 2008.
Nishino, N., Arey, J., and Atkinson, R.: Yields of glyoxal and ring-cleavage co-products from the OH radical initiated reactions ofnaphthalene and selected alkylnaphthalenes, Environ. Sci. Tech-nol., 43, 8554–8560, 2009a.
Nishino, N., Arey, J., and Atkinson, R.: Formation and reactions of2-formylcinnamaldehyde in the OH radical-initiated reaction ofnaphthalene, Environ. Sci. Technol. 43, 1349–1353, 2009b.
Odum, J. R., Hoffmann, T., Bowman, F., Collins, D., Flagan, R.C., and Seinfeld, J. H.: Gas/particle partitioning and secondaryorganic aerosol yields, Environ. Sci. Technol., 30, 2580–2585,1996.
Offenberg, J. H., Kleindienst, T. E., Jaoui, M., Lewandowski,M., and Edney, E. O.: Thermal properties of sec-ondary organic aerosol, Geophys. Res. Lett., 33, L03816,doi:10.1029/2005GL024623, 2006.
Phousongphouang, P. T. and Arey, J.: Rate constants for the gas-phase reactions of a series of alkylnaphthalenes with the OH rad-ical, Environ. Sci. Technol., 36, 1947–1952, 2002.
Pio, C., Alves, C., and Duarte, A.: Organic components of aerosolsin a forested area of central Greece, Atmos. Environ., 35, 389–401, 2001.
Pun, B. K., Wu, S.-Y., Seigneur, C., Seinfeld, J. H., Grif-fin, R. J., and Pandis, S. N.: Uncertainties in modeling sec-ondary organic aerosols: Three-dimensional modeling studies inNashville/Western Tennessee, Environ. Sci. Technol., 37, 3747–3761, 2003.
Reisen, F. and Arey, J.: Atmospheric Reactions Influence SeasonalPAH and Nitro-PAH Concentrations in the Los Angeles Basin,Environ. Sci. Technol., 39, 64–73, 2005.
Robinson, A. L., Donahue, N. M., Shrivastava, M. K., Weitkamp,E. A., Sage, A. M., Grieshop, A. P., Lane, T. E., Pierce, J. R., andPandis, S. N.: Rethinking organic aerosols: Semivolatile emis-sions and photochemical aging, Science, 315, 1259–1262, 2007.
Sasaki, J., Aschmann, S. M., Kwok, E. S. C., Atkinson, R., andArey, J.: Products of the gas-phase OH and NO3 radical-initiatedreactions of naphthalene, Environ. Sci. Technol., 31, 3173–3179,1997.
Schauer, J. J., Rogge, W. F., Hildemann, L. M., Mazurek, M. A.,and Cass, G. R.: Source apportionment of airborne particulatematter using organic compounds as tracers, Atmos. Environ., 30,3837–3855, 1996.
Schauer, J. J., Kleeman, M. J., Cass, G. R., and Simoneit, B. R.T.: Measurement of emissions from air pollution sources. 2.C1 through C30 organic compounds from medium duty dieseltrucks, Environ. Sci. Technol., 33, 1578–1587, 1999.
Schauer, J. J., Fraser, M. P., Cass, G. R., and Simoneit, B. R.T., Source reconciliation of atmospheric gas-phase and particlephase pollutants during a severe photochemical smog episode,Environ. Sci. Technol., 36, 3806–3814, 2002.
Shakya, K. M. and Griffin, R. J., Secondary organic aerosol fromthe photooxidation of polycyclic aromatic hydrocarbons, Envi-ron. Sci. Technol., 44, 8134–8139, 2010.
Stone, E. A., Zhou, J., Snyder, D. C., Rutter, A. P., Mieritz, M., andSchauer, J. J.: A comparison of summertime secondary organicaerosol source contributions at contrasting urban locations, Env-iron. Sci. Technol., 43, 3448–3454, 2009.
Szmigielski, R., Surratt, J. D., Yadian Gomez-Gonzalez, Y., Vander Veken, P., Kourtchev, I., Vermeylen, R., Blockhuys, F.,Jaoui, M., Kleindienst, T. E., Lewandowski, M., Offenberg, E.O., Seinfeld, J. H., Maenhaut, W., and Claeys, M.: 3-Methyl-1,2,3-butanetricarboxylic acid: An atmospheric tracer for ter-pene secondary organic aerosol, J. Geophys. Res., 34, L24811,doi:10.1029/2007GL031338, 2007.
Volkamer, R., San Martini, F., Molina, L. T., Salcedo, D., Jimenez,J. L., and Molina, M. J.: A missing sink for gas-phase glyoxal inMexico City: Formation of secondary organic aerosol, Geophys.Res. Lett., 34, L19807,doi:10.1029/2007GL030752, 2007.
Wang, L., Atkinson, R., and Arey, J.: Dicarbonyl products of the OHradical-initiated reactions of naphthalene and the C1- and C2-alkylnaphthalenes, Environ. Sci. Technol., 41, 2803–2810, 2007.
Washenfelder, R. A., Young, C. J., Brown, S. S., Angevine, W. M.,Etlas, E. L., Blake, D. R., Bon, D. M., Cubison, M. J., de Gouw, J.A., Dusanter, S., Flynn, J., Gilman, J. B., Graus, M., Griffith, S.,Grossberg, N., Hayes, P. L., Jimenez, J. L., Kuster, W. C., Lefer,B. L., Pollack, I. B., Ryerson, T. B., Stark, H., Stevens, P. S., andTrainer, M. K.: The glyoxal budget and its contribution to organicaerosol for Los Angeles, California, during CalNex 2010, J. Geo-phys. Res., 116, D00V02,doi:10.1029/2011JD016314, 2011.
Atmos. Chem. Phys., 12, 8711–8726, 2012 www.atmos-chem-phys.net/12/8711/2012/