THE FORESEE EXPERIENCE INDEX (FXI): TOP 100 … FORESEE EXPERIENCE INDEX (FXI): TOP 100 BRANDS...
50
© 2013 ForeSee THE FORESEE EXPERIENCE INDEX (FXI): TOP 100 BRANDS EDITION
Transcript of THE FORESEE EXPERIENCE INDEX (FXI): TOP 100 … FORESEE EXPERIENCE INDEX (FXI): TOP 100 BRANDS...
© 2013 ForeSee
THE FORESEE EXPERIENCE INDEX (FXI):TOP 100 BRANDS EDITION
THE FORESEE EXPERIENCE INDEX (FXI): TOP 100 BRANDS EDITION 2
CONTENTSExecutive Summary …………………………..................................................................................... 3
Introduction …………………………................................................................................................ 4
Top Brands …………………………................................................................................................. 7
Industry Categories
Automotive …………………………......................................................................................... 13
CPG ………………………….................................................................................................... 17
Financial Services ........................................…………………………........................................ 21
Retail & Apparel ..........................................…...……………………......................................... 25
Technology & Electronics ........................................……..…………......................................... 30
Media & Entertainment ........................................…..…..…………......................................... 35
Hospitality & Food Services ........................................……..…………...................................... 38
Miscellaneous ........................................………………………....…......................................... 41
Appendix A …………..............………………..................................................................................... 45
ABOUT THIS STUDY
The ForeSee Experience Index measures the customer experience with the top brands ranked by brand value, as
reported by Interbrand. During the course of the year, ForeSee collected data from more than 75,000 respondents
who have recently purchased or done business with the top global brands. The satisfaction scores in this specific
report reflect data collected over the last quarter from October 11th to 16th and covers 25,000 surveys collected.
The ForeSee predictive methodology measures the customer experience and the likelihood of customers to engage
in desired future behaviors such as Retention, Upsell, and Recommend. Satisfaction data were collected via
panel—a nationwide group of 1.3 million consumer households that have agreed to participate in opt-in
surveys—and analyzed using the ForeSee® CXASM methodology.
THE FORESEE EXPERIENCE INDEX (FXI): TOP 100 BRANDS EDITION 3
EXECUTIVE SUMMARY
Based on more than 25,000 surveys of customers of the biggest brands, key findings of this first
ForeSee Experience Index include:
> Satisfaction among the top brands is high: The average score for the companies measured
in this index is 80 on the study’s 100-point scale—typically considered the benchmark for
excellence by ForeSee.
> Amazon is the head of the class: Amazon continues to show that it is the consummate
customer experience leader on the web and in mobile. Therefore, it is no surprise that Amazon is
the leader at the brand level as well with an 87. However, in this study they have plenty of company
at the top with 12 other brands reaching to within three points of the leader; two of them
(Avon and Nordstrom) lag just one point behind.
> Automotive and CPG score highest: When looking at how various industries compare, the
Automotive and Consumer Packaged Goods (CPG) industries score highest in customer satisfaction
(tied at 82), followed by Retail & Apparel (81) and Technology & Electronics (80). The Financial
Services category registers at the bottom of the scale with an average score of 75.
> Satisfaction matters: When we compare the future behaviors of highly satisfied customers to less-
satisfied customers, we find that highly satisfied customers report being:
– 75% more likely to prefer the brand overall;
– 60% more likely to do business with the company;
– 83% more likely to purchase more;
– 63% more likely to purchase from the brand the next time they are in the market for
a similar product or products;

THE FORESEE EXPERIENCE INDEX (FXI): TOP 100 BRANDS EDITION 4
– 77% more likely to give the brand a positive recommendation to others; and
– 76% more likely to trust the brand in general.
> What is driving satisfaction: As much as satisfaction drives future behaviors, there are elements
that drive satisfaction and, therefore, affect customers’ future behaviors. At the aggregate level, the
Product element (which measures the appeal, uniqueness, and quality of products) was the top
priority for 45% of the brands in this study, while the Service element (which measures the quality
and reliability of services) was the top priority for 35% of the brands.
INTRODUCTION
A good customer experience is a critical driver of financial success, so it should be measured and
managed the right way.
Any executive will state that customer satisfaction is an important factor in running his or her business, be it
at the forefront of the brand’s strategy or just a motivational concept in a training binder buried somewhere
in the company vaults. But how many leaders truly have their finger on the pulse of the customer experience
and can quantify how the customer experience impacts profits, sales, loyalty, and recommendations?
Whether executives know it or not, their customers have evolved to a point where they’re in charge. They
can buy anything, anywhere, anytime. Technology has made them smarter than ever before. Social media
has given them a voice and a megaphone to broadcast their opinions. And, with more choices of brands
and ways to engage with them (web, mobile, contact center, store/location, social media, email, etc.) at their
disposal, it’s easier than ever to switch whenever they deem necessary.
THE FORESEE EXPERIENCE INDEX (FXI): TOP 100 BRANDS EDITION 5
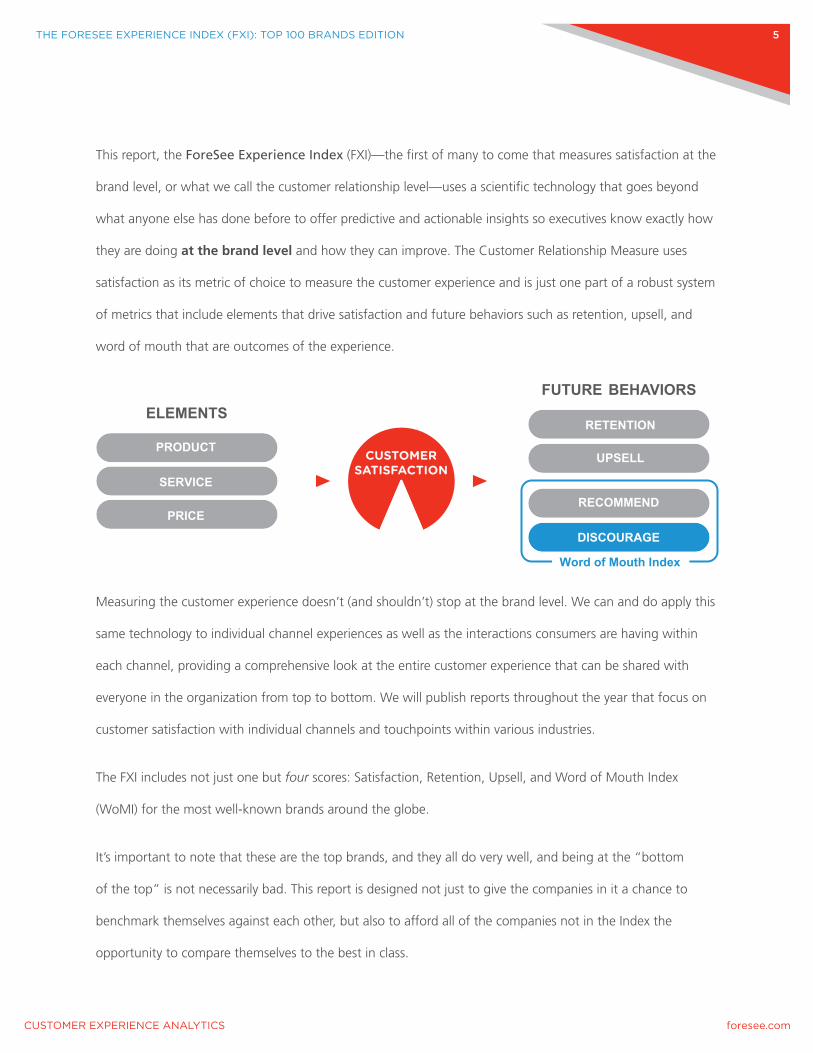
This report, the ForeSee Experience Index (FXI)—the first of many to come that measures satisfaction at the
brand level, or what we call the customer relationship level—uses a scientific technology that goes beyond
what anyone else has done before to offer predictive and actionable insights so executives know exactly how
they are doing at the brand level and how they can improve. The Customer Relationship Measure uses
satisfaction as its metric of choice to measure the customer experience and is just one part of a robust system
of metrics that include elements that drive satisfaction and future behaviors such as retention, upsell, and
word of mouth that are outcomes of the experience.
Measuring the customer experience doesn’t (and shouldn’t) stop at the brand level. We can and do apply this
same technology to individual channel experiences as well as the interactions consumers are having within
each channel, providing a comprehensive look at the entire customer experience that can be shared with
everyone in the organization from top to bottom. We will publish reports throughout the year that focus on
customer satisfaction with individual channels and touchpoints within various industries.
The FXI includes not just one but four scores: Satisfaction, Retention, Upsell, and Word of Mouth Index
(WoMI) for the most well-known brands around the globe.
It’s important to note that these are the top brands, and they all do very well, and being at the “bottom
of the top” is not necessarily bad. This report is designed not just to give the companies in it a chance to
benchmark themselves against each other, but also to afford all of the companies not in the Index the
opportunity to compare themselves to the best in class.
CUSTOMERSATISFACTION
FUTURE BEHAVIORSELEMENTS
PRODUCT
SERVICE
PRICE
RETENTION
UPSELL
RECOMMEND
DISCOURAGE
Word of Mouth Index

THE FORESEE EXPERIENCE INDEX (FXI): TOP 100 BRANDS EDITION 6
BY THE NUMBERS
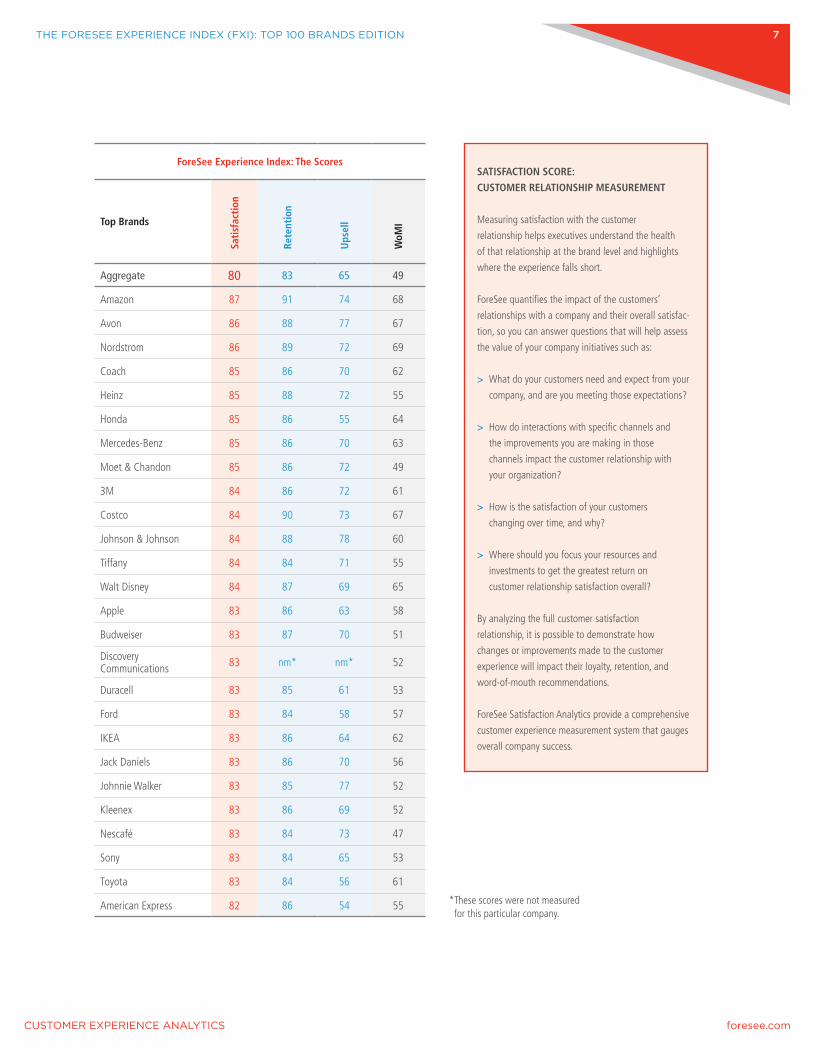
The following chart shows Satisfaction with the customer experience for the top global brands. Also shown
are the future behavior scores for Retention and Upsell, which are outcomes (or results) of the customer
experience. Finally, ForeSee provides a Word of Mouth Index (WoMI) score that takes into consideration both
positive and negative word of mouth. All of these scores are critical to business success and together provide
a comprehensive look at the customer experience.
The following table shows scores for the top brands in decreasing order of satisfaction. Tables organized by
industry categories can be found later in the report.
Industry Categories:
Automotive
CPG
Financial Services
Retail & Apparel
Technology & Electronics
Media & Entertainment
Hospitality & Food Services
Miscellaneous
THE FORESEE EXPERIENCE INDEX (FXI): TOP 100 BRANDS EDITION 7
ForeSee Experience Index: The Scores
Top BrandsSa
tisf
acti
on
Rete
ntio
n
Ups
ell
WoM
I
Aggregate 80 83 65 49
Amazon 87 91 74 68
Avon 86 88 77 67
Nordstrom 86 89 72 69
Coach 85 86 70 62
Heinz 85 88 72 55
Honda 85 86 55 64
Mercedes-Benz 85 86 70 63
Moet & Chandon 85 86 72 49
3M 84 86 72 61
Costco 84 90 73 67
Johnson & Johnson 84 88 78 60
Tiffany 84 84 71 55
Walt Disney 84 87 69 65
Apple 83 86 63 58
Budweiser 83 87 70 51
Discovery Communications 83 nm* nm* 52
Duracell 83 85 61 53
Ford 83 84 58 57
IKEA 83 86 64 62
Jack Daniels 83 86 70 56
Johnnie Walker 83 85 77 52
Kleenex 83 86 69 52
Nescafé 83 84 73 47
Sony 83 84 65 53
Toyota 83 84 56 61
American Express 82 86 54 55
SATISFACTION SCORE:
CUSTOMER RELATIONSHIP MEASUREMENT
Measuring satisfaction with the customer
relationship helps executives understand the health
of that relationship at the brand level and highlights
where the experience falls short.
ForeSee quantifies the impact of the customers’
relationships with a company and their overall satisfac-
tion, so you can answer questions that will help assess
the value of your company initiatives such as:
> What do your customers need and expect from your
company, and are you meeting those expectations?
> How do interactions with specific channels and
the improvements you are making in those
channels impact the customer relationship with
your organization?
> How is the satisfaction of your customers
changing over time, and why?
> Where should you focus your resources and
investments to get the greatest return on
customer relationship satisfaction overall?
By analyzing the full customer satisfaction
relationship, it is possible to demonstrate how
changes or improvements made to the customer
experience will impact their loyalty, retention, and
word-of-mouth recommendations.
ForeSee Satisfaction Analytics provide a comprehensive
customer experience measurement system that gauges
overall company success.
* These scores were not measured for this particular company.
THE FORESEE EXPERIENCE INDEX (FXI): TOP 100 BRANDS EDITION 8
ForeSee Experience Index: The Scores (continued from page 7)
Top BrandsSa
tisf
acti
on
Rete
ntio
n
Ups
ell
WoM
I
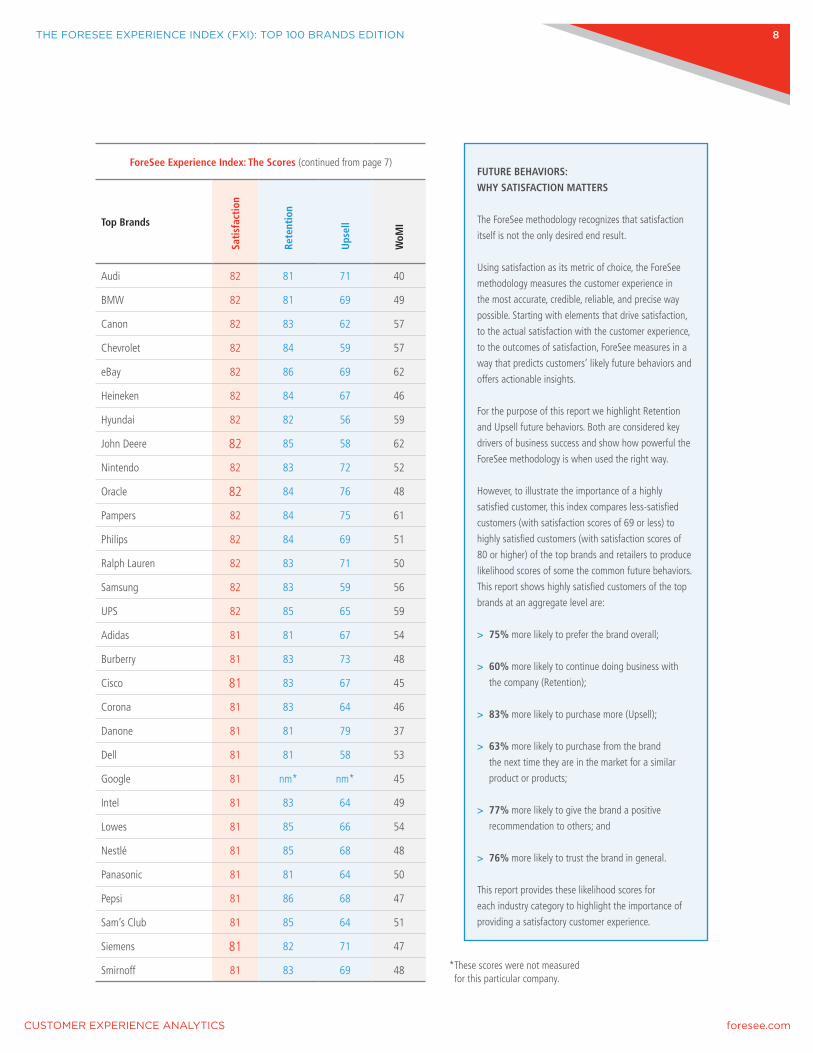
Audi 82 81 71 40
BMW 82 81 69 49
Canon 82 83 62 57
Chevrolet 82 84 59 57
eBay 82 86 69 62
Heineken 82 84 67 46
Hyundai 82 82 56 59
John Deere 82 85 58 62
Nintendo 82 83 72 52
Oracle 82 84 76 48
Pampers 82 84 75 61
Philips 82 84 69 51
Ralph Lauren 82 83 71 50
Samsung 82 83 59 56
UPS 82 85 65 59
Adidas 81 81 67 54
Burberry 81 83 73 48
Cisco 81 83 67 45
Corona 81 83 64 46
Danone 81 81 79 37
Dell 81 81 58 53
Google 81 nm* nm* 45
Intel 81 83 64 49
Lowes 81 85 66 54
Nestlé 81 85 68 48
Panasonic 81 81 64 50
Pepsi 81 86 68 47
Sam’s Club 81 85 64 51
Siemens 81 82 71 47
Smirnoff 81 83 69 48
FUTURE BEHAVIORS:
WHY SATISFACTION MATTERS
The ForeSee methodology recognizes that satisfaction
itself is not the only desired end result.
Using satisfaction as its metric of choice, the ForeSee
methodology measures the customer experience in
the most accurate, credible, reliable, and precise way
possible. Starting with elements that drive satisfaction,
to the actual satisfaction with the customer experience,
to the outcomes of satisfaction, ForeSee measures in a
way that predicts customers’ likely future behaviors and
offers actionable insights.
For the purpose of this report we highlight Retention
and Upsell future behaviors. Both are considered key
drivers of business success and show how powerful the
ForeSee methodology is when used the right way.
However, to illustrate the importance of a highly
satisfied customer, this index compares less-satisfied
customers (with satisfaction scores of 69 or less) to
highly satisfied customers (with satisfaction scores of
80 or higher) of the top brands and retailers to produce
likelihood scores of some the common future behaviors.
This report shows highly satisfied customers of the top
brands at an aggregate level are:
> 75% more likely to prefer the brand overall;
> 60% more likely to continue doing business with
the company (Retention);
> 83% more likely to purchase more (Upsell);
> 63% more likely to purchase from the brand
the next time they are in the market for a similar
product or products;
> 77% more likely to give the brand a positive
recommendation to others; and
> 76% more likely to trust the brand in general.
This report provides these likelihood scores for
each industry category to highlight the importance of
providing a satisfactory customer experience.
* These scores were not measured for this particular company.
THE FORESEE EXPERIENCE INDEX (FXI): TOP 100 BRANDS EDITION 9
ForeSee Experience Index: The Scores (continued from page 8)
Top BrandsSa
tisf
acti
on
Rete
ntio
n
Ups
ell
WoM
I
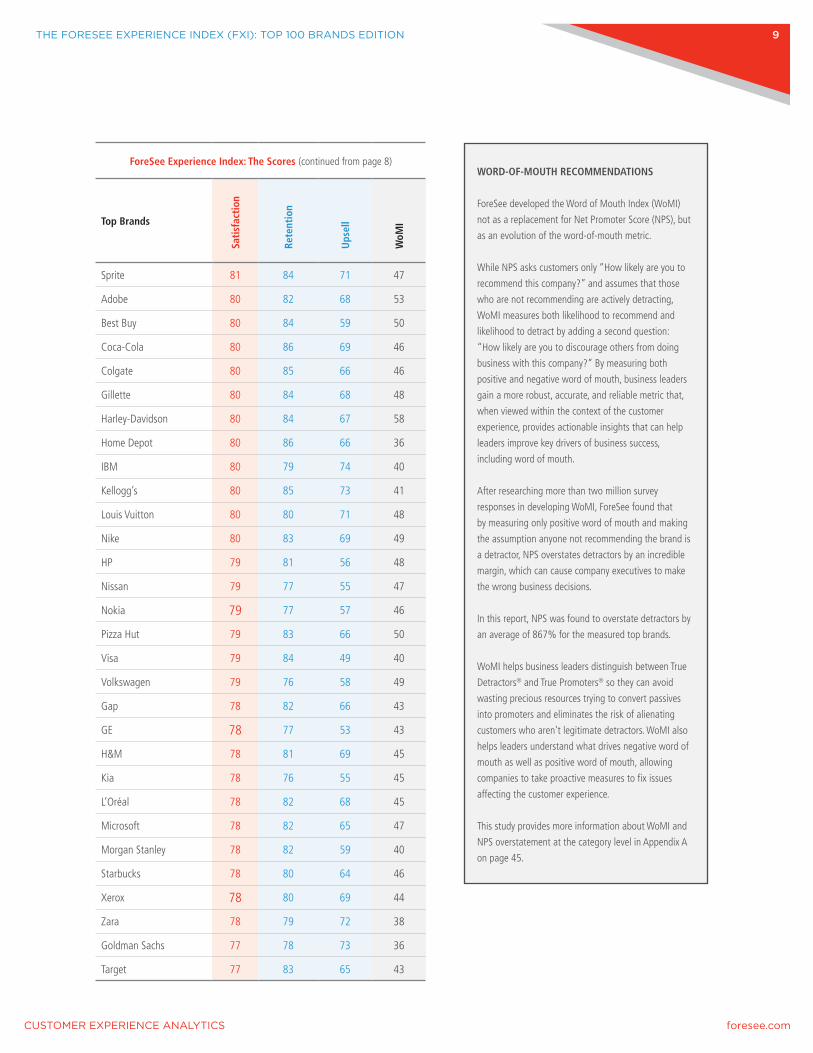
Sprite 81 84 71 47
Adobe 80 82 68 53
Best Buy 80 84 59 50
Coca-Cola 80 86 69 46
Colgate 80 85 66 46
Gillette 80 84 68 48
Harley-Davidson 80 84 67 58
Home Depot 80 86 66 36
IBM 80 79 74 40
Kellogg’s 80 85 73 41
Louis Vuitton 80 80 71 48
Nike 80 83 69 49
HP 79 81 56 48
Nissan 79 77 55 47
Nokia 79 77 57 46
Pizza Hut 79 83 66 50
Visa 79 84 49 40
Volkswagen 79 76 58 49
Gap 78 82 66 43
GE 78 77 53 43
H&M 78 81 69 45
Kia 78 76 55 45
L’Oréal 78 82 68 45
Microsoft 78 82 65 47
Morgan Stanley 78 82 59 40
Starbucks 78 80 64 46
Xerox 78 80 69 44
Zara 78 79 72 38
Goldman Sachs 77 78 73 36
Target 77 83 65 43
WORD-OF-MOUTH RECOMMENDATIONS
ForeSee developed the Word of Mouth Index (WoMI)
not as a replacement for Net Promoter Score (NPS), but
as an evolution of the word-of-mouth metric.
While NPS asks customers only “How likely are you to
recommend this company?” and assumes that those
who are not recommending are actively detracting,
WoMI measures both likelihood to recommend and
likelihood to detract by adding a second question:
“How likely are you to discourage others from doing
business with this company?” By measuring both
positive and negative word of mouth, business leaders
gain a more robust, accurate, and reliable metric that,
when viewed within the context of the customer
experience, provides actionable insights that can help
leaders improve key drivers of business success,
including word of mouth.
After researching more than two million survey
responses in developing WoMI, ForeSee found that
by measuring only positive word of mouth and making
the assumption anyone not recommending the brand is
a detractor, NPS overstates detractors by an incredible
margin, which can cause company executives to make
the wrong business decisions.
In this report, NPS was found to overstate detractors by
an average of 867% for the measured top brands.
WoMI helps business leaders distinguish between True
Detractors® and True Promoters® so they can avoid
wasting precious resources trying to convert passives
into promoters and eliminates the risk of alienating
customers who aren’t legitimate detractors. WoMI also
helps leaders understand what drives negative word of
mouth as well as positive word of mouth, allowing
companies to take proactive measures to fix issues
affecting the customer experience.
This study provides more information about WoMI and
NPS overstatement at the category level in Appendix A
on page 45.
THE FORESEE EXPERIENCE INDEX (FXI): TOP 100 BRANDS EDITION 10
ForeSee Experience Index: The Scores (continued from page 9)
Top BrandsSa
tisf
acti
on
Rete
ntio
n
Ups
ell
WoM
I
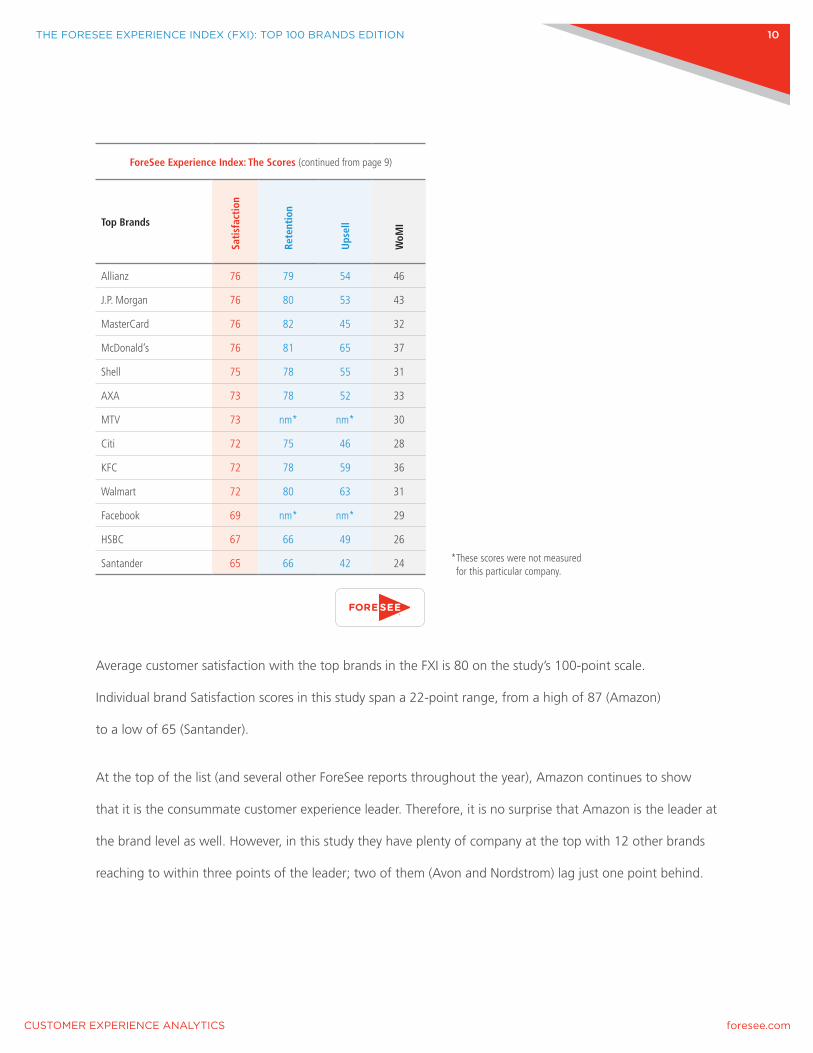
Allianz 76 79 54 46
J.P. Morgan 76 80 53 43
MasterCard 76 82 45 32
McDonald’s 76 81 65 37
Shell 75 78 55 31
AXA 73 78 52 33
MTV 73 nm* nm* 30
Citi 72 75 46 28
KFC 72 78 59 36
Walmart 72 80 63 31
Facebook 69 nm* nm* 29
HSBC 67 66 49 26
Santander 65 66 42 24
Average customer satisfaction with the top brands in the FXI is 80 on the study’s 100-point scale.
Individual brand Satisfaction scores in this study span a 22-point range, from a high of 87 (Amazon)
to a low of 65 (Santander).
At the top of the list (and several other ForeSee reports throughout the year), Amazon continues to show
that it is the consummate customer experience leader. Therefore, it is no surprise that Amazon is the leader at
the brand level as well. However, in this study they have plenty of company at the top with 12 other brands
reaching to within three points of the leader; two of them (Avon and Nordstrom) lag just one point behind.
* These scores were not measured for this particular company.

THE FORESEE EXPERIENCE INDEX (FXI): TOP 100 BRANDS EDITION 11
It must be noted that these are the top global brands—the best of the best—and all do well and are expected
to do well. In fact, 68% of the companies scored an 80 or above, which is generally the ForeSee benchmark
for excellence. So, recording a lower score against the best isn’t necessarily bad. Granted, companies still have
work to do and improvements to make. Just because a brand scores in the 80s does not mean they should
neglect the customer experience. No company is too big or too small to be concerned with the customer
experience. In this ultra-competitive market where the consumer is in control, both high- and low-scoring
brands need to continuously and consistantly measure and manage the experience to better align it with
evolving customer wants and expectations.
On the other end of the spectrum, only three companies score 69 or lower in this study. Companies that
score in this range are traditionally regarded as laggards. While these companies typically face the greatest
challenge, they also have the greatest to gain by improving the customer experience.
WHY SATISFACTION MATTERS FOR THE TOP BRANDS
ForeSee understands that satisfaction is not the only desired result. Knowing how satisfied customers
are with the experience is great, but understanding what the outcome(s) of that experience is becomes
even more beneficial in order to improve and move a company forward.
The number of measurable outcomes can vary per company. For the purposes of this study, ForeSee looked
specifically at Retention, Upsell, and Recommend future behaviors since they tend to have a direct impact
on business success.
When we look at Retention, scores range from 91 to 66 on a 100-point scale. Amazon is the front-runner
with a 91, meaning current Amazon customers are more likely to continue doing business with them in the
future than, say, customers of HSBC or Santander (both scoring a 66). This demonstrates that customers who
encounter a bad experience may find it easier to switch companies if a better experience comes along.
THE FORESEE EXPERIENCE INDEX (FXI): TOP 100 BRANDS EDITION 12
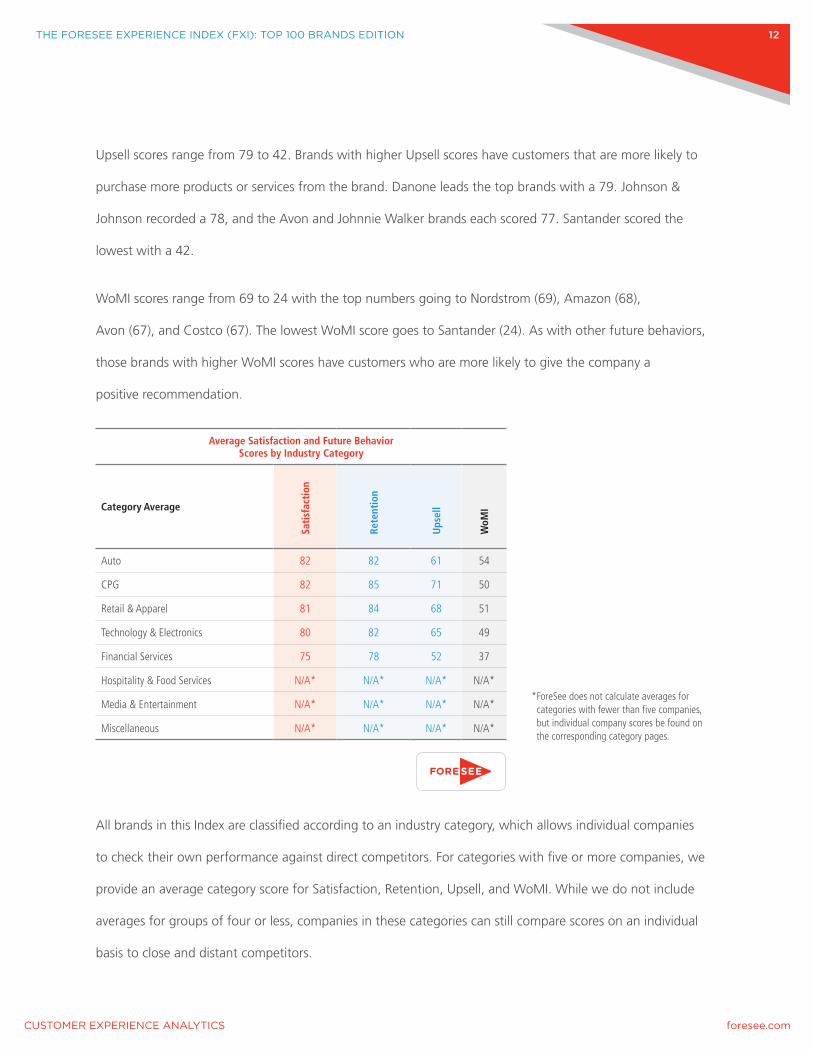
Upsell scores range from 79 to 42. Brands with higher Upsell scores have customers that are more likely to
purchase more products or services from the brand. Danone leads the top brands with a 79. Johnson &
Johnson recorded a 78, and the Avon and Johnnie Walker brands each scored 77. Santander scored the
lowest with a 42.
WoMI scores range from 69 to 24 with the top numbers going to Nordstrom (69), Amazon (68),
Avon (67), and Costco (67). The lowest WoMI score goes to Santander (24). As with other future behaviors,
those brands with higher WoMI scores have customers who are more likely to give the company a
positive recommendation.
Average Satisfaction and Future Behavior Scores by Industry Category
Category Average
Sati
sfac
tion
Rete
ntio
n
Ups
ell
WoM
I
Auto 82 82 61 54
CPG 82 85 71 50
Retail & Apparel 81 84 68 51
Technology & Electronics 80 82 65 49
Financial Services 75 78 52 37
Hospitality & Food Services N/A* N/A* N/A* N/A*
Media & Entertainment N/A* N/A* N/A* N/A*
Miscellaneous N/A* N/A* N/A* N/A*
All brands in this Index are classified according to an industry category, which allows individual companies
to check their own performance against direct competitors. For categories with five or more companies, we
provide an average category score for Satisfaction, Retention, Upsell, and WoMI. While we do not include
averages for groups of four or less, companies in these categories can still compare scores on an individual
basis to close and distant competitors.
* ForeSee does not calculate averages for categories with fewer than five companies, but individual company scores be found on the corresponding category pages.
THE FORESEE EXPERIENCE INDEX (FXI): TOP 100 BRANDS EDITION 13
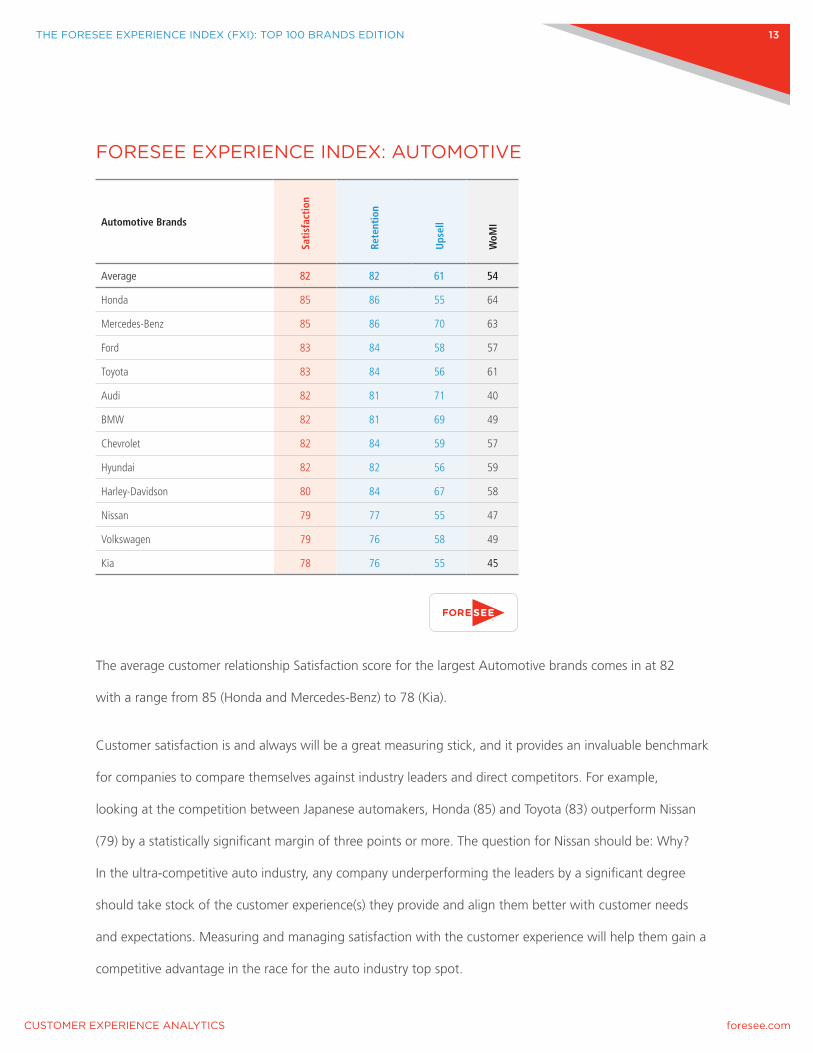
FORESEE EXPERIENCE INDEX: AUTOMOTIVE
Automotive Brands
Sati
sfac
tion
Rete
ntio
n
Ups
ell
WoM
I
Average 82 82 61 54
Honda 85 86 55 64
Mercedes-Benz 85 86 70 63
Ford 83 84 58 57
Toyota 83 84 56 61
Audi 82 81 71 40
BMW 82 81 69 49
Chevrolet 82 84 59 57
Hyundai 82 82 56 59
Harley-Davidson 80 84 67 58
Nissan 79 77 55 47
Volkswagen 79 76 58 49
Kia 78 76 55 45
The average customer relationship Satisfaction score for the largest Automotive brands comes in at 82
with a range from 85 (Honda and Mercedes-Benz) to 78 (Kia).
Customer satisfaction is and always will be a great measuring stick, and it provides an invaluable benchmark
for companies to compare themselves against industry leaders and direct competitors. For example,
looking at the competition between Japanese automakers, Honda (85) and Toyota (83) outperform Nissan
(79) by a statistically significant margin of three points or more. The question for Nissan should be: Why?
In the ultra-competitive auto industry, any company underperforming the leaders by a significant degree
should take stock of the customer experience(s) they provide and align them better with customer needs
and expectations. Measuring and managing satisfaction with the customer experience will help them gain a
competitive advantage in the race for the auto industry top spot.

THE FORESEE EXPERIENCE INDEX (FXI): TOP 100 BRANDS EDITION 14
WHY SATISFACTION MATTERS FOR AUTOMOTIVE BRANDS
Satisfaction, if measured correctly, is more than just a number. If measured with an accurate,
precise, reliable, and credible methodology, it can also help executives prioritize business decisions and predict
customer future behaviors such as Retention, Upsell, and Recommendations. In general, those companies
that score better in Satisfaction have customers who are more loyal, willing to buy more, and likely to
recommend the brand to family, friends, and colleagues—all critical to business growth and success.
Retention: The average Retention score for this category is 82 with scores ranging from 86 (Honda and
Mercedes-Benz) to 76 (Volkswagen and Kia). Higher satisfaction leads to customers who are more likely to
continue doing business with the brand in the future (see chart on page 15).
Upsell: Luxury brand automakers appear to score better in Upsell than other automotive companies.
Customers of brands such as Audi (71), Mercedes-Benz (70), BMW (69), and Harley-Davison (67) are more
likely to purchase additional service plans and warranties that ensure their automobiles are properly looked
after by brand-certified mechanics and technicians.
WoMI: As an outcome of satisfaction, we generally see higher word-of-mouth recommendations in
relationship to higher satisfaction with the customer experience. In the auto industry, the average WoMI
score is 54 with a range from 64 (Honda) to 40 (Audi). WoMI helps executives understand what drives both
negative and positive word of mouth, allowing them to take proactive measures to fix issues affecting the
customer experience.
Retention, Upsell, and Recommendations are powerful drivers of business success, but numerous measur-
able future behaviors can help determine the health of a brand or company. The chart on page 15 shows the
measured future behaviors for the Automotive category, and illustrates the impact a highly satisfied customer
can have on a company’s success.
THE FORESEE EXPERIENCE INDEX (FXI): TOP 100 BRANDS EDITION 15
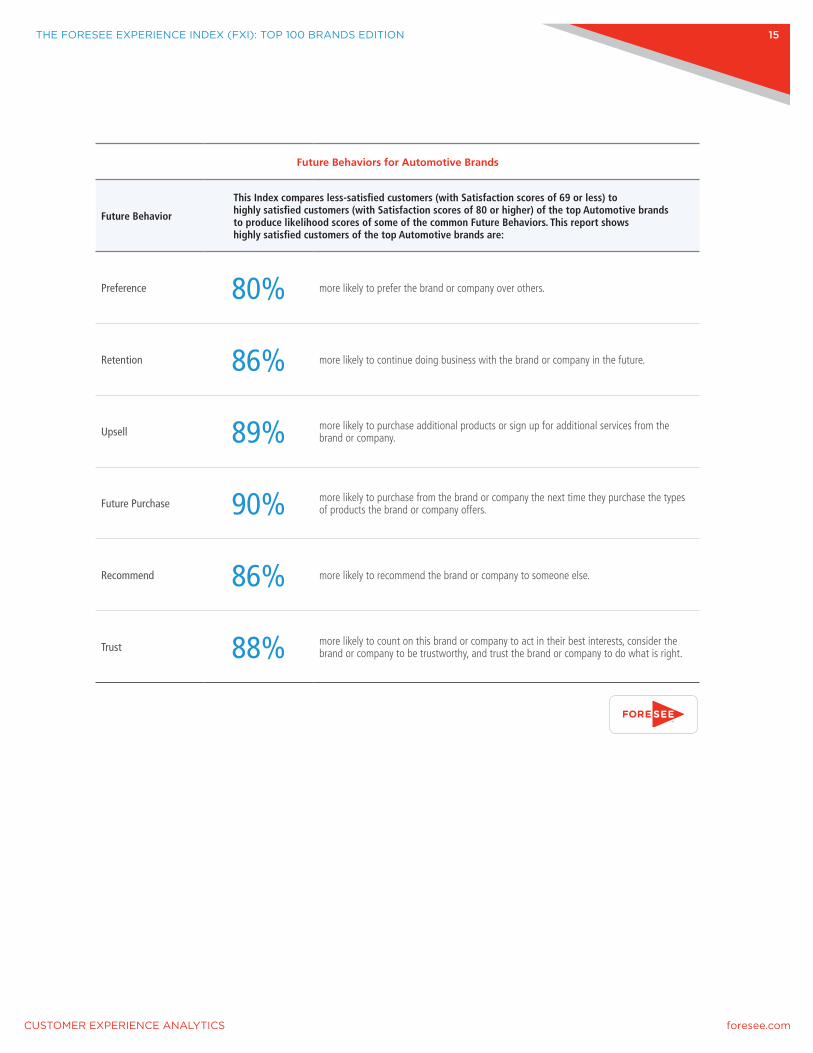
Future Behaviors for Automotive Brands
Future Behavior
This Index compares less-satisfied customers (with Satisfaction scores of 69 or less) to highly satisfied customers (with Satisfaction scores of 80 or higher) of the top Automotive brands to produce likelihood scores of some of the common Future Behaviors. This report shows highly satisfied customers of the top Automotive brands are:
Preference 80% more likely to prefer the brand or company over others.
Retention 86% more likely to continue doing business with the brand or company in the future.
Upsell 89% more likely to purchase additional products or sign up for additional services from the brand or company.
Future Purchase 90% more likely to purchase from the brand or company the next time they purchase the types of products the brand or company offers.
Recommend 86% more likely to recommend the brand or company to someone else.
Trust 88% more likely to count on this brand or company to act in their best interests, consider the brand or company to be trustworthy, and trust the brand or company to do what is right.

THE FORESEE EXPERIENCE INDEX (FXI): TOP 100 BRANDS EDITION 16
THE ELEMENTS OF THE CUSTOMER EXPERIENCE FOR AUTOMOTIVE BRANDS
The ForeSee CXA methodology measures several key drivers, or elements, of the customer experience,
and the methodology is able to calculate the relative impact of various elements on overall satisfaction.
The results tell us how customers feel about these performance areas and how each element influences
customers’ overall satisfaction. Improving the elements leads to quantifiable increases in satisfaction.
The elements that will have the most impact on satisfaction (and therefore future behaviors) differ for
specific brands.
While there are many possible drivers of satisfaction to measure that can vary by company, for the purpose
of this study ForeSee measured three common elements (Product, Price, and Service) so companies can
understand the importance of measuring all aspects of the customer experience. The chart below shows the
top priority elements the top Automotive brands should take into consideration when deciding how
to improve customer experience.
Top Priorities for Automotive Brands
Priority What it measures % of companies with top priority* Companies
PriceThe products provide value and are worth the price. This company’s prices fairly reflect the benefits provided by the products. 67% Audi, Chevrolet, Ford, Honda,
Hyundai, Kia, Toyota, Volkswagen
ServiceThe company keeps its promises about the delivery of services. The employees are friendly, and the services provided by the employees are consistently performed. 33% BMW, Ford, Harley-Davidson, Nissan
Product The products offered by this company are desirable, unique, and perform their intended purpose. 8% Mercedes-Benz
* The percentages in this chart do not add up to 100% as it is possible for some companies to have more than one top priority element.
THE FORESEE EXPERIENCE INDEX (FXI): TOP 100 BRANDS EDITION 17
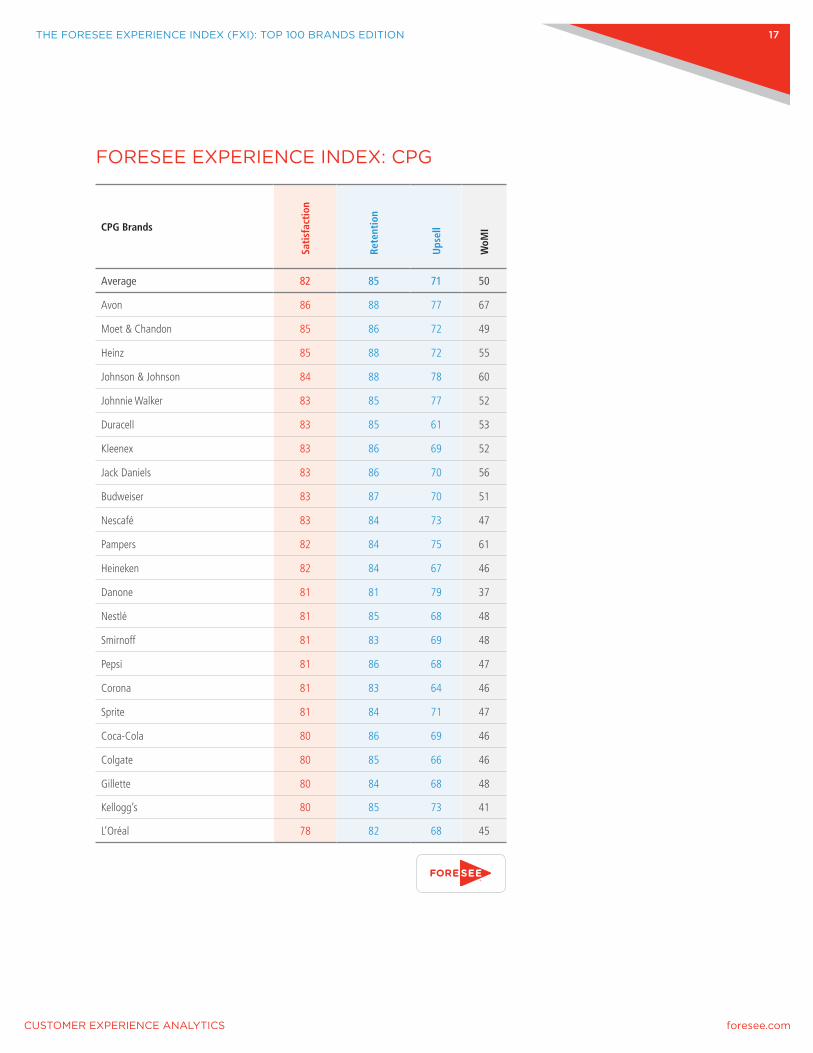
FORESEE EXPERIENCE INDEX: CPG
CPG Brands
Sati
sfac
tion
Rete
ntio
n
Ups
ell
WoM
I
Average 82 85 71 50
Avon 86 88 77 67
Moet & Chandon 85 86 72 49
Heinz 85 88 72 55
Johnson & Johnson 84 88 78 60
Johnnie Walker 83 85 77 52
Duracell 83 85 61 53
Kleenex 83 86 69 52
Jack Daniels 83 86 70 56
Budweiser 83 87 70 51
Nescafé 83 84 73 47
Pampers 82 84 75 61
Heineken 82 84 67 46
Danone 81 81 79 37
Nestlé 81 85 68 48
Smirnoff 81 83 69 48
Pepsi 81 86 68 47
Corona 81 83 64 46
Sprite 81 84 71 47
Coca-Cola 80 86 69 46
Colgate 80 85 66 46
Gillette 80 84 68 48
Kellogg’s 80 85 73 41
L’Oréal 78 82 68 45
THE FORESEE EXPERIENCE INDEX (FXI): TOP 100 BRANDS EDITION 18
The average Satisfaction score for the CPG category is 82 with an eight-point range from 86 to 78.
Avon leads the way with an 86, with Heinz and Moet & Chandon right behind, each scoring 85.
Johnson & Johnson (84) is in striking distance of the leaders along with six other CPG brands, all scoring 83.
L’Oréal rounds out the CPG brands with a 78.
WHY SATISFACTION MATTERS FOR CPG BRANDS
If measured with an accurate, precise, reliable, and credible methodology, satisfaction can also help
executives prioritize business decisions and predict customers’ future behaviors. In general, those companies
that score better in Satisfaction have customers who are more loyal, willing to buy more, and likely to
recommend the brand to family, friends, and colleagues—all critical to business growth and success.
Retention: Customers of CPG brands are considerably more loyal than those measured in other categories.
Satisfaction tends to be higher for CPG brands because there is no service component. Satisfaction is based
on how what you get compares to what you expected to get, and it is easier for a CPG company than a
service-based company to deliver on that. If you like Coke or Frosted Flakes or Pampers, you will continue
to buy them and are not likely to be disappointed because product quality tends to be consistent.
The 23 CPG companies record higher Retention scores, with an average of 85, than any other category.
The range of scores for this future behavior is fairly narrow, from 88 (Avon, Heinz and Johnson & Johnson)
to 81 (Danone). Higher satisfaction leads to customers who are more likely to continue doing business
with the brand in the future.
Upsell: The average Upsell score for the CPG category is 71—also the highest of any category in this study—
and scores range from 79 (Danone) to 61 (Duracell). Those companies with higher Upsell scores have
customers who are more likely to purchase more products or services under the brand’s banner than those
who have less-satisfied customers. In fact, highly satisfied customers are 65% more likely to purchase more
than less-satisfied ones (see Future Behaviors chart on page 19).
THE FORESEE EXPERIENCE INDEX (FXI): TOP 100 BRANDS EDITION 19
WoMI: WoMI helps executives understand what drives both negative and positive word of mouth, allowing
them to take proactive measures to fix issues affecting the customer experience. In this study, the average
WoMI score for measured CPG brands is 50 with a range from 67 (Avon) to 37 (Danone), meaning a brand
such as Avon can expect its customers to be more likely to give positive recommendations than a comparable
brand such as L’Oréal, which recorded a WoMI score of 45.
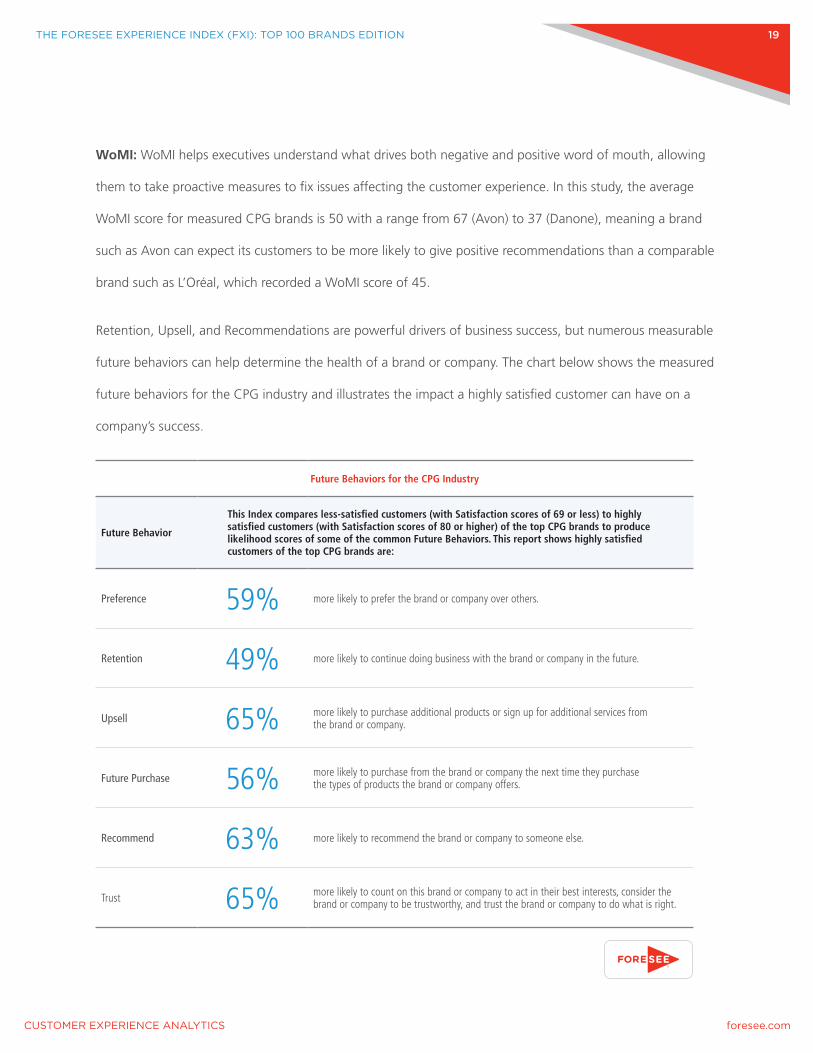
Retention, Upsell, and Recommendations are powerful drivers of business success, but numerous measurable
future behaviors can help determine the health of a brand or company. The chart below shows the measured
future behaviors for the CPG industry and illustrates the impact a highly satisfied customer can have on a
company’s success.
Future Behaviors for the CPG Industry
Future Behavior
This Index compares less-satisfied customers (with Satisfaction scores of 69 or less) to highly satisfied customers (with Satisfaction scores of 80 or higher) of the top CPG brands to produce likelihood scores of some of the common Future Behaviors. This report shows highly satisfied customers of the top CPG brands are:
Preference 59% more likely to prefer the brand or company over others.
Retention 49% more likely to continue doing business with the brand or company in the future.
Upsell 65% more likely to purchase additional products or sign up for additional services from the brand or company.
Future Purchase 56% more likely to purchase from the brand or company the next time they purchase the types of products the brand or company offers.
Recommend 63% more likely to recommend the brand or company to someone else.
Trust 65% more likely to count on this brand or company to act in their best interests, consider the brand or company to be trustworthy, and trust the brand or company to do what is right.

THE FORESEE EXPERIENCE INDEX (FXI): TOP 100 BRANDS EDITION 20
THE ELEMENTS OF THE CUSTOMER EXPERIENCE FOR CPG BRANDS
While satisfaction drives customers’ future behaviors, some elements impact satisfaction. The ForeSee
CXA methodology measures several key drivers, or elements, of the customer experience, and the
methodology is able to calculate the relative impact of various elements on overall satisfaction. The results tell
us how customers feel about these performance areas and how each element influences customers’ overall
satisfaction. Improving elements that will have the greatest impact on the customer experience leads to
quantifiable increases in satisfaction and, therefore, future behaviors.
In this study we measured just three high-level elements for the CPG brands: Product, Price, and Ads.
While most people remain loyal to a CPG brand because they know exactly what to expect, Product
remains the top impacting element of satisfaction for 78% of the CPG brands measured. Below is a chart
showing the top priorities the top CPG brands should take into consideration when deciding how to
improve customer experience.
Top Priorities for CPG Brands Industry
Priority What it measures % of companies with top priority Companies
Product The products offered by this company are desirable, unique, and perform their intended purpose. 78%
Avon, Budweiser, Coca-Cola, Corona, Duracell, Gillette, Heineken, Heinz, Jack Daniels, Johnnie Walker, Kellogg’s, Kleenex, L’Oréal, Moet & Chandon, Nescafé, Pampers, Pepsi, Smirnoff, Sprite
PriceThe products provide value and are worth the price. This company’s prices fairly reflect the benefits provided by the products. 22% Colgate, Danone, Johnson &
Johnson, Nestlé
AdsAdvertising by this company contains good reasons for buying their products; is attractive and attention-getting; and ad claims made are truthful and believable. 0%
THE FORESEE EXPERIENCE INDEX (FXI): TOP 100 BRANDS EDITION 21
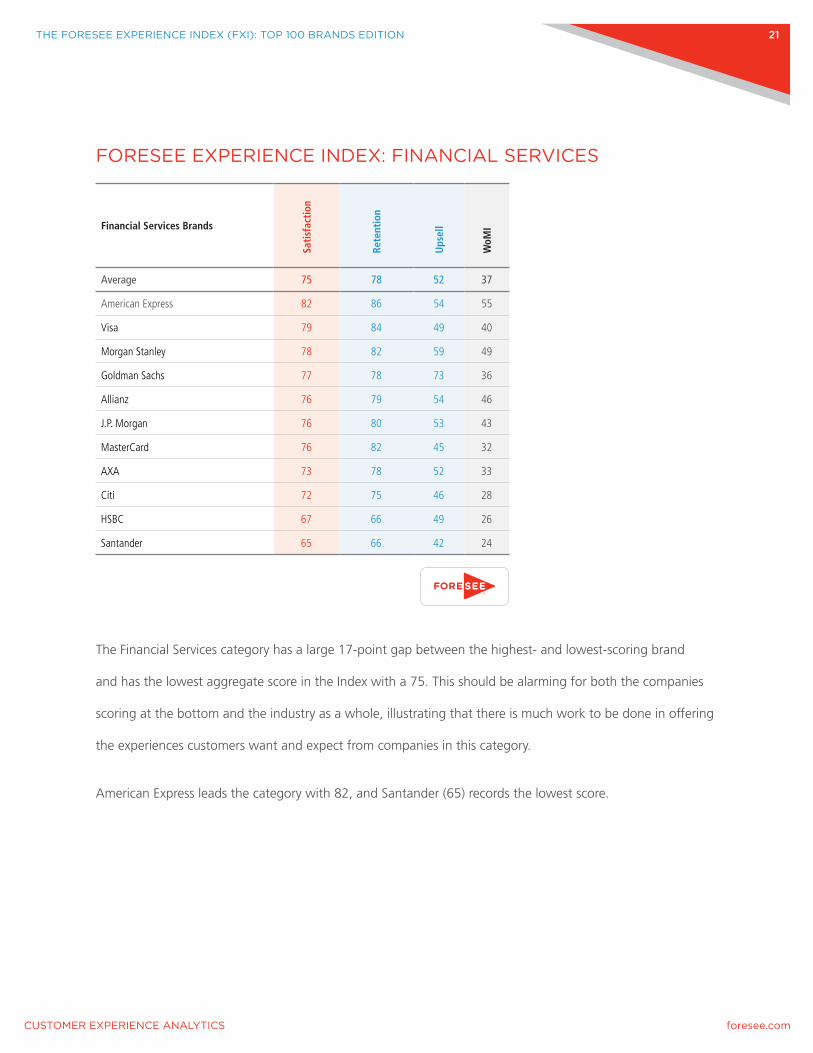
FORESEE EXPERIENCE INDEX: FINANCIAL SERVICES
Financial Services Brands
Sati
sfac
tion
Rete
ntio
n
Ups
ell
WoM
I
Average 75 78 52 37
American Express 82 86 54 55
Visa 79 84 49 40
Morgan Stanley 78 82 59 49
Goldman Sachs 77 78 73 36
Allianz 76 79 54 46
J.P. Morgan 76 80 53 43
MasterCard 76 82 45 32
AXA 73 78 52 33
Citi 72 75 46 28
HSBC 67 66 49 26
Santander 65 66 42 24
The Financial Services category has a large 17-point gap between the highest- and lowest-scoring brand
and has the lowest aggregate score in the Index with a 75. This should be alarming for both the companies
scoring at the bottom and the industry as a whole, illustrating that there is much work to be done in offering
the experiences customers want and expect from companies in this category.
American Express leads the category with 82, and Santander (65) records the lowest score.
THE FORESEE EXPERIENCE INDEX (FXI): TOP 100 BRANDS EDITION 22
WHY SATISFACTION MATTERS TO FINANCIAL SERVICES BRANDS
If measured with an accurate, precise, reliable, and credible methodology, satisfaction can also help
executives prioritize business decisions and predict customer future behaviors. In general, those companies
that score better in Satisfaction have customers who are more loyal, willing to purchase more financial
services and products, and likely to recommend the brand to family, friends, and colleagues—all critical to
business growth and success.
Retention: Financial Services brands also record the lowest Retention scores, showing that loyalty tends to
wane for those companies not providing experiences that meet and exceed customer expectations. The
average Retention score for this industry is 78 with a range spanning 20 points from 86 (American Express)
to 66 (HSBC and Santander).
Upsell: For an industry that lives and dies by upselling products and services (savings, checking, and
college accounts, mortgages, credit cards, etc.), to its customers it isn’t doing so well. In fact, of all the
categories at the aggregate level, Financial Services scores the lowest in Upsell with a 52. The scores range
from 73 (Goldman Sachs) to 42 (Santander).
WoMI: As far as word-of-mouth recommendations, the Financial Services industry again scores the lowest
with a category average of 37, with American Express (55) scoring the highest and Santander (24) the lowest.
This isn’t all that surprising. As we found through our more than two years of researching more than two
million survey responses when developing WoMI, financial services customers are less likely to recommend
the brand in general since where they bank and invest their money tends to be an extremely personal and
private decision.
Retention, Upsell, and Recommendations are powerful drivers of business success, but numerous measurable
future behaviors can help determine the health of a brand or company. The chart on page 23 shows the
measured future behaviors for the Financial Services industry and illustrates the impact a highly satisfied
customer can have on a company’s success.
THE FORESEE EXPERIENCE INDEX (FXI): TOP 100 BRANDS EDITION 23
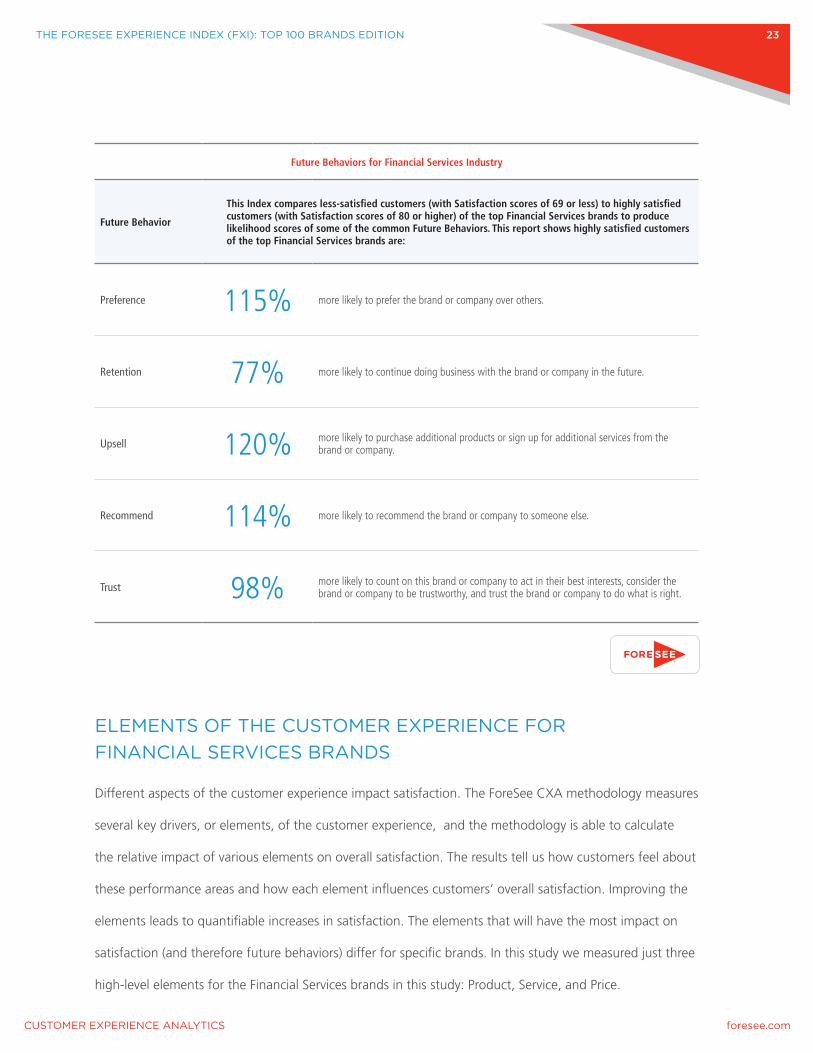
Future Behaviors for Financial Services Industry
Future Behavior
This Index compares less-satisfied customers (with Satisfaction scores of 69 or less) to highly satisfied customers (with Satisfaction scores of 80 or higher) of the top Financial Services brands to produce likelihood scores of some of the common Future Behaviors. This report shows highly satisfied customers of the top Financial Services brands are:
Preference 115% more likely to prefer the brand or company over others.
Retention 77% more likely to continue doing business with the brand or company in the future.
Upsell 120% more likely to purchase additional products or sign up for additional services from the brand or company.
Recommend 114% more likely to recommend the brand or company to someone else.
Trust 98% more likely to count on this brand or company to act in their best interests, consider the brand or company to be trustworthy, and trust the brand or company to do what is right.
ELEMENTS OF THE CUSTOMER EXPERIENCE FOR FINANCIAL SERVICES BRANDS
Different aspects of the customer experience impact satisfaction. The ForeSee CXA methodology measures
several key drivers, or elements, of the customer experience, and the methodology is able to calculate
the relative impact of various elements on overall satisfaction. The results tell us how customers feel about
these performance areas and how each element influences customers’ overall satisfaction. Improving the
elements leads to quantifiable increases in satisfaction. The elements that will have the most impact on
satisfaction (and therefore future behaviors) differ for specific brands. In this study we measured just three
high-level elements for the Financial Services brands in this study: Product, Service, and Price.
THE FORESEE EXPERIENCE INDEX (FXI): TOP 100 BRANDS EDITION 24
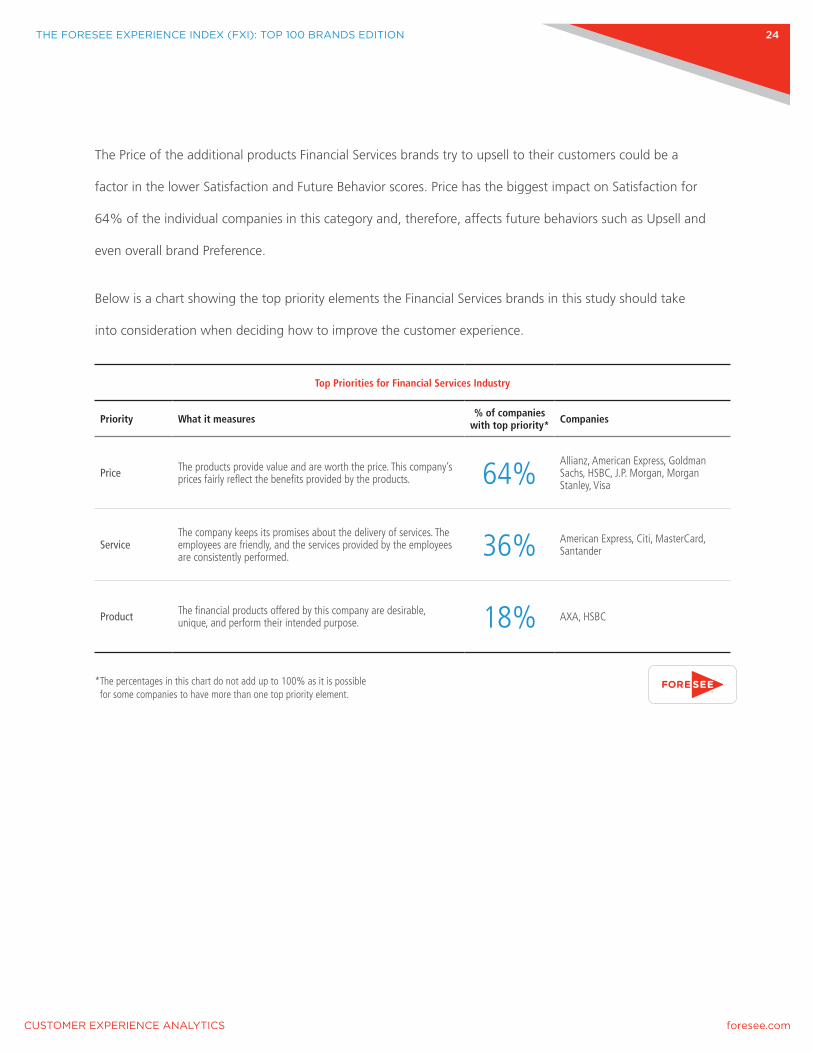
The Price of the additional products Financial Services brands try to upsell to their customers could be a
factor in the lower Satisfaction and Future Behavior scores. Price has the biggest impact on Satisfaction for
64% of the individual companies in this category and, therefore, affects future behaviors such as Upsell and
even overall brand Preference.
Below is a chart showing the top priority elements the Financial Services brands in this study should take
into consideration when deciding how to improve the customer experience.
Top Priorities for Financial Services Industry
Priority What it measures % of companies with top priority* Companies
Price The products provide value and are worth the price. This company’s prices fairly reflect the benefits provided by the products. 64%
Allianz, American Express, Goldman Sachs, HSBC, J.P. Morgan, Morgan Stanley, Visa
ServiceThe company keeps its promises about the delivery of services. The employees are friendly, and the services provided by the employees are consistently performed. 36% American Express, Citi, MasterCard,
Santander
Product The financial products offered by this company are desirable, unique, and perform their intended purpose. 18% AXA, HSBC
* The percentages in this chart do not add up to 100% as it is possible for some companies to have more than one top priority element.
THE FORESEE EXPERIENCE INDEX (FXI): TOP 100 BRANDS EDITION 25
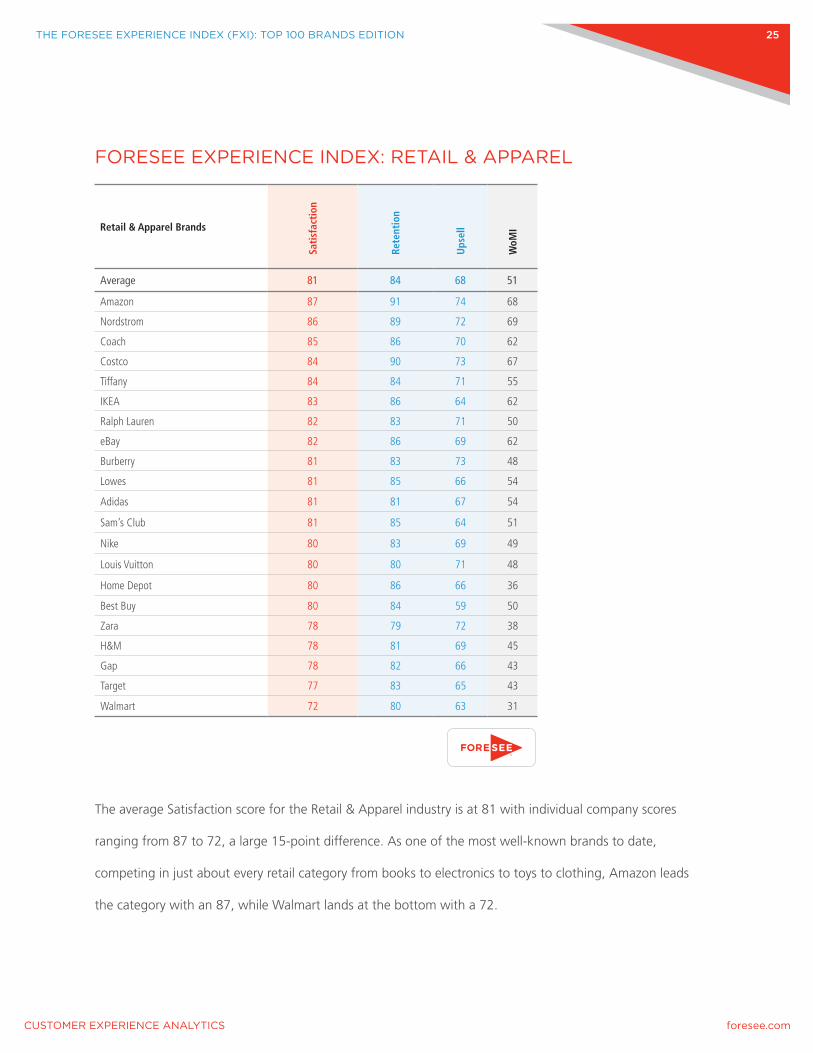
FORESEE EXPERIENCE INDEX: RETAIL & APPAREL
Retail & Apparel Brands
Sati
sfac
tion
Rete
ntio
n
Ups
ell
WoM
I
Average 81 84 68 51
Amazon 87 91 74 68
Nordstrom 86 89 72 69
Coach 85 86 70 62
Costco 84 90 73 67
Tiffany 84 84 71 55
IKEA 83 86 64 62
Ralph Lauren 82 83 71 50
eBay 82 86 69 62
Burberry 81 83 73 48
Lowes 81 85 66 54
Adidas 81 81 67 54
Sam’s Club 81 85 64 51
Nike 80 83 69 49
Louis Vuitton 80 80 71 48
Home Depot 80 86 66 36
Best Buy 80 84 59 50
Zara 78 79 72 38
H&M 78 81 69 45
Gap 78 82 66 43
Target 77 83 65 43
Walmart 72 80 63 31
The average Satisfaction score for the Retail & Apparel industry is at 81 with individual company scores
ranging from 87 to 72, a large 15-point difference. As one of the most well-known brands to date,
competing in just about every retail category from books to electronics to toys to clothing, Amazon leads
the category with an 87, while Walmart lands at the bottom with a 72.
THE FORESEE EXPERIENCE INDEX (FXI): TOP 100 BRANDS EDITION 26
While Amazon has dominated the retail industry at the channel level, specifically web and mobile, in previous
ForeSee studies, they are in close company at the brand level. Nordstrom (86), Coach (85), Costco (84), and
Tiffany (84) are all statistically within reach of the leader. Twelve other brands score at or above 80—
ForeSee’s benchmark for excellence.
Any retailer falling below 80 is without question risking loyalty, recommendations, and sales among current
customers and new customers. Executives in this position need to take note and start having conversations
with leaders across the company to figure out why they are trailing the leaders by 10, 12, or 15 points. It
starts with using a robust system of metrics that measures all aspects of the customer experience, including
the factors that impact a customer’s experience and the likely outcome of the experience to show what a
satisfied or dissatisfied customer is likely to do in the future.
WHY SATISFACTION MATTERS TO RETAIL & APPAREL BRANDS
If measured with an accurate, precise, reliable, and credible methodology, satisfaction can help executives
prioritize business decisions and predict customers’ future behaviors. In general, those companies that score
better in Satisfaction have customers who are more loyal, willing to buy more, and likely to recommend the
brand to family, friends, and colleagues—all critical to business growth and success. As we typically see,
Future Behaviors scores increase with satisfaction.
Retention: Retention scores for Retail & Apparel brands range from 91 (Amazon) to 79 (Zara),
demonstrating that customers who are highly satisfied with the customer experience are more likely to
continue doing business with the brand in the future.
Upsell: Upsell scores range from 74 (Amazon) to 59 (Best Buy) and show that customers who are more
satisfied with the customer experience are more likely to purchase additional products and services from
the brand.
THE FORESEE EXPERIENCE INDEX (FXI): TOP 100 BRANDS EDITION 27
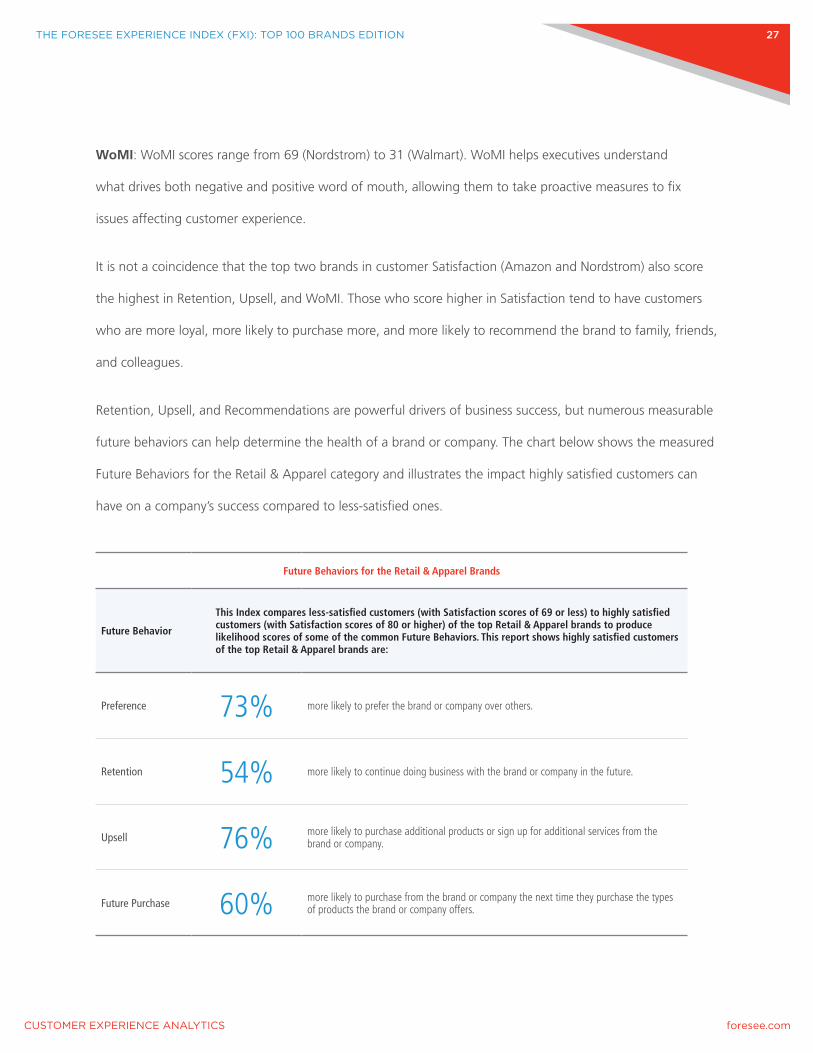
WoMI: WoMI scores range from 69 (Nordstrom) to 31 (Walmart). WoMI helps executives understand
what drives both negative and positive word of mouth, allowing them to take proactive measures to fix
issues affecting customer experience.
It is not a coincidence that the top two brands in customer Satisfaction (Amazon and Nordstrom) also score
the highest in Retention, Upsell, and WoMI. Those who score higher in Satisfaction tend to have customers
who are more loyal, more likely to purchase more, and more likely to recommend the brand to family, friends,
and colleagues.
Retention, Upsell, and Recommendations are powerful drivers of business success, but numerous measurable
future behaviors can help determine the health of a brand or company. The chart below shows the measured
Future Behaviors for the Retail & Apparel category and illustrates the impact highly satisfied customers can
have on a company’s success compared to less-satisfied ones.
Future Behaviors for the Retail & Apparel Brands
Future Behavior
This Index compares less-satisfied customers (with Satisfaction scores of 69 or less) to highly satisfied customers (with Satisfaction scores of 80 or higher) of the top Retail & Apparel brands to produce likelihood scores of some of the common Future Behaviors. This report shows highly satisfied customers of the top Retail & Apparel brands are:
Preference 73% more likely to prefer the brand or company over others.
Retention 54% more likely to continue doing business with the brand or company in the future.
Upsell 76% more likely to purchase additional products or sign up for additional services from the brand or company.
Future Purchase 60% more likely to purchase from the brand or company the next time they purchase the types of products the brand or company offers.
THE FORESEE EXPERIENCE INDEX (FXI): TOP 100 BRANDS EDITION 28
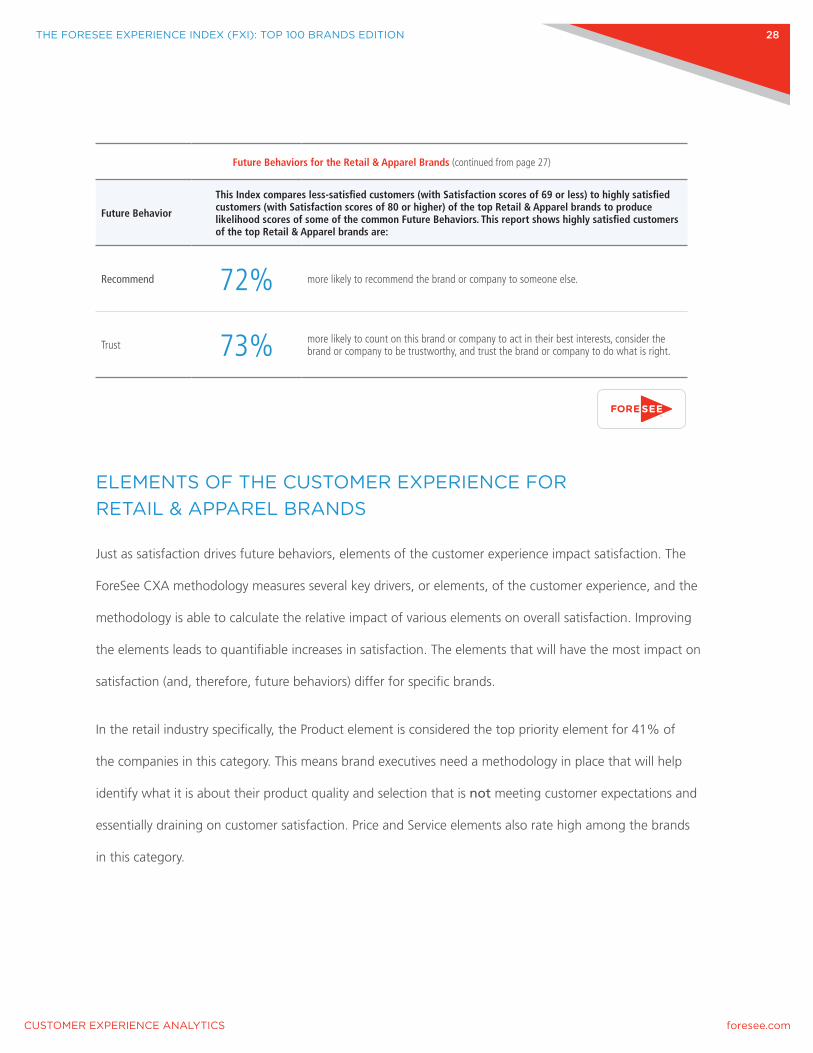
Future Behaviors for the Retail & Apparel Brands (continued from page 27)
Future Behavior
This Index compares less-satisfied customers (with Satisfaction scores of 69 or less) to highly satisfied customers (with Satisfaction scores of 80 or higher) of the top Retail & Apparel brands to produce likelihood scores of some of the common Future Behaviors. This report shows highly satisfied customers of the top Retail & Apparel brands are:
Recommend 72% more likely to recommend the brand or company to someone else.
Trust 73% more likely to count on this brand or company to act in their best interests, consider the brand or company to be trustworthy, and trust the brand or company to do what is right.
ELEMENTS OF THE CUSTOMER EXPERIENCE FOR RETAIL & APPAREL BRANDS
Just as satisfaction drives future behaviors, elements of the customer experience impact satisfaction. The
ForeSee CXA methodology measures several key drivers, or elements, of the customer experience, and the
methodology is able to calculate the relative impact of various elements on overall satisfaction. Improving
the elements leads to quantifiable increases in satisfaction. The elements that will have the most impact on
satisfaction (and, therefore, future behaviors) differ for specific brands.
In the retail industry specifically, the Product element is considered the top priority element for 41% of
the companies in this category. This means brand executives need a methodology in place that will help
identify what it is about their product quality and selection that is not meeting customer expectations and
essentially draining on customer satisfaction. Price and Service elements also rate high among the brands
in this category.

THE FORESEE EXPERIENCE INDEX (FXI): TOP 100 BRANDS EDITION 29
Top Priorities for Retail & Apparel Brands
Priority What it measures % of companies with top priority* Companies
Product The products offered by this company are desirable, unique, and perform their intended purpose. 41% Adidas, Burberry, Coach, Gap, IKEA,
Lowes, Nike, Nordstrom, Tiffany
Price The products provide value and are worth the price. This company’s prices fairly reflect the benefits provided by the products. 36% Adidas, Amazon, Costco, eBay, H&M,
Ralph Lauren, Sam’s Club, Zara
ServiceThe company keeps its promises about the delivery of services. The employees are friendly, and the services provided by the employees are consistently performed. 36% Best Buy, Coach, Home Depot, Louis
Vuitton, Target, Walmart, Zara
* The percentages in this chart do not add up to 100% as it is possible for some companies to have more than one top priority element.
THE FORESEE EXPERIENCE INDEX (FXI): TOP 100 BRANDS EDITION 30
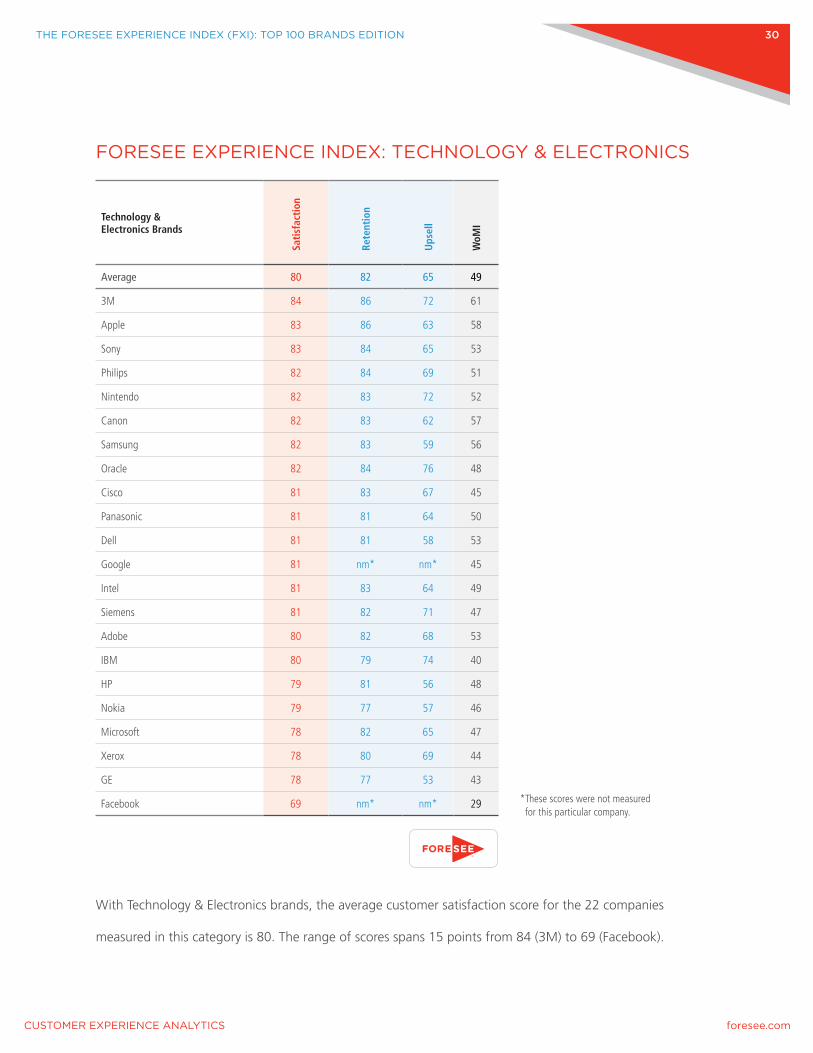
FORESEE EXPERIENCE INDEX: TECHNOLOGY & ELECTRONICS
Technology & Electronics Brands
Sati
sfac
tion
Rete
ntio
n
Ups
ell
WoM
I
Average 80 82 65 49
3M 84 86 72 61
Apple 83 86 63 58
Sony 83 84 65 53
Philips 82 84 69 51
Nintendo 82 83 72 52
Canon 82 83 62 57
Samsung 82 83 59 56
Oracle 82 84 76 48
Cisco 81 83 67 45
Panasonic 81 81 64 50
Dell 81 81 58 53
Google 81 nm* nm* 45
Intel 81 83 64 49
Siemens 81 82 71 47
Adobe 80 82 68 53
IBM 80 79 74 40
HP 79 81 56 48
Nokia 79 77 57 46
Microsoft 78 82 65 47
Xerox 78 80 69 44
GE 78 77 53 43
Facebook 69 nm* nm* 29
With Technology & Electronics brands, the average customer satisfaction score for the 22 companies
measured in this category is 80. The range of scores spans 15 points from 84 (3M) to 69 (Facebook).
* These scores were not measured for this particular company.
THE FORESEE EXPERIENCE INDEX (FXI): TOP 100 BRANDS EDITION 31
In this category, 73% of Technology & Electronics companies score 80 or higher, which according to
ForeSee is the benchmark for excellence. Even though these are the best companies at what they do, this lack
of separation among the top emphasizes a great opportunity for one of these brands to really dominate the
space. The deciding factor resides within the customer experience. The company that can measure and
manage it the best will eventually put distance between them and their competitors by gaining customers
that are more loyal, purchase more, and offer positive recommendations.
A good example would be to break out the companies that manufacture computers as the main focus of
their business model such as Apple (83), Dell (81), and HP (79). Not much separates these three companies
in regard to customer satisfaction at the brand level. While they now know where they stand in relation to
each other from the customer perspective, the responsibility falls to them, assuming the want to improve and
win more market share, to measure all aspects of the customer experience from every channel (web, mobile,
store, contact center, etc.) that is applicable. Only then will they know exactly where they need to improve so
they can increase sales, better retain loyal customers, and earn positive recommendations.
WHY SATISFACTION MATTERS FOR TECHNOLOGY & ELECTRONICS BRANDS
If measured properly with scientific methodology, satisfaction can help executives prioritize business decisions
and predict customer future behaviors such as Retention, Upsell, and Recommendations. In general, those
companies that score better in Satisfaction have customers who are more loyal, willing to buy more, and likely
to recommend the brand to family, friends, and colleagues—all critical to business growth and success.
Retention: Customers who are highly satisfied with the customer experience are more likely to continue
doing business with the brand in the future. The average Retention score for this group is 82, ranging from a
high of 86 (3M and Apple) to a low of 77 (Nokia and GE).
THE FORESEE EXPERIENCE INDEX (FXI): TOP 100 BRANDS EDITION 32
Upsell: Upsell scores for this category average 65. Oracle tops the chart with a 76, and GE rounds out the
list with a 53. Customers who are more satisfied with the customer experience are more likely to purchase
additional products and services from the brand.
WoMI: 3M earns the highest WoMI score with a 61, while Facebook lands at the bottom with a 29.
Customers with higher WoMI scores are more likely to give positive word-of-mouth recommendations.
As the lowest scoring brand in this category and one of the lowest scoring brands in the overall index,
Facebook (69 in Satisfaction) has a long way to go in building the experiences that customers want and
expect and what many other companies are now providing. Facebook will remain relevant only for as long
as they can retain their stranglehold on the social media market. With Google+ taking hold and rising in
popularity, it might not be for that much longer.
Facebook seems to have lost the trust of the social media community somewhere along the line. If we look
directly at Facebook’s future behavior Trust, it scores a 59—another index low—compared to Google’s 72.
Facebook executives need to take note and realize that they need to stop doing what they think is right.
Instead, they need to listen to what the customer wants and expects so they can do what is right. If they can
manage that, it will make all the difference.
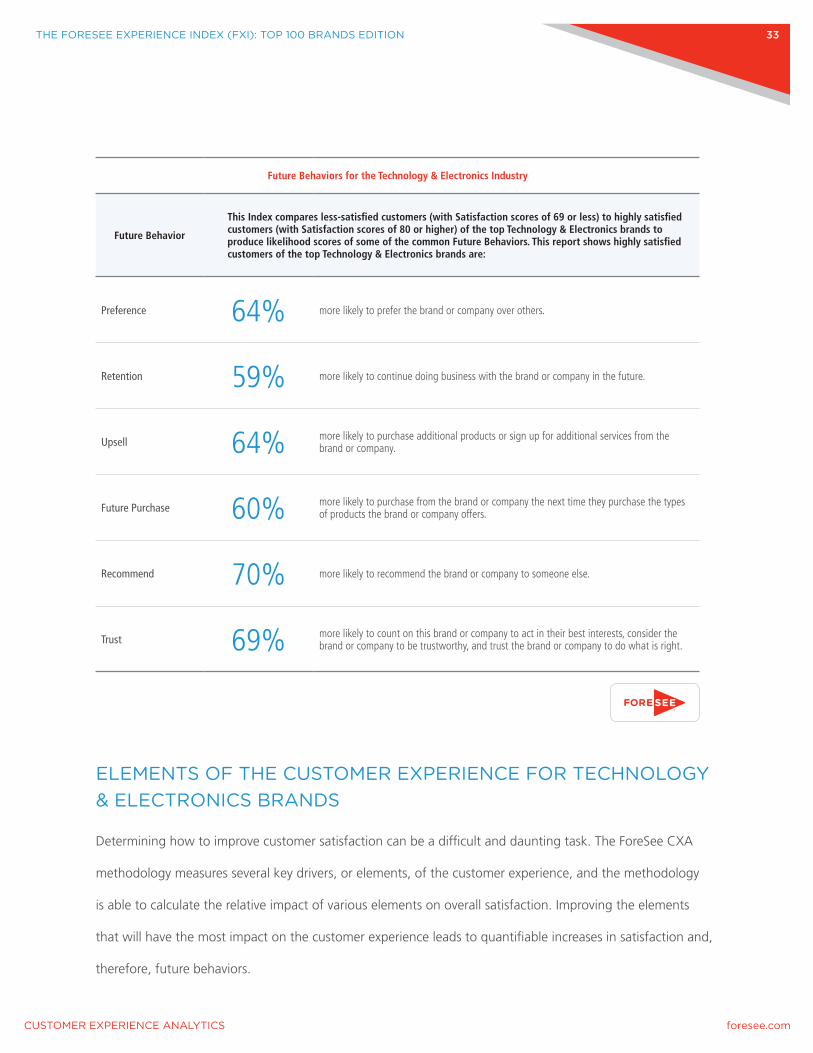
The chart on page 33 shows all the measured Future Behaviors for the Technology & Electronics category
and illustrates the impact a highly satisfied customer can have on a company’s success compared to a
less-satisfied customer.
THE FORESEE EXPERIENCE INDEX (FXI): TOP 100 BRANDS EDITION 33
Future Behaviors for the Technology & Electronics Industry
Future Behavior
This Index compares less-satisfied customers (with Satisfaction scores of 69 or less) to highly satisfied customers (with Satisfaction scores of 80 or higher) of the top Technology & Electronics brands to produce likelihood scores of some of the common Future Behaviors. This report shows highly satisfied customers of the top Technology & Electronics brands are:
Preference 64% more likely to prefer the brand or company over others.
Retention 59% more likely to continue doing business with the brand or company in the future.
Upsell 64% more likely to purchase additional products or sign up for additional services from the brand or company.
Future Purchase 60% more likely to purchase from the brand or company the next time they purchase the types of products the brand or company offers.
Recommend 70% more likely to recommend the brand or company to someone else.
Trust 69% more likely to count on this brand or company to act in their best interests, consider the brand or company to be trustworthy, and trust the brand or company to do what is right.
ELEMENTS OF THE CUSTOMER EXPERIENCE FOR TECHNOLOGY & ELECTRONICS BRANDS
Determining how to improve customer satisfaction can be a difficult and daunting task. The ForeSee CXA
methodology measures several key drivers, or elements, of the customer experience, and the methodology
is able to calculate the relative impact of various elements on overall satisfaction. Improving the elements
that will have the most impact on the customer experience leads to quantifiable increases in satisfaction and,
therefore, future behaviors.
THE FORESEE EXPERIENCE INDEX (FXI): TOP 100 BRANDS EDITION 34
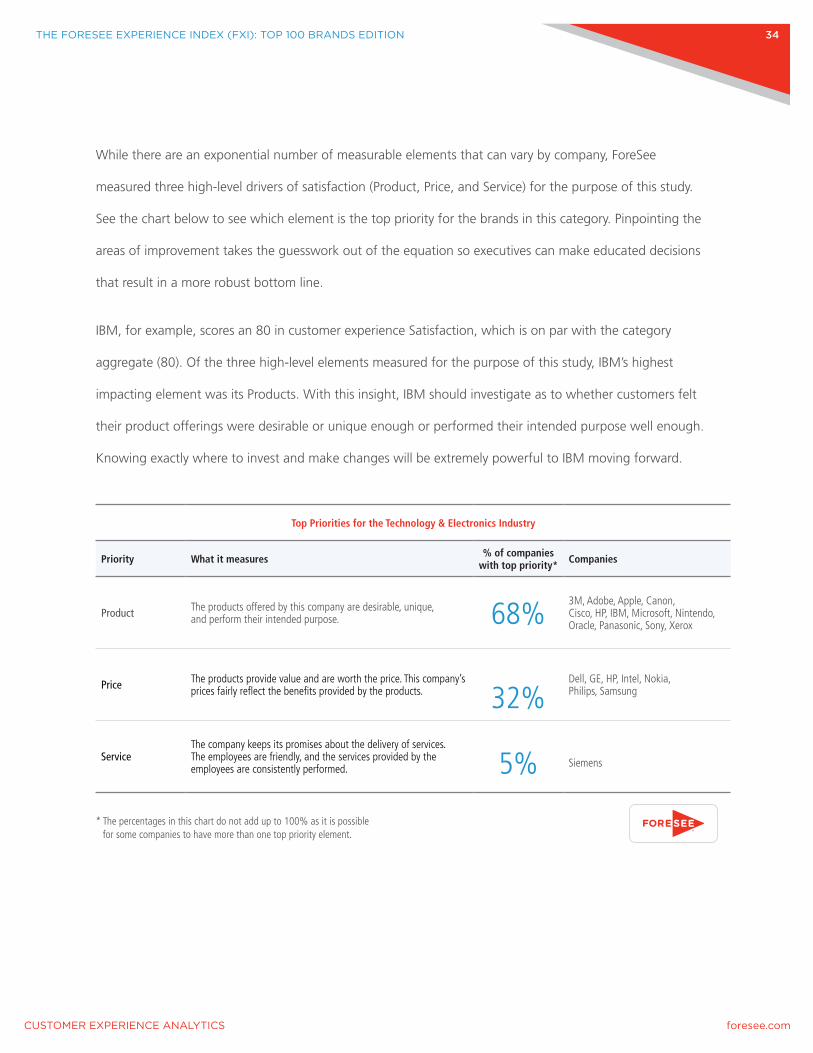
While there are an exponential number of measurable elements that can vary by company, ForeSee
measured three high-level drivers of satisfaction (Product, Price, and Service) for the purpose of this study.
See the chart below to see which element is the top priority for the brands in this category. Pinpointing the
areas of improvement takes the guesswork out of the equation so executives can make educated decisions
that result in a more robust bottom line.
IBM, for example, scores an 80 in customer experience Satisfaction, which is on par with the category
aggregate (80). Of the three high-level elements measured for the purpose of this study, IBM’s highest
impacting element was its Products. With this insight, IBM should investigate as to whether customers felt
their product offerings were desirable or unique enough or performed their intended purpose well enough.
Knowing exactly where to invest and make changes will be extremely powerful to IBM moving forward.
Top Priorities for the Technology & Electronics Industry
Priority What it measures % of companies with top priority* Companies
Product The products offered by this company are desirable, unique, and perform their intended purpose. 68%
3M, Adobe, Apple, Canon, Cisco, HP, IBM, Microsoft, Nintendo, Oracle, Panasonic, Sony, Xerox
Price The products provide value and are worth the price. This company’s prices fairly reflect the benefits provided by the products. 32%
Dell, GE, HP, Intel, Nokia, Philips, Samsung
ServiceThe company keeps its promises about the delivery of services. The employees are friendly, and the services provided by the employees are consistently performed. 5% Siemens
* The percentages in this chart do not add up to 100% as it is possible for some companies to have more than one top priority element.
THE FORESEE EXPERIENCE INDEX (FXI): TOP 100 BRANDS EDITION 35
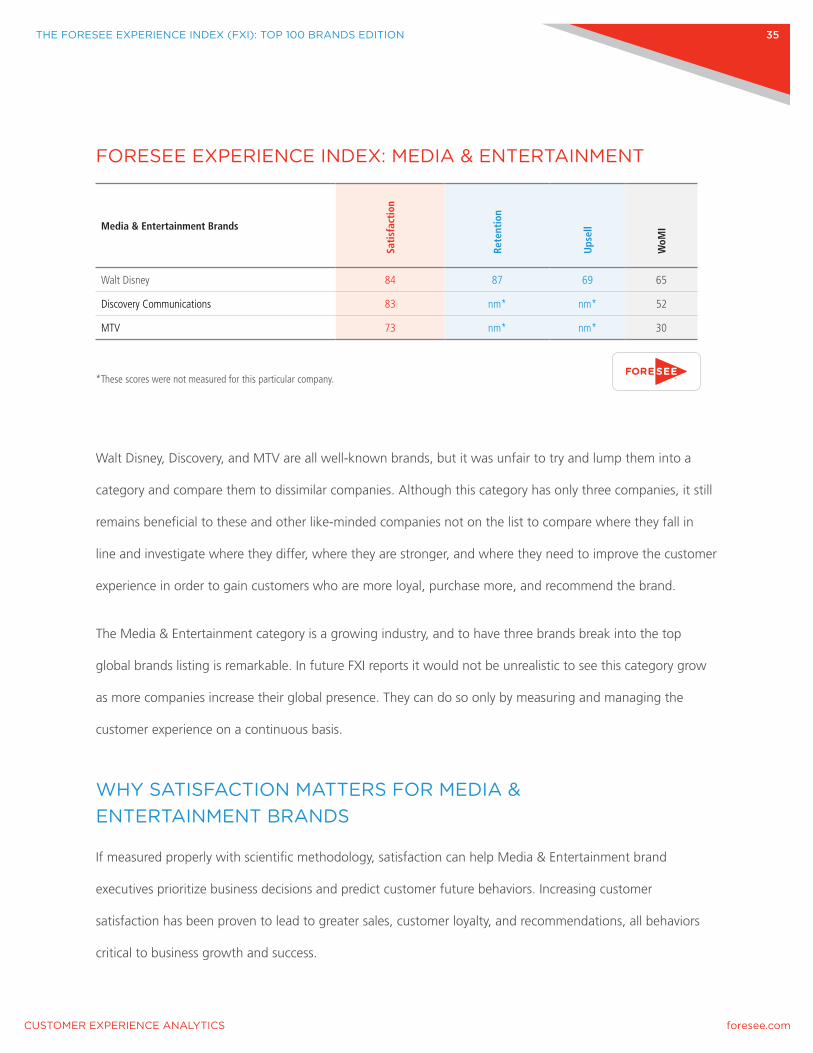
FORESEE EXPERIENCE INDEX: MEDIA & ENTERTAINMENT
Media & Entertainment Brands
Sati
sfac
tion
Rete
ntio
n
Ups
ell
WoM
I
Walt Disney 84 87 69 65
Discovery Communications 83 nm* nm* 52
MTV 73 nm* nm* 30
* These scores were not measured for this particular company.
Walt Disney, Discovery, and MTV are all well-known brands, but it was unfair to try and lump them into a
category and compare them to dissimilar companies. Although this category has only three companies, it still
remains beneficial to these and other like-minded companies not on the list to compare where they fall in
line and investigate where they differ, where they are stronger, and where they need to improve the customer
experience in order to gain customers who are more loyal, purchase more, and recommend the brand.
The Media & Entertainment category is a growing industry, and to have three brands break into the top
global brands listing is remarkable. In future FXI reports it would not be unrealistic to see this category grow
as more companies increase their global presence. They can do so only by measuring and managing the
customer experience on a continuous basis.
WHY SATISFACTION MATTERS FOR MEDIA & ENTERTAINMENT BRANDS
If measured properly with scientific methodology, satisfaction can help Media & Entertainment brand
executives prioritize business decisions and predict customer future behaviors. Increasing customer
satisfaction has been proven to lead to greater sales, customer loyalty, and recommendations, all behaviors
critical to business growth and success.

THE FORESEE EXPERIENCE INDEX (FXI): TOP 100 BRANDS EDITION 36
The chart below shows the measured Future Behaviors for the Media & Entertainment category and illustrates
the impact a highly satisfied customer can have on a company’s success compared to a less-satisfied one.
Future Behaviors for Media & Entertainment Brands
Future Behavior
This Index compares less-satisfied customers (with Satisfaction scores of 69 or less) to highly satisfied customers (with Satisfaction scores of 80 or higher) of the top Media & Entertainment brands to produce likelihood scores of some of the common Future Behaviors. This report shows highly satisfied customers of the top Media & Entertainment brands are:
Preference 75% more likely to prefer the brand or company over others.
Retention 56% more likely to continue doing business with the brand or company in the future.
Upsell 67% more likely to purchase additional products or sign up for additional services from the brand or company.
Future Purchase 61% more likely to purchase from the brand or company the next time they purchase the types of products the brand or company offers.
Recommend 75% more likely to recommend the brand or company to someone else.
Trust 71% more likely to count on this brand or company to act in their best interests, consider the brand or company to be trustworthy, and trust the brand or company to do what is right.
THE FORESEE EXPERIENCE INDEX (FXI): TOP 100 BRANDS EDITION 37
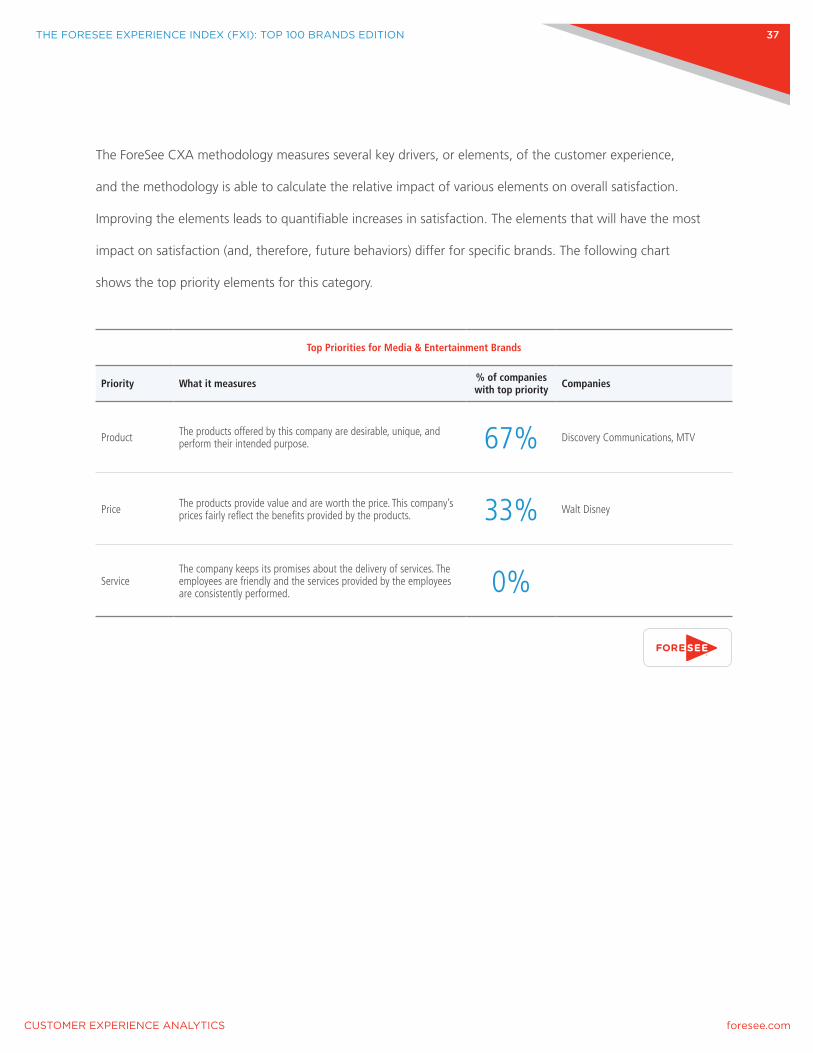
The ForeSee CXA methodology measures several key drivers, or elements, of the customer experience,
and the methodology is able to calculate the relative impact of various elements on overall satisfaction.
Improving the elements leads to quantifiable increases in satisfaction. The elements that will have the most
impact on satisfaction (and, therefore, future behaviors) differ for specific brands. The following chart
shows the top priority elements for this category.
Top Priorities for Media & Entertainment Brands
Priority What it measures % of companies with top priority Companies
Product The products offered by this company are desirable, unique, and perform their intended purpose. 67% Discovery Communications, MTV
Price The products provide value and are worth the price. This company’s prices fairly reflect the benefits provided by the products. 33% Walt Disney
ServiceThe company keeps its promises about the delivery of services. The employees are friendly and the services provided by the employees are consistently performed. 0%
THE FORESEE EXPERIENCE INDEX (FXI): TOP 100 BRANDS EDITION 38
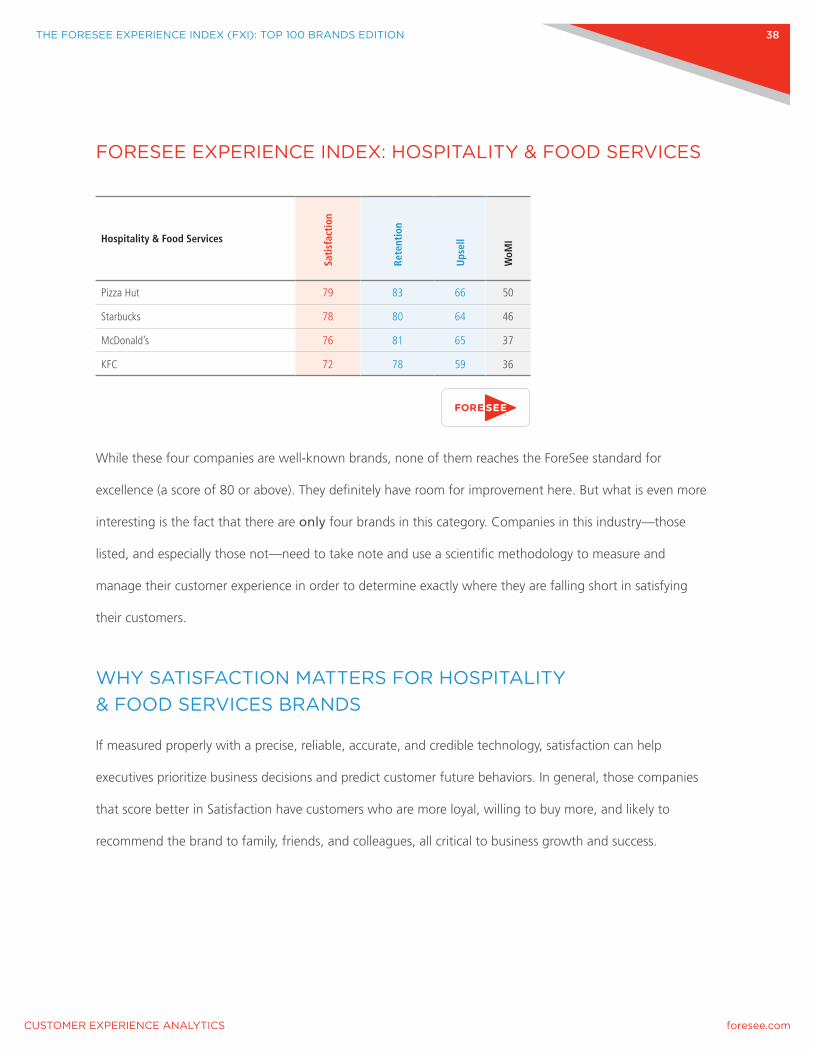
FORESEE EXPERIENCE INDEX: HOSPITALITY & FOOD SERVICES
Hospitality & Food Services
Sati
sfac
tion
Rete
ntio
n
Ups
ell
WoM
I
Pizza Hut 79 83 66 50
Starbucks 78 80 64 46
McDonald’s 76 81 65 37
KFC 72 78 59 36
While these four companies are well-known brands, none of them reaches the ForeSee standard for
excellence (a score of 80 or above). They definitely have room for improvement here. But what is even more
interesting is the fact that there are only four brands in this category. Companies in this industry—those
listed, and especially those not—need to take note and use a scientific methodology to measure and
manage their customer experience in order to determine exactly where they are falling short in satisfying
their customers.
WHY SATISFACTION MATTERS FOR HOSPITALITY & FOOD SERVICES BRANDS
If measured properly with a precise, reliable, accurate, and credible technology, satisfaction can help
executives prioritize business decisions and predict customer future behaviors. In general, those companies
that score better in Satisfaction have customers who are more loyal, willing to buy more, and likely to
recommend the brand to family, friends, and colleagues, all critical to business growth and success.
THE FORESEE EXPERIENCE INDEX (FXI): TOP 100 BRANDS EDITION 39
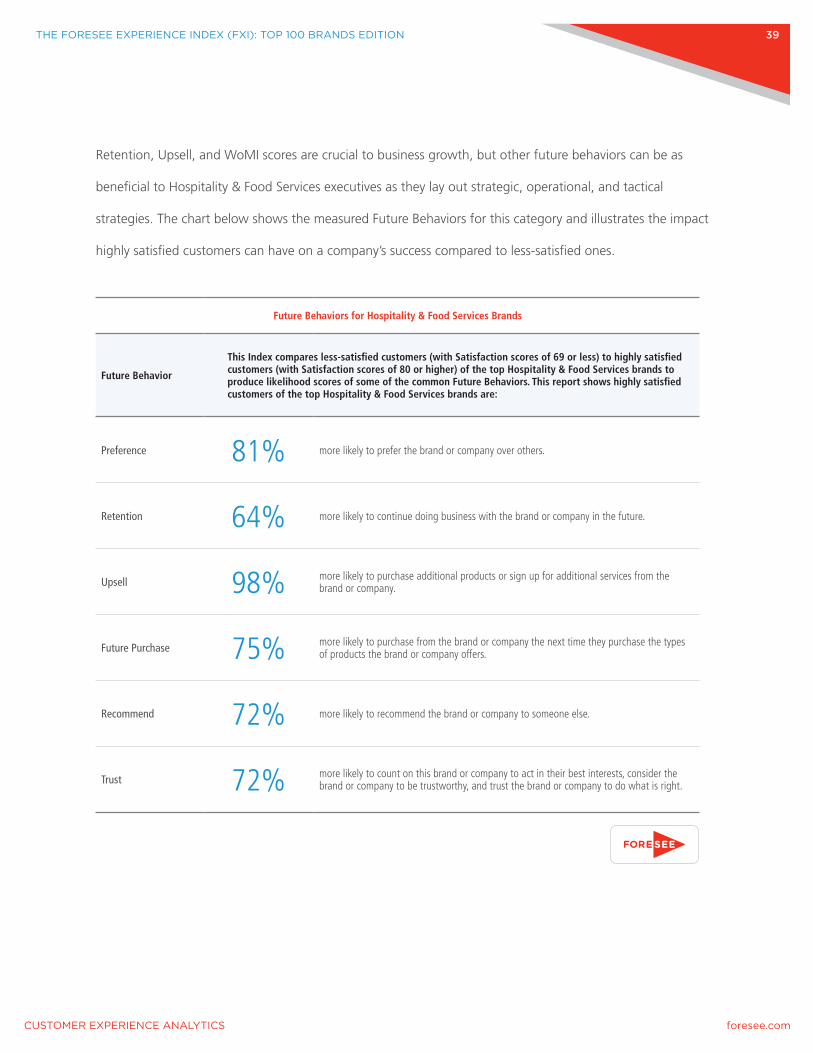
Retention, Upsell, and WoMI scores are crucial to business growth, but other future behaviors can be as
beneficial to Hospitality & Food Services executives as they lay out strategic, operational, and tactical
strategies. The chart below shows the measured Future Behaviors for this category and illustrates the impact
highly satisfied customers can have on a company’s success compared to less-satisfied ones.
Future Behaviors for Hospitality & Food Services Brands
Future Behavior
This Index compares less-satisfied customers (with Satisfaction scores of 69 or less) to highly satisfied customers (with Satisfaction scores of 80 or higher) of the top Hospitality & Food Services brands to produce likelihood scores of some of the common Future Behaviors. This report shows highly satisfied customers of the top Hospitality & Food Services brands are:
Preference 81% more likely to prefer the brand or company over others.
Retention 64% more likely to continue doing business with the brand or company in the future.
Upsell 98% more likely to purchase additional products or sign up for additional services from the brand or company.
Future Purchase 75% more likely to purchase from the brand or company the next time they purchase the types of products the brand or company offers.
Recommend 72% more likely to recommend the brand or company to someone else.
Trust 72% more likely to count on this brand or company to act in their best interests, consider the brand or company to be trustworthy, and trust the brand or company to do what is right.

THE FORESEE EXPERIENCE INDEX (FXI): TOP 100 BRANDS EDITION 40
In order to increase sales, retention, and recommendations, brand executives need to know how to increase
satisfaction. The ForeSee CXA methodology measures several key drivers, or elements, of the customer
experience, and the methodology is able to calculate the relative impact of various elements on overall
satisfaction. The elements that will have the most impact on satisfaction (and, therefore, future behaviors)
differ for specific brands. The following chart shows the top priority elements for the companies
in this category.
Elements of the Customer Experience for Hospitality & Food Services Brands
Priority What it measures % of companies with top priority* Companies
ProductThe products offered by this company are desirable, unique, and perform their intended purpose. 50% Pizza Hut, Starbucks
ServiceThe company keeps its promises about the delivery of services. The employees are friendly, and the services provided by the employees are consistently performed. 50% KFC, McDonald’s
PriceThe products provide value and are worth the price. This company’s prices fairly reflect the benefits provided by the products. 25%
McDonald’s
* The percentages in this chart do not add up to 100% as it is possible for some companies to have more than one top priority element.
THE FORESEE EXPERIENCE INDEX (FXI): TOP 100 BRANDS EDITION 41
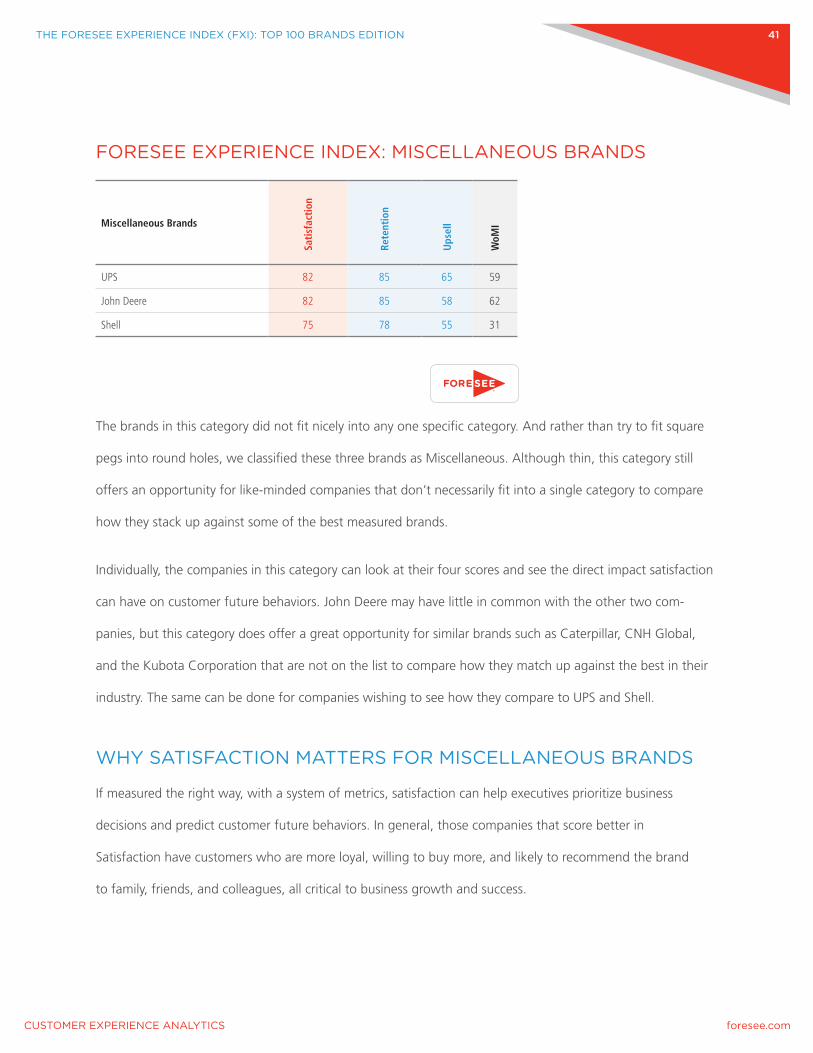
FORESEE EXPERIENCE INDEX: MISCELLANEOUS BRANDS
Miscellaneous Brands
Sati
sfac
tion
Rete
ntio
n
Ups
ell
WoM
I
UPS 82 85 65 59
John Deere 82 85 58 62
Shell 75 78 55 31
The brands in this category did not fit nicely into any one specific category. And rather than try to fit square
pegs into round holes, we classified these three brands as Miscellaneous. Although thin, this category still
offers an opportunity for like-minded companies that don’t necessarily fit into a single category to compare
how they stack up against some of the best measured brands.
Individually, the companies in this category can look at their four scores and see the direct impact satisfaction
can have on customer future behaviors. John Deere may have little in common with the other two com-
panies, but this category does offer a great opportunity for similar brands such as Caterpillar, CNH Global,
and the Kubota Corporation that are not on the list to compare how they match up against the best in their
industry. The same can be done for companies wishing to see how they compare to UPS and Shell.
WHY SATISFACTION MATTERS FOR MISCELLANEOUS BRANDS
If measured the right way, with a system of metrics, satisfaction can help executives prioritize business
decisions and predict customer future behaviors. In general, those companies that score better in
Satisfaction have customers who are more loyal, willing to buy more, and likely to recommend the brand
to family, friends, and colleagues, all critical to business growth and success.

THE FORESEE EXPERIENCE INDEX (FXI): TOP 100 BRANDS EDITION 42
Increasing customer satisfaction has been proven to lead to greater sales, customer loyalty, recommendations,
and even trust with the brand overall. The chart below outlines this category’s future behaviors scores for a
highly satisfied customer’s likelihood to recommend and trust the brand.
Future Behaviors for Miscellaneous Brands
Future Behavior
This index compares less-satisfied customers (with Satisfaction scores of 69 or less) to highly satisfied customers (with Satisfaction scores of 80 or higher) of the top Miscellaneous brands to produce likelihood scores of some of the common future behaviors. This report shows highly satisfied customers of the top Miscellaneous brands are:
Preference 82% more likely to prefer the brand or company over others.
Retention 65% more likely to continue doing business with the brand or company in the future.
Upsell 82% more likely to purchase additional products or sign up for additional services from the brand or company.
Future Purchase 78% more likely to purchase from the brand or company the next time they purchase the types of products the brand or company offers.
Recommend 98% more likely to recommend the brand or company to someone else.
Trust 85% more likely to count on this brand or company to act in their best interests, consider the brand or company to be trustworthy, and trust the brand or company to do what is right.
THE FORESEE EXPERIENCE INDEX (FXI): TOP 100 BRANDS EDITION 43
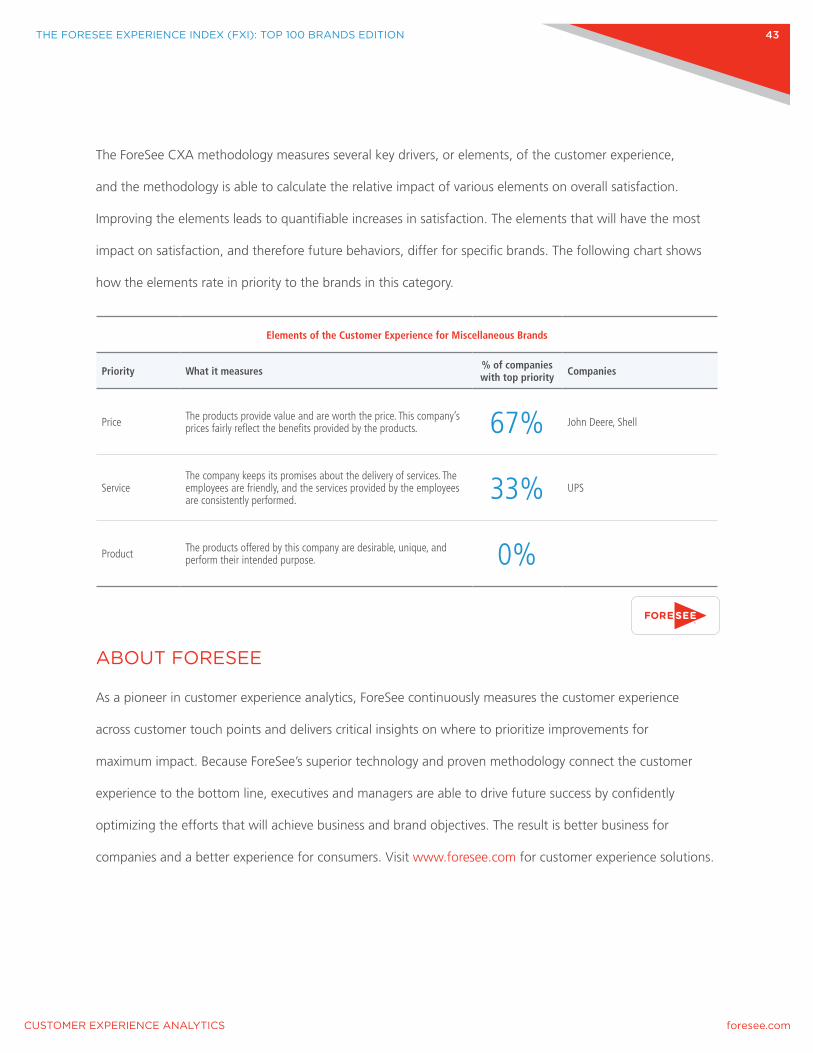
The ForeSee CXA methodology measures several key drivers, or elements, of the customer experience,
and the methodology is able to calculate the relative impact of various elements on overall satisfaction.
Improving the elements leads to quantifiable increases in satisfaction. The elements that will have the most
impact on satisfaction, and therefore future behaviors, differ for specific brands. The following chart shows
how the elements rate in priority to the brands in this category.
Elements of the Customer Experience for Miscellaneous Brands
Priority What it measures % of companies with top priority Companies
Price The products provide value and are worth the price. This company’s prices fairly reflect the benefits provided by the products. 67% John Deere, Shell
ServiceThe company keeps its promises about the delivery of services. The employees are friendly, and the services provided by the employees are consistently performed. 33% UPS
Product The products offered by this company are desirable, unique, and perform their intended purpose. 0%
ABOUT FORESEE
As a pioneer in customer experience analytics, ForeSee continuously measures the customer experience
across customer touch points and delivers critical insights on where to prioritize improvements for
maximum impact. Because ForeSee’s superior technology and proven methodology connect the customer
experience to the bottom line, executives and managers are able to drive future success by confidently
optimizing the efforts that will achieve business and brand objectives. The result is better business for
companies and a better experience for consumers. Visit www.foresee.com for customer experience solutions.
THE FORESEE EXPERIENCE INDEX (FXI): TOP 100 BRANDS EDITION 44
APPENDIX A
As written about in the recently released book Innovating Analytics – Word of Mouth Index: How the Next
Generation of Net Promoter Can Increase Sales and Drive Business Results (Wiley, September 2013), ForeSee
has collected more than two million survey responses over the last two years to research and develop a better,
more accurate, and precise way to measure both promoters AND detractors. ForeSee’s research made it clear
that the Net Promoter Score (NPS) needed to evolve so that the thousands of organizations who rely on it as
a metric can be sure the key performance indicators (KPIs) they use to manage their business are accurate,
reliable, and precise.
As a result, ForeSee conceived the Word of Mouth IndexSM (WoMISM) as the next generation of NPS.
While NPS asks customers only “How likely are you to recommend this company?” and assumes that those
who are not recommending are actively detracting. WoMI measures both likelihood to recommend and
likelihood to detract from a specific brand by adding a second question: “How likely are you to discourage
others from doing business with this company?” By measuring both positive and negative word of mouth,
business leaders gain a next-generation metric that, when viewed within the context of the customer
experience ecosystem of metrics, provides actionable insights that can help leaders improve key business
outcomes, including word of mouth.
Innovating Analytics highlights the vast degree by which NPS overstates detractors for the biggest
companies in the world. This assumption that anyone who is not a promoter is actively detracting from
the business is NPS’s biggest flaw and could cause companies that use NPS as a KPI to make poor
business decisions.
ForeSee’s study found that NPS overstates brand detractors by 867% on average. Companies are
creating incentive systems for executives and managers as well as investing significant resources chasing
after detractors, and they’re using a metric that is overstating detractors many hundreds of times over.
THE FORESEE EXPERIENCE INDEX (FXI): TOP 100 BRANDS EDITION 45
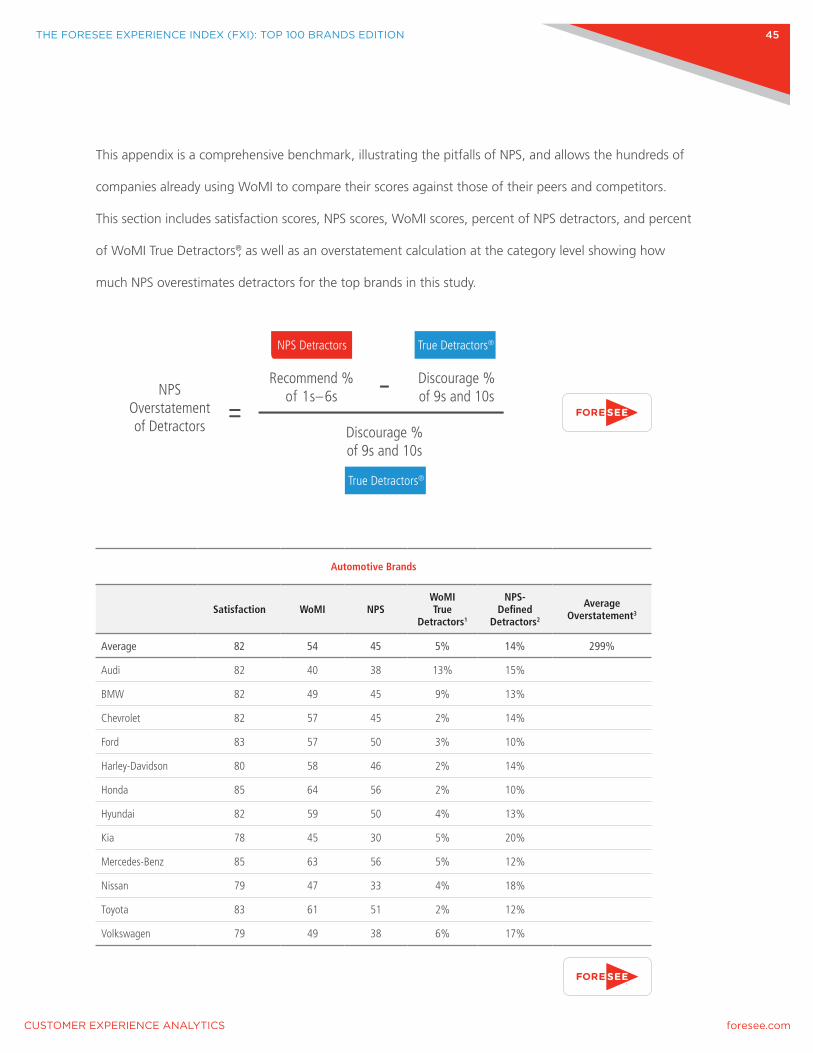
This appendix is a comprehensive benchmark, illustrating the pitfalls of NPS, and allows the hundreds of
companies already using WoMI to compare their scores against those of their peers and competitors.
This section includes satisfaction scores, NPS scores, WoMI scores, percent of NPS detractors, and percent
of WoMI True Detractors®, as well as an overstatement calculation at the category level showing how
much NPS overestimates detractors for the top brands in this study.
Automotive Brands
Satisfaction WoMI NPSWoMI True
Detractors1
NPS-Defined
Detractors2
Average Overstatement3
Average 82 54 45 5% 14% 299%
Audi 82 40 38 13% 15%
BMW 82 49 45 9% 13%
Chevrolet 82 57 45 2% 14%
Ford 83 57 50 3% 10%
Harley-Davidson 80 58 46 2% 14%
Honda 85 64 56 2% 10%
Hyundai 82 59 50 4% 13%
Kia 78 45 30 5% 20%
Mercedes-Benz 85 63 56 5% 12%
Nissan 79 47 33 4% 18%
Toyota 83 61 51 2% 12%
Volkswagen 79 49 38 6% 17%
NPSOverstatementof Detractors
Recommend %of 1s–6s
Discourage %of 9s and 10s
Discourage %of 9s and 10s
NPS Detractors True Detractors®
True Detractors®
THE FORESEE EXPERIENCE INDEX (FXI): TOP 100 BRANDS EDITION 46
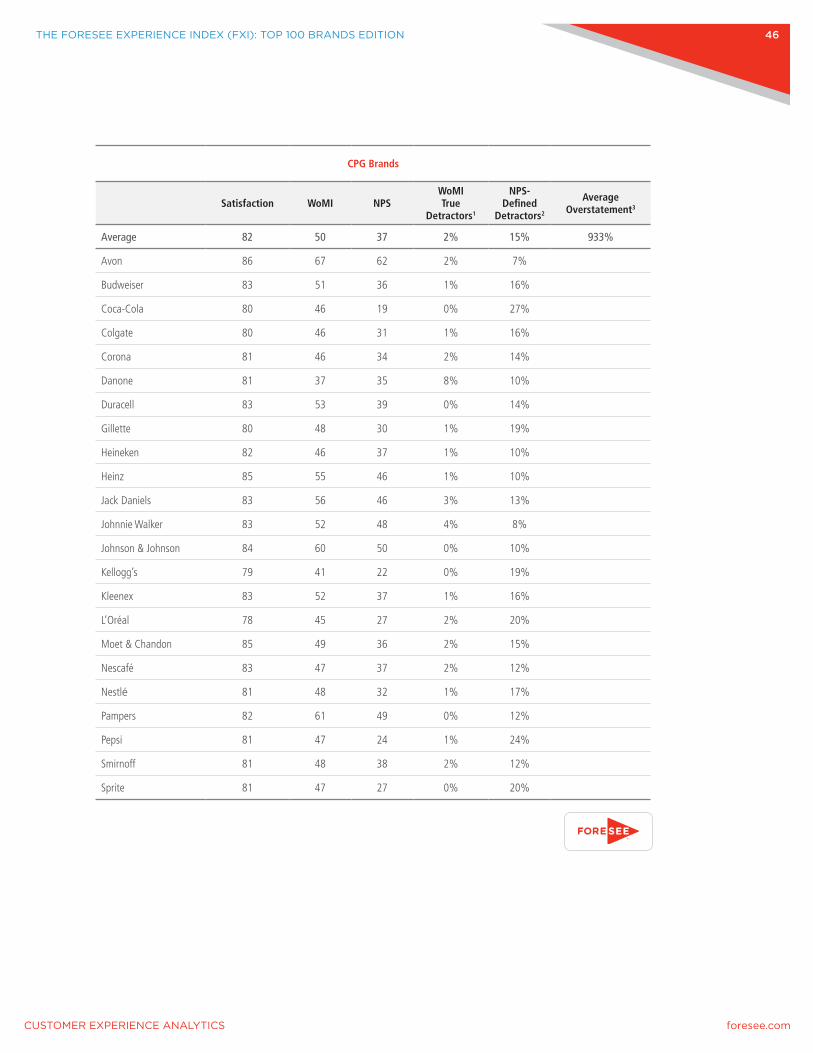
CPG Brands
Satisfaction WoMI NPSWoMI True
Detractors1
NPS-Defined
Detractors2
Average Overstatement3
Average 82 50 37 2% 15% 933%
Avon 86 67 62 2% 7%
Budweiser 83 51 36 1% 16%
Coca-Cola 80 46 19 0% 27%
Colgate 80 46 31 1% 16%
Corona 81 46 34 2% 14%
Danone 81 37 35 8% 10%
Duracell 83 53 39 0% 14%
Gillette 80 48 30 1% 19%
Heineken 82 46 37 1% 10%
Heinz 85 55 46 1% 10%
Jack Daniels 83 56 46 3% 13%
Johnnie Walker 83 52 48 4% 8%
Johnson & Johnson 84 60 50 0% 10%
Kellogg’s 79 41 22 0% 19%
Kleenex 83 52 37 1% 16%
L’Oréal 78 45 27 2% 20%
Moet & Chandon 85 49 36 2% 15%
Nescafé 83 47 37 2% 12%
Nestlé 81 48 32 1% 17%
Pampers 82 61 49 0% 12%
Pepsi 81 47 24 1% 24%
Smirnoff 81 48 38 2% 12%
Sprite 81 47 27 0% 20%
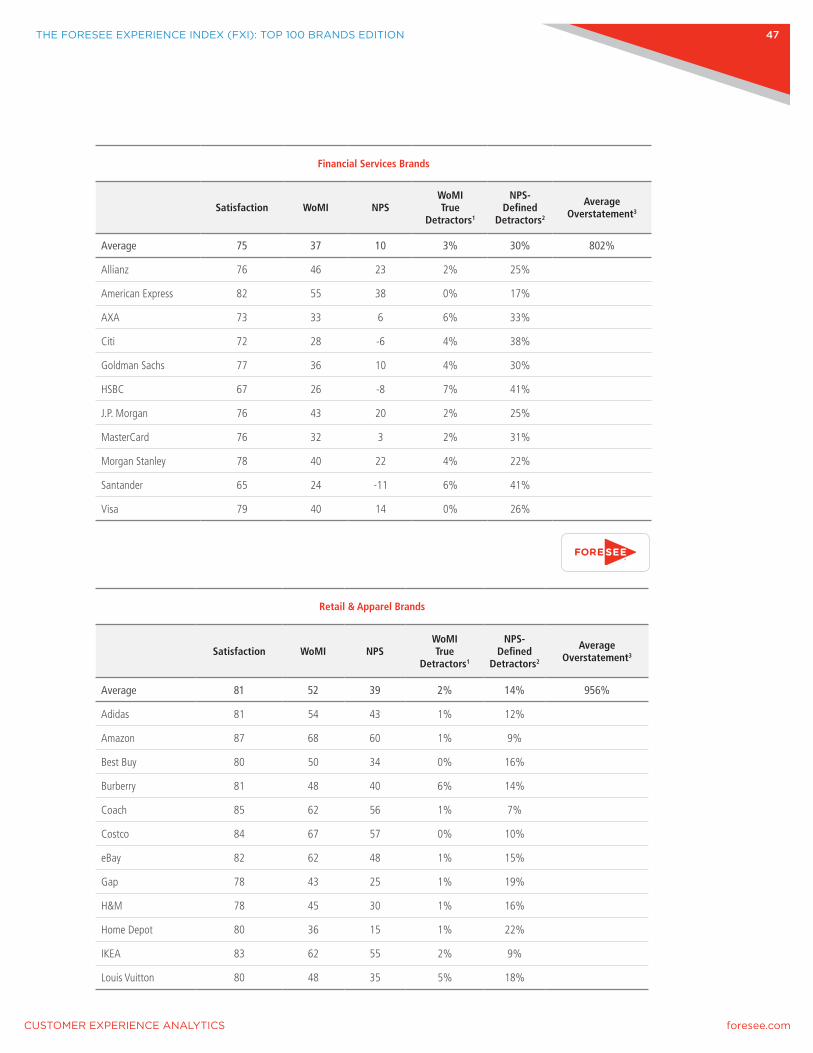
THE FORESEE EXPERIENCE INDEX (FXI): TOP 100 BRANDS EDITION 47
Financial Services Brands
Satisfaction WoMI NPSWoMI True
Detractors1
NPS-Defined
Detractors2
Average Overstatement3
Average 75 37 10 3% 30% 802%
Allianz 76 46 23 2% 25%
American Express 82 55 38 0% 17%
AXA 73 33 6 6% 33%
Citi 72 28 -6 4% 38%
Goldman Sachs 77 36 10 4% 30%
HSBC 67 26 -8 7% 41%
J.P. Morgan 76 43 20 2% 25%
MasterCard 76 32 3 2% 31%
Morgan Stanley 78 40 22 4% 22%
Santander 65 24 -11 6% 41%
Visa 79 40 14 0% 26%
Retail & Apparel Brands
Satisfaction WoMI NPSWoMI True
Detractors1
NPS-Defined
Detractors2
Average Overstatement3
Average 81 52 39 2% 14% 956%
Adidas 81 54 43 1% 12%
Amazon 87 68 60 1% 9%
Best Buy 80 50 34 0% 16%
Burberry 81 48 40 6% 14%
Coach 85 62 56 1% 7%
Costco 84 67 57 0% 10%
eBay 82 62 48 1% 15%
Gap 78 43 25 1% 19%
H&M 78 45 30 1% 16%
Home Depot 80 36 15 1% 22%
IKEA 83 62 55 2% 9%
Louis Vuitton 80 48 35 5% 18%
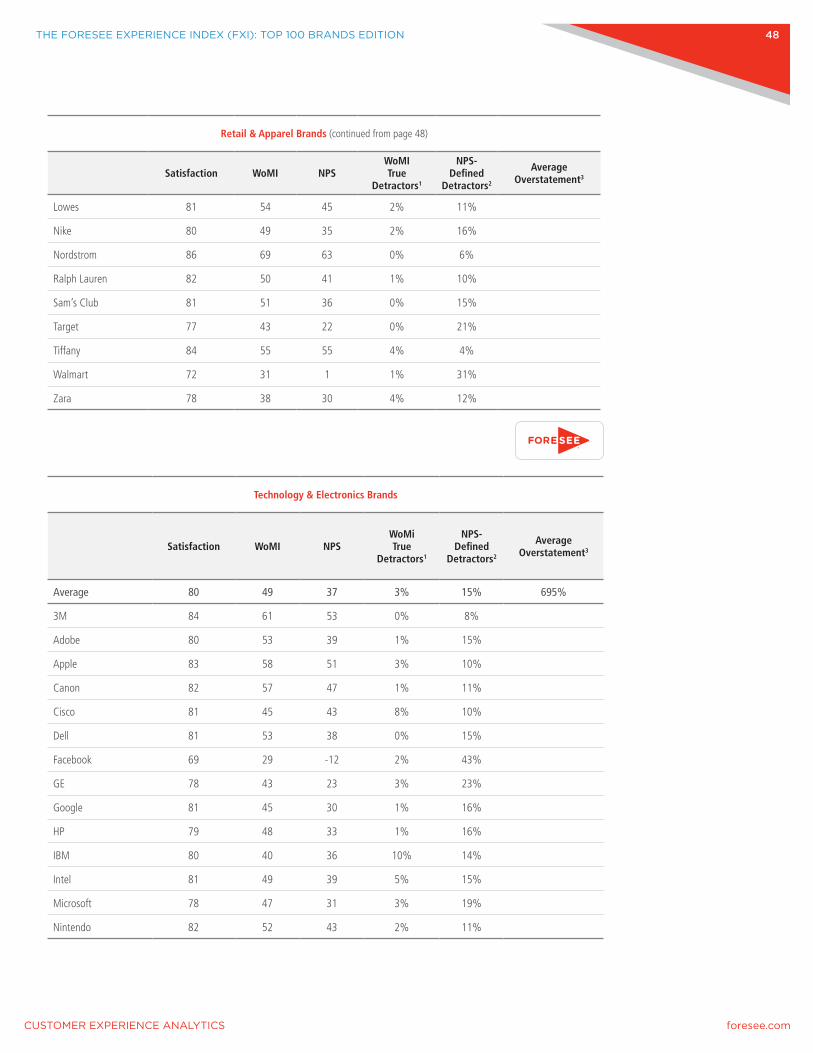
THE FORESEE EXPERIENCE INDEX (FXI): TOP 100 BRANDS EDITION 48
Retail & Apparel Brands (continued from page 48)
Satisfaction WoMI NPSWoMI True
Detractors1
NPS-Defined
Detractors2
Average Overstatement3
Lowes 81 54 45 2% 11%
Nike 80 49 35 2% 16%
Nordstrom 86 69 63 0% 6%
Ralph Lauren 82 50 41 1% 10%
Sam’s Club 81 51 36 0% 15%
Target 77 43 22 0% 21%
Tiffany 84 55 55 4% 4%
Walmart 72 31 1 1% 31%
Zara 78 38 30 4% 12%
Technology & Electronics Brands
Satisfaction WoMI NPSWoMi True
Detractors1
NPS-Defined
Detractors2
Average Overstatement3
Average 80 49 37 3% 15% 695%
3M 84 61 53 0% 8%
Adobe 80 53 39 1% 15%
Apple 83 58 51 3% 10%
Canon 82 57 47 1% 11%
Cisco 81 45 43 8% 10%
Dell 81 53 38 0% 15%
Facebook 69 29 -12 2% 43%
GE 78 43 23 3% 23%
Google 81 45 30 1% 16%
HP 79 48 33 1% 16%
IBM 80 40 36 10% 14%
Intel 81 49 39 5% 15%
Microsoft 78 47 31 3% 19%
Nintendo 82 52 43 2% 11%
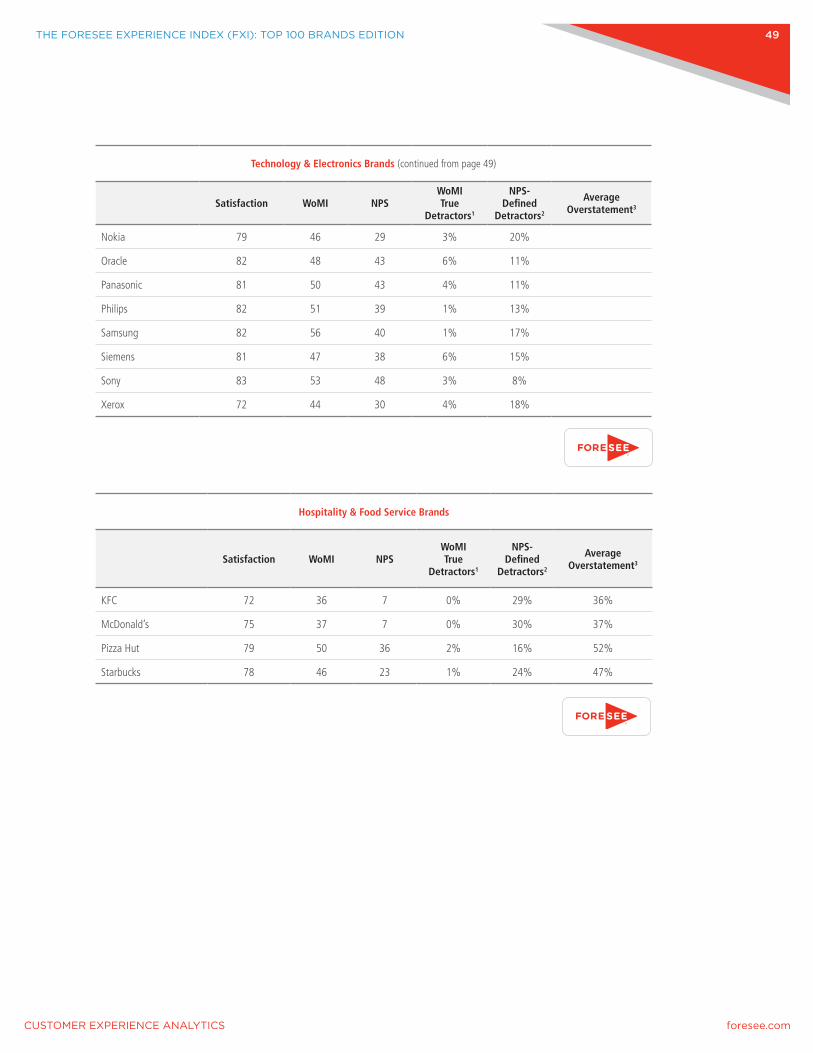
THE FORESEE EXPERIENCE INDEX (FXI): TOP 100 BRANDS EDITION 49
Technology & Electronics Brands (continued from page 49)
Satisfaction WoMI NPSWoMI True
Detractors1
NPS-Defined
Detractors2
Average Overstatement3
Nokia 79 46 29 3% 20%
Oracle 82 48 43 6% 11%
Panasonic 81 50 43 4% 11%
Philips 82 51 39 1% 13%
Samsung 82 56 40 1% 17%
Siemens 81 47 38 6% 15%
Sony 83 53 48 3% 8%
Xerox 72 44 30 4% 18%
Hospitality & Food Service Brands
Satisfaction WoMI NPSWoMI True
Detractors1
NPS-Defined
Detractors2
Average Overstatement3
KFC 72 36 7 0% 29% 36%
McDonald’s 75 37 7 0% 30% 37%
Pizza Hut 79 50 36 2% 16% 52%
Starbucks 78 46 23 1% 24% 47%
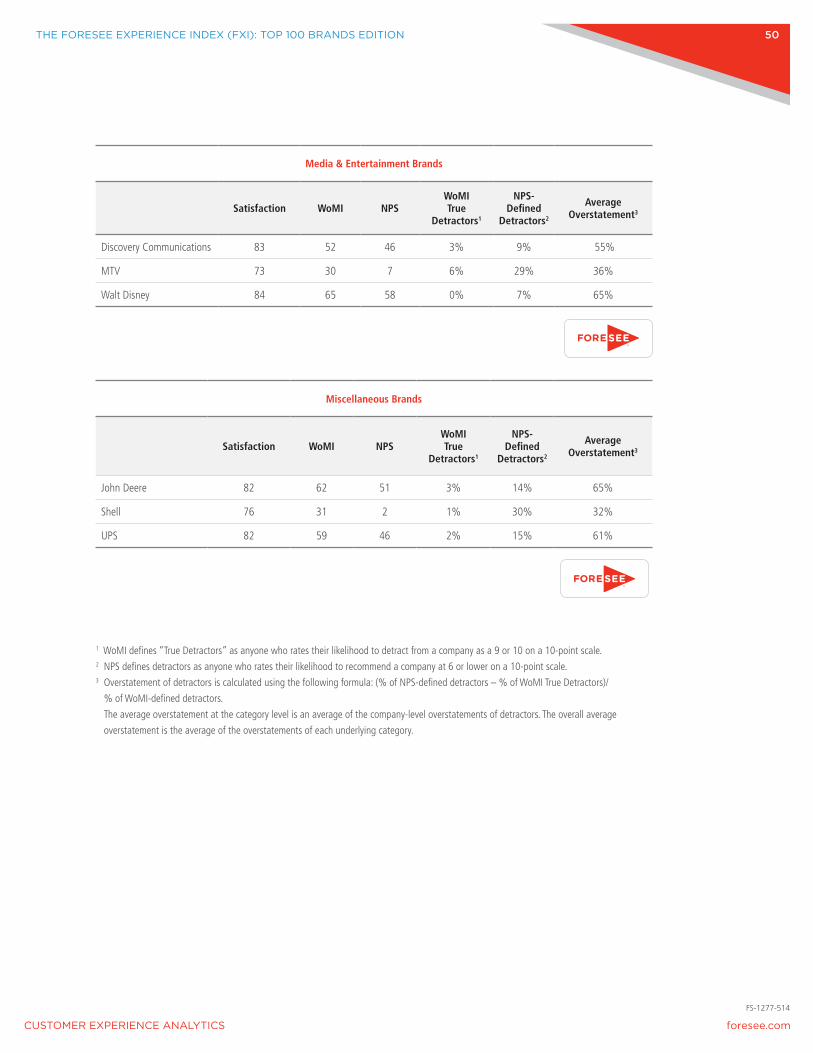
THE FORESEE EXPERIENCE INDEX (FXI): TOP 100 BRANDS EDITION 50
Media & Entertainment Brands
Satisfaction WoMI NPSWoMI True
Detractors1
NPS-Defined
Detractors2
Average Overstatement3
Discovery Communications 83 52 46 3% 9% 55%
MTV 73 30 7 6% 29% 36%
Walt Disney 84 65 58 0% 7% 65%
Miscellaneous Brands
Satisfaction WoMI NPSWoMI True
Detractors1
NPS-Defined
Detractors2
Average Overstatement3
John Deere 82 62 51 3% 14% 65%
Shell 76 31 2 1% 30% 32%
UPS 82 59 46 2% 15% 61%
1 WoMI defines “True Detractors” as anyone who rates their likelihood to detract from a company as a 9 or 10 on a 10-point scale. 2 NPS defines detractors as anyone who rates their likelihood to recommend a company at 6 or lower on a 10-point scale. 3 Overstatement of detractors is calculated using the following formula: (% of NPS-defined detractors – % of WoMI True Detractors)/
% of WoMI-defined detractors.
The average overstatement at the category level is an average of the company-level overstatements of detractors. The overall average
overstatement is the average of the overstatements of each underlying category.
FS-1277-514