The following slides are not contractual in nature and … · FMEA Trained Employee • Apollo or...
44
1 The following slides are not contractual in nature and are for information purposes only as of June 2015. ©2015, Lockheed Martin Corporation. All Rights Reserved.
Transcript of The following slides are not contractual in nature and … · FMEA Trained Employee • Apollo or...

1
The following slides are not contractual in nature and are for information purposes only as of June 2015.
©2015, Lockheed Martin Corporation. All Rights Reserved.
2
Corrective Action Root Cause Analysis and Corrective
Action
©2015, Lockheed Martin Corporation. All Rights Reserved.

3
Overview Webinar 6: Root Cause Analysis
and Corrective Action
• What is Root Cause Analysis (RCA)? • Why is RCA important? • When is RCA required? • Overview of the Corrective Action Process • Root Cause Analysis Tools: The 5-Whys Ishikawa Cause & Effect (Fishbone) Diagrams Cause Mapping Failure Modes & Effects Analysis Design of Experiments
4
What is Root Cause Analysis (RCA)?
Root Cause Analysis (RCA): The process of identifying all the causes (root causes and contributing causes) that have or may have generated an undesirable condition, situation, nonconformity, or failure.
» IAQG – Root Cause Analysis and Problem Solving April 2014.
5
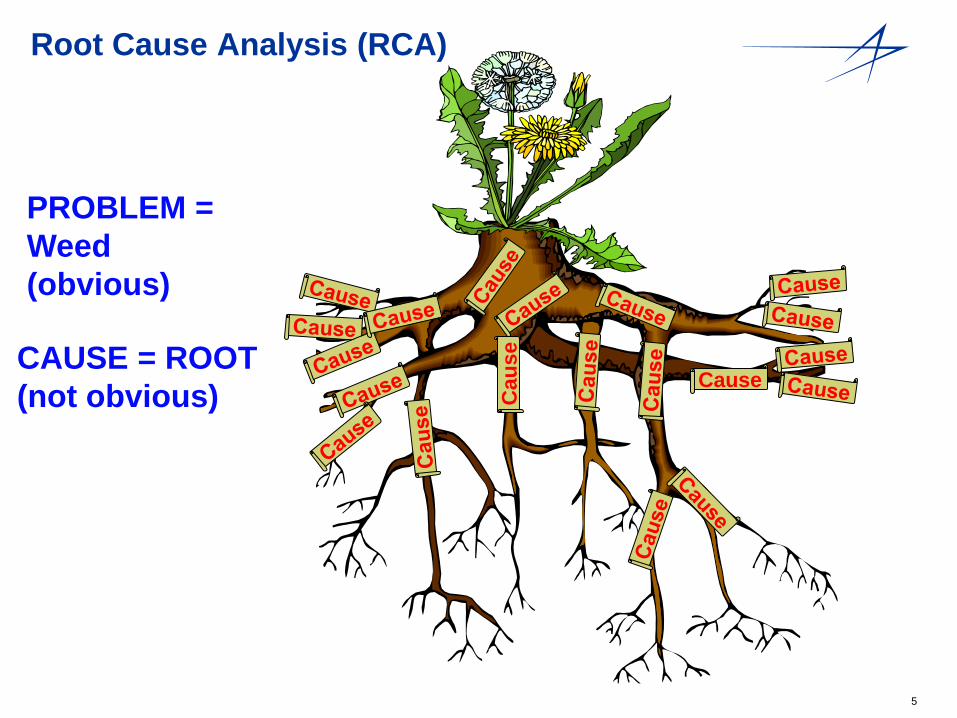
Root Cause Analysis (RCA)
Cau
se
Cause CAUSE = ROOT (not obvious)
PROBLEM = Weed (obvious)
6
Why Root Cause Analysis (RCA)?
• Helps prevent problems from repeating or occurring. • Focus on Continuous Improvement throughout the
Enterprise. • Drives Breakthrough Performance. • Focus on improving processes that actually effect
organization performance metrics.

7
When is RCA required? • Undesirable condition, defect, or failure is detected • Safety • Product strength, performance, reliability • High impact on Operations • Repetitive Problems • Customer Request • Significant Quality Management System (QMS) issues
» IAQG – Root Cause Analysis and Problem Solving, April 2014
8
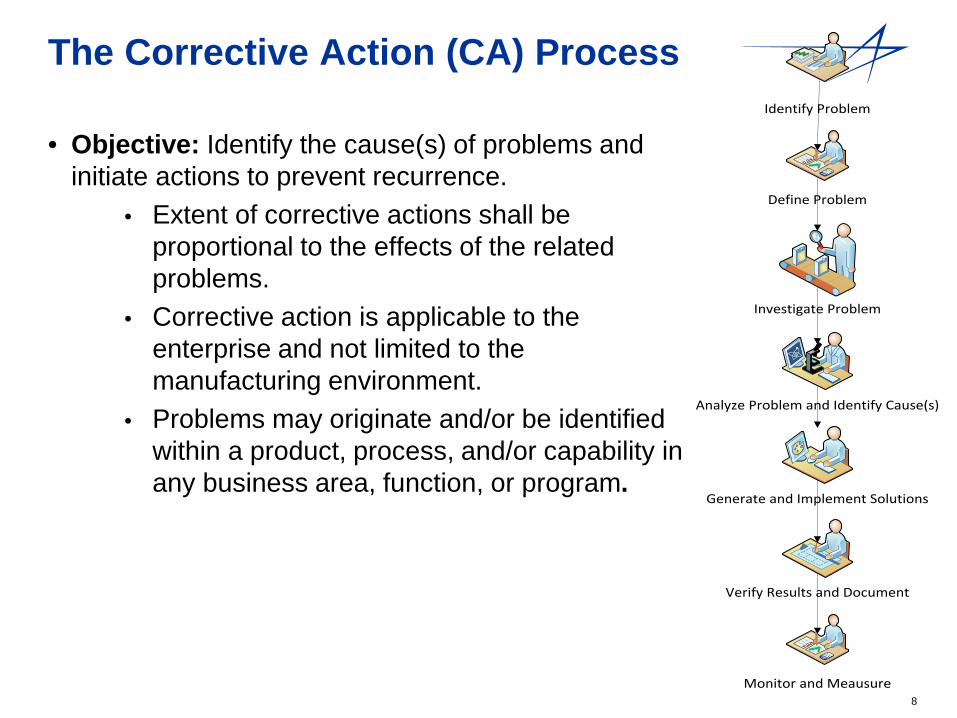
The Corrective Action (CA) Process
• Objective: Identify the cause(s) of problems and initiate actions to prevent recurrence.
• Extent of corrective actions shall be proportional to the effects of the related problems.
• Corrective action is applicable to the enterprise and not limited to the manufacturing environment.
• Problems may originate and/or be identified within a product, process, and/or capability in any business area, function, or program.
Define Problem
Verify Results and Document
Monitor and Meausure
Generate and Implement Solutions
Analyze Problem and Identify Cause(s)
Identify Problem
Investigate Problem
9
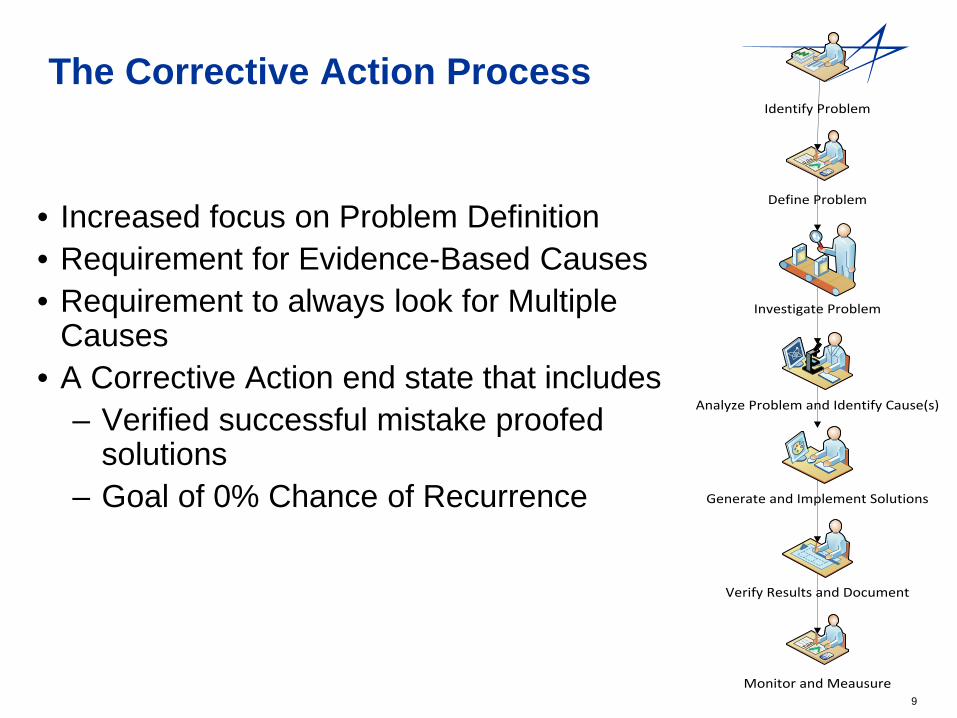
The Corrective Action Process
• Increased focus on Problem Definition • Requirement for Evidence-Based Causes • Requirement to always look for Multiple
Causes • A Corrective Action end state that includes
– Verified successful mistake proofed solutions
– Goal of 0% Chance of Recurrence
Define Problem
Verify Results and Document
Monitor and Meausure
Generate and Implement Solutions
Analyze Problem and Identify Cause(s)
Identify Problem
Investigate Problem
10
Overview of the Corrective Action Process
• Step 1: Identify the Problem • Step 2: Define the Problem • Step 3: Investigate the Problem (Complete Containment
Actions) • Step 4: Analyze the Problem & Identify Root Cause (s) • Step 5: Generate, Select and Implement Solutions (CA) • Step 6: Verify the Results and Document • Step 7: Monitor and Measure Corrective Actions
11
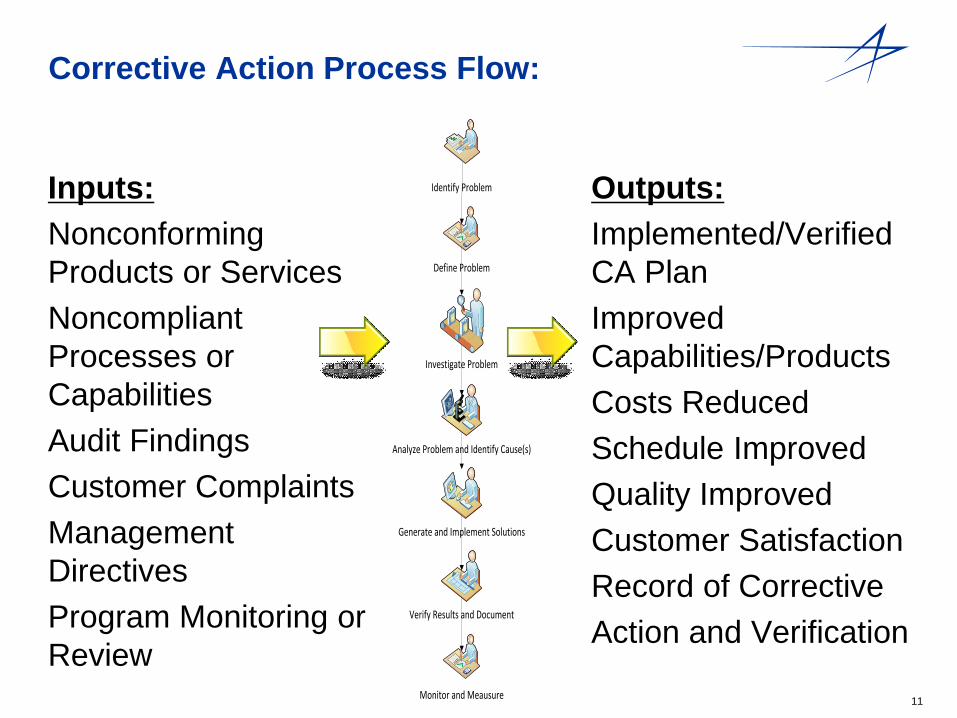
Corrective Action Process Flow:
Inputs: Nonconforming Products or Services Noncompliant Processes or Capabilities Audit Findings Customer Complaints Management Directives Program Monitoring or Review
Outputs: Implemented/Verified CA Plan Improved Capabilities/Products Costs Reduced Schedule Improved Quality Improved Customer Satisfaction Record of Corrective Action and Verification
Define Problem
Verify Results and Document
Monitor and Meausure
Generate and Implement Solutions
Analyze Problem and Identify Cause(s)
Identify Problem
Investigate Problem
12
Corrective Action Process • 7 tools to determine root cause:
– The 5 Why's – Cause & Effect Diagram (Fishbone) – Cause Mapping – FMEA: Failure Modes & Effects Analysis – Fault Tree Analysis – DOE: Design Of Experiments – Statistical Process Control
• Perform a Cause/Failure Analysis to determine the cause(s) of the problem. The appropriate root cause analysis tool will be used.
• The RCA tools are utilized and retained/attached as objective evidence to support root cause validation.
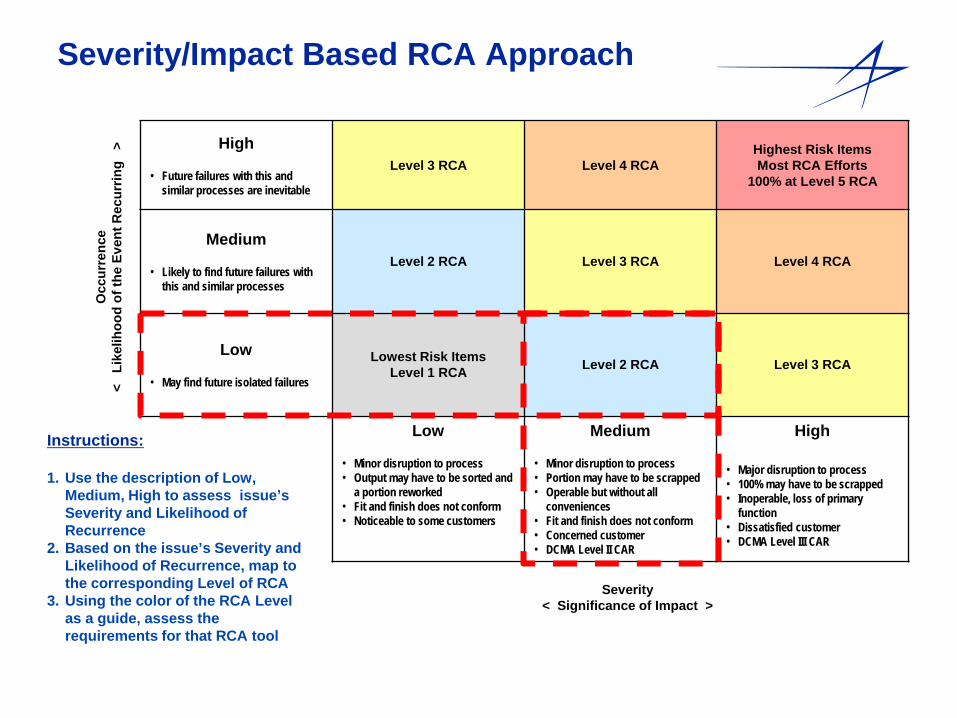
Severity/Impact Based RCA Approach
High
• Future failures with this and similar processes are inevitable
Level 3 RCA Level 4 RCA Highest Risk Items Most RCA Efforts
100% at Level 5 RCA
Medium
• Likely to find future failures with this and similar processes
Level 2 RCA Level 3 RCA Level 4 RCA
Low
• May find future isolated failures
Lowest Risk Items Level 1 RCA Level 2 RCA Level 3 RCA
Low
• Minor disruption to process • Output may have to be sorted and
a portion reworked • Fit and finish does not conform • Noticeable to some customers
Medium
• Minor disruption to process • Portion may have to be scrapped • Operable but without all
conveniences • Fit and finish does not conform • Concerned customer • DCMA Level II CAR
High
• Major disruption to process • 100% may have to be scrapped • Inoperable, loss of primary
function • Dissatisfied customer • DCMA Level III CAR
Severity
< Significance of Impact >
Instructions: 1. Use the description of Low,
Medium, High to assess issue’s Severity and Likelihood of Recurrence
2. Based on the issue’s Severity and Likelihood of Recurrence, map to the corresponding Level of RCA
3. Using the color of the RCA Level as a guide, assess the requirements for that RCA tool
Occ
urre
nce
< L
ikel
ihoo
d of
the
Even
t Rec
urrin
g >
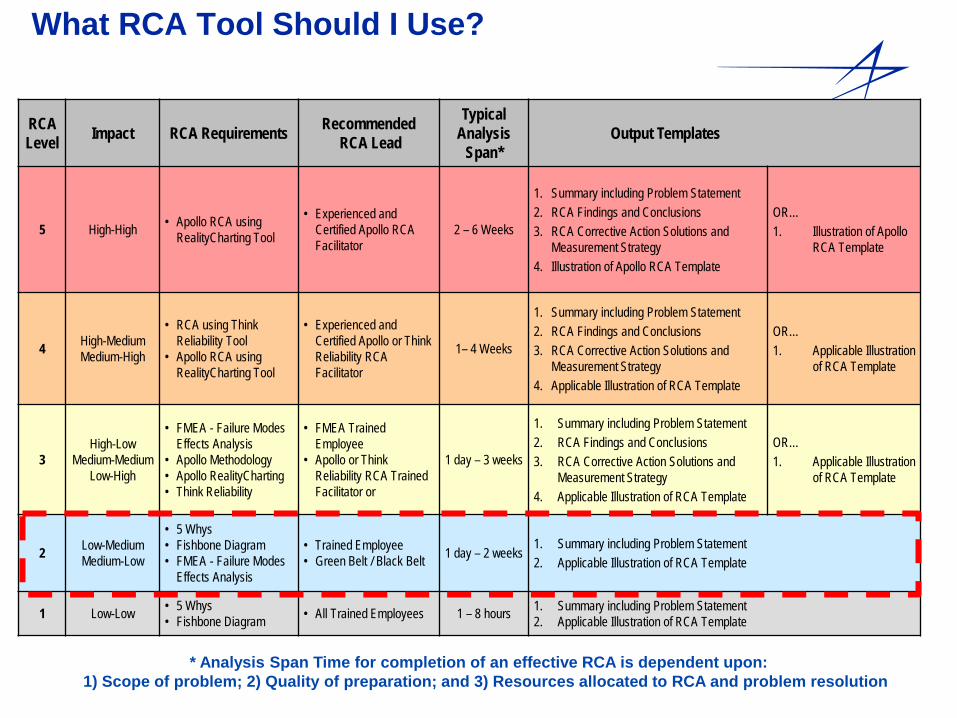
What RCA Tool Should I Use?
RCA Level Impact RCA Requirements Recommended
RCA Lead
Typical Analysis
Span* Output Templates
5 High-High • Apollo RCA using RealityCharting Tool
• Experienced and Certified Apollo RCA Facilitator
2 – 6 Weeks
1. Summary including Problem Statement 2. RCA Findings and Conclusions 3. RCA Corrective Action Solutions and
Measurement Strategy 4. Illustration of Apollo RCA Template
OR… 1. Illustration of Apollo
RCA Template
4 High-Medium Medium-High
• RCA using Think Reliability Tool
• Apollo RCA using RealityCharting Tool
• Experienced and Certified Apollo or Think Reliability RCA Facilitator
1– 4 Weeks
1. Summary including Problem Statement 2. RCA Findings and Conclusions 3. RCA Corrective Action Solutions and
Measurement Strategy 4. Applicable Illustration of RCA Template
OR… 1. Applicable Illustration
of RCA Template
3 High-Low
Medium-Medium Low-High
• FMEA - Failure Modes Effects Analysis
• Apollo Methodology • Apollo RealityCharting • Think Reliability
• FMEA Trained Employee
• Apollo or Think Reliability RCA Trained Facilitator or
1 day – 3 weeks
1. Summary including Problem Statement 2. RCA Findings and Conclusions 3. RCA Corrective Action Solutions and
Measurement Strategy 4. Applicable Illustration of RCA Template
OR… 1. Applicable Illustration
of RCA Template
2 Low-Medium Medium-Low
• 5 Whys • Fishbone Diagram • FMEA - Failure Modes
Effects Analysis
• Trained Employee • Green Belt / Black Belt 1 day – 2 weeks
1. Summary including Problem Statement 2. Applicable Illustration of RCA Template
1 Low-Low • 5 Whys • Fishbone Diagram • All Trained Employees 1 – 8 hours 1. Summary including Problem Statement
2. Applicable Illustration of RCA Template
* Analysis Span Time for completion of an effective RCA is dependent upon: 1) Scope of problem; 2) Quality of preparation; and 3) Resources allocated to RCA and problem resolution
15
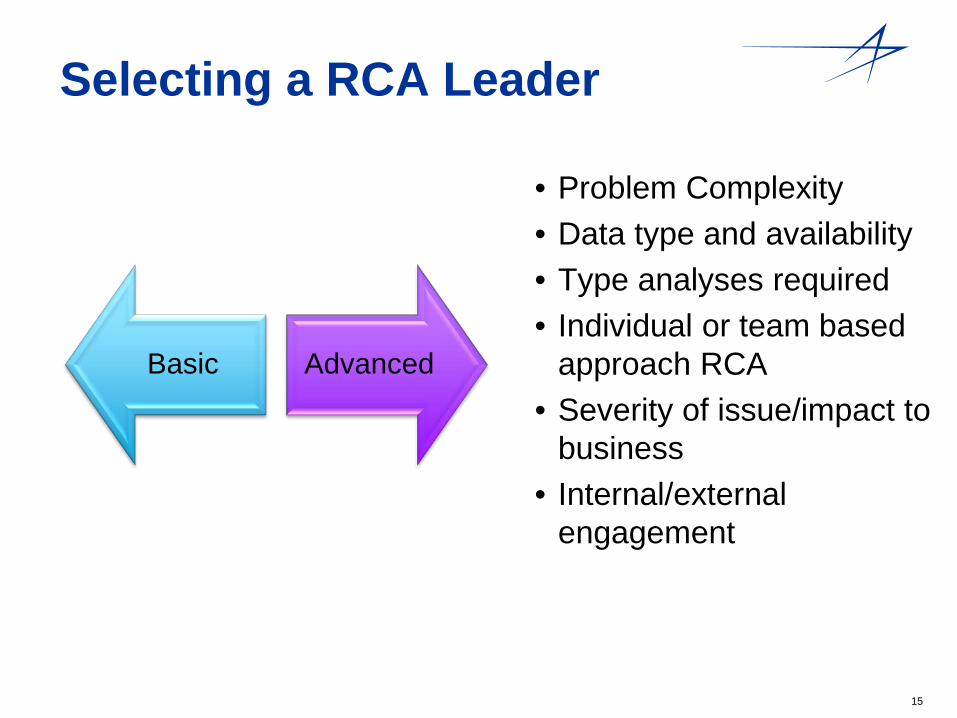
Selecting a RCA Leader
Basic Advanced
• Problem Complexity • Data type and availability • Type analyses required • Individual or team based
approach RCA • Severity of issue/impact to
business • Internal/external
engagement
16
Root Cause Analysis Tools The 5-Whys Cause & Effect (Fishbone/Ishikawa Diagrams) Cause Mapping Failure Modes & Effects Analysis Design of Experiments
17
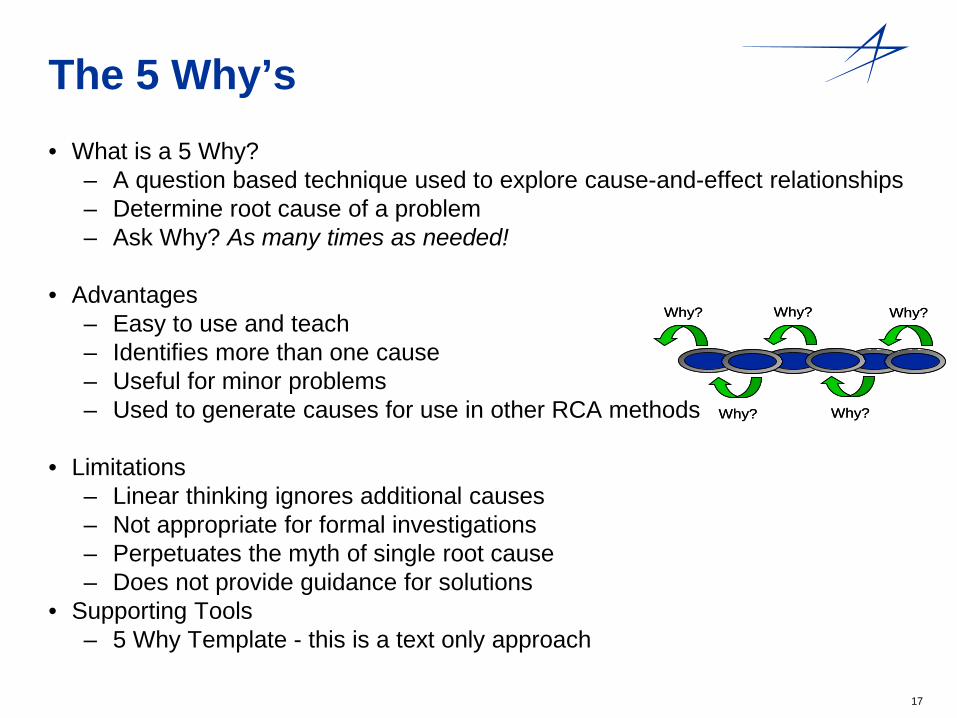
The 5 Why’s • What is a 5 Why?
– A question based technique used to explore cause-and-effect relationships – Determine root cause of a problem – Ask Why? As many times as needed!
• Advantages
– Easy to use and teach – Identifies more than one cause – Useful for minor problems – Used to generate causes for use in other RCA methods
• Limitations
– Linear thinking ignores additional causes – Not appropriate for formal investigations – Perpetuates the myth of single root cause – Does not provide guidance for solutions
• Supporting Tools – 5 Why Template - this is a text only approach
Why?Why? Why?
Why?Why?
Why?Why? Why?
Why?Why?
18
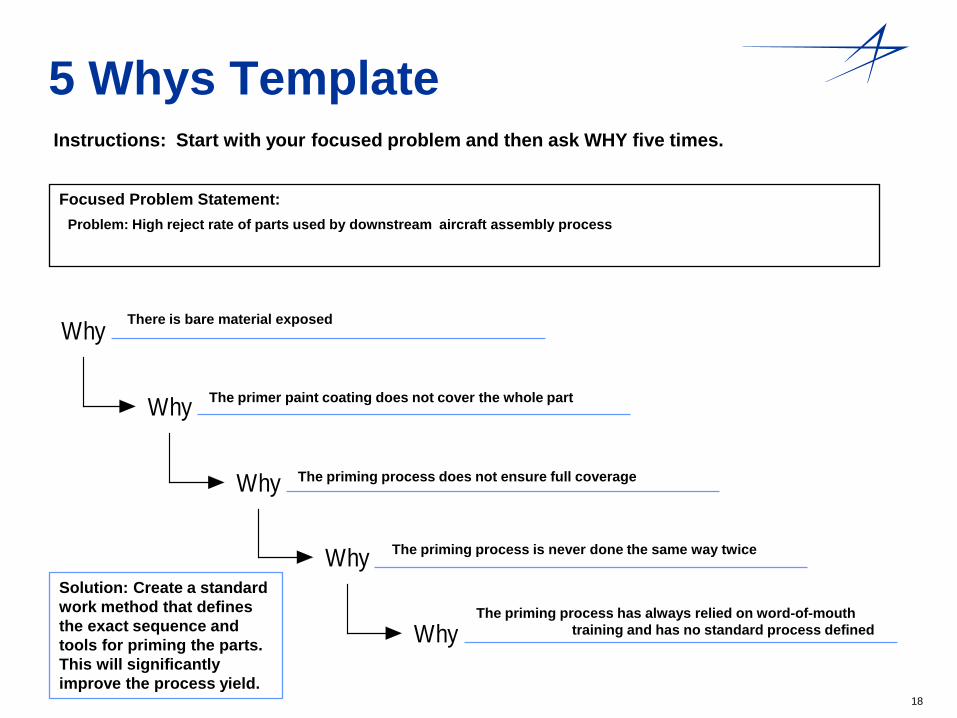
5 Whys Template Instructions: Start with your focused problem and then ask WHY five times.
Focused Problem Statement:
Why
Why
Why
Why
Why
There is bare material exposed
Problem: High reject rate of parts used by downstream aircraft assembly process
The primer paint coating does not cover the whole part
The priming process does not ensure full coverage
The priming process is never done the same way twice
The priming process has always relied on word-of-mouth training and has no standard process defined
Solution: Create a standard work method that defines the exact sequence and tools for priming the parts. This will significantly improve the process yield.
19
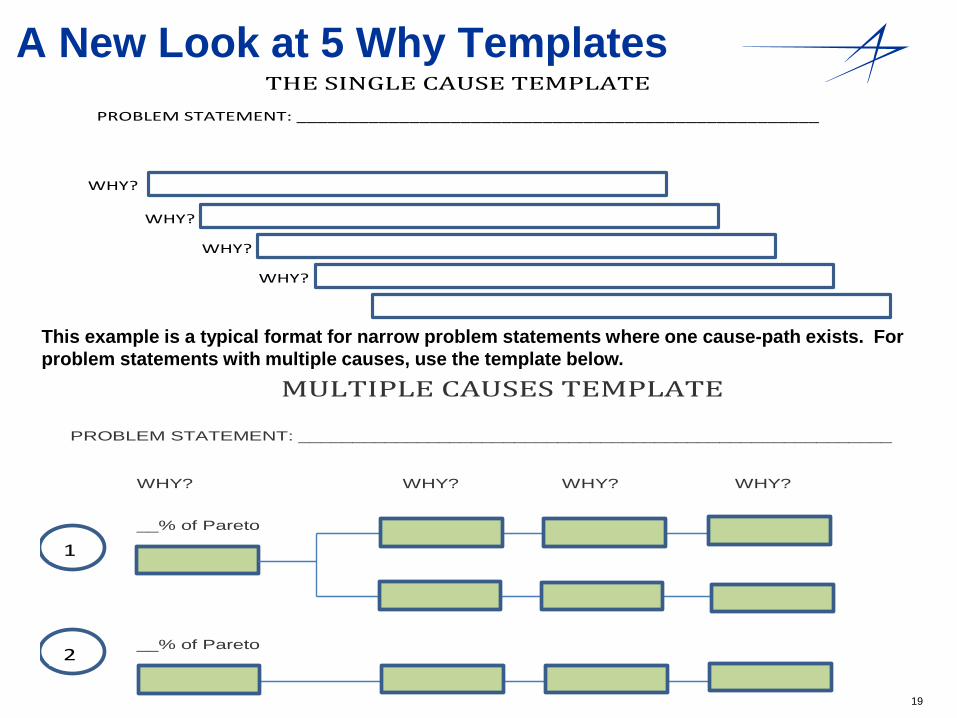
A New Look at 5 Why Templates
This example is a typical format for narrow problem statements where one cause-path exists. For problem statements with multiple causes, use the template below.
THE SINGLE CAUSE TEMPLATE PROBLEM STATEMENT: ___________________________________________________
WHY?
WHY?
WHY?
WHY?
MULTIPLE CAUSES TEMPLATE
PROBLEM STATEMENT: _______________________________________________________ WHY? WHY? WHY? WHY?
__% of Pareto
__% of Pareto
1
2
20
Proposed Operating Instruction for alternate 5 Why Template
21
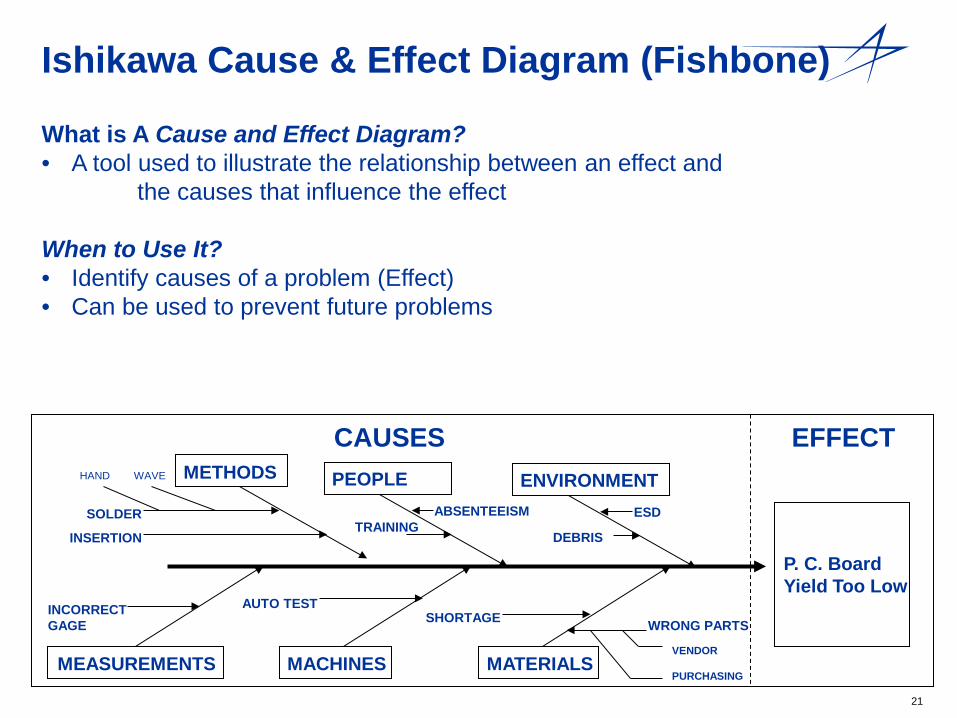
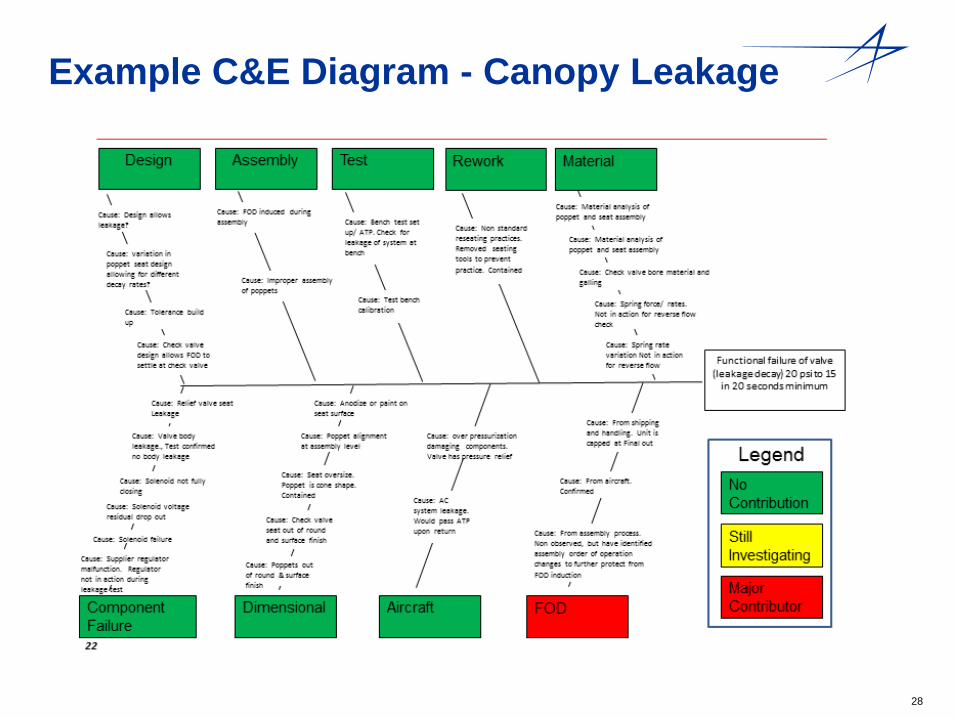
Ishikawa Cause & Effect Diagram (Fishbone)
– What is A Cause and Effect Diagram? • A tool used to illustrate the relationship between an effect and the causes that influence the effect When to Use It? • Identify causes of a problem (Effect) • Can be used to prevent future problems
CAUSES EFFECT
P. C. Board Yield Too Low
METHODS PEOPLE
MEASUREMENTS MACHINES MATERIALS
INSERTION
SOLDER TRAINING
ABSENTEEISM
INCORRECT GAGE
AUTO TEST SHORTAGE WRONG PARTS
HAND WAVE
VENDOR PURCHASING
ENVIRONMENT
DEBRIS
ESD
22
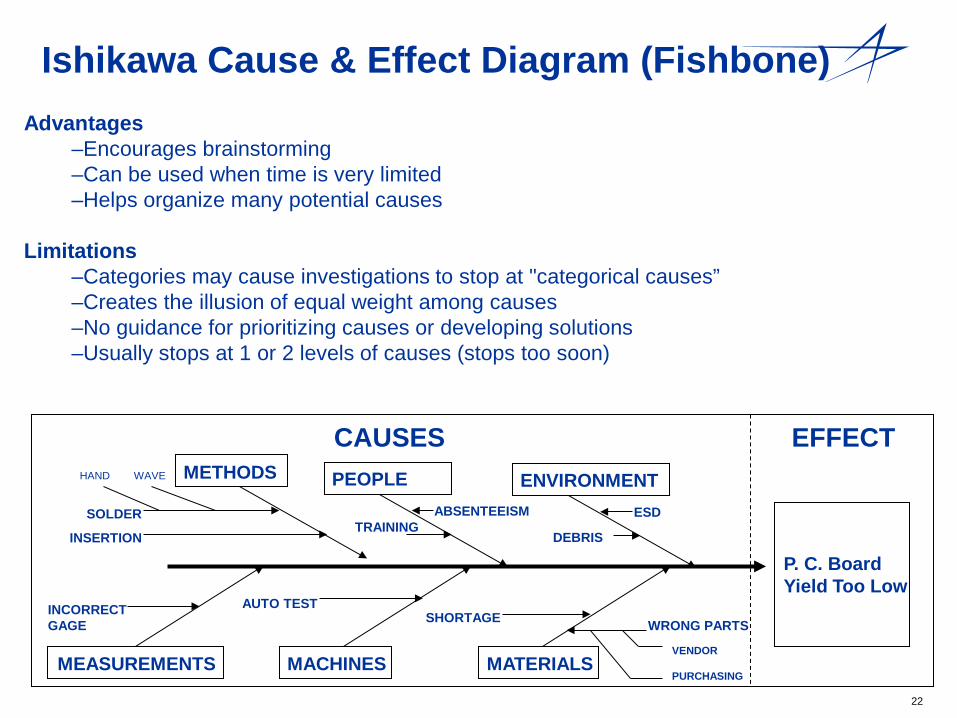
Ishikawa Cause & Effect Diagram (Fishbone) Advantages
–Encourages brainstorming –Can be used when time is very limited –Helps organize many potential causes
Limitations
–Categories may cause investigations to stop at "categorical causes” –Creates the illusion of equal weight among causes –No guidance for prioritizing causes or developing solutions –Usually stops at 1 or 2 levels of causes (stops too soon)
CAUSES EFFECT
P. C. Board Yield Too Low
METHODS PEOPLE
MEASUREMENTS MACHINES MATERIALS
INSERTION
SOLDER TRAINING
ABSENTEEISM
INCORRECT GAGE
AUTO TEST SHORTAGE WRONG PARTS
HAND WAVE
VENDOR PURCHASING
ENVIRONMENT
DEBRIS
ESD
23
Ishikawa Cause & Effect Diagram (Fishbone)
–
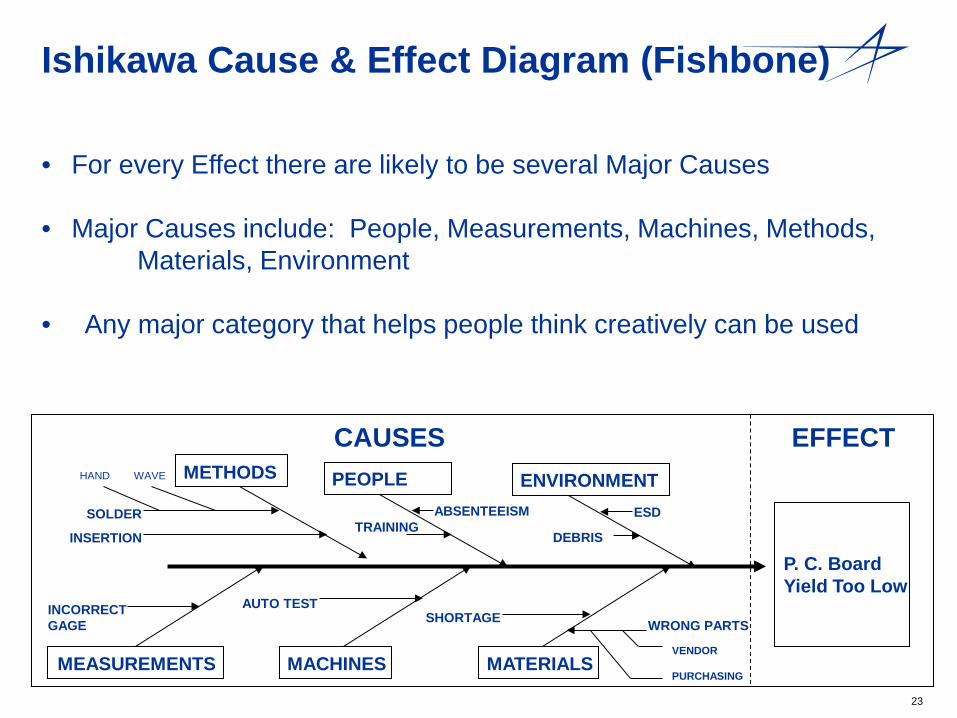
• For every Effect there are likely to be several Major Causes
• Major Causes include: People, Measurements, Machines, Methods, Materials, Environment
• Any major category that helps people think creatively can be used
CAUSES EFFECT
P. C. Board Yield Too Low
METHODS PEOPLE
MEASUREMENTS MACHINES MATERIALS
INSERTION
SOLDER TRAINING
ABSENTEEISM
INCORRECT GAGE
AUTO TEST SHORTAGE WRONG PARTS
HAND WAVE
VENDOR PURCHASING
ENVIRONMENT
DEBRIS
ESD

24
Ishikawa Cause & Effect Diagram (Fishbone)
Methods = work instructions, procedures, test methods Material = components and raw materials Measurements = standards, calibration, gages, data collection People = training and staffing Machines = tools, equipment, fixtures Environment = temperature, humidity, lighting, noise
Goal is to discover all possible Causes related to the Effect!
CAUSES EFFECT
P. C. Board Yield Too Low
METHODS PEOPLE
MEASUREMENTS MACHINES MATERIALS
INSERTION
SOLDER TRAINING
ABSENTEEISM
INCORRECT GAGE
AUTO TEST SHORTAGE WRONG PARTS
HAND WAVE
VENDOR PURCHASING
ENVIRONMENT
DEBRIS
ESD
25
Ishikawa Cause & Effect Diagram (Fishbone)
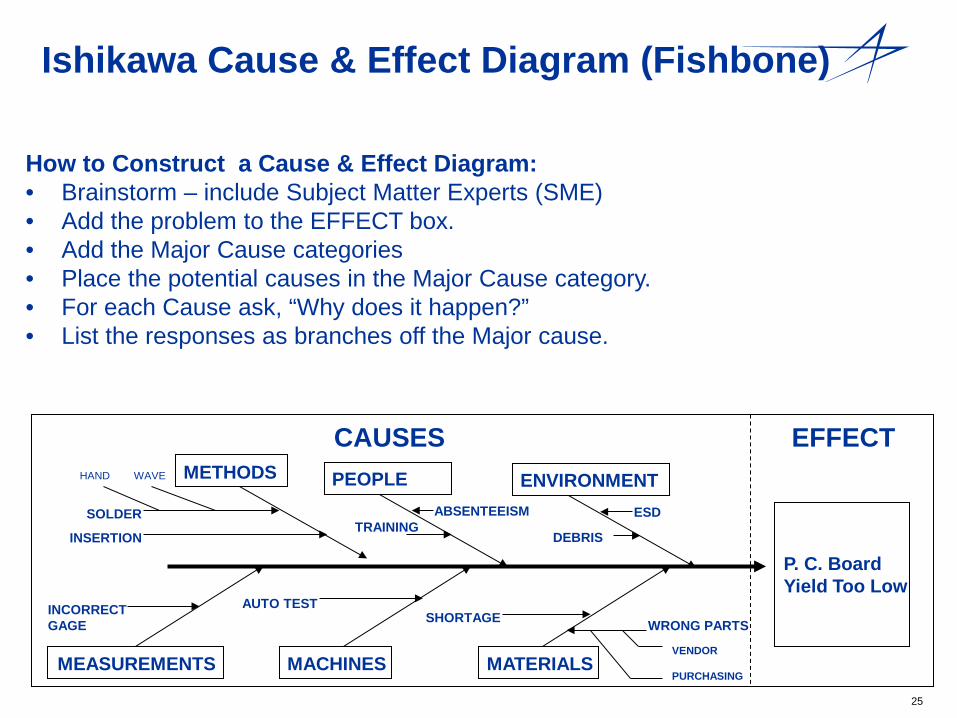
How to Construct a Cause & Effect Diagram: • Brainstorm – include Subject Matter Experts (SME) • Add the problem to the EFFECT box. • Add the Major Cause categories • Place the potential causes in the Major Cause category. • For each Cause ask, “Why does it happen?” • List the responses as branches off the Major cause.
–
CAUSES EFFECT
P. C. Board Yield Too Low
METHODS PEOPLE
MEASUREMENTS MACHINES MATERIALS
INSERTION
SOLDER TRAINING
ABSENTEEISM
INCORRECT GAGE
AUTO TEST SHORTAGE WRONG PARTS
HAND WAVE
VENDOR PURCHASING
ENVIRONMENT
DEBRIS
ESD
26
Ishikawa Cause & Effect Diagram (Fishbone)
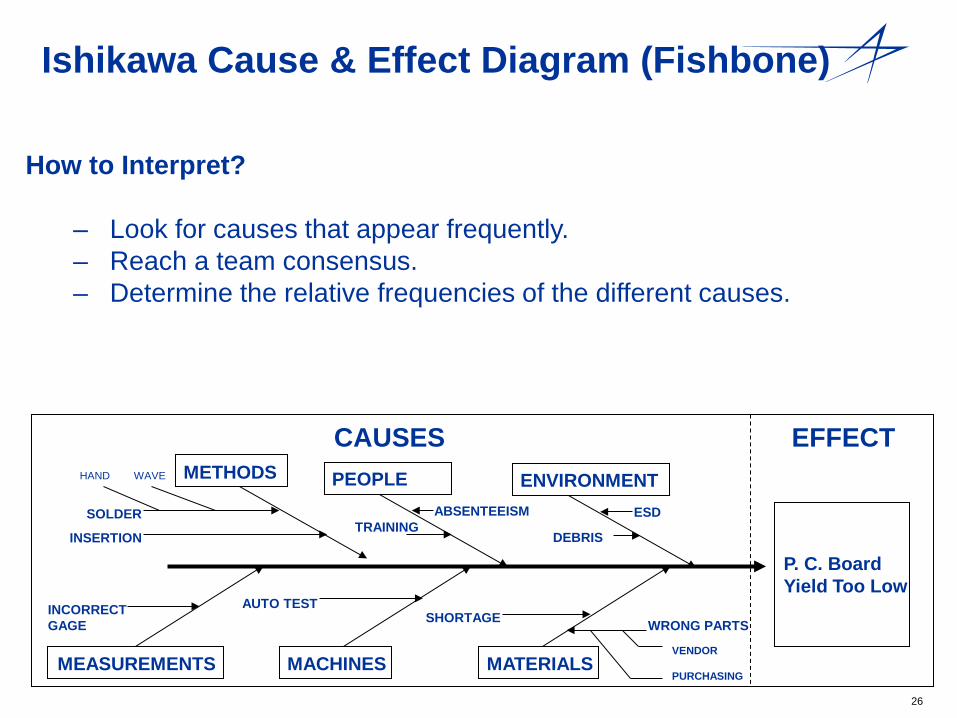
How to Interpret?
– Look for causes that appear frequently. – Reach a team consensus. – Determine the relative frequencies of the different causes.
CAUSES EFFECT
P. C. Board Yield Too Low
METHODS PEOPLE
MEASUREMENTS MACHINES MATERIALS
INSERTION
SOLDER TRAINING
ABSENTEEISM
INCORRECT GAGE
AUTO TEST SHORTAGE WRONG PARTS
HAND WAVE
VENDOR PURCHASING
ENVIRONMENT
DEBRIS
ESD
27
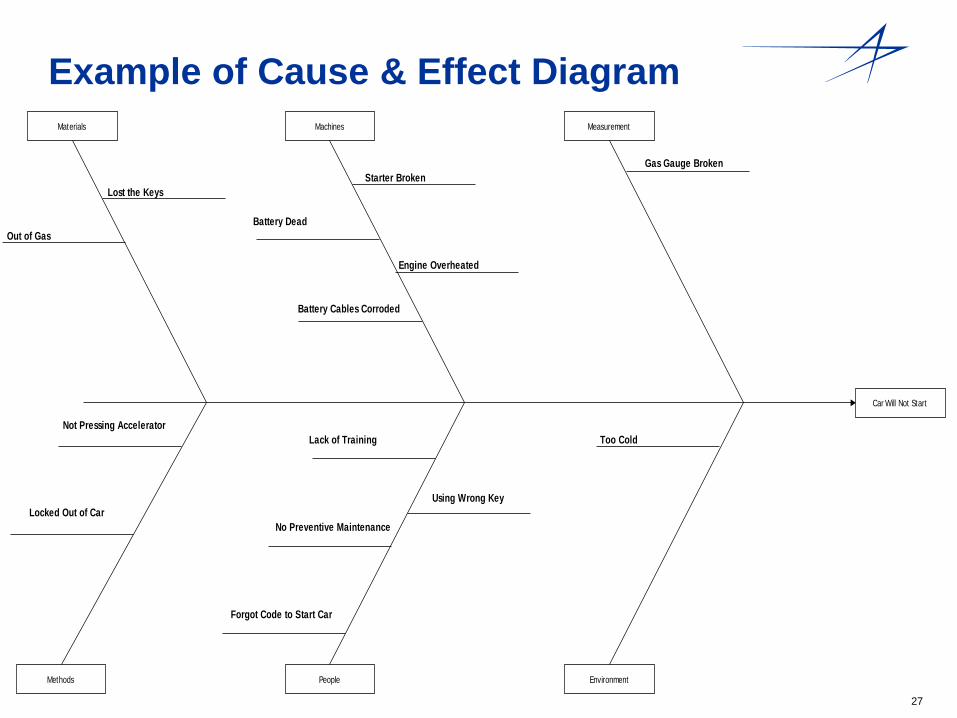
Example of Cause & Effect Diagram
Gas Gauge BrokenStarter Broken
Lost the Keys
Battery DeadOut of Gas
Engine Overheated
Battery Cables Corroded
Not Pressing AcceleratorLack of Training Too Cold
Using Wrong KeyLocked Out of Car
No Preventive Maintenance
Forgot Code to Start Car
Car Will Not Start
Materials Machines Measurement
Methods People Environment
28
Example C&E Diagram - Canopy Leakage

29
What is a Cause Map? A visual explanation of why an incident occurred
Connects single cause-and-effect relationships to a system
of causes A Cause Map can be basic or very detailed
30
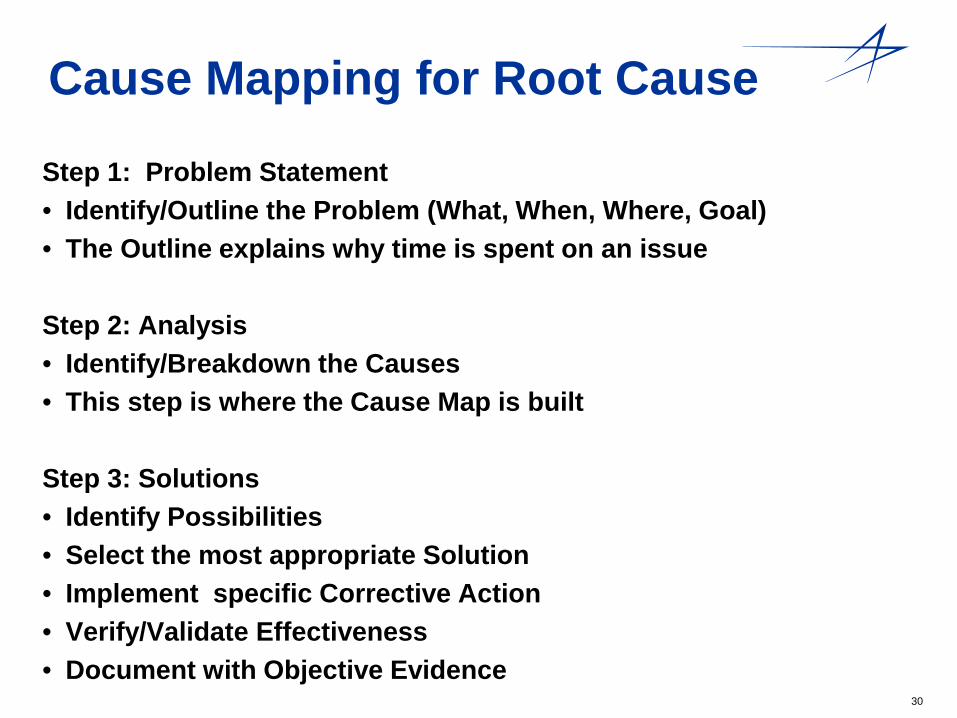
Cause Mapping for Root Cause Step 1: Problem Statement • Identify/Outline the Problem (What, When, Where, Goal) • The Outline explains why time is spent on an issue Step 2: Analysis • Identify/Breakdown the Causes • This step is where the Cause Map is built Step 3: Solutions • Identify Possibilities • Select the most appropriate Solution • Implement specific Corrective Action • Verify/Validate Effectiveness • Document with Objective Evidence

31
Cause Mapping - How to read a Cause Map
State the Problem Ask Why Questions - "Why did this effect happen?" Record Response = Cause (or causes)

32
Cause Map Example
Melissa Injured Right
shoulder
Standard procedure for picking up/delivering items to work area
Heavy load on cart
There is not current load
limit
Pushing cart
Standard load limit can not be defined
Cart was not rolling right
Safety Goals Impacted
Wheel was jammed
Twig/stick stuck in wheel
Carts are also used outside
Possible Solutions:
Possible Solutions:
Evidence:
Evidence:
Evidence:
Possible Solutions:

33
Cause Mapping • When to Use It:
– Use to develop an effective solutions to prevent recurrence of undesired effects – Use when you want to fully understand causes of success – Use to reveal the entire system of causes – Use it when you need to dive deeper into a problem
• Advantages:
– Reveals the entire system of causes and effects – Focuses on cause-effect relationships – Emphasizes effective solutions to prevent recurrence – Mitigates the hazards of using categories or checklists alone to drive analysis – Focuses attention on events and conditions rather than people
• Limitations:
– Does not prioritize causes or solutions – Has a learning curve for facilitators and team members – Lengthier process than other tools – Does not lend itself to proactive problem solving
34
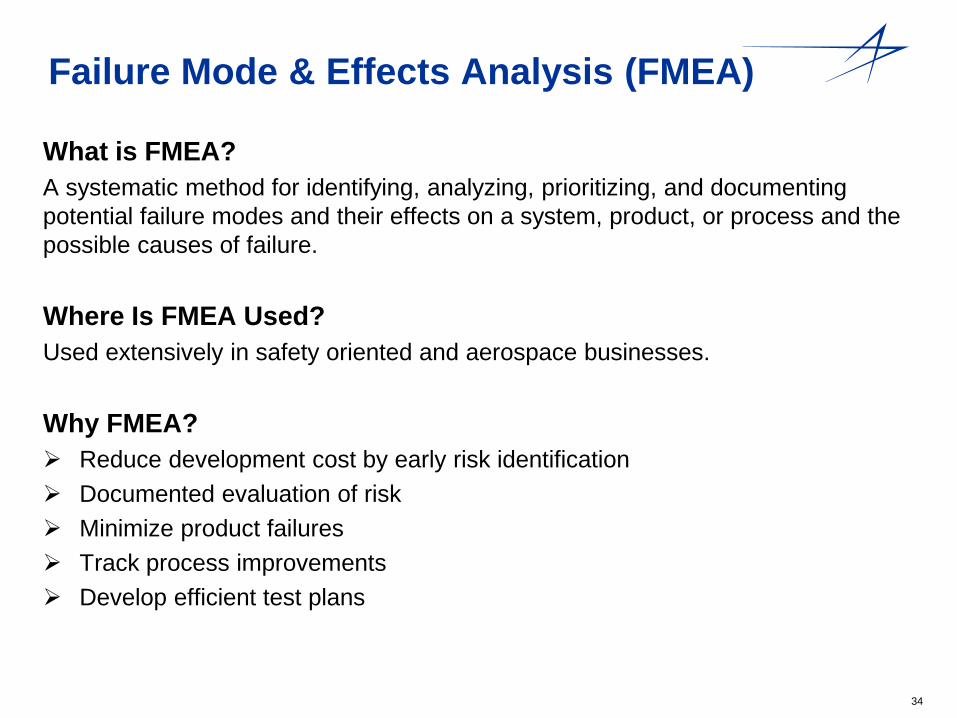
Failure Mode & Effects Analysis (FMEA)
What is FMEA? A systematic method for identifying, analyzing, prioritizing, and documenting potential failure modes and their effects on a system, product, or process and the possible causes of failure. Where Is FMEA Used? Used extensively in safety oriented and aerospace businesses.
Why FMEA? Reduce development cost by early risk identification Documented evaluation of risk Minimize product failures Track process improvements Develop efficient test plans
35
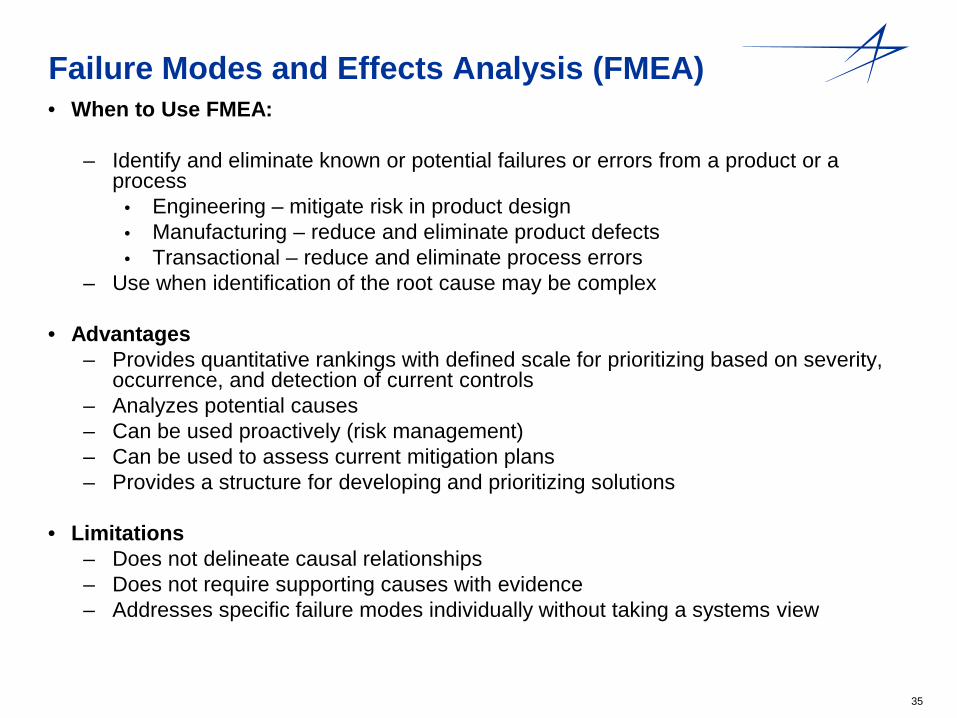
Failure Modes and Effects Analysis (FMEA) • When to Use FMEA:
– Identify and eliminate known or potential failures or errors from a product or a
process • Engineering – mitigate risk in product design • Manufacturing – reduce and eliminate product defects • Transactional – reduce and eliminate process errors
– Use when identification of the root cause may be complex
• Advantages – Provides quantitative rankings with defined scale for prioritizing based on severity,
occurrence, and detection of current controls – Analyzes potential causes – Can be used proactively (risk management) – Can be used to assess current mitigation plans – Provides a structure for developing and prioritizing solutions
• Limitations
– Does not delineate causal relationships – Does not require supporting causes with evidence – Addresses specific failure modes individually without taking a systems view
36
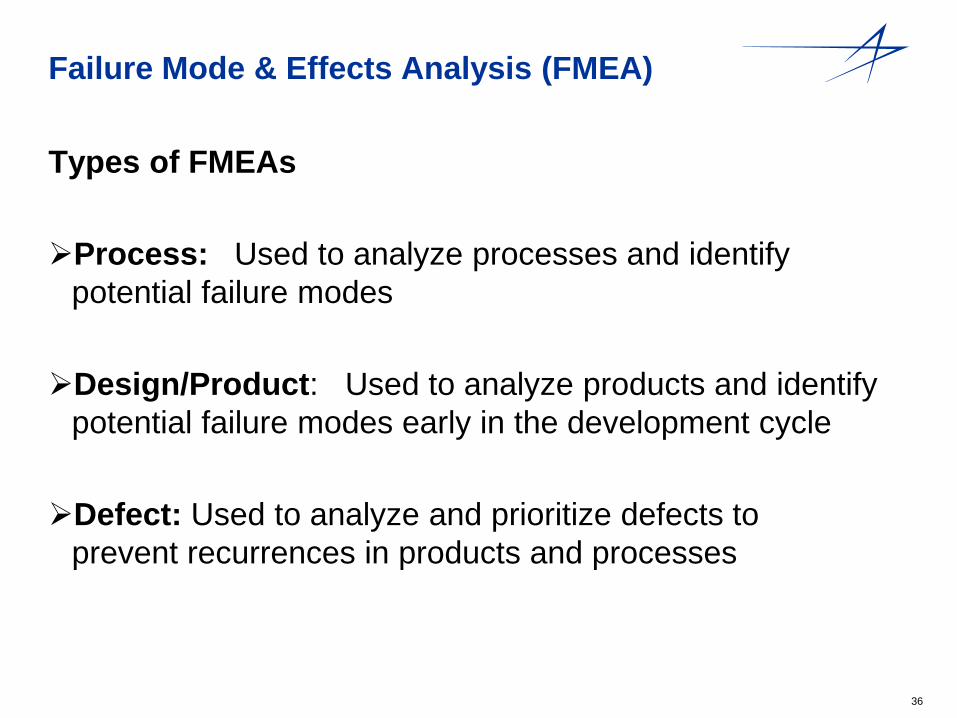
Failure Mode & Effects Analysis (FMEA) Types of FMEAs Process: Used to analyze processes and identify
potential failure modes Design/Product: Used to analyze products and identify
potential failure modes early in the development cycle Defect: Used to analyze and prioritize defects to
prevent recurrences in products and processes
37
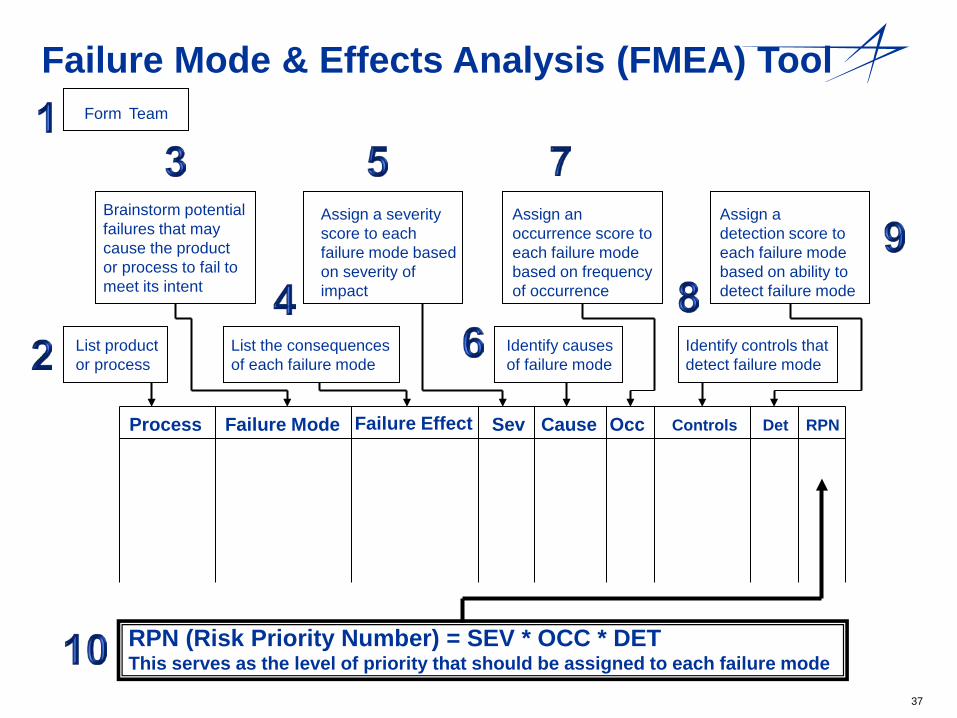
Failure Mode & Effects Analysis (FMEA) Tool
RPN (Risk Priority Number) = SEV * OCC * DET This serves as the level of priority that should be assigned to each failure mode
Process Failure Mode Failure Effect Sev Cause Occ Controls Det RPN
Assign a severity score to each failure mode based on severity of impact
Assign an occurrence score to each failure mode based on frequency of occurrence
Assign a detection score to each failure mode based on ability to detect failure mode
List the consequences of each failure mode
Identify causes of failure mode
Identify controls that detect failure mode
Brainstorm potential failures that may cause the product or process to fail to meet its intent
List product or process
Form Team
38
Design of Experiments (DOE)
Why Use DOE? Can be used to help improve the capability of a process by identifying the process and product variables that effect the mean and the variance of the quality characteristics of a product. Can be used as a powerful tool to achieve manufacturing cost savings by minimizing process variation, reducing rework and reducing scrap
Use DOE when more than one input factor is suspected of influencing an output.
39
Design of Experiments (DOE)
When Can I Use DOE? When you want to find the input settings that optimize the output of a process When you want a mathematical model relating the outputs and / or variance of a process to the inputs When you want to identify the most important input factors that influence the mean output or the variance of the output When you want to determine the cause of a product failure
40
Design of Experiments (DOE)
Where Can I Use DOE? Any process with measurable quantitative or qualitative inputs and quantitative outputs is a potential application for DOE In engineering design, to find component values and tolerances that optimize the response In production, to optimize the yield of a machine or assembly process In testing, to ensure the fullest coverage of possible inputs with a minimum number of tests
DOE Applications Are Limited Only By The Imagination
41
Summary • Root Cause Analysis is not easy! • Be diligent in the pursuit of Root Cause • Address the Cause not the Symptom • The RCA Tools presented today will help ensure: Thorough Investigations Identification of Root Cause Effective Corrective Actions
Root Cause + Effective Corrective Action = Problem Elimination!
42
Summary Root Cause Analysis is the process of applying the cause and
effect principle to solve problems. A root cause analysis program should be a systems approach to finding effective solutions to prevent problems from occurring or recurring.
RCA Tools provide a means to conduct systematic analysis of a problem to identify cause and effect relationships and identify appropriate solutions to eliminate nonconformances
Corrective Action: Action(s) taken to eliminate the cause of nonconformances in order to prevent recurrence
Root Cause Analysis helps ensure: • Continuous improvement • Efficient use of resources • Focus on actions that are most impactful Root Cause + Effective Corrective Action = Problem Elimination!

43
Root Cause Analysis References • IAQG – Root Cause Analysis and Problem Solving
(aligned with IAQG 9136 draft) www.iaqg.org/scmh
• The Memory Jogger 2 – Tools for Continuous Improvement and Effective Planning
• The Lean Six Sigma Pocket Tool Book
• Think Reliability www.thinkreliability.com