The following is intended to outline our general purposes ...
53
Transcript of The following is intended to outline our general purposes ...

The following is intended to outline our general product direction. It is intended for information purposes only, and may not be incorporated into any contract. It is not a commitment to deliver anycontract. It is not a commitment to deliver any material, code, or functionality, and should not be relied upon in making purchasing decisions.The development release and timing of anyThe development, release, and timing of any features or functionality described for Oracle’s products remains at the sole discretion of Oracle.

<Insert Picture Here>
Session #S317067Oracle WebLogic Management for DBAsGlen Hawkins Director of Product ManagementGlen Hawkins, Director of Product ManagementMadhav Sathe, Senior Product Manager

Agenda
<Insert Picture Here>
• Oracle Enterprise Manager Overview• Application Performance Challenges• Database Access Scenarios• Performance Issues and Diagnostics
B t P ti• Best Practices• Key Takeaways• Q&A• Q&A

<Insert Picture Here>
Oracle Enterprise Manager OverviewManager Overview

Business-Driven IT Management
6© 2010 Oracle Corporation 6

Integration with My Oracle SupportOracle Support
Problem/SRManagement
ConfigurationManagement
KnowledgeManagement
KnowledgeManagement
Problem/SRManagement
ConfigurationManagement
Performance Management
Provisioning & Patching
Problem Diagnosis
CCustomer
© 2010 Oracle
DatabasesHardware Middleware Applications

<Insert Picture Here>
Application Performance ChallengesChallenges

Application Performance Challenges
• Slow and slower response time
• HTTP errors, content errors• System locks up
• Slower under heavy load
• Sporadic hangs and aberrant
System locks up• Sudden chaos / Unexpected
Errors
errors
Web customer
Web storecustomer
Internal user
Billing
Batch job Financial System
DatabaseMiddlewareUsers MiddlewareUsers

Who will own the issue?
Your application is
broken!
It is a DB issue
What happened
DBAMW Admin/Developer
User
What happened to my order transaction?
User

Lack of VisibilityTypical Multi-Tiered Java EE System Leaves the yp yAdministrators Blind
Service Levels Measured Here
Real issue is here
Business Transactions Application Artifacts
ApacheOHS
Measured Here…
ppMetadata
Caching TieriPlanet
…Blame assigned Here
WLS, Java & Data Grid DatabaseWeb Server

Why Do Conflicts Arise?Two Silos – Two Disconnected Islands
• Application Performance Monitoring Tools
• Database Monitoring • Database health andg
• Application and Middleware health and performance monitoring
Database health and performance issues
• Visibility into SQL performanceo to g
• Identify flow of business transactions
pe o a ce
• Little or zero visibility into how application SLAs are measuredChallenges for DBAs
• Little or zero visibility into how application SLAs are measured
• Database shared across multiple applications and DBAs lack ability to associate performance issues with business transactions
N th d t b i d• Numerous ways the database is accessed
<Insert Picture Here>
Database Access ScenariosScenarios

JDBC – The Primary Java EE Database Connectivity MechanismDatabase Connectivity Mechanism
• Java Database Connectivity (JDBC) is an industry standard for connecting Java
Java Applicationindustry standard for connecting Java applications to databases.
• Java code needs JDBC driver to be able to access the database
Statement ResultSet
• Driver manages connection with the database which used by Java
• PreparedStatement, CallableStatement JDBC
• Used to make SQL, PLSQL calls over JDBC connection respectively
• E.g. pstmt = connection prepareStatement("update
rows SQL
connection.prepareStatement( update Orders set pname = ? where Prod_Id = ?"); pstmt.setString(1, “Tom”);
• ResultSet – used to return the result of the SQL llSQL calls

Most Popular Oracle JDBC Drivers
• JDBC OCI client-side driver (a.k.a. “Thick” or “Native” driver)driver)• Type 2 driver; Uses Java native methods to call entry points
in an underlying C library (OCI); so platform specific.• Requires an Oracle client installation of the same version asRequires an Oracle client installation of the same version as
the driver. • JDBC Thin client-side driver
• Type 4 driver; Pure java to connect directly to Oracle so• Type 4 driver; Pure java to connect directly to Oracle, so Platform independent; Does not require Oracle client software to be installed; Require the server to be configured with a TCP/IP listener
• Most favored in Java applications

Additional Oracle JDBC Drivers
• JDBC Thin server-side driver• Type 4 driver; Pure java to connect directly to Oracle• Type 4 driver; Pure java to connect directly to Oracle• Runs inside Oracle database and used to access remote
Oracle database• JDBC Server Side Internal driver• JDBC Server-Side Internal driver
• Type 2 driver; Uses Java native methods to call entry points in an underlying C library which is part of Oracle server process and communicates directly with the internal SQLprocess and communicates directly with the internal SQL engine
• Fastest way for Java code within Oracle to access the same database

JDBC Datasource In WebLogic
Datasource encapsulate connection details in
connection pool
‘Lookup’ Datasource in
application using JNDI name
Type 4 JDBC driver (Client id thi d i )Multi Datasources for load side thin driver)u t atasou ces o oad
balancing & failover
Connection Pool - helps to increase the performance by keep active connections to the database in the pool
Applications ‘borrow’ connection from the pool, use it and return it

Key Application Data Source Concepts for DBAsConcepts for DBAs• Multi data sources
• Load balancingLoad balancing• Failover
• Pool size• Inadequate pools size adversely impacts performance• Inadequate pools size adversely impacts performance • Too many connections in pool will waste resources on
database and middleware• Statement cache• Statement cache
• PreparedStatement and CallableStatement are costly on database and even on communication between database and WebLogicand WebLogic
• Cache executable statements that are used repeatedly, such as in a loop or in a method that is called repeatedly

Key Application Data Source Concepts for DBAsConcepts for DBAs
• Connection leaks• Connection that does not return to the pool after useConnection that does not return to the pool after use• Waste valuable resources
• Transactions• UserTransactions: programmer defines transaction boundaries• UserTransactions: programmer defines transaction boundaries• Container Managed Transactions: container defines
transaction boundaries• For distributed transactions use XADataSource• For distributed transactions use XADataSource• Problems: Dirty Read, Non Repeatable Read, Phantom Read • Isolation Levels: READ_UNCOMMITTED,
READ COMMITTED REPEATABLE READ SERIALIZABLEREAD_COMMITTED, REPEATABLE_READ, SERIALIZABLE

Object-Relational (O/R) Frameworks( ) O• Java Persistency API (JPA) layer provides OR mapping
• Application code does not use SQLs directly; instead perform operations on the Objects and JPA layer auto-generates SQLs
• E.g. ADF-BC, Toplink, Hibernate, iBate
JEE & JEE & Web Web
Objects Objectsobject-level
querying and creationobject creation and updates through
Web Web ServicesServices
SQL
Persistence Layerresults are objects
results are API uses SQL
object-level API
JDBCSQLrowsreturned as
raw data
API uses SQLor databasespecific calls

Using Database Adapters in SOA and Composite ApplicationsComposite Applications
• SOA allows loose coupling of disparate components based on standards
• Database adapters are used to integrate database access logic into the SOA processes
• For example, you may want to integrate a PL/SQL block in your BPEL process or a SOA Composite Application

Coherence (Distributed In-Memory Caching) & Its ImpactCaching) & Its Impact
• In-memory data grid layer between database and application• Works on principle – 80% of the requests use 20% of the datap p q• Cached data is typically partitioned across multiple nodes running
on different machines• Coherence nodes are Java processes providing storage for cacheCoherence nodes are Java processes providing storage for cache
• Each node holds a partition of a cache with a backup partition on another node to guarantee reliability
• Ideally should reduce database access for most requests• Ideally should reduce database access for most requests• Cache persistence policies: Refresh-Ahead, Read-Through, Write-
Behind, Write-Through
JPA
Coherence Data
WebLogic Application
WebLogic ApplicationCoherence Data
Grid Layer DB

BPEL Dehydration Store• Dehydration is process by which BPEL engine stores
process metadata and (sometimes) state of process i h d binstance to the database
• When does BPEL dehydrate process instance?When does BPEL dehydrate process instance?• At the end• In flight, at breakpoint activities (if any)
If id t t ti it i t t f l• If idempotent activity is set to false
Transient process Durable process
No breakpoint activities Contains breakpoint activities
Save state only once Save state more than once
Nothing to recover Can recover from the last dehydrated stateNothing to recover Can recover from the last dehydrated state

Oracle Advanced Queuing
JMS 1.1 compliant Message Provider
AQ DatabaseStores messages to QUEUE Tables
• JMS: Java Messaging Service is messaging standard used by disparate systems to exchange messages
• Queues are used as ‘message buckets’• Queues are used as message buckets• Point to Point: Senders and receivers decide on a common queue in
which to exchange messages. Each message is consumed by only one receiver.
• Publish-Subscribe: messages can be consumed by multiple receiversg y p

<Insert Picture Here>
Performance Issues and DiagnosticsDiagnostics
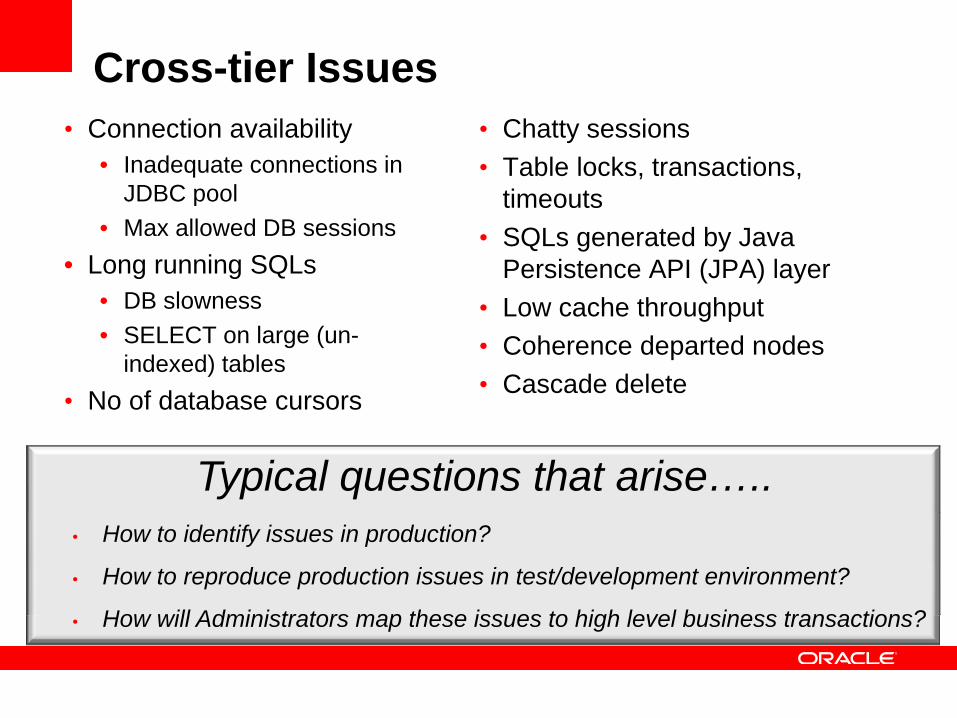
Cross-tier Issues• Connection availability
• Inadequate connections in JDBC pool
• Chatty sessions• Table locks, transactions,
timeoutsp• Max allowed DB sessions
• Long running SQLs• DB slowness
timeouts• SQLs generated by Java
Persistence API (JPA) layer• Low cache throughputDB slowness
• SELECT on large (un-indexed) tables
• No of database cursors
• Low cache throughput• Coherence departed nodes• Cascade delete
Typical questions that arise…..• How to identify issues in production?
• How to reproduce production issues in test/development environment?
How will Administrators map these issues to high level business transactions?• How will Administrators map these issues to high level business transactions?

Datasources, Connection Pools and Transactions
• JDBC Open connections, connection requests, in
l i tuse, pool size, etc• Cached statements
used, transactions committed rollbacks
Compare Open Connections to Used Connections
committed, rollbacks, etc
• Proactive monitoring using Alerts and Notifications
Committed vs Rolled backtransactions

Manage Configuration Assets• JDBC Resource configuration
• Connection Pool – Connection URL Driver classname Max
• Automated, daily collection of configuration data, installations and patchesURL, Driver classname, Max,
Min, Inactivity timeout, Statement cache size, etc.
• Datasources – JNDI name,
and patches• Search across enterprise for
specific information• Make configuration changesDatasources JNDI name,
pool name, prefetch size, etc• Multi datasource – JNDI,
datasource list, algorithm
g g• Compare configuration
•Save configuration to repository as ‘Gold Image’, g•Compare with other WebLogic servers in environment

JVM Diagnostics With Database Visibility• Trace Java thread to database session
• Identify in-flight Java threads waiting for database resource
Visibility
• Drill to SQL
• Trace database session to Java thread• View database sessions waiting for or holding locks• View database sessions waiting for or holding locks• Identify Java thread holding DB session

Quickly Identify Cross-Tier Issues Bridge the gap between Database and MiddlewareBridge the gap between Database and Middleware
MW Admin: Look, my order request is stuck because of this SQL
DBA: Looks like your SQL is waiting for table lock taken by another SQL
MW Admin: Ok, lets kill the other session so that this key user transaction can go
ahead
DB State Causing Application Issues
ahead
Are majority of the threads waiting for DB?

In-Context Architecture & SQL PerformancePerformance
Find SQL performance based on caller
• Detailed method and • Architecture display givesDetailed method and SQL metrics for robust monitoring and t bl h ti
Architecture display gives context to metrics for easy navigation and
h itroubleshooting comprehension

Monitoring & Managing Coherence CCaches
• Identify caches using backend too frequently
• Check cache persistence policy• Find cache health
Find top caches in the
cluster
– Find cache balance on multiple nodes
– Compare performance of multiple nodes side by side
– Correlate metrics for diagnostics• Check cache eviction policy, expiry
Find workload distribution on
nodes
policy, etc• Ensure cluster stability by auto-
starting perished nodes

<Insert Picture Here>
Best Practices
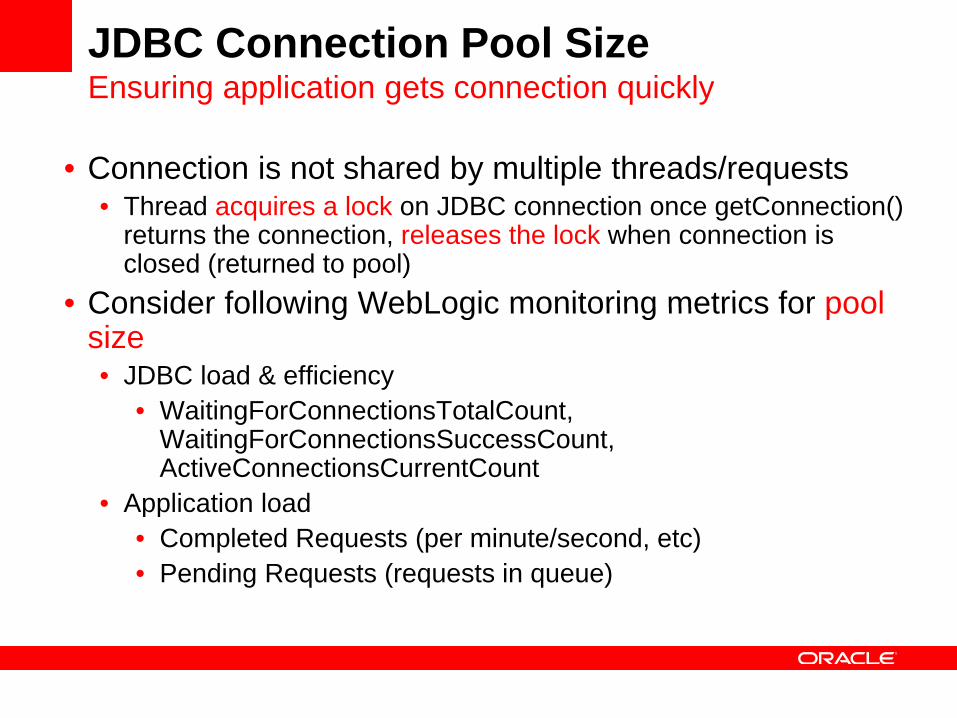
JDBC Connection Pool Size Ensuring application gets connection quicklyg pp g q y
• Connection is not shared by multiple threads/requests• Thread acquires a lock on JDBC connection once getConnection()• Thread acquires a lock on JDBC connection once getConnection()
returns the connection, releases the lock when connection is closed (returned to pool)
• Consider following WebLogic monitoring metrics for poolConsider following WebLogic monitoring metrics for pool size• JDBC load & efficiency
• WaitingForConnectionsTotalCount• WaitingForConnectionsTotalCount, WaitingForConnectionsSuccessCount, ActiveConnectionsCurrentCount
• Application loadpp• Completed Requests (per minute/second, etc)• Pending Requests (requests in queue)

JDBC Connection Pool Size Ensuring application gets connection quicklyg pp g q y
• Set pool Initial Size to Max Size• Datasource maintains these many connections in the pool IF this• Datasource maintains these many connections in the pool. IF this
is not set response time may be impacted as for some requests getConnection() will lead to actually creating a new connection on database
• Do not set the pool size too high• DBA controls ‘Max Allowed DB Sessions’ on database• Maintaining an ‘open connection’ is resource intensiveMaintaining an open connection is resource intensive
• Configure datasource to make connection requests wait if pool is exhausted
JDBC Statement CachingImprove statement execution by cachingImprove statement execution by caching
• Use statement cache to reduce CPU load on database and network roundtripsdatabase and network roundtrips• Can prevent the overhead of repeated cursor creation • Can prevent repeated statement parsing and creation• Cache is maintained at connection level but size is configured
at datasource level• Default ‘LRU’ caching algorithm is best for most
it tisituations• Increasing cache size will dramatically increase
application performancepp p

JDBC Statement CachingImprove statement execution by cachingImprove statement execution by caching
• Notes for DBAs (Database specific behavior)• Each cached statement may consume a ‘cursor’ on database• Each cached statement may consume a cursor on database
so if too many statements are cached in WebLogic cluster it may exceed maximum open cursors limit on database & will lead to error
• Any structural change to table which cached statement references may lead to statement execution failure

Transaction Performance Tips
• Define transaction boundaries in code, setAutoCommit(false)
• Do not use 'Serializable' isolation level unless there is a clear need in the application for Zero Concurrency
• Never have a database transaction span user input• Never have a database transaction span user input• SQLs may lock rows/tables for updates • Use ‘optimistic locking’ if user input is required in between a
transactiontransaction

Transaction Performance Tips
• Make Transactions Single-batchBEGIN TRANSACTION
UPDATE TABLE1... INSERT INTO TABLE2 DELETE TABLE3
COMMIT
• Preferable because the database obtains all the locks necessary on the various rows/tables andlocks necessary on the various rows/tables, and uses & releases them in one step
• Using separate statements and commits results in many more client to database transmissions andmany more client-to-database transmissions and holds the locks in the database for much longer
Important Design Time ConsiderationsEnsuring developers and DBAs are synchronizedEnsuring developers and DBAs are synchronized
• Process as much data as possible inside database• Put data processing logic where data is• Put data processing logic where data is• Avoid needless data transfer from database to application
• JDBC Batch updates• Group queries in a ‘batch’ to reduce no of database calls
and improve performance• Optimize queries
• Reduce the no of rows returned as far as possible • Control connection leaks
• Close connection in ‘finally’ blocky• InactiveConnectionTimeout on datasource to forcibly return
a connection to the datasource if there is no activity
Important Design Time ConsiderationsEnsuring developers and DBAs are synchronizedEnsuring developers and DBAs are synchronized
• Keep operational dataset small• Move non current data to other tables and do joins to these• Move non-current data to other tables and do joins to these
tables for the rarer historical queries • Index and cluster your table so that the most frequently used
data is logically and physically localizeddata is logically and physically localized• Row Prefetch
• JDBC fetches that number of rows at a time from the database during the query to get better performanceduring the query to get better performance
• The extra data is stored in client-side buffers for later access by the client
• Value ’10’ is optimum for most situationsa ue 0 s opt u o ost s tuat o s

Tuning Tips for JPA O/R FrameworksADF-BC, CMP, Toplink, Hibernate, etc, , p , ,• Make sure that SQL
generated by your finder / l t th d
• Enforce primary key constraint at database l l/select method uses
indexes • Avoid findAll() methods
level• Avoid extra SQL for
constraint checking by Avoid findAll() methods on large tables
• Use read-only beans
container/JPA provider
• Exploit DELETE CASCADE at databasewhen appropriate
• Reduce number of activations and
CASCADE at database level • Container generates
multiple SQL statements“passivations” multiple SQL statements
Use Coherence as In-Memory Data Grid to drastically reduce load
I li ti f l bilit & li bilitImprove application performance, scalability & reliability

Monitor and Configure Coherence For High PerformanceFor High Performance• Plan coherence cache capacity to minimize database
accessaccess• Ensure coherence cluster stability
• Nodes may crash or leave cluster because of various reasons directly impacting available cache size throughputdirectly impacting available cache size, throughput
• Monitor performance trends for cache hit ratio, database access, work load distribution on nodes, etc

Monitor and Configure Coherence For High PerformanceFor High Performance• Key configuration parameters that affect database
accessaccess• Persistence Policy – Refresh-Ahead, Read-Through, Write-
Behind, Write-Through • Eviction Policy – LRU LFU Hybrid (evicting those that areEviction Policy LRU, LFU, Hybrid (evicting those that are
accessed least frequently and were not accessed for the longest period first )
• High Units – Maximum number of units that can be placed in g pthe cache before pruning occurs
• Low Units – Number of units that the cache will be pruned down to when pruning takes place
• Expiry Delay – Amount of time from last update that entries will be kept by the cache before being marked as expired
• Flush Delay – Time interval between periodic cache flushes, hi h ill di d i d t i f th hwhich will discard expired entries from the cache

Key Takeaways• Never leave any middleware or database tier
unmanaged• Application issues can be found anywhere and often leads to
fire fighting everywhere if unprepared• Use a single console to monitor the entire stack• Use top-down application monitoring tool that
provides end-to-end visibility across the stack vertically and horizontallyy y

Key Takeaways• Diagnose the issues in the production environment
• Extremely difficult, impossible in most cases, to reproduce the i i t i QA d l tissue in staging, QA, or development
• Protect your top and bottom line by catching and diagnosingissues in production
Fi t fi ti t ll ti f ti i d• Fine tune configuration at all tiers for optimized performance

<Insert Picture Here>
Product Roadmap

Roadmap for WebLogic Server ManagementManagement
PatchesPlatform Support
WebLogic Server Virtual
Future ReleasesEM / E2E Integration
BTM Integration
Next ReleaseAgent/Manager update
Consolidate agent deploymentEdition
Additional 64-bit IBM JREsExalogic Management
JVM Diagnostics
Consolidated end-to-end agent (ADP/JVM/BTM)
Consolidated automated installation
RUEI data integration for dimensional analysis of
Bi-directional impact analysis with Database diagnostics
Full Configuration Management (ACC/CCC) IntegrationJRockit Virtual Edition
Continued new JRE supportSQL Hash look-up
Request MonitoringSi l t i t
dimensional analysis of transactions
Platform SupportLatest versions of Fusion Apps
and FMW
IntegrationJVM as a target
Lifecycle ManagementWLS PatchingWLS Gold Image ProvisioningSingle request instance
transaction tracing
EM / RUEI IntegrationEnhance contextual drill-down
and FMW
Support IntegrationOffline Diagnostics expansion
framework
WLS Gold Image ProvisioningJava EE application
provisioning
Application Performance Management
Provisioning/CloningExpand platform support
(Solaris, AIX, Windows)
ManagementMiddleware Diagnostics
Advisor (MDA)
Support IntegrationOffline DiagnosticsOffline Diagnostics

Oracle Enterprise Manager 11gResource Center
Access Videos, Webcasts, White Papers, and More
Oracle com/enterprisemanager11gOracle.com/enterprisemanager11g

Additional Sessions / Demos / Hands-On Labs
SESSION ID
TITLE OF TECHNICAL SESSION DATE & TIME
LOCATION
S317067 WebLogic Server Management for Oracle DBAs
Thursday 9:00 am
Marriott Hotel, Salon 9
S316996 Oracle Enterprise Manager Grid Control Deployment Best Practices
Thursday 10:30 am
Moscone South, Room 102Deployment Best Practices 10:30 am Room 102
S317066 Deep Java Diagnostics and Performance Tuning: Expert Tips and Techniques
Thursday 1:30 pm
Marriott Hotel, Salon 9
S317060 Managing User Experience in the Cloud: Thursday Marriott Hotel, g g pLessons from eBay
y1:30 pm
,Golden Gate A
Enterprise Manager DEMOgrounds in Moscone West
Fusion Middleware Management Hands-On Lab on Tuesday 2:00-3:00 pm and Thursday 10:30 – 11:30 am in
Marriott Hotel Salon 12/13 YB Level
50
Marriott Hotel, Salon 12/13, YB Level