The Fisheries and Fishery Trade of the People's Republic of...
12
Foreign Fishery Developments Figure I.-The People's Republic of China. Figure 2.-China's total 1983 fisheries catch was 5.48 million t. compared with the 1982 fisheries har- vest of 4.9 million t. BAP estimated that the 1984 fisheries harvest was 6.0 mil- lion t, an increase of 11 percent over the 1983 harvest. China's fisheries catch increased sig- nificantly after its fishery development policy was revised in 1979. This policy promotes improved management of wild fisheries and the expansion of marine and freshwater aquaculture. China hopes to realize the full potential of its fisheries by continuing to implement and improve fisheries management plans and expanding aquaculture pro- duction efforts. Freshwater China harvests freshwater fish and shellfish from both the wild and from fish culture projects. From 1979 to 1984, the freshwater catch doubled from 1.1 million t to about 2.2 million t, or 17 percent more than the 1.8 million t har- vested in 1983. As in 1983, more than 80 percent of China's 1984 freshwater fish harvest was farmed. China was able to greatly increase its 1984 production because more than $78 million was in- vested in fish farming by collectives, other enterprises, and many individuals in the provinces of Guangdong, Hunan, and Jiangsu. Capture Fishery China's harvest of fishes totaled 0.4 million t in 1983, only 7 percent of the country's total fisheries catch and most- products, with principal markets being Japan, Hong Kong, and the United States. In 1983, China shipped nearly $11.9 million worth of fishery products to the United States-mostly shrimp and other high-valued shellfishes. Because China plans to increase cultured fish and shellfish production, many observers believe that its fishery exports will also expand. Conversely, China was the fourth largest Asian market for U.S. fishery products-mostly frozen herring-in 1983. Fisheries Catch China's Bureau of Aquatic Products (BAP) estimates that China's 1983 fish- eries harvest totaled nearly 5.5 million t (Fig. 2, Table 1), an increase of almost 10 percent (mostly from aquaculture) The Fisheries and Fishery Trade of the People's Republic of China Introduction The People's Republic of China (Fig. 1) is the world's third largest fisheries producer, after Japan and the Soviet Union (see related article on next page). Although Chinese fishermen caught nearly 5.5 million metric tons (t) in 1983, and an estimated record-high 6.0 million t in 1984, China's large coastal fishery is generally believed to be over- exploited. China, therefore, began studying dis- tant-water fishing as a possible alterna- tive to offset coastal overfishing. China has also increased its fish and shell- fish culture, thus enabling it to con- tinue as the world's leading aquacultural producer. China is a net exporter of fishery 72 Marine Fisheries Review
Transcript of The Fisheries and Fishery Trade of the People's Republic of...

Foreign Fishery Developments
Figure I.-The People's Republic of China.
Figure 2.-China's total 1983 fisheriescatch was 5.48 million t.
compared with the 1982 fisheries harvest of 4.9 million t. BAP estimated thatthe 1984 fisheries harvest was 6.0 million t, an increase of 11 percent over the1983 harvest.
China's fisheries catch increased significantly after its fishery developmentpolicy was revised in 1979. This policypromotes improved management of wildfisheries and the expansion of marineand freshwater aquaculture. Chinahopes to realize the full potential of itsfisheries by continuing to implementand improve fisheries managementplans and expanding aquaculture production efforts.
Freshwater
China harvests freshwater fish andshellfish from both the wild and fromfish culture projects. From 1979 to 1984,the freshwater catch doubled from 1.1million t to about 2.2 million t, or 17percent more than the 1.8 million t harvested in 1983. As in 1983, more than80 percent of China's 1984 freshwaterfish harvest was farmed. China was ableto greatly increase its 1984 productionbecause more than $78 million was invested in fish farming by collectives,other enterprises, and many individualsin the provinces of Guangdong, Hunan,and Jiangsu.
Capture Fishery
China's harvest of fishes totaled 0.4million t in 1983, only 7 percent of thecountry's total fisheries catch and most-
products, with principal markets beingJapan, Hong Kong, and the UnitedStates. In 1983, China shipped nearly$11.9 million worth of fishery productsto the United States-mostly shrimp andother high-valued shellfishes. BecauseChina plans to increase cultured fish andshellfish production, many observersbelieve that its fishery exports will alsoexpand. Conversely, China was thefourth largest Asian market for U.S.fishery products-mostly frozenherring-in 1983.
Fisheries Catch
China's Bureau of Aquatic Products(BAP) estimates that China's 1983 fisheries harvest totaled nearly 5.5 milliont (Fig. 2, Table 1), an increase of almost10 percent (mostly from aquaculture)
The Fisheries and Fishery Tradeof the People's Republic of China
Introduction
The People's Republic of China (Fig.1) is the world's third largest fisheriesproducer, after Japan and the SovietUnion (see related article on next page).Although Chinese fishermen caughtnearly 5.5 million metric tons (t) in1983, and an estimated record-high 6.0million t in 1984, China's large coastalfishery is generally believed to be overexploited.
China, therefore, began studying distant-water fishing as a possible alternative to offset coastal overfishing. Chinahas also increased its fish and shellfish culture, thus enabling it to continue as the world's leading aquaculturalproducer.
China is a net exporter of fishery
72 Marine Fisheries Review

Table 1.-China's fisheries catch, by quantity, 1979-84.
Catch (1,000 t)
Fishery 1979 1980 1981 1982 1983' 1984
Freshwater 1,115.9 1,239.9 1,373.5 1,562.0 1,843.0E 2,150.0EMarine 2,938.4 2,995.4 3,003.5 3,364.7 3,614.0E 3,850.0E
Total 4,054.3 4,235.3 4,377.0 4,926.7 5,457.0E 6,000.OE
lE = Preliminary estimate.
ly various carps. Because this fisherycannot meet the domestic demand,China is promoting freshwater fishculture.
Culture
China is the world's largest producerof farmed freshwater fish, and usedmore than 3.0 million hectares in 1983for fish culture. Still, the BAP estimatesthat the country could potentially employ nearly 5.0 million hectares of freshwater ponds. Grass carp, black carp, bighead carp, mud carp, and tilapia are theprincipal species cultured. Most of theharvest is consumed domestically.
China's freshwater culture owes itssuccess to several factors. Foremost, isthe policy of making multiple use ofwater resources. While reservoirs andsmaller farm ponds may be constructedprimarily for irrigation or domestic use,they are simultaneously used for fishproduction.
Secondly, China integrates most of itsfreshwater fish farming with animal husbandry and agriculture. For example,agricultural crops are used to feed farmanimals or poultry, whose manure isthen collected to fertilize fish ponds.The humus that accumulates in the fish
China Ranks Thirdin Fish Harvest
China's total fish catch in 1984 was6 million metric tons (t), 500,000 t morethan in 1983 and the third largest catchin the world, according to the NewChina News Agency. By 1990, Chinaplans to have 60 percent of its catch(about 5 million t) in canned, processed,and frozen food sales.
Currently, 240 national fish process-
47(3), 1985
ponds is then recycled back to the cropland l .
Thirdly, mixed species cultivation, or"polyculture," is widely practiced withgreat success. Finally, most fish growing regions of China have communesthat specialize in hatchery productionand rearing of fry for distribution tonumerous growout ponds at other communes. The personnel at these "hatchery" communes are accomplished insuch fields as induced spawning, selective breeding, larval rearing, diseaseprevention and treatment, and nutrition-areas normally thought to requirehighly specialized training in the West.
Provincial and municipal governments also promote freshwater fish culture. Beijing's Municipal Government isdoing so especially because of unstablesupplies of marine fishery products. Individuals, schools, Government agencies, army units, and other organizationsare also being encouraged to culturefreshwater fishes. Beijing's banks willextend credit for building ponds anddeveloping feed processing methods,
'Chinese officials believe that integrated fish culture is the most effective and efficient way to farmfreshwater fish. Nevertheless, some fish farmersdo not use integrated methods.
ing plants produce 1,480,000 t of fishproducts. And, a national fisheries processing center is scheduled for construction in Shanghai to produce cannedgoods for major northern Chinese metropolitan areas. China also has 370nationally operated freezing plants ofvarious sizes. And, while commercialfreezer construction has increased in recent years, small-scale, coastal commercial freezer production does not exceed30,000 t.
and municipal officials plan to reduceor remit taxes on production and salesof cultured freshwater fish for an unknown period. Organizations that leavesuitable freshwater ponds unused intheir vicinities are reportedly fined.
Marine
China's marine fisheries catch (3.6million t in 1983) combines the harvestsfrom mariculture, coastal fisheries, anddistant-water fisheries. Most of the catchcontinues to be harvested by trawling(mostly pair trawling) or seining incoastal waters. The Chinese Government realizes that this coastal fishery isoverexploited and is taking measures toprotect and stabilize it, while studyingdistant-water fishing opportunities in thePacific and Indian Oceans.
The Chinese reportedly manufacturetheir own engines, associated machinery, stern gear, winches, and windlasses. All electronic fishing aids andnavigation equipment, apart from sonar,are also produced domestically. TheChinese manufacture their own netting,lines, ropes, floats, and hooks. Polyethylene appears to be the principal synthetic material used for ropes, but somenylon is used in purse seines.
China has expressed interest in Western fisheries technology, and the ChinaMarine Industries Corporation and various Government fishery agencies organized "Fishery China '85", the SecondInternational Fishery and ProcessingExhibition, 16-21 November 1985, inHangzhou, Zhejiang Province. Chineseofficials attending the Exhibition wereempowered to purchase Western fisheries technology.
Capture Fishery
Wild-caught fishes accounted formost of China's marine harvest in 1983-nearly 3.1 million t, or almost 60 percent of China's total fisheries catch.Much of China's marine catch is madeby 17 state-owned fishing corporations,of which the largest two are the Shanghai Marine Fisheries Company and theDalian Marine Fishery Company. Thepredominant species landed by China'smarine fishermen include filefish, hairtail, chub mackerel, yellow croaker,Spanish mackerel, and herring.
73

China has increased its efforts to develop a distant-water fishery. In 1984,it entered into joint venture agreementswith Japan, Mauritius, New Zealand,Somalia, and Sri Lanka, and may seekother joint venture partners in the future(see related articles on pages 77 and 83).China has also purchased several usedseiners and trawlers from Japanese companies, as well as fishing gear and netmaking equipment, and was reportedlyattempting to negotiate the purchase ofother fishing vessels from Japan. However, the Japanese may be reluctant toexport more vessels to China for fear ofcompetition with Japanese fishermen inthe North Pacific.
China has also expressed an interestin obtaining fishing allocations withinthe US. 200-mile Exclusive EconomicZone (EEZ), and a delegation had anexploratory meeting with representatives of the US. Departments of Stateand Commerce in September 1984 todiscuss fishing off Alaska. US. representatives briefed them on the status offishery stocks off Alaska and on theneed to negotiate a governing international fishery agreement (GIFA) beforeChina could apply for allocations. US.officials also explained the rules andregulations that apply to foreign fishingvessels operating in the US. EEZ. Further talks were held in November in Beijing, and more were planned for Spring1985.
Culture
China's mariculture production was arecord-high 0.5 million t in 1983; seacucumber, scallop, abalone, shrimp(mostly Peneaus orientalis) , and variousaquatic plants were the primary species(Table 2). Mariculture conditions in
China's Aquaculture, 1984
China's aquaculture industry reportedly produced fish and shrimp totalling2,450,000 metric tons (t) in 1984,with the marine culture sector totalling600,000 t. The increase was due in partto an increase in fish farming area to3,470,000 hectares, with 130,000 hectares of otherwise untillable land beingbrought under aquaculture. In addition
74
China are considered excellent. Thecountry has a lengthy coastiine withmany estuaries, shoals, and mudflatsideal for fish farming. BAP estimates thesaltwater culture capacity at 1.3 millionhectares. Although recent data are unavailable, China reportedly exported$40 million worth of cultured marinefishery products in 1981.
Fisheries Trade
China does not release detailed import and export statistics, making accurate fisheries trade analysis difficult.China reportedly imports few fisheryproducts; instead, observers believe thatit is trying to expand its fishery exportsto earn foreign exchange.
Largest Market
Hong Kong is believed to be thelargest market for Chinese fishery products, but it is not known how muchHong Kong re-exports elsewhere2. Japanis another large market for Chinese fishery product exports (Table 3) and hasreceived more than 30,000 t annuallysince 1979-mostly shrimp, clams,crabs, jellyfish, and seaweed, and lesseramounts of eel, Spanish mackerel, andherring. Because China plans to increase marine fish and shellfish culture,many observers believe that its fisheryexports will also expand.
Policy Changes
The Chinese Government has decided
'Hong Kong imported U9,000 t of fishery productsin 1982 and more than 124,000 t in 1983, over SOpercent of which is believed to have come fromChina. Hong Kong does not break down its fishery import statistics by country so precise figuresare unavailable.
the Provinces of Guangdong and Jiangsureceived 100 million yuan in financingfor fish pond renovation in 1984 and theChina Ministry of Agriculture, Pasturesand Farming provided aquaculture training courses in the Provinces of Jiejiang,Hunan, and Anwei. Farms specializingin fish and shrimp production also increased and group fish farming contracts encouraged by the governmentgrew to 2,070,000 in 1984.
Table 2.-Some of the marine species cultured in China.
Category English name Scientific name
Fish Giant perch Lates calcarifer
Shellfish Blue mussel My/flus edulisRazor clam Sinonovacufa constructaOysters Ostrea plicatula
Crassostrea gigasC. talienwhanensis
Abalone Haliotis discus hanna;Scallop Chlamys farrer;Oriental shrimp Penaeus orientalisBanana shrimp P merguiensisCrabs NIA'
Other Sea cucumber Stichopus spp.Kelp Laminaria japonicusGiant kelp Macrocystis pyrifera
'NIA = Not available.
to relax the rigid control over its fishing industry and to promote fish farming to ease the nationwide shortage offishery products. The decision to revisethe fisheries marketing policy was madeby the Communist Party's Central Committee, together with the State Council,and is aimed at quadrupling China'sfisheries production and tripling percapita fishery consumption by the endof this century.
The new policy abolishes State purchase quotas for fishery products andestablishes a free market in its place.Fish prices will now be set accordingto floating market rates, provided thatthe prices do not exceed or fall belowan unspecified (at this writing) pricerange for the various species. Whenprices become too high or too low, theGovernment will regulate them either bybuying the products or by increasingproduction.
The new marketing policy will becombined with reforms in China's management of the fishing industry aimedat simplifying fisheries administrationand leaving more decisions to variousindependent provincial and municipalfishery corporations and cooperatives.These independent entities will then beresponsible for their own profits andlosses.
U.S.-ChinaFisheries Trade
The United States and China first began direct fisheries trade in the early1970's. Although currently small, thepotential of this trade is great. In 1983,fisheries trade between the United States
Marine Fisheries Review
25,--------------,
198419831982
,I,
I ,I ,
I ,I ,
I ,I ,
EXpOrts,' "I ,. ,
I ,.I
1980a '--_--''-_----'~'__''_''=.c___"___----'1979
w~ 2
g: '\,,,,,,
JL'-------"'-_-'--=-=--_-_-...c'___"___---'1979 1980 1981 1982 1983 1984
20
8o~ 3
Figure 3,-U.S. fisheries trade withChina, by value, 1979-84.
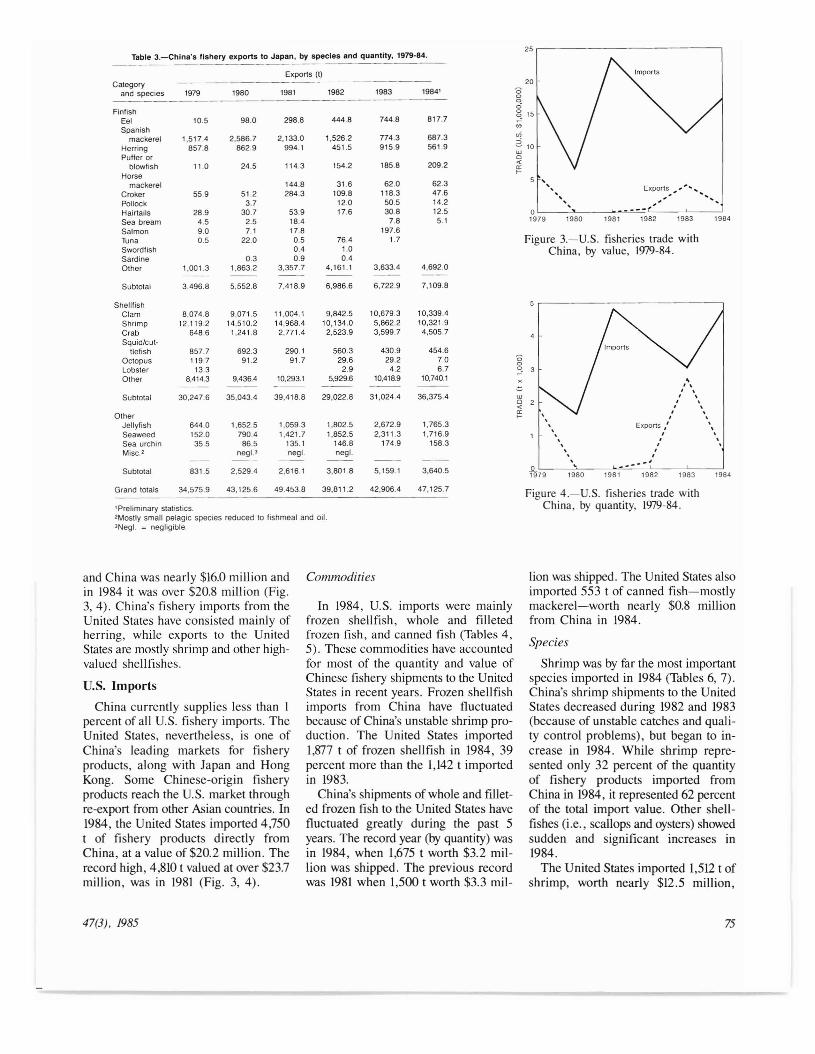
Figure 4.-U.S. fisheries trade withChina, by quantity, 1979-84.
8ooo~ 15.,<Ii2 10wo«a:t-
Table 3.-China's fishery exports to Japan, by species and quantity, 1979-84.
Exports (t)Category
and species 1979 1980 1981 1982 1983 1984'
FinfishEel 10.5 98.0 2988 444.8 744.8 817.7Spanish
mackerel 1,517.4 2,586.7 2,133.0 1,526.2 774.3 687.3Herring 857.8 862.9 994.1 451.5 915.9 561.9Puffer or
blowfish 11.0 24.5 114.3 154.2 185.8 209.2
Horsemackerel 144.8 31.6 62.0 62.3
Croker 55.9 51.2 284.3 109.8 118.3 47.6Pollock 3.7 12.0 50.5 14.2Hairtails 28.9 30.7 53.9 17.6 30.8 12.5Sea bream 4.5 2.5 18.4 7.8 5.1Salmon 9.0 7.1 17.8 197.6Tuna 0.5 22.0 0.5 76.4 1.7Swordfish 0.4 1.0Sardine 0.3 0.9 0.4Other 1.001.3 1,863.2 3,357.7 4,161.1 3,633.4 4,692.0
Subtotai 3,496.8 5,552.8 7,418.9 6,986.6 6,722.9 7.109.8
ShellfishClam 8,074.8 9,071.5 11,004.1 9,842.5 10,679.3 10,339.4Shrimp 12,119.2 14,510.2 14,968.4 10,134.0 5,862.2 10,321.9Crab 648.6 1,241.8 2,771.4 2,523.9 3,599.7 4,505.7Squid/cut·
tlefish 857.7 692.3 290.1 560.3 430.9 454.6Octopus 119.7 91.2 91.7 29.6 29.2 7.0Lobster 13.3 2.9 4.2 6.7Other 8,414.3 9,436.4 10.293.1 5,929.6 10,418.9 10,740.1
Subtotal 30,247.6 35,043.4 39,418.8 29,022.8 31,024.4 36,375.4
OtherJellyfish 644.0 1.652.5 1,059.3 1,802.5 2,672.9 1,765.3Seaweed 152.0 790.4 1,421.7 1,852.5 2,311.3 1,716.9Sea urchin 35.5 86.5 135.1 146.8 174.9 158.3Misc.2 negl.' negI. negI.
Subtotal 831.5 2,529.4 2,616.1 3,801.8 5,159.1 3,640.5
Grand totals 34,575.9 43,125.6 49.453.8 39,811.2 42,906.4 47,125.7
1Preliminary statistics.'Mostly small pelagic species reduced to tishmeal and oil.'Negl. = negligible.
and China was nearly $16.0 million andin 1984 it was over $20.8 million (Fig.3,4). China's fishery imports from theUnited States have consisted mainly ofherring, while exports to the UnitedStates are mostly shrimp and other highvalued shellfishes.
U.S. Imports
China currently supplies less than Ipercent of all u.s. fishery imports. TheUnited States, nevertheless, is one ofChina's leading markets for fisheryproducts, along with Japan and HongKong. Some Chinese-origin fisheryproducts reach the U.S. market throughre-export from other Asian countries. In1984, the United States imported 4,750t of fishery products directly fromChina, at a value of $20.2 million. Therecord high, 4,810 t valued at over $23.7million, was in 1981 (Fig. 3, 4).
Commodities
In 1984, U.S. imports were mainlyfrozen shellfish, whole and filletedfrozen fish, and canned fish (Tables 4,5), These commodities have accountedfor most of the quantity and value ofChinese fishery shipments to the UnitedStates in recent years. Frozen shellfishimports from China have fluctuatedbecause of China's unstable shrimp production. The United States imported1,877 t of frozen shellfish in 1984, 39percent more than the 1,142 t importedin 1983.
China's shipments of whole and filleted frozen fish to the United States havefluctuated greatly during the past 5years. The record year (by quantity) wasin 1984, when 1,675 t worth $3.2 million was shipped. The previous recordwas 1981 when 1,500 t worth $3.3 mil-
lion was shipped. The United States alsoimported 553 t of canned fish-mostlymackerel-worth nearly $0.8 millionfrom China in 1984.
Species
Shrimp was by far the most importantspecies imported in 1984 (Tables 6, 7),China's shrimp shipments to the UnitedStates decreased during 1982 and 1983(because of unstable catches and quality control problems), but began to increase in 1984. While shrimp represented only 32 percent of the quantityof fishery products imported fromChina in 1984, it represented 62 percentof the total import value. Other shellfishes (i.e" scallops and oysters) showedsudden and significant increases in1984.
The United States imported 1,512 t ofshrimp, worth nearly $12.5 million,
47(3), 1985 75

from China in 1984, an increase of 42percent by quantity and 51 percent byvalue compared with 1983. Most of theimported shrimp was shipped frozen(shell on); the rest was shipped eitherpeeled and deveined, or canned. China
generally ships three grades of shrimpto the United States: Superior, good,and marginal.
China's shipments of abalone, clams,crabs, oysters, and scallops to the UnitedStates showed a significant increase in
1983, and that trend continued in 1984.Almost 600 t of these high-valued shellfishes worth over $2.5 million, wereshipped to the United States in 1984, anincrease of 30 percent by quantity and26 percent by value, compared with
Table 4.-U.S. fishery imports from China, by quantity and commodity, 1979·84. Table 5.-U.S. fishery imports from China, by value and commodity, 1979·84.Source: U.S. Census Bureau.
U.S. imports (US$1,000)U.S. Imports (t)
Commodity 1979 1980 1981 1982 1983 1984Commodity 1979 1980 1981 1982 1983 1984
EdibleEdible Fish
Fish FrozenFrozen Whole 995.5 833.2 3,299.7 2,763.3 1,461.3 2,686.9
Whole 696.7 536.5 1,506.7 1,381.8 740.3 1,394.4 Fillets 181.1 108.1 116.2 213.2 519.9 523.3Fillets 113.8 56.4 57.3 119.0 294.5 280.5 Canned 203.5 518.0 814.1 691.1 883.2 772.6
Canned 108.5 325.9 607.8 418.7 459.6 553.1 Cured 203.3 512.4 471.7 779.9 560.6 619.5Cured 51.6 96.8 108.6 182.8 133.3 165.0 Roe 50.2 33.2 3.4 2.9 24.8 7.2Roe 0.5 0.3 neg!. 0.1 0.2 0.2 Other' 2392 209.0 249.5 477.9 356.5 442.8Other' 50.9 48.5 67.6 124.9 132.4 192.0 Shellfish
Shellfish Frozen 15.327.5 4,091.3 18,454.0 12,889.3 7,480.5 14,459.3Frozen 1,448.1 539.2 2,408.0 1,583.4 1,142.4 1,877.0 Canned 279.2 135.4 178.1 214.8 406.0 451.5Canned 46.6 47.9 47.0 49.7 116.8 189.6 Other 65.2Other 46.7
Subtotal 17,479.5 6,440.6 23,586.7 18,032.4 11,692.9 20,028.3Subtotal 2,516.6 1,651.6 4,802.9 3,860.4 3,019.5 4,698.5
NonedibleNonedible Fishmeal 10.6
Fishmeal 20.9 Fish oil 4.9 10.5Fish oil 1.3 2.6 Other 70.9 84.3 138.1 84.4 190.4 201.3Other 3.3 4.8 63 6.1 34.0 27.3
Subtotal 70.9 84.3 138.1 89.3 200.9 211.9Subtotal 3.3 4.8 63 7.4 36.6 48.2
Grand total 2 17,550,4 6,524.9 23,724.8 18,121.7 11,893.8 20,240.2Grand total' 2,519.9 1,656,4 4,809.2 3,867.8 3,056.1 4,746.7
'Includes fish sticks, pastes, etc.'Includes fish sticks, pastes, etc. 2Totals may not agree because of rounding.2Totals may not agree because of rounding.
Table 6.-U.S. fishery imports from China, by quantity and species, 1979·84. Table 7.-U.S. fishery imports from China, by value and species, 1979·84.
U.S. imports (t) U.S. imports (US$1,000)Category Category
and species 1979 1980 1981 1982 1983 1984 and species 1979 1980 1981 1982 1983 1984
Edible EdibleFish Fish
Mackerel 11.1 110.7 333.4 225.2 173.2 296.4 Flatfish 23.0 18.4 274.3 284.2Flatfish 15.3 10.0 140.1 135.8 Mackerel 10.4 71.6 227.8 146.4 125.4 208.7Pollock 36.0 36.0 246.6 Groundfish 44.1 95.2 99.5 132.8 922 307.1Groundifsh 16.1 '27.4 29.3 45.2 35.9 163.1 Pacific cod 1.2 1.1 38.3 11.1Pacific cod 0.5 02 22.3 6.4 Pollock 54.0 34.9 337.6Herring 3.3 2.6 0.2 3.0 0.3 0.5 Herring 4.4 2.9 0.1 17.3 06 0.3Sardines 4.4 6.9 1.5 25.6 23.5 Sardines 4.9 6.2 1.9 35.6 26.4Tuna 0.6 3.0 333.0 354.5 213.1 Tuna 0.4 9.3 904.4 909.5 292.6
Other 923.8 884.0 1,595.5 1,446.0 1,275.9 1,367.3 Other 1,570.5 1,890.8 3,536.7 3,279.4 3,031.4 3,357.1Shellfish Shellfish
Shrimp 1,3556 435.5 2,298.6 1,305.2 879.0 1,512.7 Shrimp 14,904.4 3,455.8 17,718.4 11,525.4 6,055.1 12,450.8
Oysters 13.5 20.1 12.7 163 82.5 145.3 Scallops 6.8 17.1 25.0 32.4 258.1 57.2Crabs 0.6 0.5 37.3 37.4 68.3 145.6 Oysters 115.6 87.3 63.2 78.3 252.5 318.9
Clams 17.0 36.1 31.1 54.6 58.9 386 Crabs 2.4 3.9 91.9 124.1 197.1 446.3Scallops 0.2 0.4 0.6 1.5 23.6 1.9 Abalone 15.7 60.5 68.2 133.5 181.3 135.7
Abalone 1.2 7.4 4.2 7.6 12.4 7.3 Clams 185 588 68.6 94.5 99.3 66,4
Lobsters 7.2 5.8 0.2 1.7 6.9 31.0 Lobsters 27.5 40.7 1.7 15.7 73.5 261.8Other 99.4 93.2 1083 253.3 163.2 229.9 Other 515.9 521.2 650.8 1,154.1 817.3 1,236.2
Other items' 46.8 18.0 16.7 37.2 40.9 133.4 Other items' 214.1 119.3 126.7 281.2 161.7 229.8
Subtotal' 2,516.6 1,651.6 4,802.9 3,860.4 3,019.5 4,700.2 Subtotal' 17,479.5 6,440.6 23,586.7 18,032,4 11,692.9 20,028.2
Nonedible 3.3 4.8 6.3 7.4 36.6 46.5 Nonedible 70.9 84.3 138.1 893 200.9 211.5
Grand total' 2,519.9 1.656.4 4,809.2 3,867.3 3,056.1 4,746.7 Grand total' 17,550.4 6,524.9 23,724.8 18,121.7 11,893.8 20,240.2
'Includes fish sticks, pastes, etc. 'Includes fish sticks, pastes, etc.'Totals may not agree because of rounding. 2Totals may not agree because of rounding.
76 Marine Fisheries Review

Grand total' 1,766.1 0.2 229.2 2,704.7 455,6
Grand totals' 5,209.8 0.5 465.9 4,069.2 684,2
Table 9.-U.S. fishery exports to China, by value andcommodity, 1979-84. Source: U.S. Census Bureau.
Table 8.-U.S. fishery exports to China, by quantity andcommodity, 1979-84.
China Forms JointVentures WithJapan, New Zealand
The first Japan-China fisheries jointventure, the Danyo Fisheries Company 1,
was scheduled to begin operation inearly 1985. The joint venture wasformed between Japan's Taiyo FisheriesLtd. and China's Danshan Fishing Company, which reportedly proposed thejoint venture to Taiyo in 1983. China hassupplied 55 percent of the initial capitalof more than $1.2 million, while Taiyosupplied the remaining 45 percent.
The Danshan Company has purchased six fishing vessels from Japan forcatching cutlassfish, drum, and sharptoothed eel, all for export to Japan forprocessing. Another ten purse seinersand freezer vessels are sought. The jointventure will also be involved in shrimpfarming near Shanghai and Dalian.
Yet another joint venture has beenformed between Japan's Taiyo Gyogyoand a fisheries company in ChekiangProvince. This new company is capitalized at ¥300 million (US$1.3 million),55 percent from the Chinese partners.Immediate plans called for bringingtrawlers from Japan to fish hairtail andcroaker for sale in China. Future plansinclude expanded fishing operations andshrimp culture.
China also agreed to establish ashrimp farming joint venture with NewZealand, the first joint venture of anykind between the two countries. Chineseshrimp culture technicians were scheduled to visit New Zealand earlier in1985 to study sites for shrimp farming.After a suitable site is chosen, a company will be formed which will beowned 60 percent by New Zealand interests and 40 percent by China. Thetwo sides hope to begin commercial production to supply both New Zealand andforeign markets within 3 years. Thejoint venture marks the first time thatChina will utilize, on a commercialbasis, its own shrimp farming expertisein another country.
I Mention of trade names or commercial firms doesnot imply endorsement by the National MarineFisheries Service, NOAA.
20 9
80 30150 60150 60150 60
Tariff rate (percentage)
Pre-March Post-March10 10
China in 1984 were only 456 t, worthabout $0.7 million.
It is not known how many U.S. fishery products reach China indirectlythrough re-exports, or consignmentsales through third countries. U.S. fishery exports to China in 1982, 1983, and1984 consisted almost entirely of frozenwhole herring which was further processed in China (Fig. 3,4; Tables 8, 9).
New Customs Rules
China has also announced new customs regulations for various goods, including fishery products (Table 10).Effective 10 March 1985, duties wereassessed according to the country oforigin rather than exporting company.There are two tariff rate systems: 1) a"Minimum Tariff Rate" is applied ongoods originating in countries withwhich China has mutually beneficialtrade treaties or agreements, and 2) a"General Tariff Rate" is applied ongoods from countries without specialbilateral trade agreements. The reasonwhy China is reducing the tariff rate onimports of certain fishery products andfishing vessels is because China cannotproduce sufficient quantities of fish tosupply its domestic demand, and because it cannot build enough highquality fishing vessels.
It is not yet clear what China's policychanges mean for U.S. fishery exportsto that nation. Some observers believethat there is a possibility that U.S. fishery exports to China, especially for inexpensive and underutilized species,such as Alaska pollock, may increase asa result of China's fishery marketing reforms. (Sources: IFR-84/104B, 85-27,and 85-28.)
Product
Table 10.-Chlna's customs regulations before and alter10 March 1985.
Powered ships(fishing vessels)
Freshwater andmarine fish species
AbaloneShark finsSea cucumbers
0.5
0.72.4 2.5
3.2
18.111.5 24.0
229.2 2,704.7 455.6
226.2 2,691.1 455.610.7
436.3 4,011.3 684.230.6
465.9 4.069.2 684,2
Exports (US$1,000)
1979 1981 1982 1983 1984
1979 1981 1982 1983 1984
NonedibleFishmealFish oil 0.2OtherSubtotal 0.2
EdibleFinfish
FrozenWhole 1,112.0Fillets
CannedCured 654.0RoeOther
ShellfishFrozenCannedOther'
Subtotal 1.766.1
1983. The 1983 imports of these speciestotalled 246 t, worth nearly $1.0 millionand double the 1982 figures of 117 t and$0.5 million, respectively.
U.S. Exports
China was the fourth largest Asianmarket for U.S. fishery products in1983, after Japan, Korea, and Taiwan,and receiving direct exports of over2,700 t, worth almost $4.1 million.However, direct U.S. fishery exports to
Commodity
'Includes fish sticks. pastes. etc.'Totals may not agree because of rounding.
Commodity
NonedibleFishmealFish oil 0,5OtherSubtotal 0,5
EdibieFinfish
FrozenWhole 3,047.0Fillets
CannedCured 2,162.8RoeOther
ShellfishFrozenCannedOther'
Subtotal 5,209.8
, Includes fish sticks, pastes, etc.'Totals may not agree because of rounding.
47(3), 1985 77

Japan's Pacific SalmonFisheries and Trade, 1974-84
A. George Herrfurth
Introduction
Japan obtains Pacific salmon, Oncorhynchus spp. (Table 1), from four
Table 1.-Names of the Pacific salmon.
English name Japanese name Scientific name
Cherry salmon masu Oncorhynchusmasou
Chinook salmon' masunosuke 0. IshawylschaChum salmon sake 0. ketaCoho salmon2 gin-zake 0. kisutchPink salmon karafuto-masu 0. gorbuschaRedspot salmon amenouo 0. rhodurusSockeye salmon' beni-zake 0. nerka
'Also called king salmon.2AIso called silver salmon'Also called red salmon; the land-locked form is calledkokanee salmon.
sources: 1) A coastal trap-net fishery(based on returns of salmon releasedfrom hatcheries), 2) a high-seas catch,3) imports, and 4) cage culture. Thissalmon supply more than doubled between 1974 and 1984 (Table 2).
An increased salmon demand, a decreased high-seas catch, and the deisreto reduce dependence on salmon imports and help domestic fishermen,prompted the Japanese Government toexpand the salmon hatchery program in1979. Hatchery returns have grown
This news article, IFR-84/79B, was written by A.George Herrfurth of the Foreign Fisheries AnalysisBranch, F/M321, NMFS, NOAA, Washington,DC 20235.
steadily since, and accounted for 45 percent of Japan's salmon supply in 1983,according to the Japan Fisheries Agency(JFA).
Japan's annual salmon importsaveraged 10,000 metric tons (t) in themiddle 1970's, owing to lower demandand no 200-mile fishing zone restrictions. Since then, however, the UnitedStates has become Japan's leadingsalmon supplier and exports to Japan increased markedly during the pastdecade because of Japan's growingsalmon demand and decreasing highseas catches. Japanese imports of U.S.salmon were over 96,000 t in 1983, butwere expected to be lower in 1984 because of an over-supply of salmon inJapan.
Japan's hatchery programs, however,cannot completely replace imports.Chum salmon, Oncorhynchus keta, isthe primary species in the Japanesehatchery program, while most importedsalmon is sockeye, 0. nerka. The cohosalmon, 0. kisutch, is the primary cagecultured species.
Table 2.-Japan's salmon supply, 1974-84'.
Catch (1,000 t) Trade (1,000 t) Totaisupply
Year Coastal' High-seas' Culture Total Imports Exports Balance (1,000 t)
1974 39.2 86.9 126.1 8.3 13.1 + 4.8 121.31975 64.2 91.0 155.2 10.7 19.9 + 9.2 146.01976 38.1 82.2 120.3 9.5 20.8 + 11.3 109.01977 45.5 62.6 108.1 26.4 4.7 - 21.7 129.81978 59.1 41.5 0.1 100.7 57.9 4.2 - 53.7 154.41979 87.3 42.4 0.4 130.1 64.7 1.7 - 63.0 193.11980 79.9 42.5 1.9 124.3 48.7 1.3 - 47.4 171.71981 107.9 42.5 1.2 151.7 83.1 1.7 - 81.4 233.11982 101.5 42.4 2.1 146.0 117.7 0.5 -117.2 263.21983 120.6 42.5 2.9 166.0 108.5 0.9 -107.6 273.61984 N/A4 40.0 4.5Es N/A N/A N/A N/A N/A
lCatch is given in live weight and trade statistics are in product weight. Since over 90 percent of all salmonimported in recent years was whole fresh or frozen, the total supply weight has only a small margin of error."The Japanese refer to this catch as the "hatchery returns" catch. In addition to the inshore coastal catch,the figures also include the inland salmon catch, but exclude a small cherry salmon and landlocked salmoncatch.'The Soviet-granted catch quota was 42,500 t from 1978 to 1983; in 1984, it was reduced to 40,000 t.4N/A = Not available.sE = Estimate.
Table 3,-Japan's salmon catch, by species, 1974-83.
Catch (t)
Species 1974 1975 1976 1977 1978 1979 1980 1981 1982 1983'
Chum 80,146 99,485 78,417 71,931 74,089 101,466 96,920 120,801 111,760Pink 32,537 45,936 29,629 35,264 17,176 24,060 20,101 25,509 20,797Coho 9,713 8,161 7,697 3,757 5,755 2,708 3,634 3,285 5,022Sockeye 8,155 7,733 8,844 4,601 5,261 5,510 6,070 5,227 4,269Cherry 3,101 3,871 3,814 3,822 3,600 2,669 2,777 3,296 3,661Chinook 1,867 1,115 1,604 908 1,075 1,227 2,484 1,381 1,018
Total' 135,519 166,301 130,005 120,283 106,956 137,640 131,986 159,499 146,527 166,000
lPreliminary estimate.'FAO and Japanese catch statistics do not always agree (see "Total catch" in Table 2).
78
The Fisheries
Japan catches salmon in both coastaland high-seas fisheries and farms themin coastal cages. Until the middle 1970's,most of Japan's catch was taken by thehigh-seas fleet. However, the Sovietdeclaration of a 200-mile fishing zonein 1976, and subsequent insistence thatthe Japanese reduce their high-seascatch of Soviet-origin salmon, sentJapan's high-seas catch to a low of107,000 t in 1978.
The Government enlarged its hatcheryprogram in 1979 to improve coastal harvests, and the program has been remarkably successful. Thus, the increasingcoastal catch helped Japanese fishermenland a record 166,000 t of salmon in1983. Several species of Pacific salmonare caught by Japanese fishermen, butmost (>75 percent in 1983) are chumsalmon (Table 3).
Coastal
Japan's coastal salmon fishery is conducted almost entirely with fixed gear.Trap nets are set in shallow coastalwaters near the natal rivers where thehatchery-produced salmon return to
Marine Fisheries Review

Table 5.-JFA budget for the Salmon Culture Program, 1979-84.
Item 1979 1980 1981 1982 1983 1984
Cost of governmentalhatcheries ¥2,005 ¥ 2,200 ¥ 2,264 ¥2,186 ¥2,218 ¥2,070
Subsidies to privatehatcheries' 1,241 1,386 1,409 1,289 1,241 1,172
Total (millions of yen) ¥3,246 ¥3,586 ¥3,673 ¥3,475 ¥3,459 ¥3,242
Total(millions of U.S. dollars) $14.7 $15.9 $18.6 $13.9 $14.5 $14.1
lThe 1951 "Aquatic Resources Conservation Law," obligates the Japanese Government tosubsidize the expenses of privately managed salmon hatcheries, provided that coastal fish·ermen also bear part of the expenses.
Table 4.-Salmon hatchery programs in Hokkaido and Honshu, 1974-87.
Fry released (in millions) Salmon returns' (1,000 t)
Year Hokkaido Honshu Total 2 Hokkaido Honshu Total'
1974 485 272 757 35.1 (2.2) 4.0 (0.8) 39.2 (1.8)1975 802 344 1,146 576 (2.7) 67 (0.9) 642 (2.2)1976 523 287 810 32.1 (1.9) 6.0 (0.7) 381 (1.5)1977 693 413 1,106 37.3 (2.3) 8.2 (0.8) 45.5 (1.7)1978 779 433 1,212 48.0 (2.7) 11.2 (1.1) 59.2 (2.1)1979 873 590 1,463 69.0 (2.4) 18.7 (1.5) 877 (2.1)1980 1,146 750 1,896 56.4 (3.0\ 25.4 (2.4) 81.8 (2.8)1981 1,080 738 1,818 80.0 (3.2) 29.1 (1.9) 1091 (2.7)1982 1,108 864 1,972 731 (2.6) 30.4 (1.9) 103.6 (2.3)1983 1,147 829 1,976 84.0 (2.6) 39.5 (1.8) 123.5 (2.3)1984 1,179' 846' 2,025' N/A' N/A NIl>1985 NIl> N/A N/A NIl> N/A N/A1986 N/A N/A N/A N/A N/A N/A1987 NIl>. N/A N/A 100.7 (2.5)E5 40.2 (1.9)E 140.9 (2.3)E
11ncludes cage~culture productior.. Data in parentheses indicate percentage rates of returnof salmon fry released 4 years earlier.2Totals may not agree because of rounding.'Releases planned for 1984.'N/A = Not available.5E ~ Estimated from salmon fry released in 1984.
spawn after being at sea 3-7 years.The coastal fishery is also entirely
dependent on the returns of hatcheryraised chum salmon. Those whichescape this commercial fishery, andcontinue their migration upriver, arecollected in weirs for delivery to hatcheries where they are spawned to complete the life cycle.
Japan's salmon hatchery programshave been exceptionally successful, andreturns have increased steadily. Thecoastal catch of hatchery-producedsalmon increased from 39,200 t in 1974to 120,600 t in 1983, or by 200 percent(Table 2). The increased returns wereespecially pronounced during the early1980's and were the result of the 5-year(1979-83) salmon culture program sponsored by the Japanese Government.
This program was carried out by 44governmental and about 220 privatehatcheries in Hokkaido and Honshu,and increased releases and new releasemethods reportedly insured the program's success. Although the salmonreturn 3-5 years after release, the JFAcalculates the returns for an average4-year period (Table 4).
Japan released nearly 2 billion salmonfry in 1983 (1.2 billion from governmenthatcheries and 0.8 billion from privatehatcheries). Most (1.8 billion-94 percent) were chum fry. The Japanese alsoreleased small amounts of sockeye;pink, 0. gorbuscha; cherry, 0. masou;and kokanee, 0. nerka, salmon fry in
47(3), 1985
1983. Japanese coastal fishermen expectto harvest 140,900 t, or about 38.6 million mature salmon in 1987.
The JFA has expressed concern abouta new 5-year salmon hatchery program(1984-88) because of the long-term effect it might have on prices and the costsinvolved. If the 1987 projected hatcheryreturns are accurate and if salmon imports continue to increase, JFA officialsbelieve that salmon supplies might exceed the demand, resulting in lowerprices. The JFA is therefore considering a hatchery enhancement program forfry of such high-valued species as cherryand sockeye salmon (i.e., qualitativerather than quantitative hatchery enhancement). The JFA is also considering sponsoring new efforts to advancethe return season of chum salmon to increase its oil content and value since theJapanese prefer a "fatty" salmon.
Financial problems are also affectingplans for. a new 5-year salmon hatcheryprogram. The Japanese Finance Ministry does not wish the JFA to continueassuming the large burden of financingthe hatchery program and believes thatcoastal trap-net fishermen should contribute more to the hatchery program sincethey benefit most from the salmonreturns. In 1983, Japanese fishermenpaid only $5.5 million of the $20.0 million spent on the hatchery enhancementprogram, while the JFA salmon culturebudget supplied the remaining $14.5million (Table 5).
Budget (millions of yen)
High-Seas
Japan's high-seas salmon fishery consists of mothership, drift-net, and longlining operations in the North Pacific.Japan also depends on annual catchquotas granted by the U.S.S.R. for itshigh-seas salmon catch, about 90 percent of which was spawned in Sovietrivers I.
Until 1977, Japan obtained most of itssalmon from the high-seas (65 percentin 1974). By 1983, however, only 16 percent came from this fishery (Fig. I), asthe Soviet quotas were reduced morethan 52 percent (from 83,000 t in 1974to 40,000 t in 1984).
The most significant quota reductionoccurred in 1978 when the U.S.S.R. proposed a total ban on the Japanese highseas salmon fishing and, as a compromise, reduced Japan's salmon quotafrom 62,000 t to 42,500 t, where it remained through 1983. During the 1984negotiations, the Japanese high-seassalmon quota was further reduced to40,000 t.
The bilateral salmon agreement alsorequires Japan to pay fishery fees. Theseare paid in goods related to the enhancement of the Soviet Pacific salmon industry. Although Japan's annual high-seassalmon quota was constant between 1978and 1983, Soviet fishing fee demands increased. In 1978 Japan paid Russia $8.5million ($200/t), and in 1983 the feeshad more than doubled to $17.9 million
lIn addition to the U.S.S.R. salmon quota, established by a bilateral agreement, Japanese fishermen also operate under the terms of the International North Pacific Fisheries Convention(INPFC).

Figure I.-lapan's salmon supply, excluding exports, 1974 and 1983.
Grading Description
suIted in their dumping. Although theJFA projected that the fall 1984 coastalcatch would be lower than in 1983, observers believed that 1984 salmon imports would also decline.
Commodities
Most salmon in Japan is salted,smoked, or canned; the rest is consumed fresh. Although per capita consumption of salted and smoked salmonhas increased greatly in recent years,fresh salmon consumption has increasedonly marginally, perhaps because theJapanese traditionally favor salted andsmoked salmon over fresh salmon.
Salmon roe, a favored delicacy inJapan, is mostly cured, either as "sujiko" (in the membranous skein) or"ikura" (eggs separated from the skein).It is especially consumed during theNew Year holidays (Oshogatsu).
Species
Chum salmon is the cheapest andmost abundant salmon in Japan, andmore of it is consumed there than anyother salmon. Mostly salted or smoked,it is obtained from the coastal catch;only small quantities are processed fromimports or the high-seas catch.
When landed, chums are systematically graded by age and condition.Those with bright skin, firm and "goodcolor" flesh, and high fat content arerated highest, while old and spent ordamaged salmon are rated among thelowest of the seven gradings (Table 6).
Chum salmon have long been populargifts in Japan. However, Japanesewholesalers see a need to reassess theso-called "gift salmon" market since the1983 record-high chum landings depressed market prices. Lower pricesresulted in decreased demand as manyJapanese consumers saw the low-pricedand abundant product as an undesirablegift item. One Japanese wholesaler believes that Japanese consumers mayswitch from chum to sockeye as a giftitem if there is an over-supply of chumin the future, since sockeye is not onlymore expensive, but is also thought tobe a better tasting, fattier salmon withredder flesh.
Sockeye and pink salmon are alsopopular in Japan. Sockeye is the species
IMPORTS108,500 t
1983
SUPPLY: 274,500 IEXPORTS: -900 t
NET: 273,600 t
Domestic Markets
Salmon is popular in the Japanesediet, especially as a holiday gift item.Consumption was minimal before 1960,however, and limited mainly to northern Japan where the fish were caught.Since then, salmon consumption has increased throughout Japan owing topopulation growth, extensive advertising, fluctuating supplies of other fishery products, and an increase in percapita income. Observers forecast thatthe Japanese salmon consumption willexpand if prices do not increase significantly.
Japan's salmon market was over-supplied in 1983 by record coastal catchesand large imports. This depressed salmon prices and, in some instances, re-
Japan's coho production increasedfrom 72 t in 1978 to 2,900 t in 1983(Table 2) and all was consumed domestically. Japanese companies expected toharvest 4,500 t of farmed salmon in1984 and as much as 8,000 t by 1990.More than half of the 1984 harvest willbe produced by the Nichiro company(2,500 t), followed by Taiyo (1,000 t),Nichimo (500 t), and various smallercompanies (500 t). The Japanese Government does not offer financial incentives to salmon farmers as they do toprivate salmon hatchery operations, andapparently prefers to "let the marketdecide."
COAST AL CATCH123,500 I
HIGHSEAS CATCH42,500 I
1974
COASTAL CATCH39,200 I
SUPPL Y: 134,400 tEXPORTS: -13,100 I
NET: 121,300 I
HIGHSEAS CATCH86,900 I
($421/t). The Japanese Finance Ministryhas criticized this fee because the Japanese fishing industry pays only 55percent of it, while the remaining 45percent is subsidized through the JFAbudget.
Cage Culture
Japanese fish farmers raise only thecoho or silver salmon in ocean cages.Salmon farming began in 1973 when 1million coho eggs were imported fromthe United States for experimental freshwater culture. Japanese pen-farmingoperations switched to ocean-cage farming in 1975 because the salmon had aslow growth rate in fresh water.
Mejika "Ocean bright" salmon taken in the highseas catch; mean is firm, skin color ishealthy.
Ginke "Silver bright" salmon taken in the coastal catch; meat is firm, skin color is healthy.
Buna "A" "Dark salmon" taken in the coastal catch;color of skin and flesh is slightly changed.
Buna "B" "Dark salmon" taken in the coastal catch;skin and flesh colors have darkened.
Buna "C" "Dark salmon" taken in the coastal catch.This is the darkest colored chum in thecoastal catch.
River Buna "River dark" salmon taken in rivers (inlandcatch); these are salmon taken just priorto spawning.
Marked Damaged or wounded chum salmon.
Table 5.-The seven Japanese chum salmon gradings,after W. C. Alkinson (1984), "The Japan Salmon Markelwilh Emphasis on Ihe Markel lor Kolzebue ChumSalmon").
80 Marine Fisheries Review

Table 7.-Japan·s salmon Imports by commodity and country, 1977-84.
1979 1980 1981
imports (t)
74 6 382 29
6 6 428
253
517969
1984
92,978
80,2715,1782,4131,6611,9821,363
110
1,357
1,27278
7
1983
97,848
86,6693,8373,6871,1881,928
254283
245
20633
6
1,5011.362
64573
1982
93.06310,834
107,478
3,002359
2,54665
495
71,341
60,2125,157
14
1,6746
1,9911
39,331
33,0192,641
80
1.38225
43915
54.618
48,0304.720
32
27
42
15
1978
40,8337.053
51,808
7
49.738
5
34
50
55
1977
19,279
14,8343,706
31662
12
Subtotal
Subtotal
FreshUnited StatesNorwayOther countries
FrozenUnited StatesCanadaTaiwanNorth KoreaSouth KoreaU.S.S.R.Other countries
Commodityand country
1974 1975 1976 1977 1978 1979 1980 1961 1982 1983
,00
60
Figure 2.-Japan's salmon importsand exports (product weight), 197483.
, EXPORTS-'-'-'-. .- _._~_.
'0
40
20 ....._.--,
120
CuredUnited StatesCanadaNorth Korea
7121
17
695563
10
1 "Sujiko" is cured roe in the skein. "Ikura" is cured roe separated from the skein.'Japan's canned salmon imports were only available from January through November 1984.310lals may not agree because of rounding.
forecast that Japan's 1984 imports offrozen salmon would be 70,000-75,000t, a 30 percent drop from 1983 imports,which would adversely impact manyU.S. salmon exporters,
Japan imports more salmon from theUnited States than from any other country (Table 7). Their 1983 imports totaled over 96,000 t, and accounted for 90percent of Japan's total salmon importsby quantity. Frozen salmon was thelargest commodity imported (86,700 t),followed by salmon roe (8,175 t), freshsalmon (1,272 t), and canned salmon (93t) .
The United States was the largest sup-2FAO, "Infofish Trade News" (84/11), 16 June1984,
ped into 1980, causing a 30 percentdecrease in salmon imports, Then, during 1981 and 1982, salmon importsincreased nearly 130 percent (from48,700 t to 117,700 t) as domestic demandincreased,
In 1983, Japan's salmon imports againdecreased (to 108,500 t) as a result ofthe record domestic catch, This 1983"glut" also depressed Japan's salmonprices 30-40 percent in the wholesalemarket, and by 20 percent in the retailmarket. Preliminary FAO estimates2
26
5
'202
9,206
8,54462933
192
20137
414
1,268
103,933
145
277
8,098648
36
8,782
9311765
2
82
774
108,491
2
negI.
321
2negl.
12111287
1
9.637
8,596982
59
117,685
9,5091,190
33
102
10,732
50negI.
31
8,600
7,4031,154
43
76 54 13
50989
1,547 345 294390 415 203232 29 61
1 1 3
2,170 790 561
6.799983
9
7,791
64,736 48,789 83,142
352
177
6.3191,474
10
7,803
804
325
121 61
214 21360 1
1 60negl. negl.
6,682
275 274
5,5541,110
18
26,412 57,918
Cured' (ikura)United StatesCanadaChinaOther countries
Subtotal
Subtotal
Subtotal
Subtotal
CannedUnited StatesU.S.S.R.CanadaOther countries
Grand total'
RoeCured' (sujiko)
United StatesCanadaOther countries
most imported, while the pink accountsfor Japan's second-largest salmon catch.Both species are favored by Japanesebuyers who prefer that fish be landed orimported in the "princess cut" style(head-on) so quality-conscious consumers can better evaluate it for eyeclarity and proper handling.
Trade
Before 1'J77, Japan exported more salmon than it imported. Since then, however, increasing demand (especially forspecies less harvested by Japanese fishermen), combined with declining highseas catches, have greatly increasedsalmon imports (Fig. 2, Table 2), i.e.108,500 t were imported vs. 900 t exported in 1983.
Imports
Japan's salmon imports (primarilyfrozen) increased from 8,300 t in 1'J74to 108,500 t in 1983, largely owing tothe high-seas catch decline, growth insalmon demand by increasingly affluentconsumers, and fluctuating exchangerates. For example, 1'J78 salmon importsmore than doubled from 1'J77 becausea strong yen made U.S. salmon purchases less expensive. Also, Japaneseimporters were concerned about futuresalmon supplies which seemed uncertain after the Soviet Union reducedJapan's salmon catch quota 32 percent(20,100 t).
As a result of the increased imports,Japan accumulated large inventories offrozen salmon in 1'J79, which overlap-
47(3), 1985 81

Table 8.-.Japanese imports 01 salmon products Irom the United States, by species, 1977-84.
Imports (I)
Species 1977 1978 1979 1980 1981 1982 1983 1984
Sockeye N/A' N/A N/A N/A 42,387 55,226 71,664 56,468Chum N/A N/A N/A N/A 6,564 8,251 6,069 6,261Chinook N/A N/A N/A N/A 2,548 1,432 2,465 1,172Pink N/A N/A N/A N/A 1,061 12,876 1,556 10,167Other2 N/A N/A N/A N/A 16,303 22,503 12,729 11,920
Total' 15,594 41,418 44,596 30,914 68,863 100,288 94,483 85,988
,N/A = Not available.2Unidentified salmon species; includes canned and filleted products and salmon roe.'U.S. and Japanese Irade statistics do not agree (Le., 1983 U.S. Departmenl of Commerce tradestatistics indicate thallhe U.S. exported 94,4831 of salmon to Japan; Japanese trade slalislics, however,showed U.S. exports of 96,217 tl.
however, upon Japan's domestic demandfor salmon. Some observers believe thatJapanese consumers are developing agreater affinity for U.S. sockeye over thetraditionally favored chum. Salmonprices will also influence U.S. exports,since the typical Japanese consumer isprice-conscious about seafood.
Japan's salmon catches (both coastaland high-seas) will also influence U.S.exports. Furthermore, if Japan's highseas salmon quota is reduced in thefuture, U.S. salmon exports would probably increase. (Source: IFR-84179B.)
Table 1.-Mexico's fish catCh,recent and projected (1938).
Status of Mexico'sFisheries, 1983-84
Mexico's Fisheries Secretary PedroOjeda Paullada has announced that theMexican Government's goal is to morethan double the 1983-84 fisheries catchof 1.1 million metric tons (t) (data adjusted for the period 1 Sept.-31 Aug.)to 2.5 million t by 1988. While the1983-84 harvest was less than in previous years (Table 1), the apparent decline probably reflects more accuratestatistical reporting and the lingeringresults of the of the 1982-83 El Nino onthe important Pacific Coast small pelagic fisheries. Secretary Ojeda's remarkscame in a late 1984 briefing of theMexican Congress on the status of thefisheries.
Mexico has a mixed economy and thethree major economic sectors (private,cooperative, and public) each play animportant role in the fishing industry.The private sector takes the largestquantity of fish, about 66 percent during 1983-84. Most of the private catch
plier of fresh salmon to Japan in 1983,accounting for 1,272 t, or 93.8 percentof the total (Table 7). Norway was thesecond largest supplier (but of Atlanticsalmon, Salmo salar) , providing 77.5 t,or 5.7 percent of the total. PreliminaryJapanese trade statistics through May1984 indicated that Norway had alreadyexported almost 94 t of fresh Atlanticsalmon to Japan, 20 percent more thanin 1983. Observers believe that Norway's farmed Atlantic salmon exports toJapan will continue to compete withU.S. fresh Pacific salmon exports.
Sockeye or red salmon has been theleading U.S. species imported by Japanin recent years (Table 8). In 1983, thesockeye accounted for over 75 percentby quantity and 70 percent by value ofU.S. salmon shipments to Japan.
U.S. salmon exporters were not greatly affected by Japan's record salmonhatchery returns in 1983. U.S. shipmentstotaled over 96,000 t in 1983, a declineof only 5 percent from the nearly102,000 t exported in 1982 (Table 7).This is because Japan released and harvested mostly chum salmon and notsockeye salmon-the primary U.S. export species.
Concern among U.S. salmon exporters may develop, however, if Japan expands hatchery efforts on sockeye salmon. In 1983, the JFA released 61,000sockeye fry, and observers reported thatthe JFA planned to hatch and release100,000 sockeye fry by 1985. If the sockeye returns are successful, the JFA mayincrease such releases in the future.
Exports
Japan enjoyed a favorable balance of
trade in salmon products until 1976(Table 2). However, salmon product exports have since declined (Fig. 2),especially in 1977 after the Sovietsdecreased Japan's high-seas catch quota.Expanded domestic salmon demand inrecent years also contributed to the export reduction.
Both in 1982 and 1983, Japan exported less than 1,000 t of salmon products.However, Japanese trade statisticsthrough May 1984 indicated that Japan'searly 1984 salmon exports (1,000 t) hadalready exceeded 1983 exports, whichobservers indicate was due to the 1983over-supply of salmon on the Japanesemarket.
Conclusions
The factors which continue to influence Japan's salmon supply include: 1)Coastal (hatchery-produced) chumcatches, 2) salmon imports, and 3) highseas catches. Japan must carefullybalance these factors to meet the domestic demand while not over-supplying themarket (as in 1983).
The high-seas catch represents anespecially difficult problem since it depends on annual bilateral quota agreements with the Soviet Union. Japan hastried to convince Soviets to agree to along-term salmon agreement that wouldassure economic stability for Japanesehigh-seas salmon fishermen and alsoassure domestic markets a specifiedportion of the total salmon supply forseveral years. So far the Soviets havebeen unwilling to agree to this proposal.
Japan will remain the largest foreignmarket for U.S. salmon exports. Theamount of U.S. exports will depend,
Year'
197519761977197819791980198119821983-842
1988
'Calendar year.2Sept.-31 Aug.
Catch (1,000 tl
467.5526.3610.8702.6877.0
1,243.61,564.81,506.01,100.02,500.0
82 Marine Fisheries Review

is small pelagic species which are reduced to fishmeal and oil. The cooperative sector only takes 25 percent of thecountry's fisheries catch, but becausethat includes shrimp, lobster, abalone,and other valuable species, the cooperatives account for the largest share ofthe catch value. The publicly ownedstate companies only account for about9 percent of the catch in terms of quantity, but almost all is of edible species,and as a result state companies play animportant role in supplying foodfish tothe domestic market. The Secretariat ofFisheries (SEPESCA) hopes to morethan double the catch of the state corporations by 1988. The state companiesalso playa critical role by helping thecooperatives export their shrimp catchto the United States and other foreignmarkets.
The state companies, Productos Pesqueros Mexicanos (PPM) and IndustriasPesqueras Paraestatales del Noroeste(IPPN) play a more important role inprocessing the country's catch. Mexicohas 421 processing plants. Most areoperated by private companies which,combined, process about 57 percent ofMexico's catch. Even so, the state companies operate the largest and mostmodem plants, processing about 42 percent of the total catch, but a much largerportion of edible species. The proportion of the catch processd by the statecompanies should increase sharplywhen PPM has its large new plants atLerma (Campeche) and Topolobampo(Sonora) operating at full capacity.Cooperative plants only account forabout 1 percent of production, processing almost entirely shellfish. In recentyears, SEPESCA has experimented withjoint ventures, allowing both private investors and cooperatives to participatein some of the PPM and IPPN projects.
The Secretary commented on therecord 90,000 t 1983-84 shrimp catch,which he said demonstrated the validity of the Government's cooperativepolicy. Some observers, however, believe that climatic conditions may havebeen even more important. He alsostressed that the country's fisheriescatch would have been much higher hadnot the El Nino event affected PacificCoast small pelagic fisheries.
47(3), 1985
The Secretary gave special attentionto freshwater fisheries and aquaculture.The 1983-84 aquaculture and freshwaterfisheries catch totaled 122,000 t, mostlytilapia, carp, catfish, trout, oyster, andfreshwater shrimp. SEPESCA hopes totriple production to nearly 390,000 t by1988. Mexico currently has 33 aquaculture centers and 4 hatcheries producingfry and postlarval shellfish.
Secretary Ojeda also reviewed manyof the special initiatives of the currentAdministration, discussing administrative decentralization, intersectorial coordination, scientific investigation,training, finances, and simplifying government regulations. (Source: IFR84/95.)
The U.S. Regional Fisheries Attachein Mexico City has also prepared a9-page report on the Mexican fishing industry, including statistical appendicesand a list of fishery cooperatives. Thereport can be purchased for $13.00 byordering report PB85-114189 fromNTIS, 5285 Port Royal Road, Springfield, VA 22161.
Japan and Chinato Produce Clams
Plans were announced earlier thisyear for two Japanese companies to process short-necked clams in China andimport the market-ready products andsell them under an agreement of compensatory trade later in 1985. The clamswere to be produced at a freezer factoryin Lianoning Province in northeasternChina, with the two Japanese companiesfurnishing processing equipment andnecessary materials and technology for
Note: Unless otherwise credited, materialin this section is from either the ForeignFishery Information Releases (FFIR) compiled by Sunee C. Sonu, Foreign Reporting Branch, Fishery Development Division, Southwest Region, National MarineFisheries Service, NOAA, Terminal Island, CA 90731, or the International Fishery Releases (IFR) produced by the Officeof International Fisheries Affairs, NationalMarine Fisheries Service, NOAA, Washington, DC 20235.
the vacuum sealing and heat sterilization methods. The clams were to bepacked in 300 g packages and initialproduction was expected to be over 50t per month.
Mexican ShrimpingCosts, 1985
The U.S. Regional Fisheries Attache(RFA) in Mexico City, Charles Finan,has obtained a report from the MexicanFederation of Fishery Cooperativesassessing the costs of shrimp fishing inMexico (Table 1). The costs are basedon the operation of a 75-foot steel-hulledshrimp trawler, and the report is themost complete and up to date studyavailable on the cost of shrimp fishingin Mexico. It is estimated that it costsabout US$9.80 to produce and process1 kg of shrimp, but that does not includethe cost of the vessel or interest charges.These costs appear to be quite high, butinclude all payment to cooperativemembers. (Source: IFR-85/34)
Table 1.-Cos1 analysis1,2,3 of a Mexicanshrimp trawler (1 trip).
Cost inItem pesos (P)
Fixed costsDiesel Fuel (30.000 L) P984.000Lubricant (2 Barrels) 105.120Food 140,000Deck equipment 50,000Spare parts 50,000Freon, salt, ice 75,000Repairs
Fishing gear 50,000Electrical equipment 45,000Other equipment 110,000
Subtotal P1,609,120
Variable costsFreezing and packing 187,500Taxes (SPT-0.023) 71,875Export duty (1 percent) 31,250Commission to distributor
(7.5 percent) 234,375Transit and port charges 137,500Prepayment to members 585,930Administration 173,437Social Security 50,000Social quotas 50,000
Subtotal P1,503.117
Total cosUtrip P3,112,237
'As of 28 May 1985, the Mexican peso tradedfor P254 (floating rate) to the U.S. dollar.2Value of 1 kg of shrimp = P2,500.'Value of an average shrimp catch of 1,250 kg= P3,125,000.
83