The fisheries and aquaculture sector in France · Processing firms Trade page 19 Supply balance...
36
FISHERIES AND AQUACULTURE The fisheries and aquaculture sector in France > Key figures > EDITION april 2016 Les cahiers de Production Firms Trade Consumption
Transcript of The fisheries and aquaculture sector in France · Processing firms Trade page 19 Supply balance...
FISH
ERIE
S A
ND
AQ
UA
CULT
UR
E
The fisheries and aquaculture sector in France
> K
ey fi
gure
s
> EDITION april 2016
Les cahiers de
ProductionFirmsTradeConsumption
SummaryProduction page 3Total sales of fisheries and aquaculture products
Sales of fisheries products at auction
Sales of aquaculture products
Fishing fleet
Aquaculture firms
Jobs
Firms page 15Fishmonger firms
Trading firms
Processing firms
Trade page 19Supply balance
Imports and exports by main species
Imports and exports by presentation
Imports and exports by species group
Imports and exports by geographical area
Consumption page 25Supply balance
Households purchases
Catering purchases
Breakdown of purchases by distribution channel
Les cahiers de FranceAgriMer / The fisheries and aquaculture sector in France / edition 2016 / FranceAgriMer / 12 rue Henri Rol-Tanguy / TSA 20002 / 93555 Montreuil cedex / tél. : +33 1 73 30 30 00 / www.franceagrimer.fr / Directeur de la publication : Éric Allain / Redaction : unité Produits animaux, pêche et aquaculture / Conception and realisation : service Communication FranceAgriMer, studio PAO / N° ISSN 2259-9177 Crédits photos : Institut Maritime de la Prévention, Lionel Flageul - Normapêche Bretagne, Institut des milieux aquatiques, Thierry Guigue, FranceAgriMer / Droits réservés
Production
Les cahiers de FranceAgriMer 2016 / Key figures / FISHERIES AND AQUACULTURE. /3
fishing fleet / aquaculture firms / jobs total sales of fisheries and aquaculture products
>
4/ Fisheries and aquaculture sector in France > EDITION april 2016. © FranceAgriMer 2016 /
Production / landings and aquaculture
Total sales / metropolitan France and overseas territories
by method of production (tons) (3)
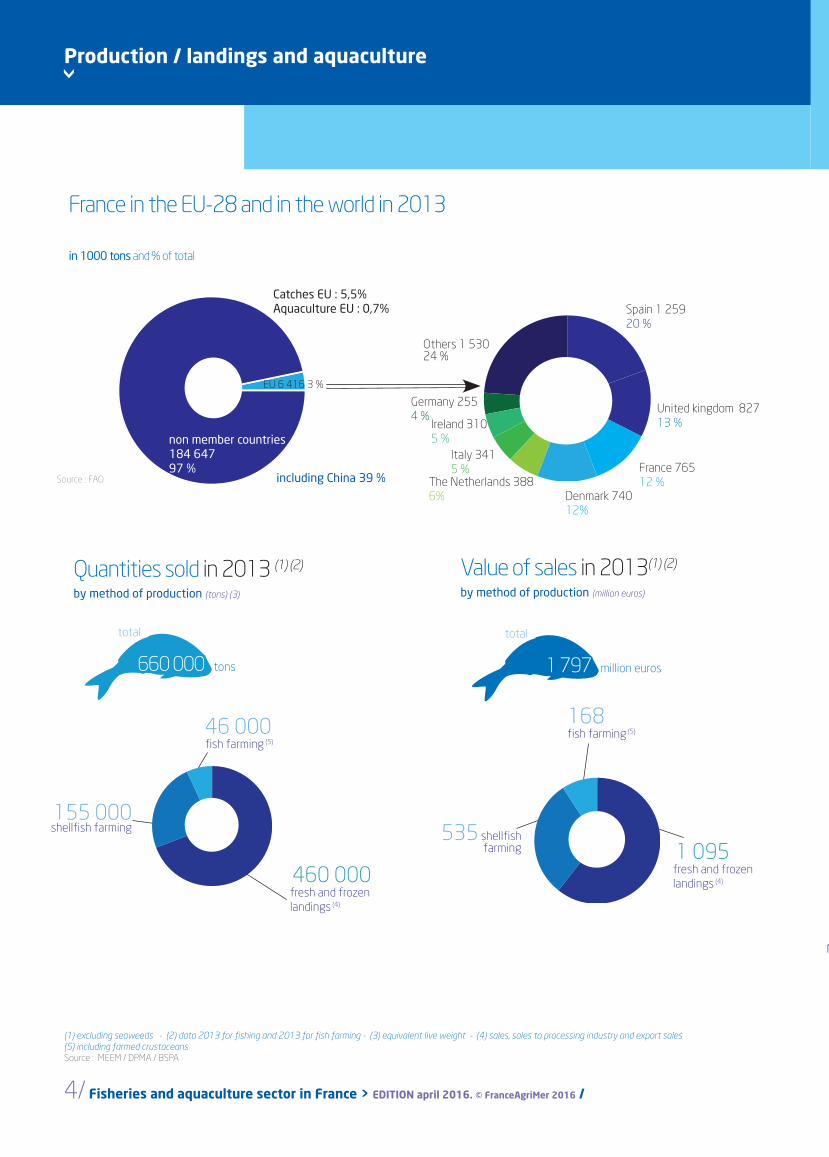
Quantities sold in 2013 (1) (2) Value of sales in 2013(1) (2)
by method of production (million euros)
total
1 797 million euros
total
660 000 tons
46 000fish farming (5)
155 000 shellfish farming
460 000 fresh and frozen landings (4)
168fish farming (5)
1 095 fresh and frozen landings (4)
535 shellfish farming
(1) excluding seaweeds - (2) data 2013 for fishing and 2013 for fish farming - (3) equivalent live weight - (4) sales, sales to processing industry and export sales(5) including farmed crustaceans Source : MEEM / DPMA / BSPA
Captures : 5,4 %Aquaculture : 1,5 %
Pays-tiers : 171 980
France in the EU-28 and in the world in 2013
in 1000 tons and % of total
Catches EU : 5,5%Aquaculture EU : 0,7%
non member countries 184 64797 %
EU 6 416 3 %
including China 39 %Source : FAO
Spain 1 259 20 %
United kingdom 82713 %
Denmark 740 12%
The Netherlands 3886%
Others 1 53024 %
France 76512 %
Italy 3415 %
Ireland 310 5 %
Germany 2554 %
212527283236
577276
8697
113132
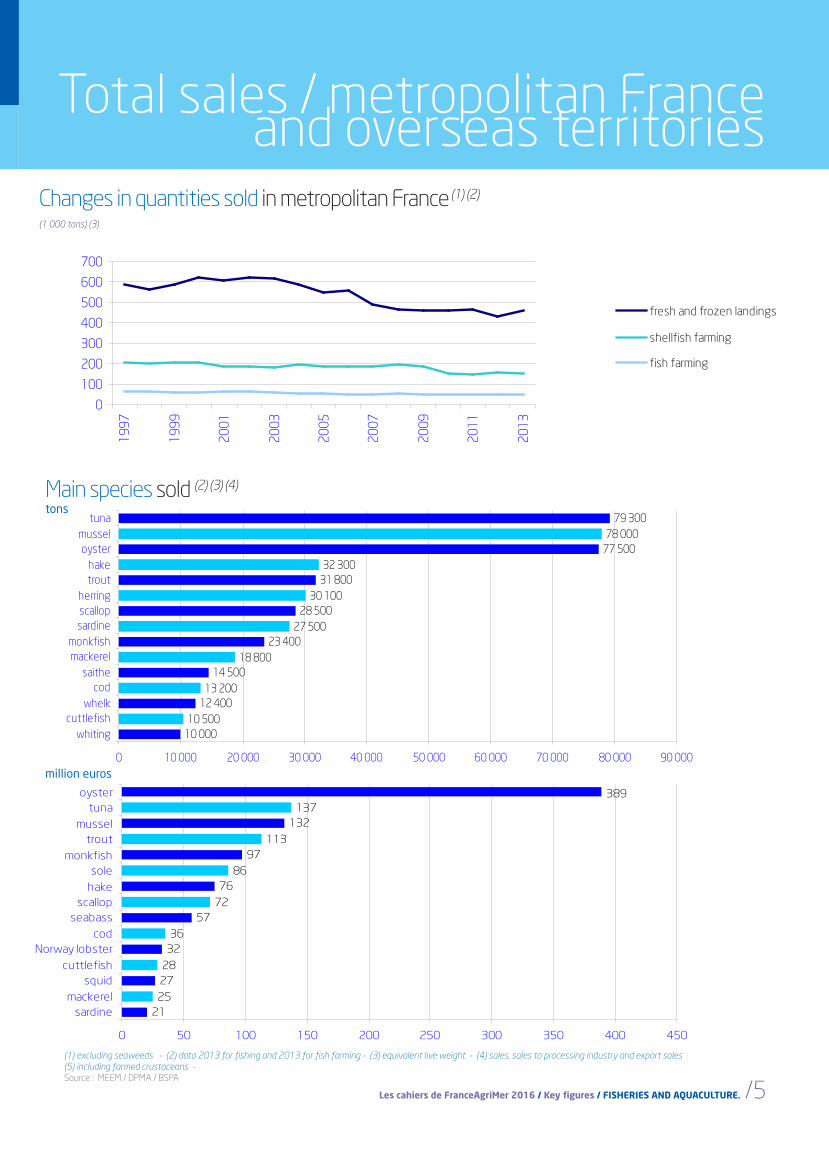
137389
0 50 100 150 200 250 300 350 400 450
sardinemackerel
squidcuttlefish
Norway lobstercod
seabassscallop
hakesole
monkfishtrout
musseltuna
oyster
Les cahiers de FranceAgriMer 2016 / Key figures / FISHERIES AND AQUACULTURE. /5
0
100
200
300
400
500
600
700
1997
1998
1999
2000
2001
2002
2003
2004
2005
2006
2007
2008
2009
2010
2011
2012
2013
fresh and frozen landings
shellfish farming
fish farming
Total sales / metropolitan France and overseas territories
Value of sales in 2013(1) (2)
Main species sold (2) (3) (4)
tons
(1) excluding seaweeds - (2) data 2013 for fishing and 2013 for fish farming - (3) equivalent live weight - (4) sales, sales to processing industry and export sales(5) including farmed crustaceans - Source : MEEM / DPMA / BSPA
Changes in quantities sold in metropolitan France (1) (2)
(1 000 tons) (3)
million euros
France 76512 %
0
100
200
300
400
500
600
700
1997
1999
2001
2003
2005
2007
2009
2011
2013
fresh and frozen landings
shellfish farming
fish farming (4)
10 00010 500
12 40013 200
14 50018 800
23 40027 500
28 50030 100
31 80032 300
77 50078 000
79 300
0 10 000 20 000 30 000 40 000 50 000 60 000 70 000 80 000 90 000
whitingcuttlefish
whelkcod
saithemackerelmonkfish
sardinescallopherring
trouthake
oystermussel
tuna
212527283236
577276
8697
113132
137389
0 50 100 150 200 250 300 350 400 450
sardinemackerel
squidcuttlefish
Norway lobstercod
seabassscallop
hakesole
monkfishtrout
musseltuna
oyster
>
6/ Fisheries and aquaculture sector in France > EDITION april 2016. © FranceAgriMer 2016 /
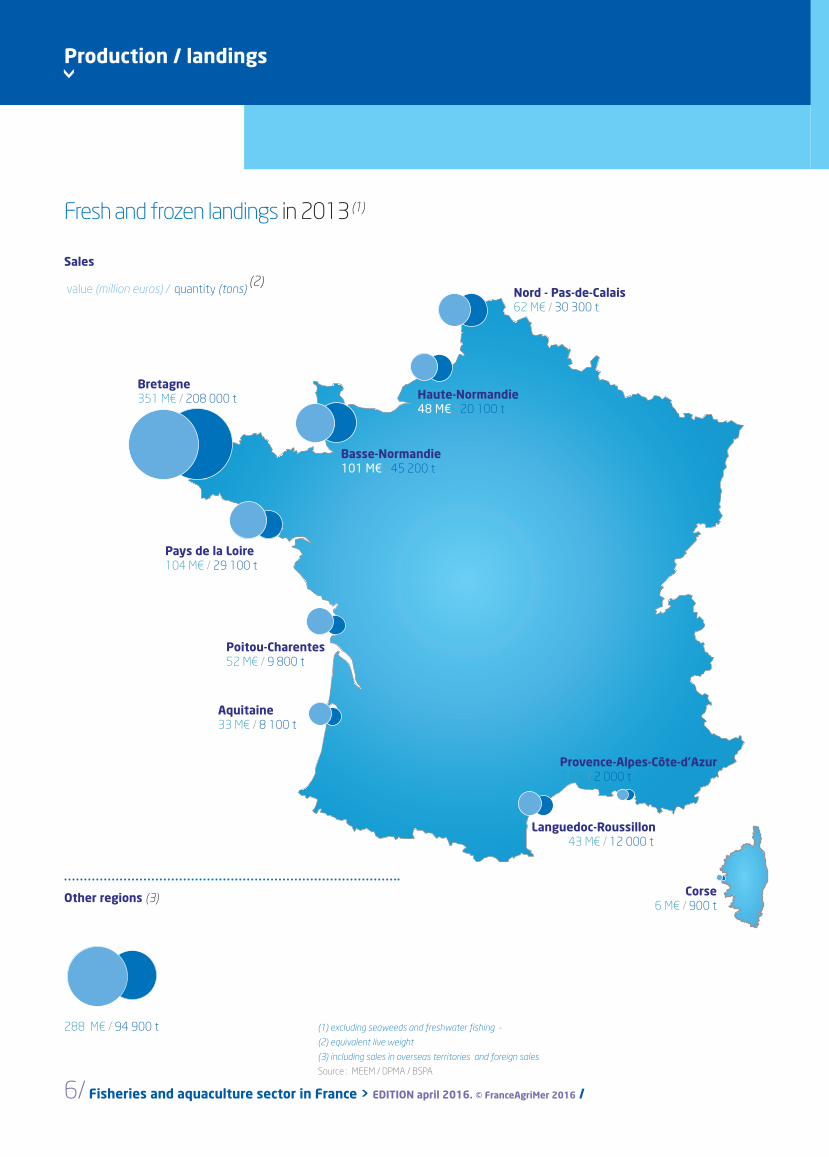
Production / landings
Fresh and frozen landings in 2013 (1)
Sales
value (million euros) / quantity (tons) (2)
Other regions (3)
288 M¤ / 94 900 t
Nord - Pas-de-Calais62 M€ / 30 300 t
Haute-Normandie 48 M€ / 20 100 t
Basse-Normandie101 M€ / 45 200 t
Bretagne351 M€ / 208 000 t
Pays de la Loire104 M€ / 29 100 t
Poitou-Charentes52 M€ / 9 800 t
Aquitaine33 M€ / 8 100 t
Languedoc-Roussillon 33 M€ 43 M€ / 12 000 t
Provence-Alpes-Côte-d’Azur7 M€ / 2 000 t
Corse6 M€ / 900 t
(1) excluding seaweeds and freshwater fishing -
(2) equivalent live weight
(3) including sales in overseas territories and foreign sales
Source : MEEM / DPMA / BSPA
Les cahiers de FranceAgriMer 2016 / Key figures / FISHERIES AND AQUACULTURE. /7
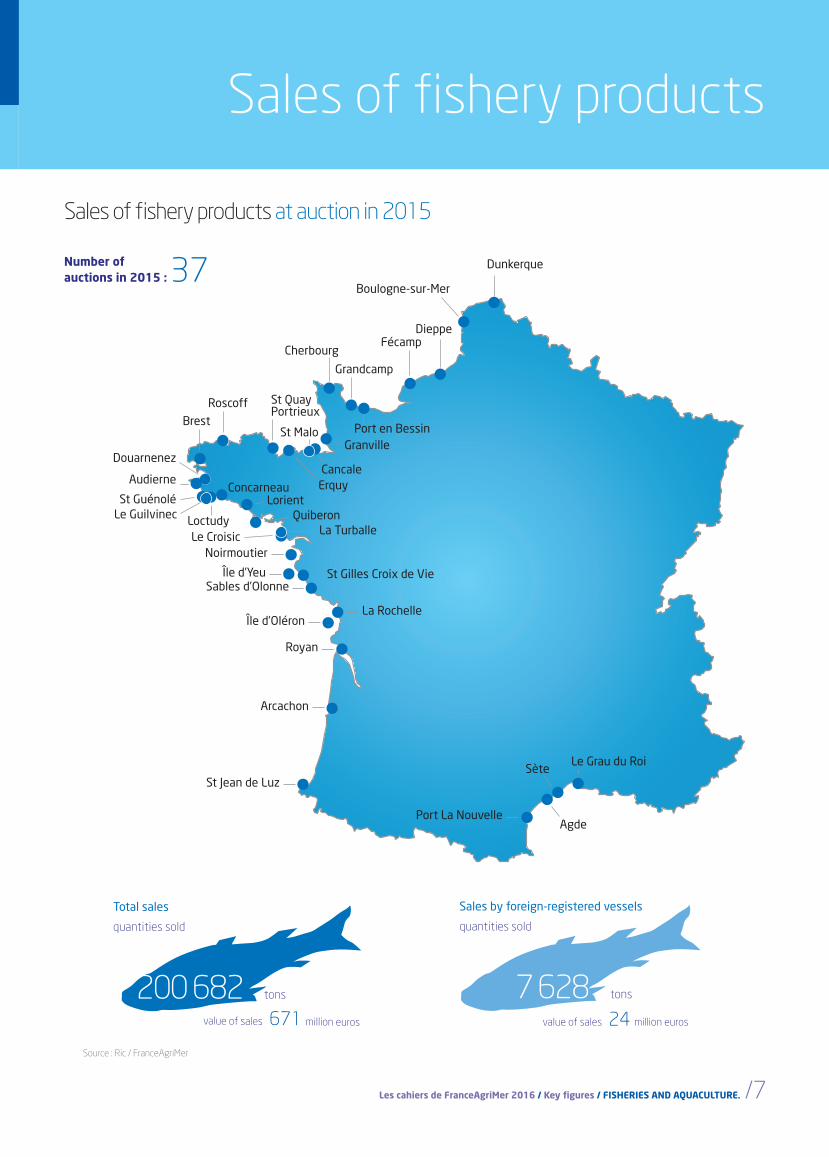
Sales of fishery products
Sales of fishery products at auction in 2015
Source : Ric / FranceAgriMer
Number of auctions in 2015 : 37
Douarnenez
Audierne
St GuénoléLe Guilvinec
Dunkerque
Boulogne-sur-Mer
DieppeFécamp
Grandcamp
St Quay Portrieux
Roscoff
BrestPort en Bessin
ErquyConcarneau
Granville
Cancale
Cherbourg
St Malo
Île d’Yeu
La Rochelle
St Gilles Croix de Vie
La Turballe
Agde
SèteLe Grau du Roi
LorientQuiberon
Sables d’Olonne
Île d’Oléron
Royan
Arcachon
St Jean de Luz
Port La Nouvelle
NoirmoutierLe Croisic
Loctudy
value of sales 671 million euros
Total sales
quantities sold
200 682 tons
value of sales 24 million euros
Sales by foreign-registered vessels
quantities sold
7 628 tons
>
8/ Fisheries and aquaculture sector in France > EDITION april 2016. © FranceAgriMer 2016 /
Sales of fishery products
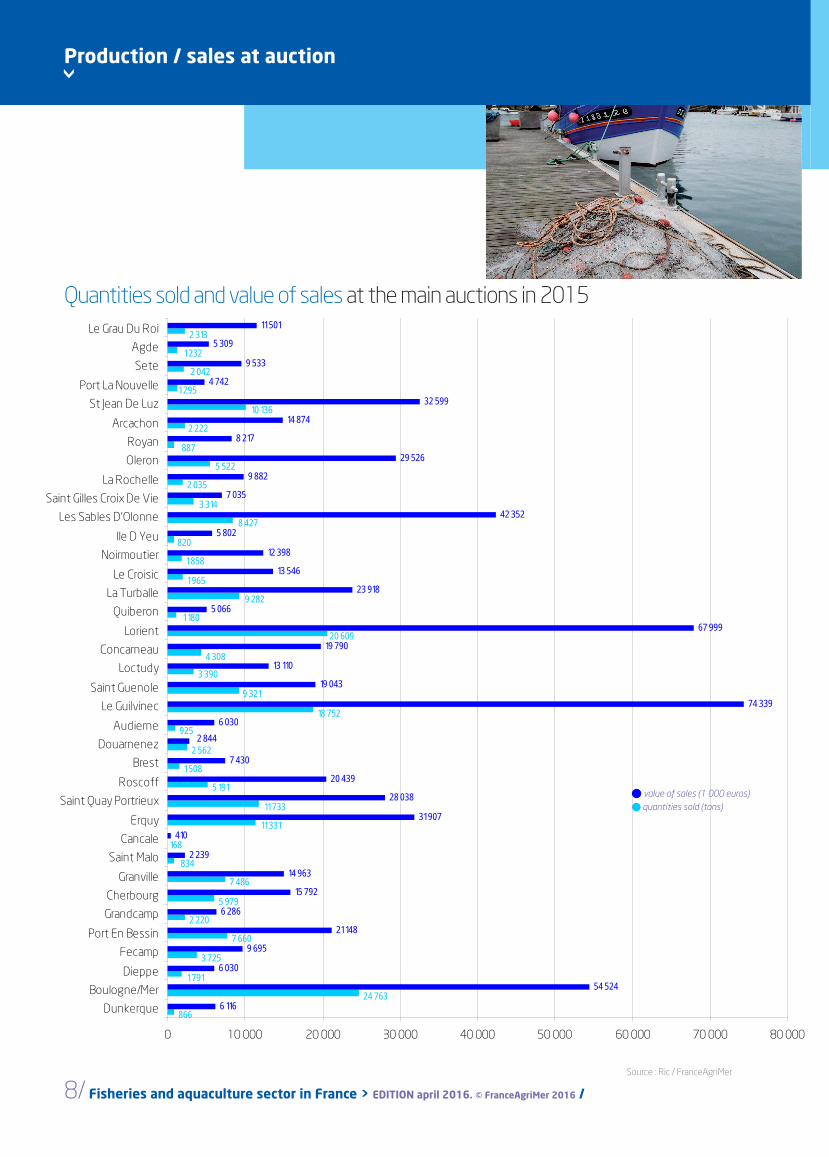
Source : Ric / FranceAgriMer
Quantities sold and value of sales at the main auctions in 2015
value of sales (1 000 euros) quantities sold (tons)
> Production / sales at auction
6 116
54 524
6 030
9 695
21 148
6 286
15 792
14 963
2 239
410
31 907
28 038
20 439
7 430
6 030
74 339
19 043
13 110
19 790
67 999
5 066
23 918
13 546
12 398
5 802
42 352
7 035
9 882
29 526
8 217
14 874
32 599
4 742
9 533
5 309
11 501
2 562
168
4 308
866
24 763
1 791
3 725
7 660
2 220
5 979
7 486
834
11 331
11 733
5 191
1 508
925
18 752
9 321
3 390
20 609
1 180
9 282
1 965
1 858
820
8 427
3 314
2 035
5 522
887
2 222
10 136
2 042
1 232
2 313
1 295
2 844
0 10 000 20 000 30 000 40 000 50 000 60 000 70 000 80 000
Dunkerque
Boulogne/Mer
Dieppe
Fecamp
Port En Bessin
Grandcamp
Cherbourg
Granville
Saint Malo
Cancale
Erquy
Saint Quay Portrieux
Roscoff
Brest
Douarnenez
Audierne
Le Guilvinec
Saint Guenole
Loctudy
Concarneau
Lorient
Quiberon
La Turballe
Le Croisic
Noirmoutier
Ile D Yeu
Les Sables D'Olonne
Saint Gilles Croix De Vie
La Rochelle
Oleron
Royan
Arcachon
St Jean De Luz
Port La Nouvelle
Sete
Agde
Le Grau Du Roi
124
522
1 180
2 268
1 967
2 673
3 971
15 942
9 536
21 430
19 419
103 039
718
4 084
6 509
6 054
12 934
16 438
17 502
30 639
23 035
66 388
97 078
314 738
0 50 000 100 000 150 000 200 000 250 000 300 000 350 000
miscancellous coastal gear
glass eel gear
pot and trap, hook
net and hook
hook exclusively
pot and trap exclusively
net, pot and trap
dredge
trawl and other gear
seine net
net exclusively
trawl exclusively
Les cahiers de FranceAgriMer 2016 / Key figures / FISHERIES AND AQUACULTURE. /9
Sales of fishery products
quantities sold (tons)
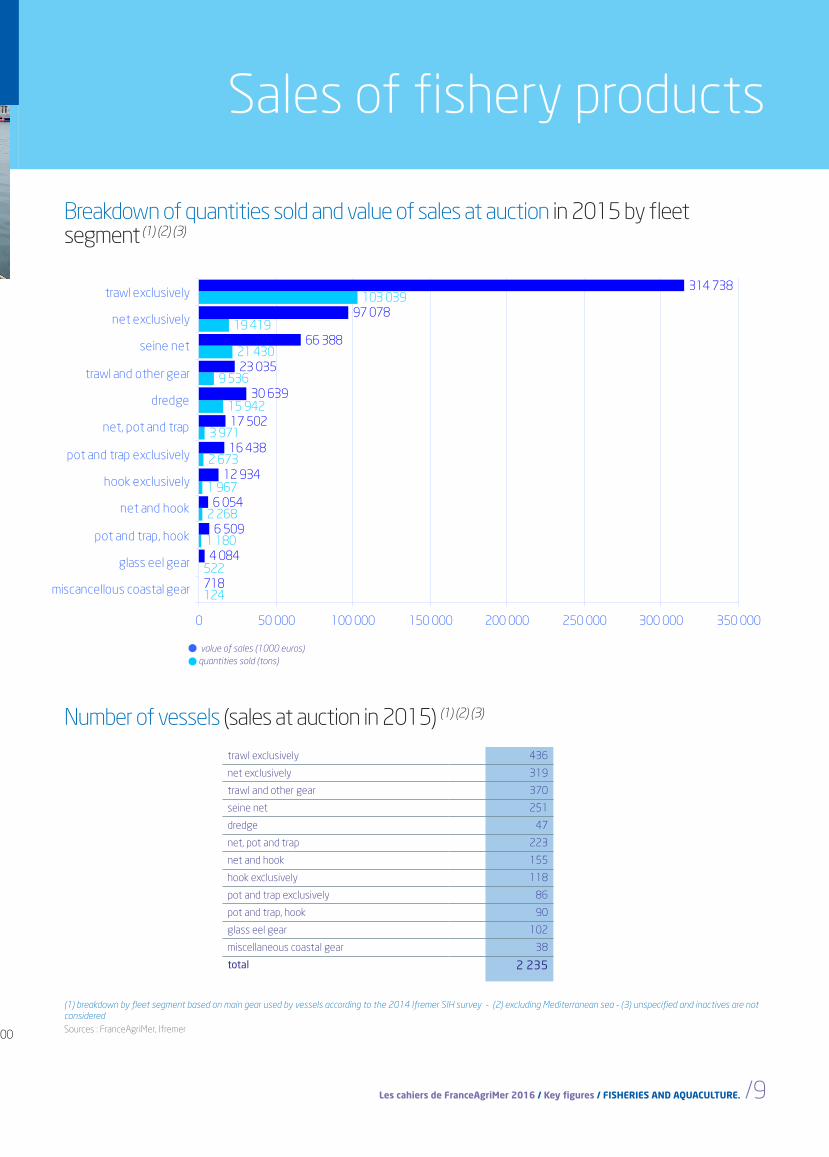
Breakdown of quantities sold and value of sales at auction in 2015 by fleet segment (1) (2) (3)
(1) breakdown by fleet segment based on main gear used by vessels according to the 2014 Ifremer SIH survey - (2) excluding Mediterranean sea - (3) unspecified and inactives are not considered
value of sales (1 000 euros) quantities sold (tons)
Number of vessels (sales at auction in 2015) (1) (2) (3)
trawl exclusively 436
net exclusively 319
trawl and other gear 370
seine net 251
dredge 47
net, pot and trap 223
net and hook 155
hook exclusively 118
pot and trap exclusively 86
pot and trap, hook 90
glass eel gear 102
miscellaneous coastal gear 38
total 2 235
Sources : FranceAgriMer, Ifremer
value of sales (1000 euros)
6 116
54 524
6 030
9 695
21 148
6 286
15 792
14 963
2 239
410
31 907
28 038
20 439
7 430
6 030
74 339
19 043
13 110
19 790
67 999
5 066
23 918
13 546
12 398
5 802
42 352
7 035
9 882
29 526
8 217
14 874
32 599
4 742
9 533
5 309
11 501
2 562
168
4 308
866
24 763
1 791
3 725
7 660
2 220
5 979
7 486
834
11 331
11 733
5 191
1 508
925
18 752
9 321
3 390
20 609
1 180
9 282
1 965
1 858
820
8 427
3 314
2 035
5 522
887
2 222
10 136
2 042
1 232
2 313
1 295
2 844
0 10 000 20 000 30 000 40 000 50 000 60 000 70 000 80 000
Dunkerque
Boulogne/Mer
Dieppe
Fecamp
Port En Bessin
Grandcamp
Cherbourg
Granville
Saint Malo
Cancale
Erquy
Saint Quay Portrieux
Roscoff
Brest
Douarnenez
Audierne
Le Guilvinec
Saint Guenole
Loctudy
Concarneau
Lorient
Quiberon
La Turballe
Le Croisic
Noirmoutier
Ile D Yeu
Les Sables D'Olonne
Saint Gilles Croix De Vie
La Rochelle
Oleron
Royan
Arcachon
St Jean De Luz
Port La Nouvelle
Sete
Agde
Le Grau Du Roi
124
522
1 180
2 268
1 967
2 673
3 971
15 942
9 536
21 430
19 419
103 039
718
4 084
6 509
6 054
12 934
16 438
17 502
30 639
23 035
66 388
97 078
314 738
0 50 000 100 000 150 000 200 000 250 000 300 000 350 000
miscancellous coastal gear
glass eel gear
pot and trap, hook
net and hook
hook exclusively
pot and trap exclusively
net, pot and trap
dredge
trawl and other gear
seine net
net exclusively
trawl exclusively
>
10/ Fisheries and aquaculture sector in France > EDITION april 2016. © FranceAgriMer 2016 /
0
100
200
300
400
500
600
700
800
900
20012002 20032004 20052006 20072008 20092010 20112012 20132014
cephalopodsbivalvescrustaceanstuna and small pelagicsother fish
Production / sales at auction
Sales of aquaculture products in metropolitan FranceSales of fishery products
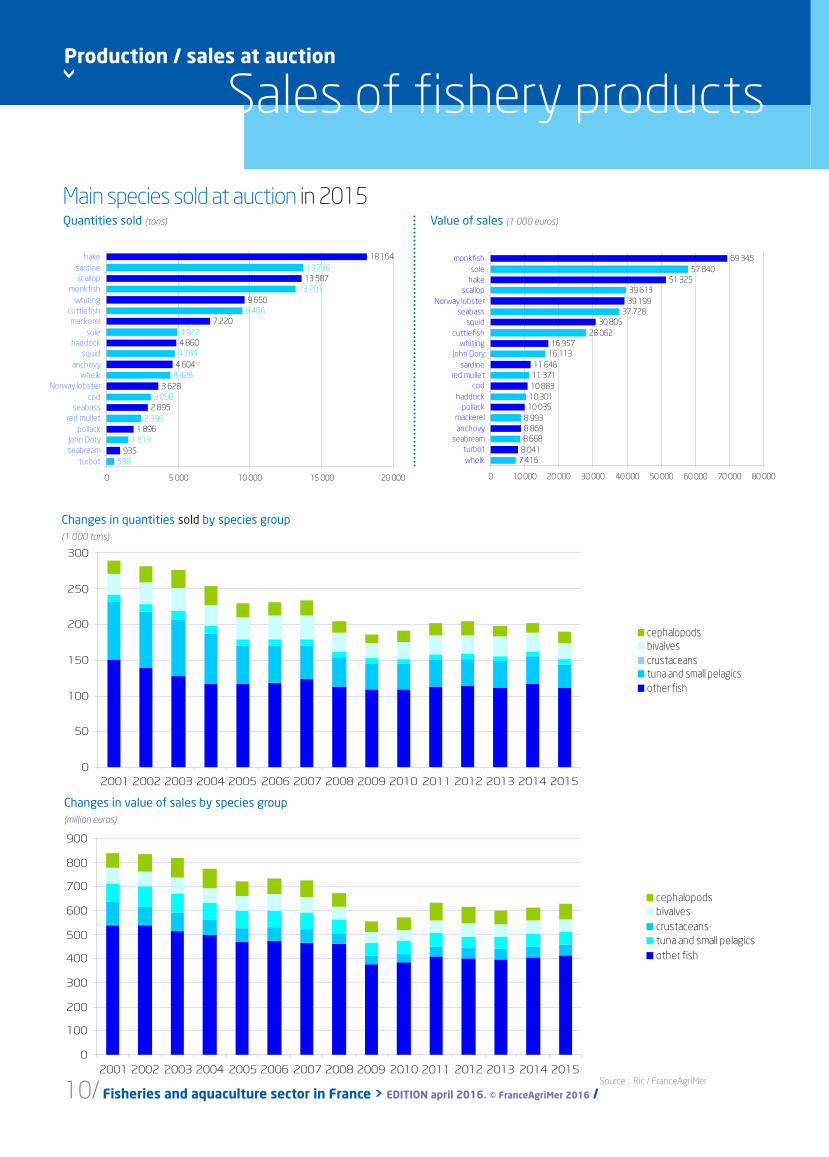
Main species sold at auction in 2015
Changes in quantities sold by species group (1 000 tons)
Changes in value of sales by species group (million euros)
Value of sales (1 000 euros)Quantities sold (tons)
Source : Ric / FranceAgriMer
mussel
74 138
0
50
100
150
200
250
300
350
20012002200320042005200620072008200920102011201220132014
cephalopodsbivalvescrustaceanstuna and small pelagicsother fish
0
100
200
300
400
500
600
700
800
900
2001 2002 2003 2004 2005 2006 2007 2008 2009 2010 2011 2012 2013 2014 2015
cephalopodsbivalvescrustaceanstuna and small pelagicsother fish
0
50
100
150
200
250
300
2001 2002 2003 2004 2005 2006 2007 2008 2009 2010 2011 2012 2013 2014 2015
cephalopodsbivalvescrustaceanstuna and small pelagicsother fish
935
1 896
2 895
3 628
4 604
4 860
7 220
9 650
13 587
18 164
538
1 513
2 396
3 098
4 426
4 784
4 922
9 466
13 201
13 736
0 5 000 10 000 15 000 20 000
turbotseabreamJohn Dory
pollackred mullet
seabasscod
Norway lobsterwhelk
anchovysquid
haddocksole
mackerelcuttlefish
whitingmonkfish
scallopsardine
hake
7 4168 0418 6688 8698 993
10 03510 30110 88311 37111 646
16 11316 957
28 06230 805
37 72839 19939 613
51 32557 840
69 345
0 10 000 20 000 30 000 40 000 50 000 60 000 70 000 80 000
whelkturbot
seabreamanchovymackerel
pollackhaddock
codred mullet
sardineJohn Dory
whitingcuttlefish
squidseabass
Norway lobsterscallop
hakesole
monkfish
Les cahiers de FranceAgriMer 2016 / Key figures / FISHERIES AND AQUACULTURE. /11
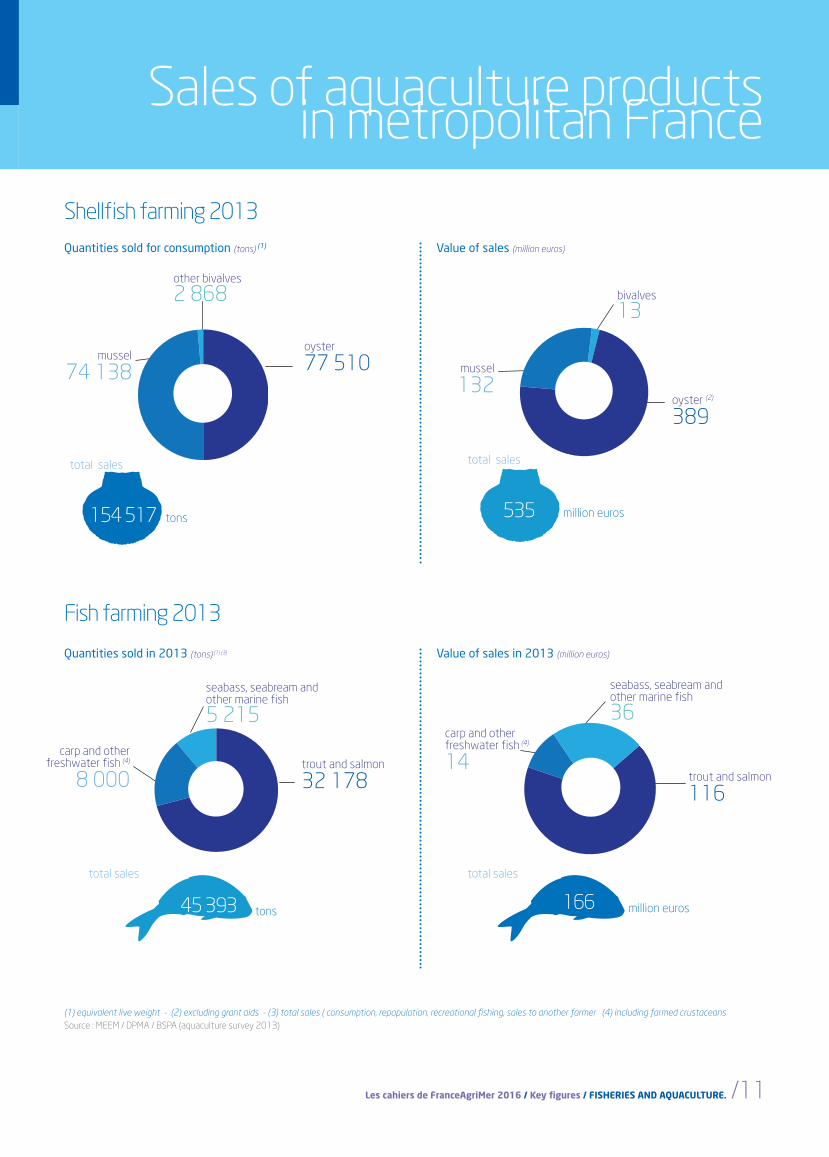
Sales of aquaculture products in metropolitan France
Shellfish farming 2013
Fish farming 2013
Quantities sold for consumption (tons) (1) Value of sales (million euros)
total sales
million euros
total sales
154 517 tons
Quantities sold in 2013 (tons) (1) (3) Value of sales in 2013 (million euros)
Source : Ric / FranceAgriMer
(1) equivalent live weight - (2) excluding grant aids - (3) total sales ( consumption, repopulation, recreational fishing, sales to another farmer (4) including farmed crustaceans
total sales
million euros
other bivalves
2 868
oyster
77 510mussel
74 138
bivalves
13
oyster (2)
389
mussel
132
seabass, seabream and other marine fish
5 215
trout and salmon
32 178
carp and other freshwater fish (4)
8 000
seabass, seabream and other marine fish
36
trout and salmon
116
carp and other freshwater fish (4)
14
Source : MEEM / DPMA / BSPA (aquaculture survey 2013)
total sales
45 393
535
166tons
>
12/ Fisheries and aquaculture sector in France > EDITION april 2016. © FranceAgriMer 2016 /
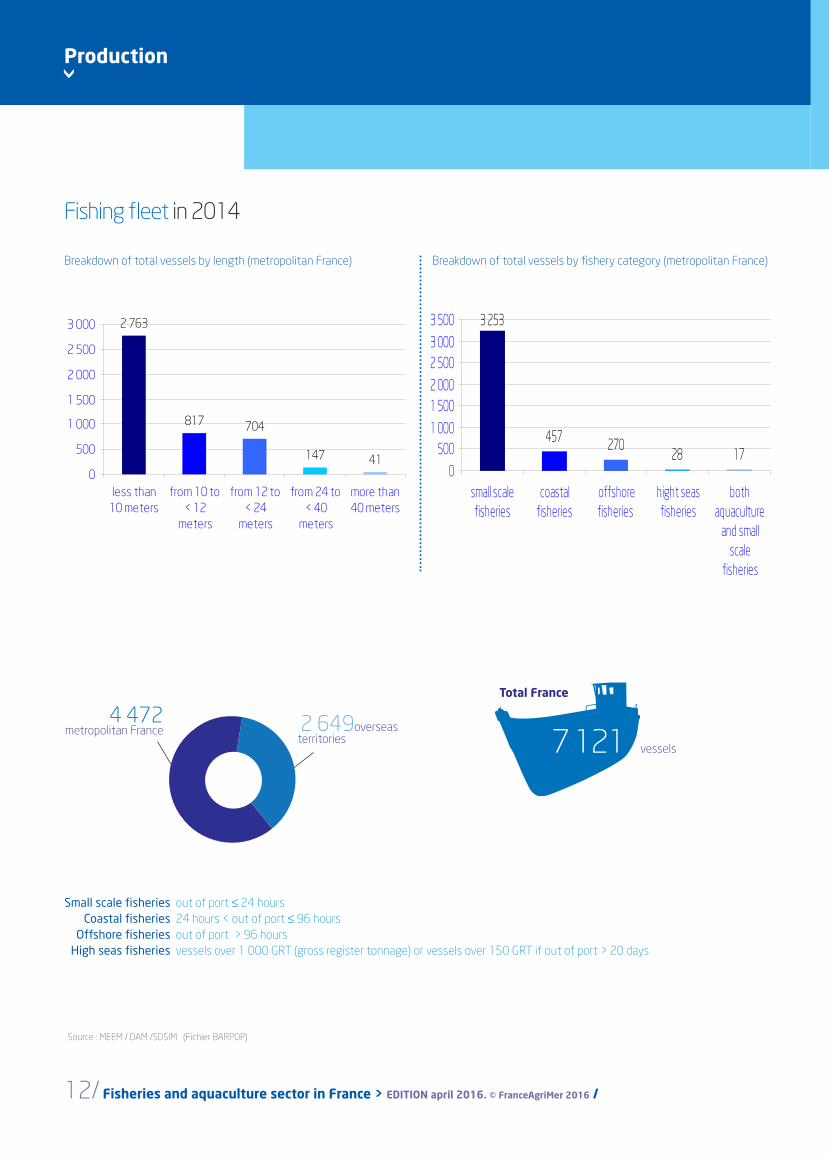
Fishing fleet / Aquaculture firmsProduction
Fishing fleet in 2014
Breakdown of total vessels by length (metropolitan France) Breakdown of total vessels by fishery category (metropolitan France)
Small scale fisheries out of port ≤ 24 hours Coastal fisheries 24 hours < out of port ≤ 96 hours Offshore fisheries out of port > 96 hours High seas fisheries vessels over 1 000 GRT (gross register tonnage) or vessels over 150 GRT if out of port > 20 days
Total France
7 121 vessels
Source : MEEM / DAM /SDSIM (Fichier BARPOP)
4 472metropolitan France 2 649overseas
territories
2 763
817 704
147 410
500
1 000
1 500
2 000
2 500
3 000
less than10 meters
from 10 to< 12
meters
from 12 to< 24
meters
from 24 to< 40
meters
more than40 meters
3 253
457 27028 17
0500
1 0001 5002 0002 5003 0003 500
small scalefisheries
coastalfisheries
offshorefisheries
hight seasfisheries
bothaquaculture
and smallscale
fisheries
Les cahiers de FranceAgriMer 2016 / Key figures / FISHERIES AND AQUACULTURE. /13
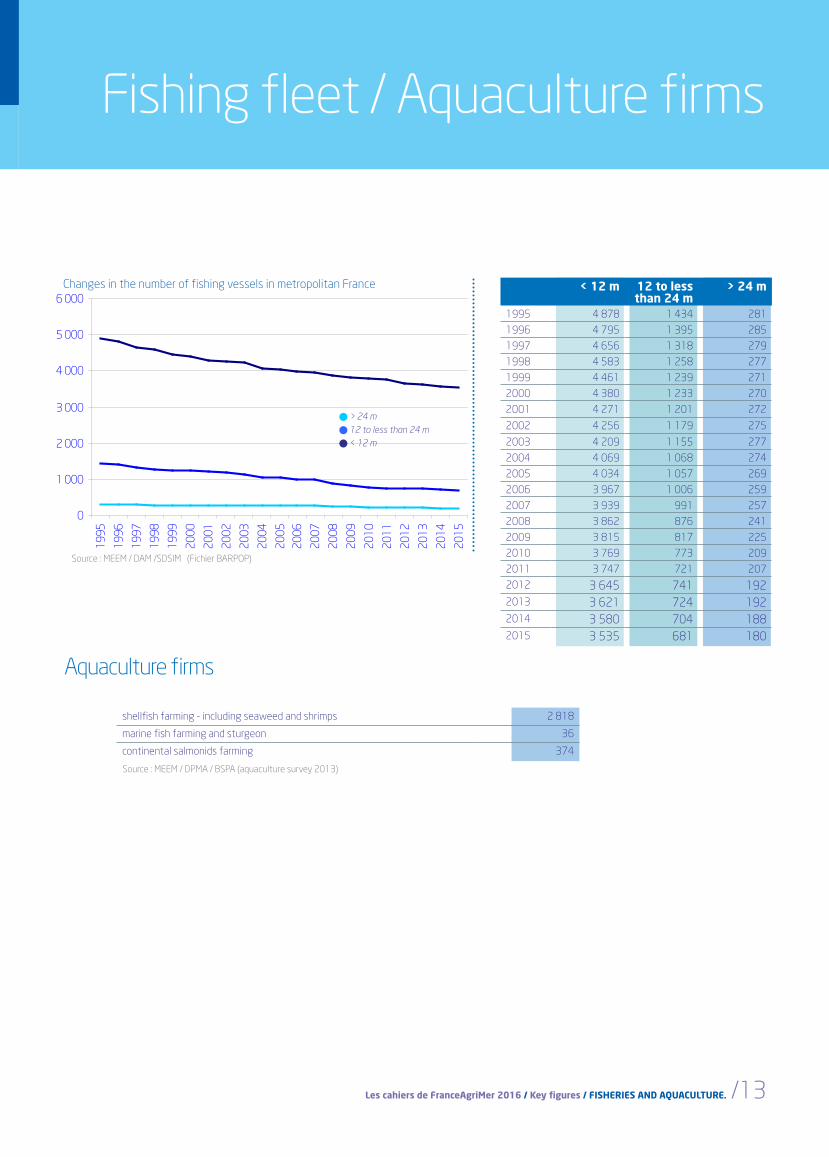
Fishing fleet / Aquaculture firms
Aquaculture firms
Breakdown of total vessels by fishery category (metropolitan France)
Changes in the number of fishing vessels in metropolitan France
shellfish farming - including seaweed and shrimps 2 818
marine fish farming and sturgeon 36
continental salmonids farming 374
Source : MEEM / DPMA / BSPA (aquaculture survey 2013)
Source : MEEM / DAM /SDSIM (Fichier BARPOP)
> 24 m 12 to less than 24 m < 12 m
< 12 m 12 to less than 24 m
> 24 m
1995 4 878 1 434 281
1996 4 795 1 395 285
1997 4 656 1 318 279
1998 4 583 1 258 277
1999 4 461 1 239 271
2000 4 380 1 233 270
2001 4 271 1 201 272
2002 4 256 1 179 275
2003 4 209 1 155 277
2004 4 069 1 068 274
2005 4 034 1 057 269
2006 3 967 1 006 259
2007 3 939 991 257
2008 3 862 876 241
2009 3 815 817 225
2010 3 769 773 209
2011 3 747 721 207
2012 3 645 741 1922013 3 621 724 1922014 3 580 704 1882015 3 535 681 180
0
1 000
2 000
3 000
4 000
5 000
6 000
1995
1996
1997
1998
1999
2000
2001
2002
2003
2004
2005
2006
2007
2008
2009
2010
2011
2012
2013
2014
2015
14/ Fisheries and aquaculture sector in France > EDITION april 2016. © FranceAgriMer 2016 /
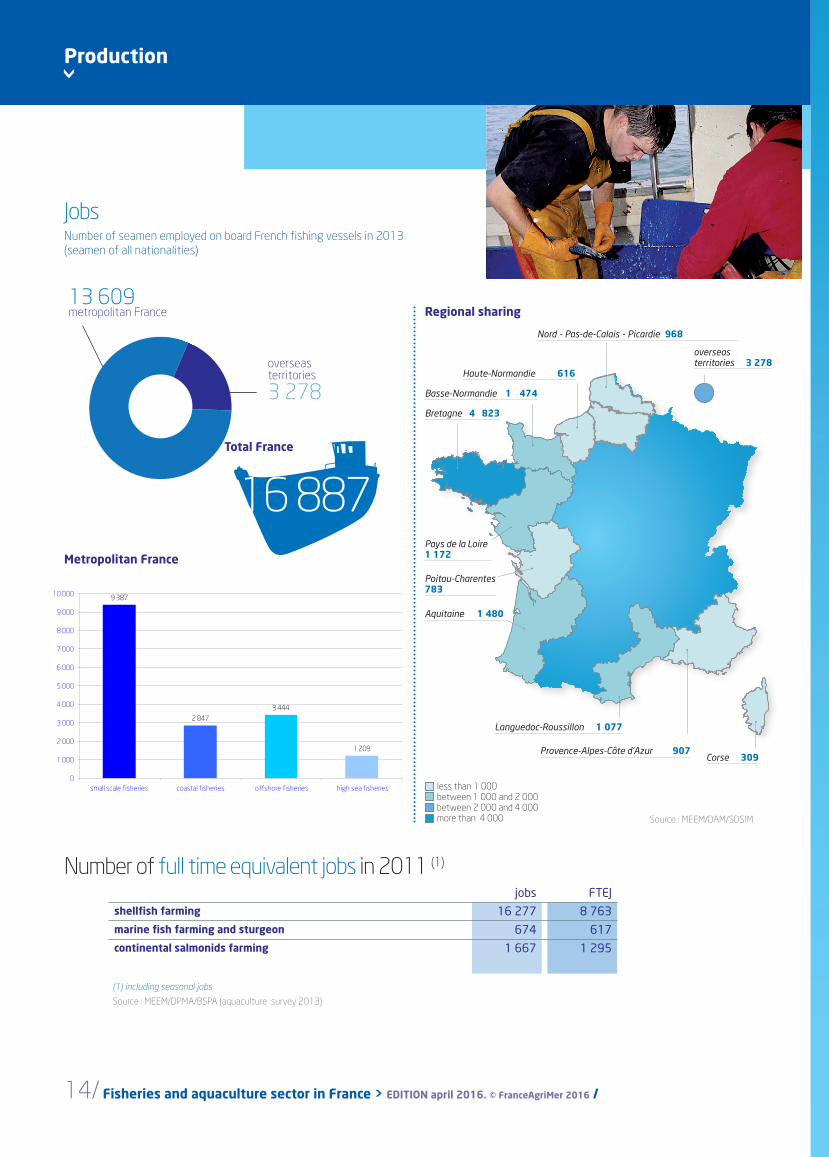
JobsNumber of seamen employed on board French fishing vessels in 2013 (seamen of all nationalities)
> Production
Metropolitan France
16 887Total France
Number of full time equivalent jobs in 2011 (1)
Regional sharing13 609metropolitan France
overseas territories
3 278
Languedoc-Roussillon 1 077
Haute-Normandie 616
Basse-Normandie 1 474
Pays de la Loire 1 172
Poitou-Charentes 783
Aquitaine 1 480
Provence-Alpes-Côte d’Azur 907
Bretagne 4 823
Corse 309
less than 1 000between 1 000 and 2 000between 2 000 and 4 000more than 4 000
overseas territories 3 278
Source : MEEM/DAM/SDSIM
jobs FTEJshellfish farming 16 277 8 763marine fish farming and sturgeon 674 617continental salmonids farming 1 667 1 295
(1) including seasonal jobs
Source : MEEM/DPMA/BSPA (aquaculture survey 2013)
Nord - Pas-de-Calais - Picardie 968
9 387
2 8473 444
1 209
0
1 000
2 000
3 000
4 000
5 000
6 000
7 000
8 000
9 000
10 000
small scale fisheries coastal fisheries offshore fisheries high sea fisheries
fishmonger's / trading / processing by sales / by region
Firms
Les cahiers de FranceAgriMer 2015 / Key figures / FISHERIES AND AQUACULTURE. /15
>
16/ Fisheries and aquaculture sector in France > EDITION april 2016. © FranceAgriMer 2016 /
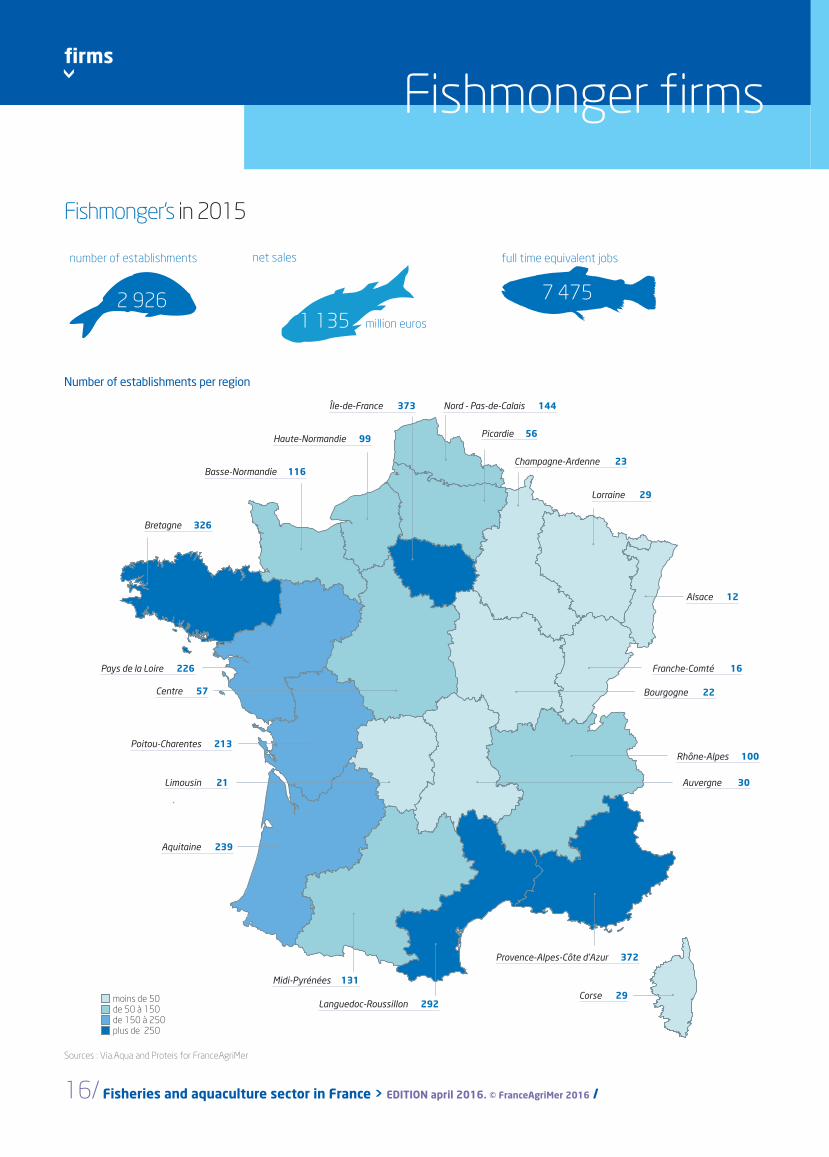
Trading firmsfirms
Fishmonger's in 2015
2 926
number of establishments net sales
1 135 million euros
7 475
full time equivalent jobs
Sources : Via.Aqua and Proteis for FranceAgriMer
Number of establishments per region
moins de 50de 50 à 150de 150 à 250plus de 250
Languedoc-Roussillon 292
Haute-Normandie 99
Île-de-France 373
Alsace 12
Franche-Comté 16
Lorraine 29
Basse-Normandie 116Champagne-Ardenne 23
Limousin 21
Picardie 56
Nord - Pas-de-Calais 144
Provence-Alpes-Côte d’Azur 372
Bretagne 326
Bourgogne 22
Rhône-Alpes 100
Auvergne 30
Midi-Pyrénées 131
Centre 57
Pays de la Loire 226
Poitou-Charentes 213
Aquitaine 239
Corse 29
Fishmonger firms
Les cahiers de FranceAgriMer 2016 / Key figures / FISHERIES AND AQUACULTURE. /17
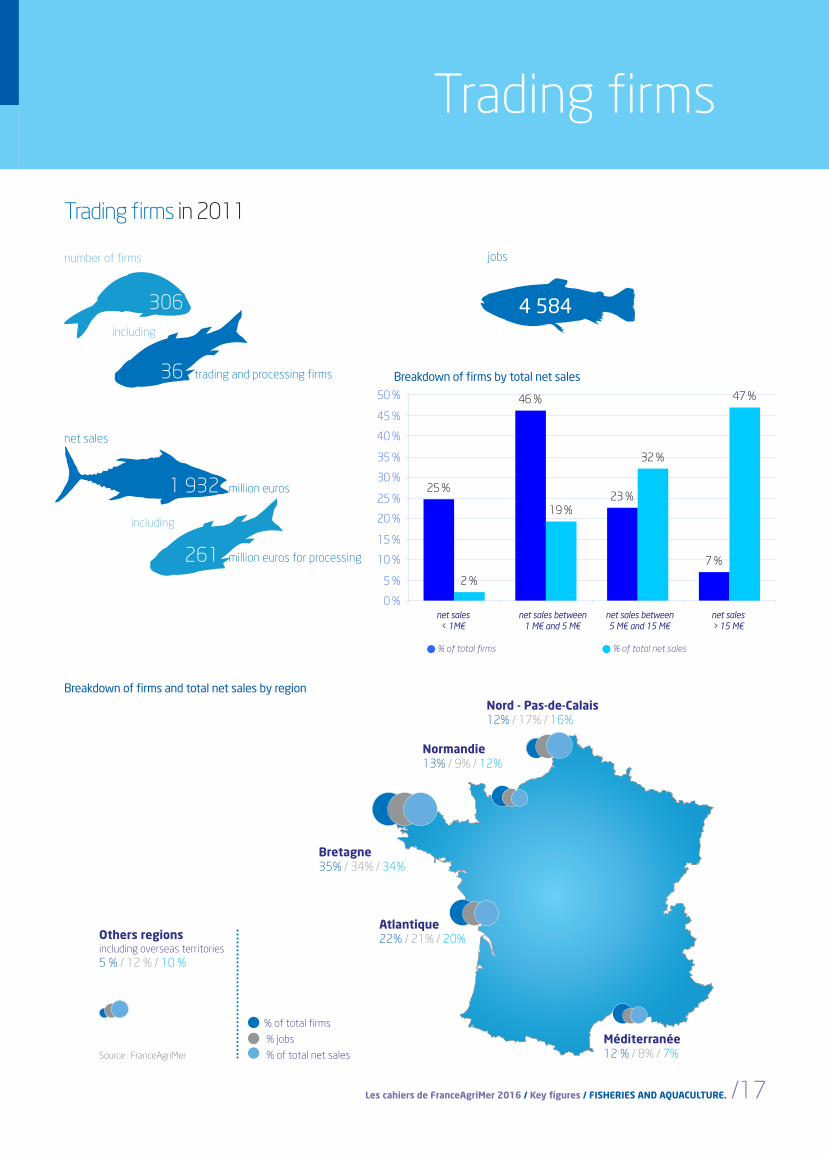
Trading firms
Trading firms in 2011
306
number of firms
36 trading and processing firms
including
4 584
jobs
Breakdown of firms and total net sales by region
% of total firms
Breakdown of firms by total net sales
% of total net sales
1 932 million euros
net sales
261 million euros for processing
including
net sales between 5 M€ and 15 M€
net sales between 1 M€ and 5 M€
net sales > 15 M€
net sales < 1M€
Nord - Pas-de-Calais 12% / 17% / 16%
Normandie 13% / 9% / 12%
Bretagne 35% / 34% / 34%
Atlantique 22% / 21% / 20%
Méditerranée 12 % / 8% / 7%
% of total firms
% jobs
% of total net sales
Others regionsincluding overseas territories5 % / 12 % / 10 %
Source : FranceAgriMer
25 %
46 %
23 %
7 %
2 %
19 %
32 %
47 %
0 %
5 %
10 %
15 %
20 %
25 %
30 %
35 %
40 %
45 %
50 %
net sales < 1 M€ net salesbetween 1M€ and
5M€
net salesbetween 5M€ and
15M€
net sales > 15 M€
>
18/ Fisheries and aquaculture sector in France > EDITION april 2016. © FranceAgriMer 2016 /
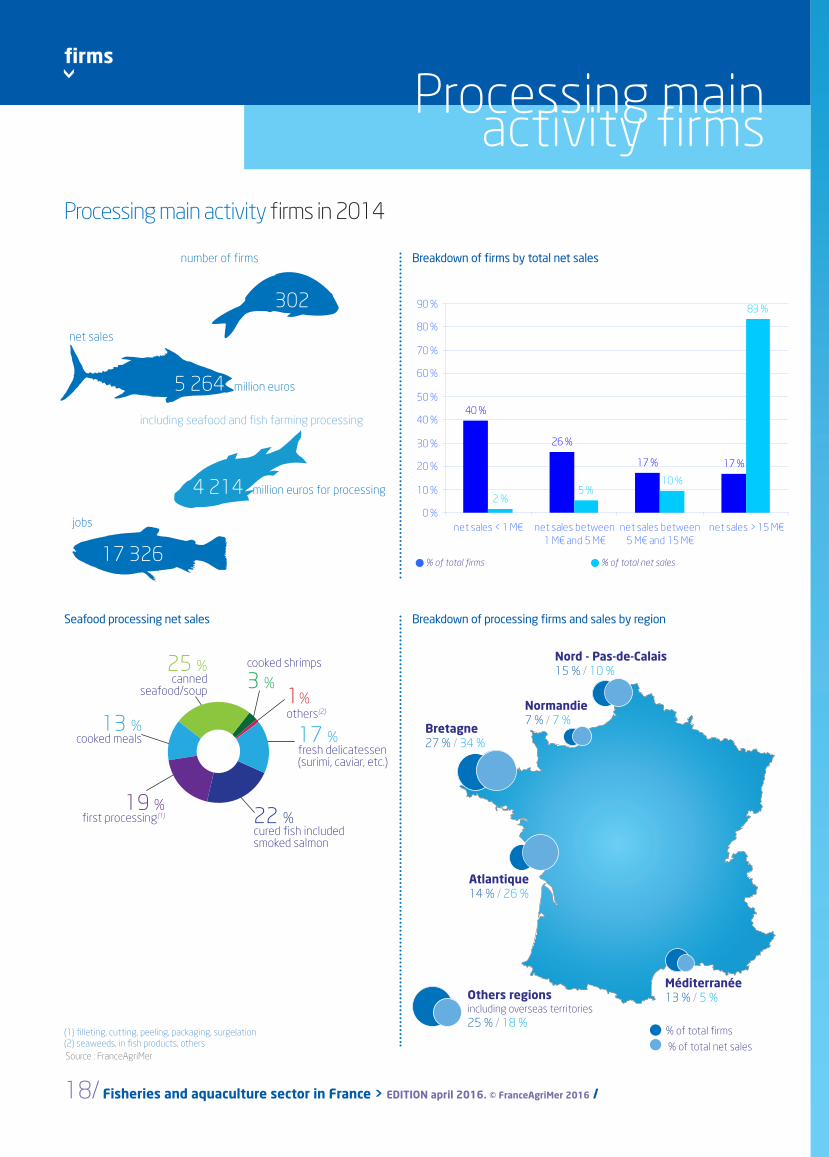
firms
Processing main activity firms
Seafood processing net sales
Processing main activity firms in 2014
Breakdown of processing firms and sales by region
cooked shrimps
3 %
13 %cooked meals
19 %first processing(1)
25 %canned
seafood/soup
17 %fresh delicatessen (surimi, caviar, etc.)
1%others(2)
Source : FranceAgriMer
(1) filleting, cutting, peeling, packaging, surgelation(2) seaweeds, in fish products, others
302
number of firms
17 326
jobs
% of total firms
Breakdown of firms by total net sales
% of total net sales
% of total firms
% of total net sales
net sales > 15 M€
Others regionsincluding overseas territories25 % / 18 %
Nord - Pas-de-Calais 15 % / 10 %
Normandie 7 % / 7 %
Bretagne 27 % / 34 %
Atlantique 14 % / 26 %
Méditerranée 13 % / 5 %
5 264 million euros
net sales
4 214 million euros for processing
including seafood and fish farming processing
22 %cured fish includedsmoked salmon
40 %
26 %
17 % 17 %
2 %5 %
10 %
83 %
0 %
10 %
20 %
30 %
40 %
50 %
60 %
70 %
80 %
90 %
net sales < 1 M€ net sales between1 M€ and 5 M€
net sales between5 M€ and 15 M€
net sales > 15 M€
imports / exports by presentation / by species / by geographical origine / main species
Trade
Les cahiers de FranceAgriMer 2015 / Key figures / FISHERIES AND AQUACULTURE. /19
% of total firms
% of total net sales
Méditerranée 13 % / 5 %
40 %
26 %
17 % 17 %
2 %5 %
10 %
83 %
0 %
10 %
20 %
30 %
40 %
50 %
60 %
70 %
80 %
90 %
net sales < 1 M€ net sales between1 M€ and 5 M€
net sales between5 M€ and 15 M€
net sales > 15 M€
>
20/ Fisheries and aquaculture sector in France > EDITION april 2016. © FranceAgriMer 2016 /
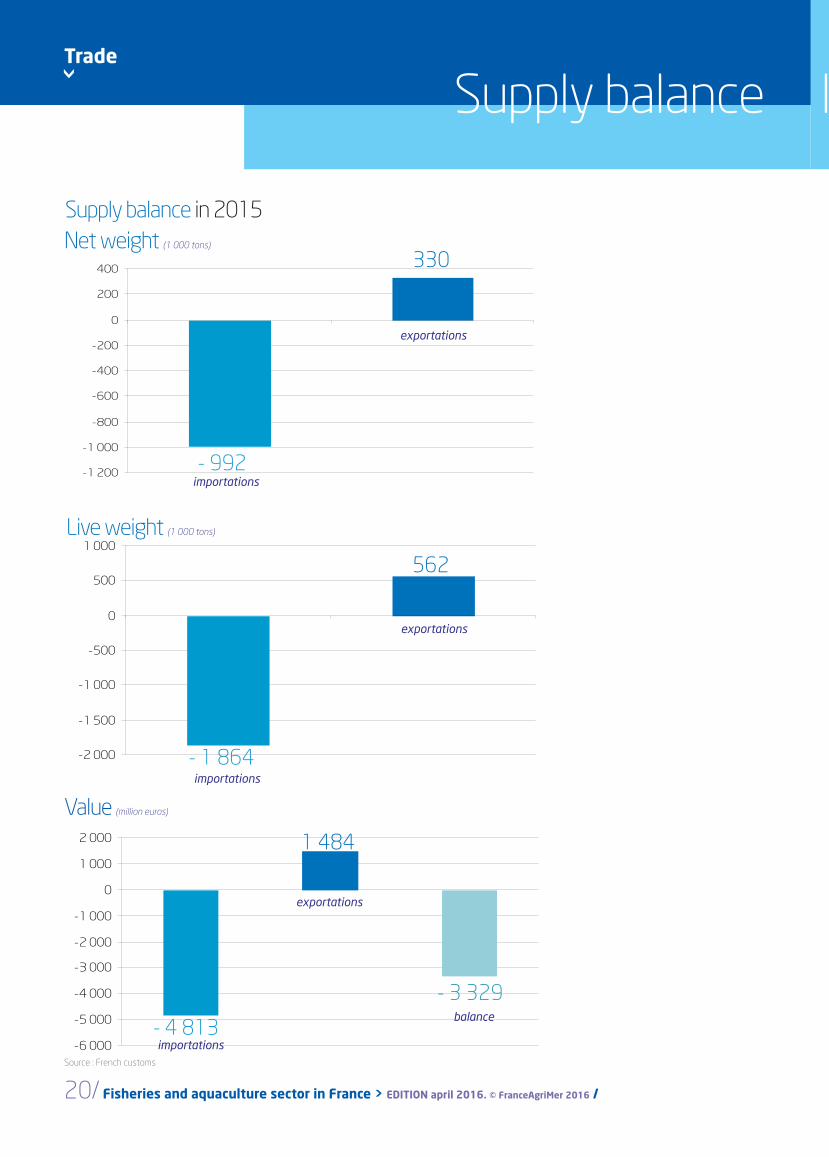
Trade
Supply balance Imports and exports / metropolitan France and overseas territories
Net weight (1 000 tons)
Source : French customs
Value (million euros)
Live weight (1 000 tons)
Supply balance in 2015
-1 200
-1 000
-800
-600
-400
-200
0
200
400
exportations
importations
330
- 992
-2 000
-1 500
-1 000
-500
0
500
1 000
exportations
importations
- 1 864
562
-6 000
-5 000
-4 000
-3 000
-2 000
-1 000
0
1 000
2 000
balance
importations
exportations
1 484
- 3 329
- 4 813
Les cahiers de FranceAgriMer 2016 / Key figures / FISHERIES AND AQUACULTURE. /21
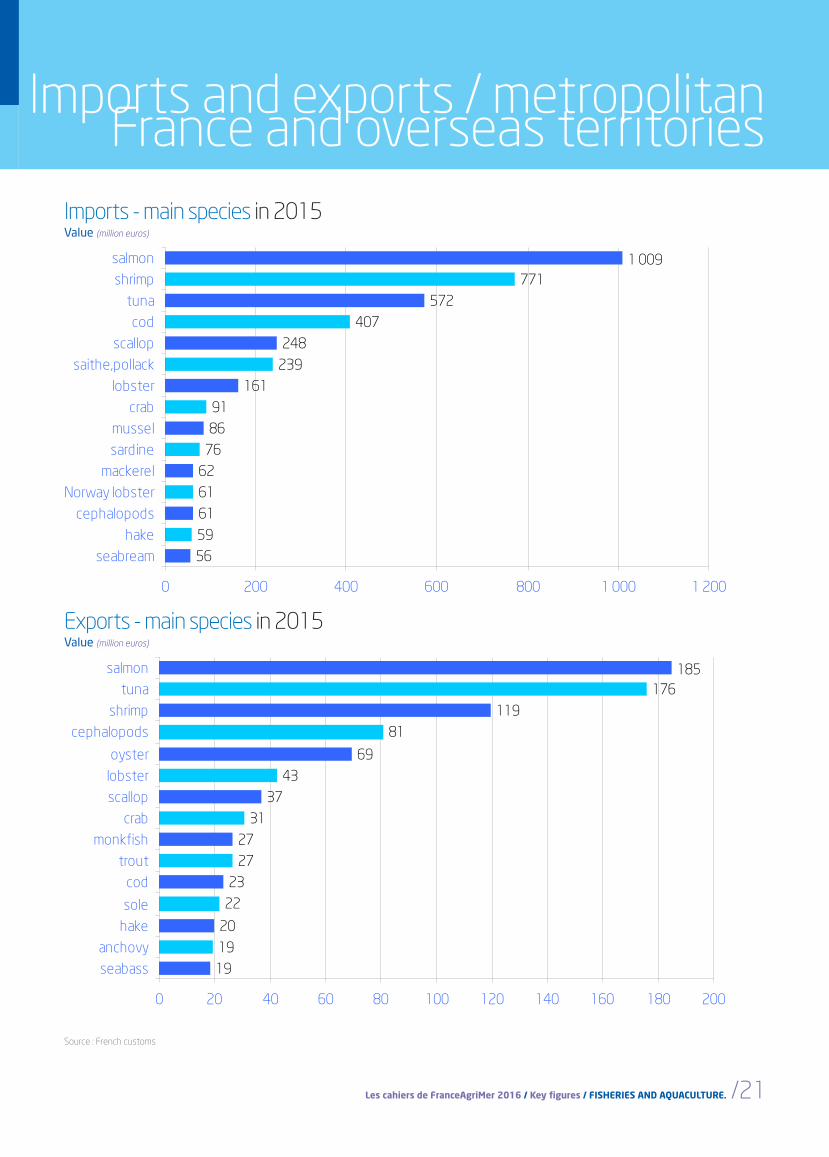
Imports - main species in 2015
Exports - main species in 2015
Source : French customs
Value (million euros)
Value (million euros)
Imports and exports / metropolitan France and overseas territories
5659616162
768691
161239248
407572
7711 009
0 200 400 600 800 1 000 1 200
seabreamhake
cephalopodsNorway lobster
mackerelsardinemussel
crablobster
saithe,pollackscallop
codtuna
shrimpsalmon
191920
2223
2727
3137
4369
81119
176185
0 20 40 60 80 100 120 140 160 180 200
seabassanchovy
hakesole
codtrout
monkfishcrab
scalloplobsteroyster
cephalopodsshrimp
tunasalmon
>
22/ Fisheries and aquaculture sector in France > EDITION april 2016. © FranceAgriMer 2016 /
>
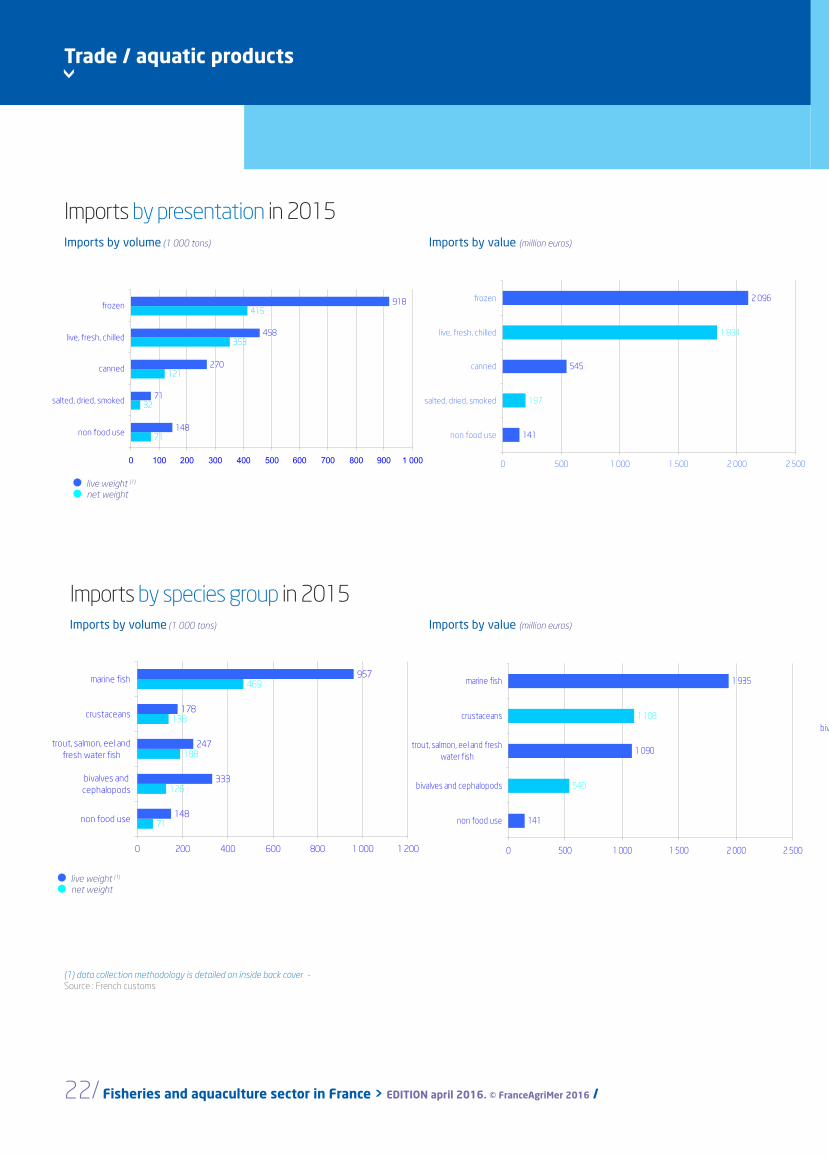
Trade / aquatic products
Imports by volume (1 000 tons) Imports by value (million euros)
Imports by presentation in 2015
(1) data collection methodology is detailed on inside back cover - Source : French customs
Imports by volume (1 000 tons) Imports by value (million euros)
Imports by species group in 2015
net weight
Imports and exports / metropolitan France and overseas territories
live weight (1)
net weightlive weight (1)
141
545
2 096
197
1 834
0 500 1 000 1 500 2 000 2 500
non food use
salted, dried, smoked
canned
live, fresh, chilled
frozen
148
333
247
178
957469
138
188
126
71
0 200 400 600 800 1 000 1 200
non food use
bivalves andcephalopods
trout, salmon, eel andfresh water fish
crustaceans
marine fish
141
1 090
1 935
540
1 108
0 500 1 000 1 500 2 000 2 500
non food use
bivalves and cephalopods
trout, salmon, eel and freshwater fish
crustaceans
marine fish
173
31
19
40
68
224
44
26
74
195
0 50 100 150 200 250
marine fish
trout, salmon, eel andfresh water fish
crustaceans
bivalves and cephalopods
non food use
71
32
121
353
415
148
71
270
458
918
0 100 200 300 400 500 600 700 800 900 1 000
non food use
salted, dried, smoked
canned
live, fresh, chilled
frozen
Les cahiers de FranceAgriMer 2016 / Key figures / FISHERIES AND AQUACULTURE. /23
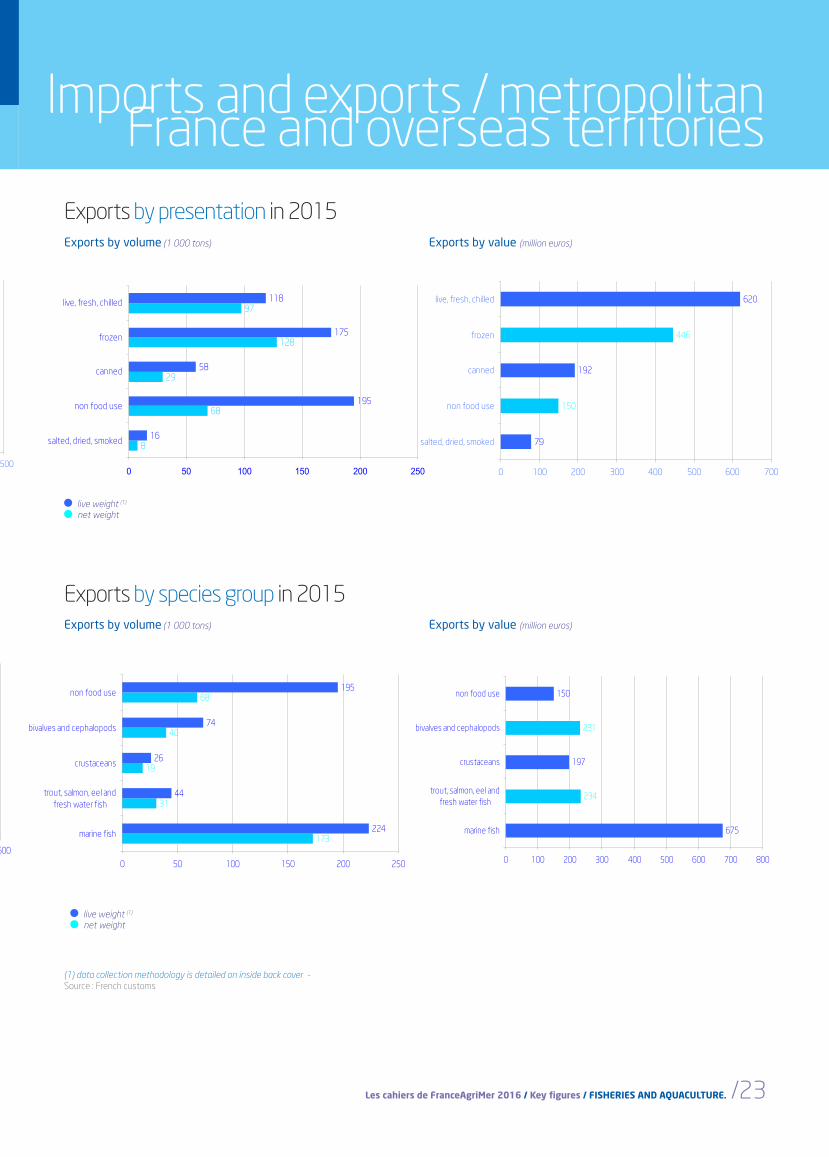
Imports and exports / metropolitan France and overseas territories
Exports by presentation in 2015
(1) data collection methodology is detailed on inside back cover - Source : French customs
Exports by volume (1 000 tons) Exports by value (million euros)
Exports by species group in 2015Exports by volume (1 000 tons) Exports by value (million euros)
net weightlive weight (1)
net weightlive weight (1)
141
545
2 096
197
1 834
0 500 1 000 1 500 2 000 2 500
non food use
salted, dried, smoked
canned
live, fresh, chilled
frozen
141
1 090
1 935
540
1 108
0 500 1 000 1 500 2 000 2 500
non food use
bivalves and cephalopods
trout, salmon, eel and freshwater fish
crustaceans
marine fish
79
192
620
150
446
0 100 200 300 400 500 600 700
salted, dried, smoked
non food use
canned
frozen
live, fresh, chilled
173
31
19
40
68
224
44
26
74
195
0 50 100 150 200 250
marine fish
trout, salmon, eel andfresh water fish
crustaceans
bivalves and cephalopods
non food use
675
197
150
234
231
0 100 200 300 400 500 600 700 800
marine fish
trout, salmon, eel andfresh water fish
crustaceans
bivalves and cephalopods
non food use
8
68
29
128
97
16
195
58
175
118
0 50 100 150 200 250
salted, dried, smoked
non food use
canned
frozen
live, fresh, chilled
>
24/ Fisheries and aquaculture sector in France > EDITION april 2016. © FranceAgriMer 2016 /
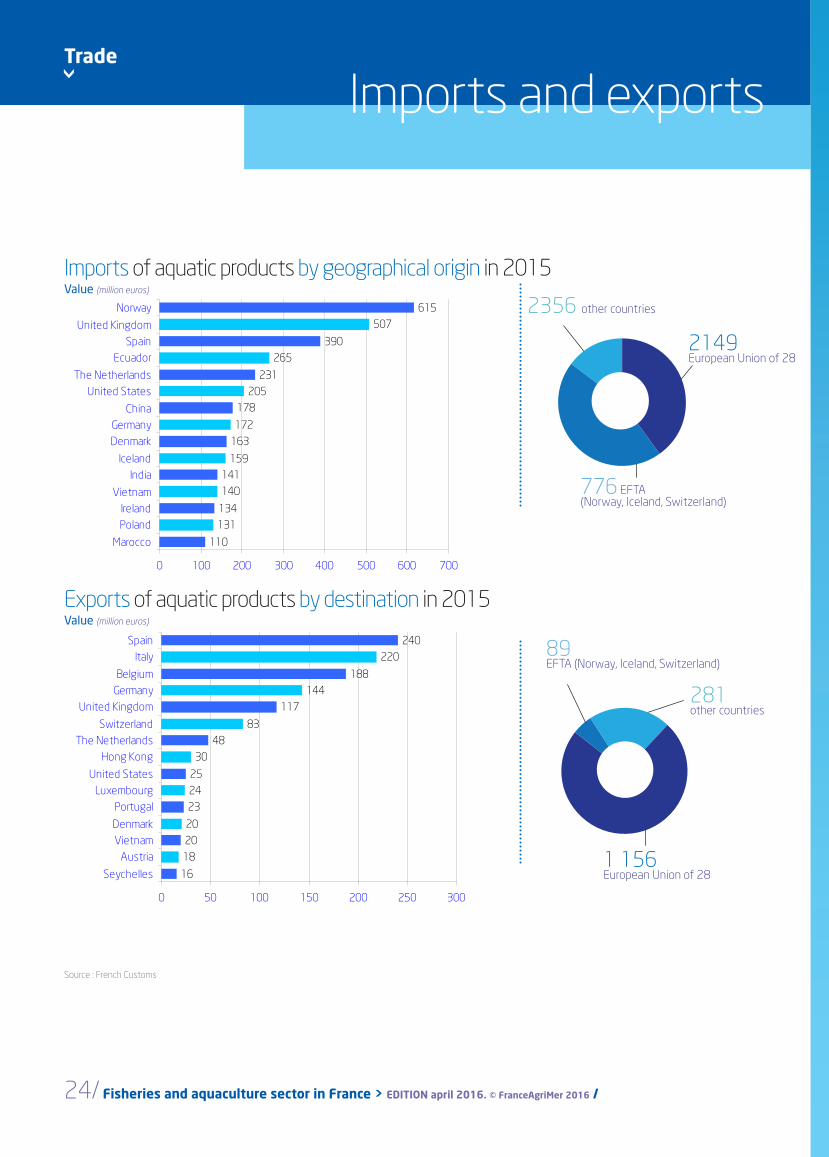
Trade
Imports of aquatic products by geographical origin in 2015
Exports of aquatic products by destination in 2015
Source : French Customs
Value (million euros)
Value (million euros)
Imports and exports
2149European Union of 28
2356 other countries
776 EFTA (Norway, Iceland, Switzerland)
1 156European Union of 28
281other countries
89EFTA (Norway, Iceland, Switzerland)
110
131134
140141
159
163172
178205
231
265390
507615
0 100 200 300 400 500 600 700
Marocco
PolandIreland
Vietnam
IndiaIceland
DenmarkGermany
China
United StatesThe Netherlands
EcuadorSpain
United Kingdom
Norway
16
182020
232425
3048
83
117144
188
220240
0 50 100 150 200 250 300
Seychelles
AustriaVietnamDenmark
PortugalLuxembourg
United States
Hong KongThe Netherlands
Switzerland
United KingdomGermanyBelgium
ItalySpain
supply balance / purchases households / catering / breakdown of purchases by distribution channel
Consumption
Les cahiers de FranceAgriMer 2015 / Key figures / FISHERIES AND AQUACULTURE. /25
2149European Union of 28
>
26/ Fisheries and aquaculture sector in France > EDITION april 2016. © FranceAgriMer 2016 /
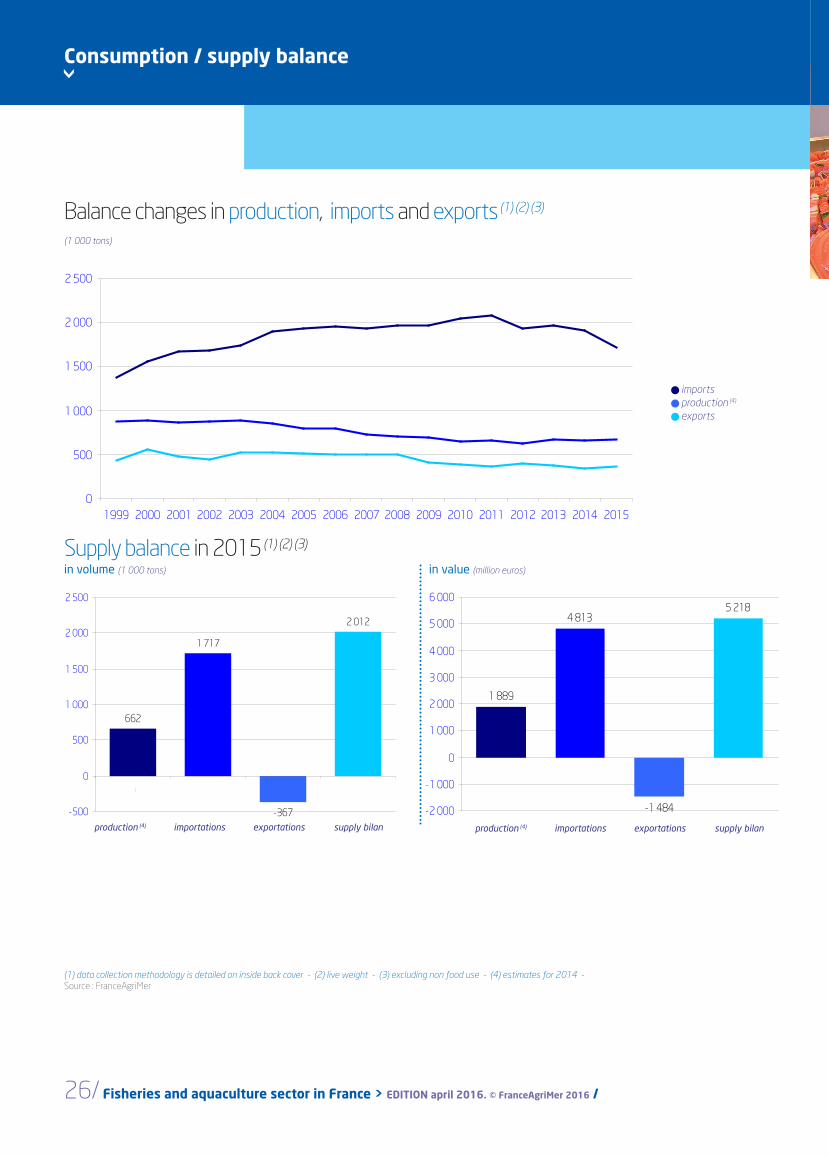
662
1 717
-367
2 012
-500
0
500
1 000
1 500
2 000
2 500
0
Consumption / supply balance
Supply balance in 2015 (1) (2) (3)
Balance changes in production, imports and exports (1) (2) (3)
production (4) supply bilanexportationsimportations
(1) data collection methodology is detailed on inside back cover - (2) live weight - (3) excluding non food use - (4) estimates for 2014 - Source : FranceAgriMer
in volume (1 000 tons) in value (million euros)
(1 000 tons)
imports production (4)
exports
Supply balance
production (4) supply bilanexportationsimportations
1 889
4 813
-1 484
5 218
-2 000
-1 000
0
1 000
2 000
3 000
4 000
5 000
6 000
0
500
1 000
1 500
2 000
2 500
1999 2000 2001 2002 2003 2004 2005 2006 2007 2008 2009 2010 2011 2012 2013 2014 2015
Les cahiers de FranceAgriMer 2016 / Key figures / FISHERIES AND AQUACULTURE. /27
(1) data collection methodology is detailed on inside back cover - (2) live weight - (3) average 2012-2014 - Source : FranceAgriMer
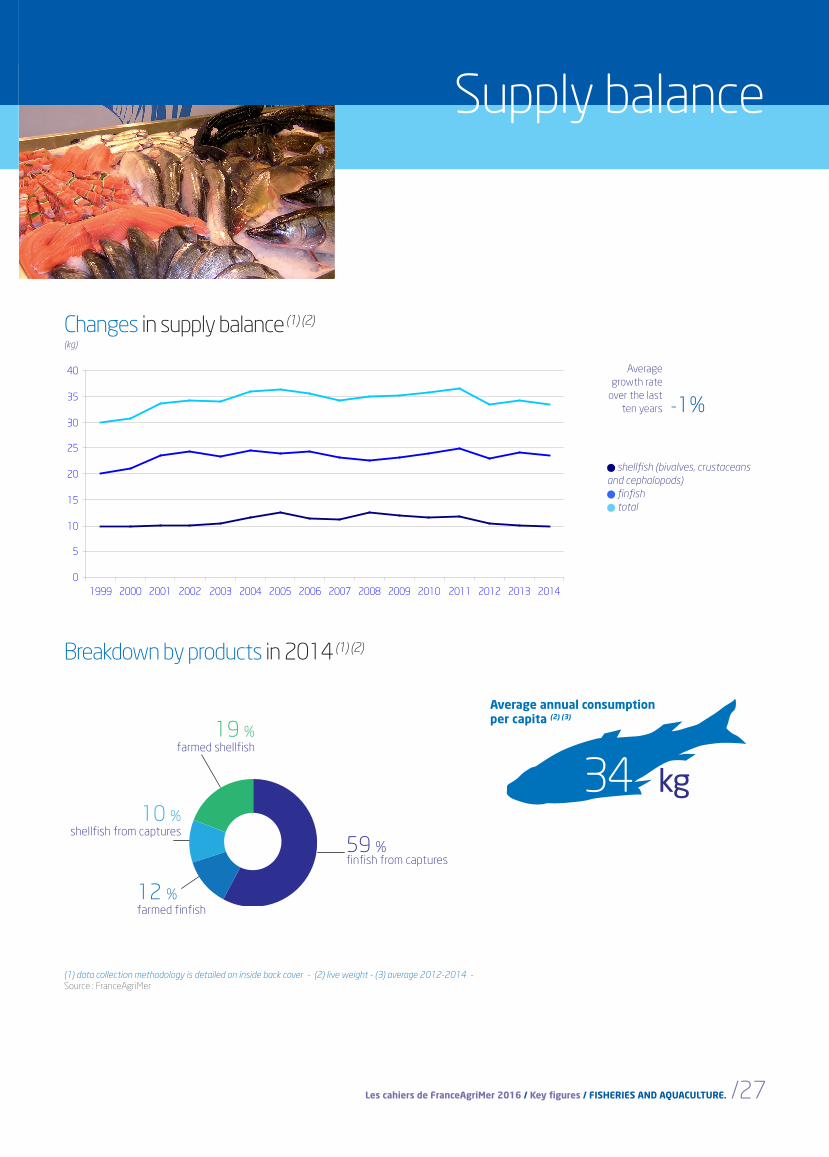
Breakdown by products in 2014 (1) (2)
10 %shellfish from captures
59 %finfish from captures
12 %farmed finfish
19 %farmed shellfish
34 kg
Average annual consumptionper capita (2) (3)
Supply balance
(kg)
Changes in supply balance (1) (2)
shellfish (bivalves, crustaceans and cephalopods)
finfish total
Average growth rate over the last ten years -1%
1 889
4 813
-1 484
5 218
-2 000
-1 000
0
1 000
2 000
3 000
4 000
5 000
6 000
0
5
10
15
20
25
30
35
40
1999 2000 2001 2002 2003 2004 2005 2006 2007 2008 2009 2010 2011 2012 2013 2014
28/ Fisheries and aquaculture sector in France > EDITION april 2016. © FranceAgriMer 2016 /
0%
10%
20%
30%
40%
50%
60%
70%
80%
90%
100%
fresh products chilleddelicatessen(3)
canned products frozen products
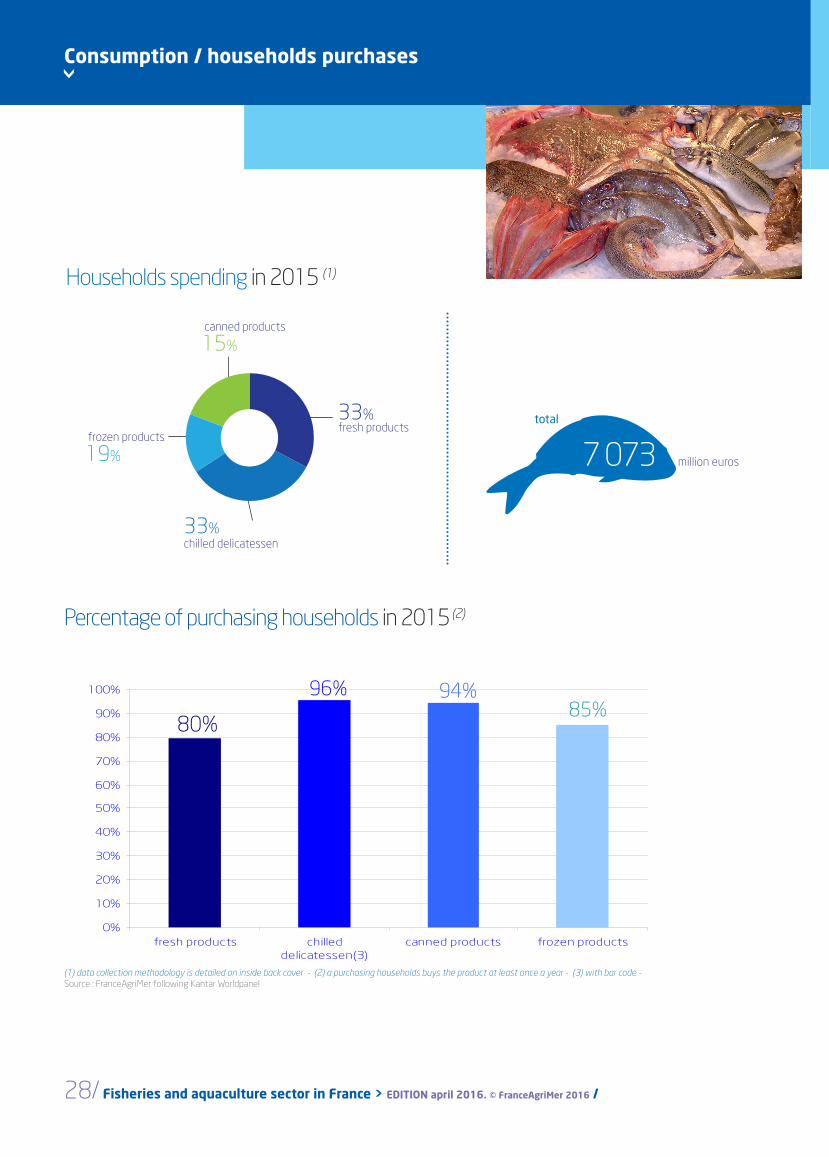
Percentage of purchasing households in 2015 (2)
33%chilled delicatessen
frozen products
19%
canned products
15%
33%fresh products
80%
96% 94%85%
Households spending in 2015 (1)
(1) data collection methodology is detailed on inside back cover - (2) a purchasing households buys the product at least once a year - (3) with bar code -Source : FranceAgriMer following Kantar Worldpanel
total
7 073 million euros
> Consumption / households purchases
Purchases by French households for home consumption
Les cahiers de FranceAgriMer 2016 / Key figures / FISHERIES AND AQUACULTURE. /29
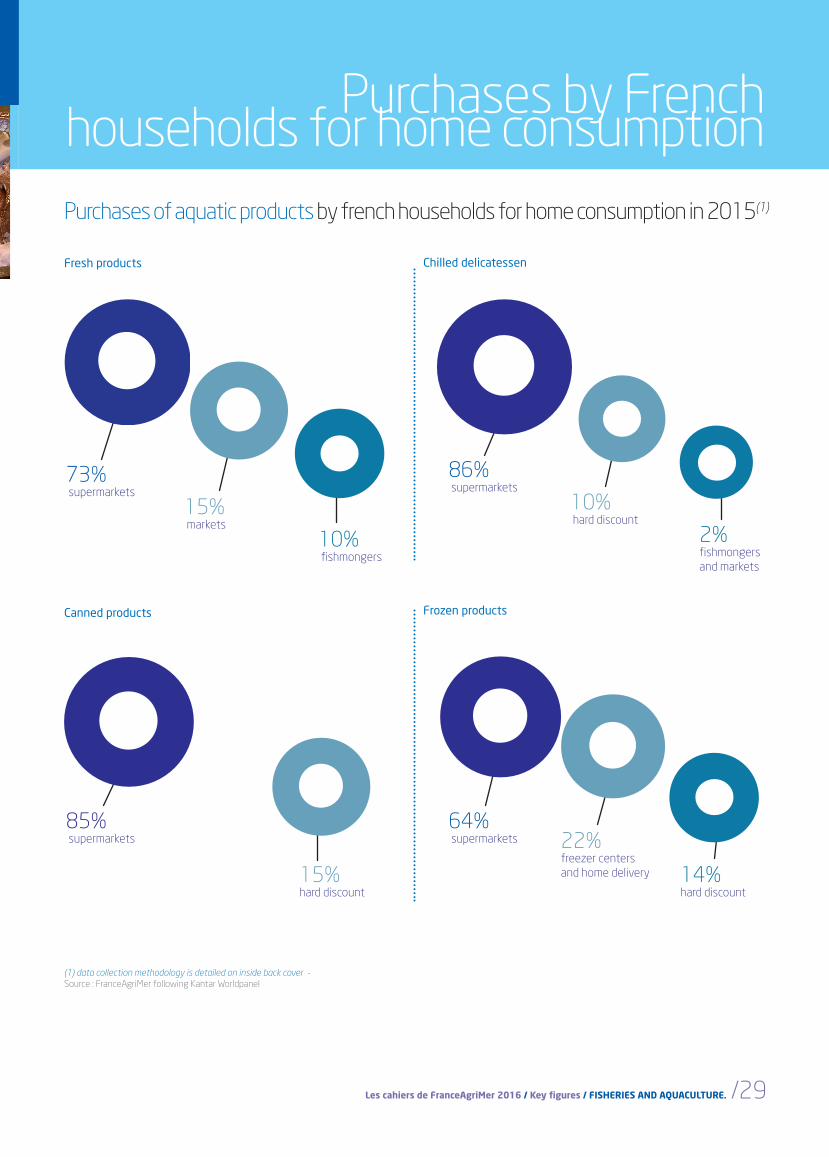
Purchases of aquatic products by french households for home consumption in 2015(1)
Fresh products
Canned products
Chilled delicatessen
Frozen products
Purchases by French households for home consumption
(1) data collection methodology is detailed on inside back cover - Source : FranceAgriMer following Kantar Worldpanel
85% supermarkets
15%hard discount
86% supermarkets
10% hard discount
2%fishmongers and markets
64% supermarkets 22%
freezer centers and home delivery 14%
hard discount
73% supermarkets
15% markets
10% fishmongers
>
30/ Fisheries and aquaculture sector in France > EDITION april 2016. © FranceAgriMer 2016 /
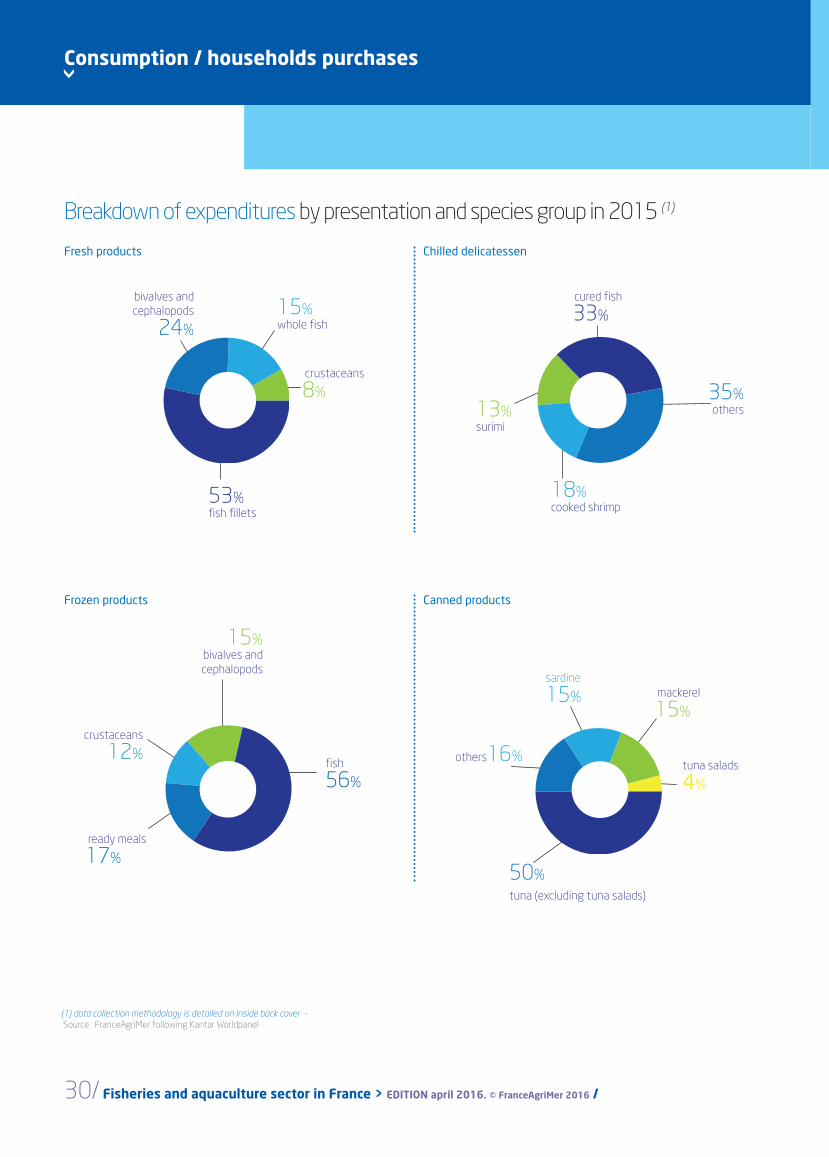
Consumption / households purchases
Breakdown of expenditures by presentation and species group in 2015 (1)
18%cooked shrimp
cured fish
33%
35%others13%
surimi
53%fish fillets
crustaceans
8%
bivalves and cephalopods
24%15%whole fish
Fresh products
Frozen products
Chilled delicatessen
Canned products
(1) data collection methodology is detailed on inside back cover - Source : FranceAgriMer following Kantar Worldpanel
ready meals
17%
crustaceans
12%fish
56%
15%bivalves and cephalopods
others16%
50%tuna (excluding tuna salads)
mackerel
15%
sardine
15%
tuna salads
4%
Purchases by French households for home consumpti
Les cahiers de FranceAgriMer 2016 / Key figures / FISHERIES AND AQUACULTURE. /31
tuna salads
4%
Purchases by French households for home consumpti
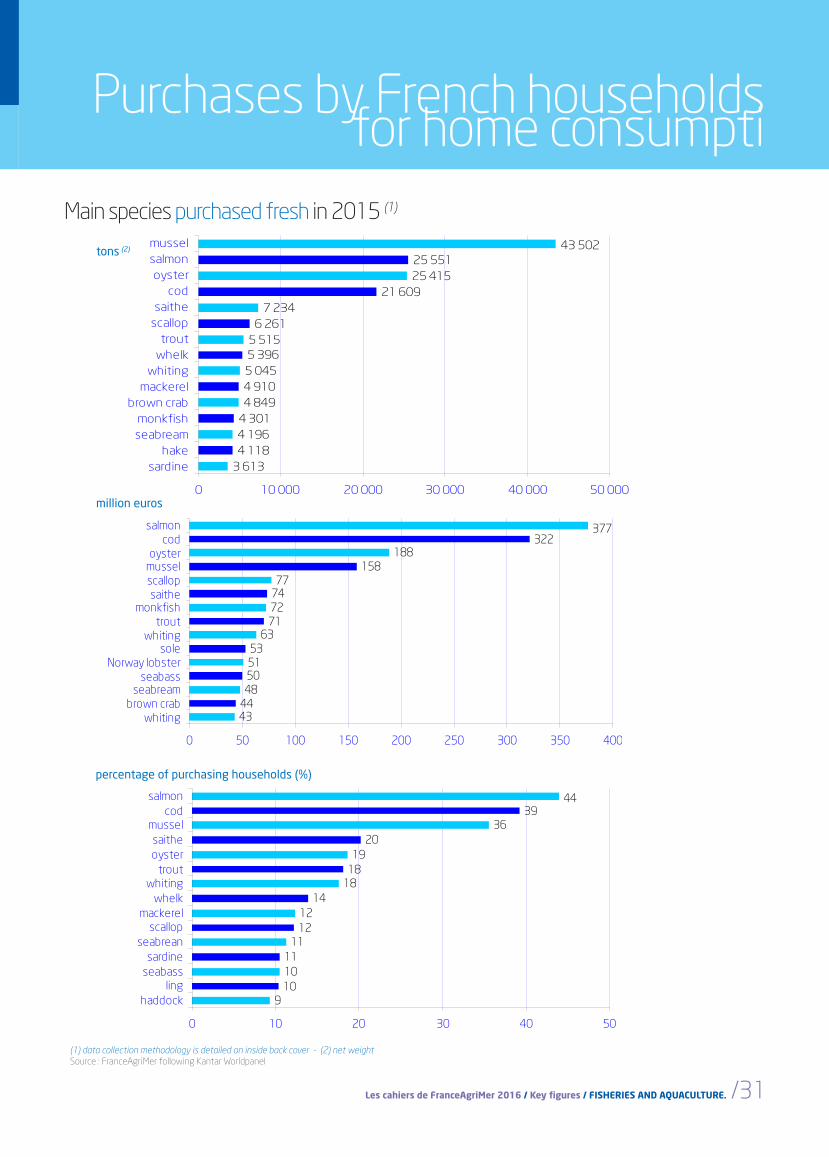
(1) data collection methodology is detailed on inside back cover - (2) net weight Source : FranceAgriMer following Kantar Worldpanel
tons (2)
million euros
Main species purchased fresh in 2015 (1)
percentage of purchasing households (%)
3 6134 1184 1964 3014 8494 9105 0455 3965 515
6 2617 234
21 60925 41525 551
43 502
0 10 000 20 000 30 000 40 000 50 000
sardinehake
seabreammonkfish
brown crabmackerel
whitingwhelktrout
scallopsaithe
codoyster
salmonmussel
434448505153
6371727477
158188
322377
0 50 100 150 200 250 300 350 400
whitingbrown crab
seabreamseabass
Norway lobstersole
whitingtrout
monkfishsaithe
scallopmusseloyster
codsalmon
9101011
111212
14181819
2036
3944
0 10 20 30 40 50
haddockling
seabasssardine
seabreanscallop
mackerelwhelk
whitingtrout
oystersaithe
musselcod
salmon
32/ Fisheries and aquaculture sector in France > EDITION april 2016. © FranceAgriMer 2016 /
0%
10%
20%
30%
40%
50%
60%
70%
fresh products chilled delicatessen frozen products canned production
0%
10%
20%
30%
40%
50%
60%
70%
fresh products chilled delicatessen frozen products canned production
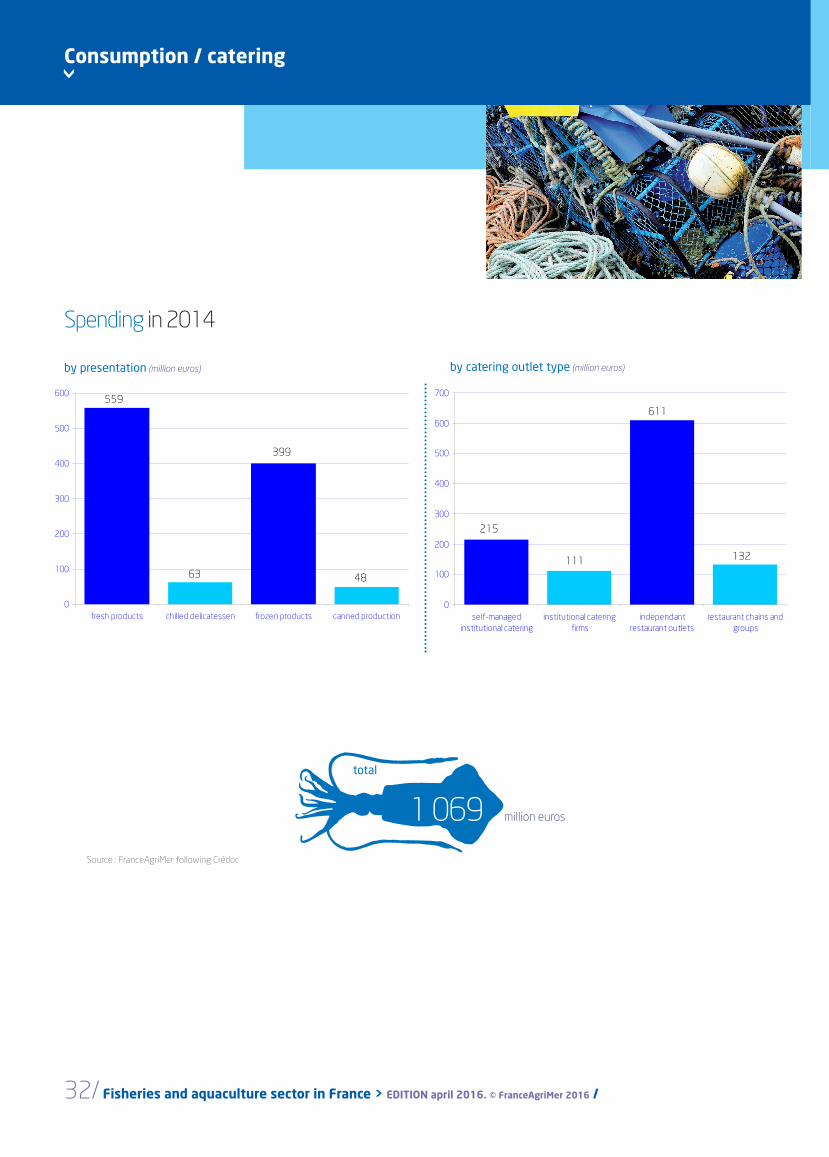
Spending in 2014
Source : FranceAgriMer following Crédoc
by presentation (million euros) by catering outlet type (million euros)
1 069 million euros
total> Consumption / catering
Purchases of aquatic products by the catering sector
0
100
200
300
400
500
600
fresh products chilled delicatessen frozen products canned production0
100
200
300
400
500
600
700
self-managedinstitutional catering
institutional cateringfirms
independantrestaurant outlets
restaurant chains andgroups
559
63
399
48
215
111
611
132
Les cahiers de FranceAgriMer 2016 / Key figures / FISHERIES AND AQUACULTURE. /33
0%
10%
20%
30%
40%
50%
60%
fresh products chilled delicatessen frozen products canned production0%
10%
20%
30%
40%
50%
60%
70%
fresh products chilled delicatessen frozen products canned production
0%
10%
20%
30%
40%
50%
60%
70%
80%
fresh products chilled delicatessen frozen products canned production0%
10%
20%
30%
40%
50%
60%
70%
fresh products chilled delicatessen frozen products canned production
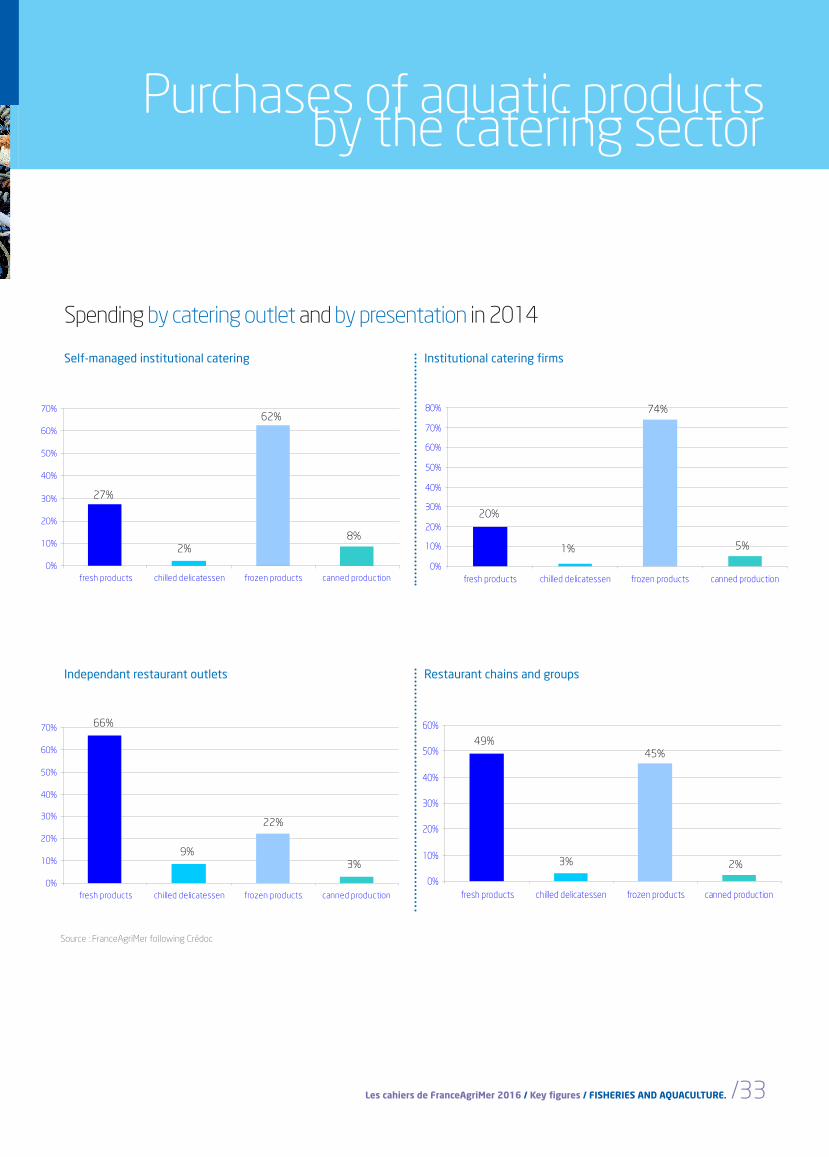
Purchases of aquatic products by the catering sector
Spending by catering outlet and by presentation in 2014
Self-managed institutional catering
Independant restaurant outlets
Institutional catering firms
Restaurant chains and groups
Source : FranceAgriMer following Crédoc
0
100
200
300
400
500
600
700
self-managedinstitutional catering
institutional cateringfirms
independantrestaurant outlets
restaurant chains andgroups
62%
8%
20%
1%
74%
5%
2%
45%
3%
49%
66%
9%
22%
3%
27%
2%
>
34/ Fisheries and aquaculture sector in France > EDITION april 2016. © FranceAgriMer 2016 /
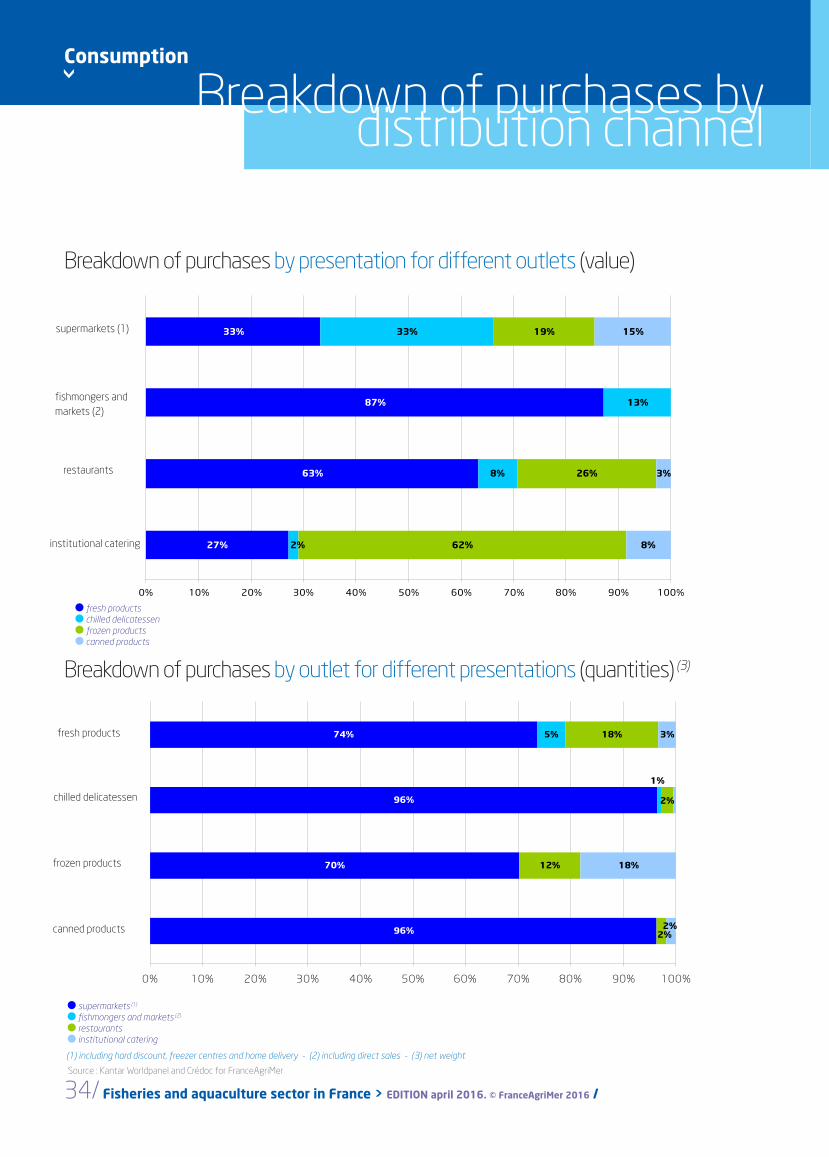
Consumption
Breakdown of purchases by distribution channel
Breakdown of purchases by presentation for different outlets (value)
Breakdown of purchases by outlet for different presentations (quantities) (3)
(1) including hard discount, freezer centres and home delivery - (2) including direct sales - (3) net weight
Source : Kantar Worldpanel and Crédoc for FranceAgriMer
supermarkets (1) fishmongers and markets (2)
restaurantsinstitutional catering
fresh products chilled delicatessenfrozen productscanned products
27%
63%
87%
33%
8%
13%
33%
62%
26%
19%
8%
3%
15%
2%
0% 10% 20% 30% 40% 50% 60% 70% 80% 90% 100%
fresh products
chilled delicatessen
frozen products
canned production
96%
70%
96%
74% 5%
12%
18%
18%
3%
1%
2%
2%
2%
0% 10% 20% 30% 40% 50% 60% 70% 80% 90% 100%
supermarkets (1)
fishmongers and markets (2)
restaurants
institutional catering
supermarkets (1)
fishmongers and markets (2)
restaurants
institutional catering
fresh products
chilled delicatessen
frozen products
canned products
Les cahiers de FranceAgriMer 2016 / Key figures / FISHERIES AND AQUACULTURE. /35
Data collection methodology
Data Included data are the last available on april the 11th 2016.
Foreign Trade Raw Import/export data is provided by French Customs on a net weight basis. It is converted here into their live weight equivalent, i.e. before any product processing, using coefficients that have been established for each product code.
Processing Processing firms data arise from a survey carried out in 2015 among main or secondary processing activity identified firms. Besides, information about non-processing trading firms arises from FranceAgriMer's updated fish trading firms database (notably following the French National Institute for Statistics and Economic Studies' firm lists, sanitary approvals, financial databases and professional sources).
Consumption French consumption may be measured in two ways :• firstly, by calculating supply balance or apparent consumption (production + imports - exports),• secondly by using consumer and restaurant panels.
Apparent consumption is measured in live weight equivalent and includes the overseas territories (French Caribbean Islands, Reunion Island and French Guyana). In contrast, consumer and restaurant data are expressed in net weight, meaning the weight as purchased by the final consumer (consumer panel) or by restaurants (restaurant panel), and exclude consumption in the overseas territories (and in Corsica for consumer panels). Panel data is based on declarations made by consumers and restaurant buyers and is thus non-exhaustive. Coverage varies according to the product in question, and the overall rate of coverage is approximately 80%.
To find out more information, especially about prices at all levels of the sector (production, trade, consumption), and their trends :• Bilan annuel FranceAgriMer 2015des ventes déclarées en halles à marée*• Bilan annuel FranceAgriMer 2015 du commerce extérieur des produits de la pêche et de
l’aquaculture*• Bilan annuel FranceAgriMer 2015 de la consommation des produits de la pêche et de
l’aqua culture*
* coming 2016
Ric Réseau inter criées MEEM Ministère de l'Environnement, de l'Énergie et de la Mer DPMA Direction des Pêches Maritimes et de l'AquacultureBSPA Bureau des statistiques de la Pêche et de l'AquacultureDAM Direction des Affaires MaritimesSDSIM Sous Direction des Systèmes d'information maritimesIfremer Institut français de recherche pour l'exploitation de la mer

www.franceagrimer.fr / www.agriculture.gouv.fr