The first draft was prepared by Professor Mi-Gyung Lee ... · The first draft was prepared by...
90
1811 PENCONAZOLE (182) The first draft was prepared by Professor Mi-Gyung Lee, Andong National University, Republic of Korea EXPLANATION Penconazole is used for the control of powdery mildew, pome fruit scab and other fungal pathogens on fruit and vegetables. It belongs to the class of sterol demethylation inhibitors (DMI inhibitors), which inhibits the biosynthesis of cell membrane ergosterol. It is a systemic triazole fungicide with protective and curative action, and is absorbed through the leaves and translocated acropetally. Penconazole was first evaluated by JMPR in 1992 when an ADI of 0–0.03 mg/kg bw was established, and MRLs for plant and animal commodities were recommended. In 1995, residue data for pome fruits and grapes were reviewed and the previous MRLs were maintained. For both compliance and assessment of dietary intake, the residue is defined as penconazole. In 2008, the JMPR established an ADI of 0–0.2 mg/kg bw and an ARfD of 0.3 mg/kg bw for 1,2,4-triazole. For triazole alanine and triazole acetic acid, the Meeting established a group ADI of 0– 1 mg/kg bw (alone or in combination) and concluded that it was unnecessary to establish an ARfD for them. In 2015, penconazole including metabolites (1,2,4-triazole, triazole alanine and triazole acetic acid) was re-evaluated for toxicology by JMPR within the periodic review programme of CCPR. The Meeting reaffirmed the ADI of 0–0.03 mg/kg bw and established an ARfD of 0.8 mg/kg bw for penconazole. For 1,2,4-triazole, the Meeting reaffirmed the previous ADI of 0–0.2 mg/kg bw and ARfD of 0.3 mg/kg bw. For triazole alanine and triazole acetic acid, the Meeting reaffirmed the group ADI (alone or in combination) of 0–1 mg/kg bw as expressed as triazole alanine and established an ARfD of 3 mg/kg bw for triazole alanine and triazole acetic acid. Penconazole was scheduled at the 47 th session of the CCPR (2015) for periodic re-evaluation of residues by the 2016 JMPR. The Meeting received information on physical and chemical properties, metabolism and environmental fate, residue analysis, use patterns, supervised trials, processing and animal feeding studies. IDENTITY ISO Common name: Penconazole Chemical name IUPAC: (RS)-1-[2-(2,4-dicholorophenyl)pentyl]-1H-1,2,4-triazole CAS: 1-[2-(2,4-dichlorophenyl)pentyl]-1H-1,2,4-triazole CAS Registry number: 66246-88-6 CIPAC number: 446 Manufacturer’s code number: CGA71818 Structural formula:
Transcript of The first draft was prepared by Professor Mi-Gyung Lee ... · The first draft was prepared by...

1811
PENCONAZOLE (182)
The first draft was prepared by Professor Mi-Gyung Lee, Andong National University, Republic of Korea
EXPLANATION
Penconazole is used for the control of powdery mildew, pome fruit scab and other fungal pathogens on fruit and vegetables. It belongs to the class of sterol demethylation inhibitors (DMI inhibitors), which inhibits the biosynthesis of cell membrane ergosterol. It is a systemic triazole fungicide with protective and curative action, and is absorbed through the leaves and translocated acropetally.
Penconazole was first evaluated by JMPR in 1992 when an ADI of 0–0.03 mg/kg bw was established, and MRLs for plant and animal commodities were recommended. In 1995, residue data for pome fruits and grapes were reviewed and the previous MRLs were maintained. For both compliance and assessment of dietary intake, the residue is defined as penconazole.
In 2008, the JMPR established an ADI of 0–0.2 mg/kg bw and an ARfD of 0.3 mg/kg bw for 1,2,4-triazole. For triazole alanine and triazole acetic acid, the Meeting established a group ADI of 0–1 mg/kg bw (alone or in combination) and concluded that it was unnecessary to establish an ARfD for them.
In 2015, penconazole including metabolites (1,2,4-triazole, triazole alanine and triazole acetic acid) was re-evaluated for toxicology by JMPR within the periodic review programme of CCPR. The Meeting reaffirmed the ADI of 0–0.03 mg/kg bw and established an ARfD of 0.8 mg/kg bw for penconazole. For 1,2,4-triazole, the Meeting reaffirmed the previous ADI of 0–0.2 mg/kg bw and ARfD of 0.3 mg/kg bw. For triazole alanine and triazole acetic acid, the Meeting reaffirmed the group ADI (alone or in combination) of 0–1 mg/kg bw as expressed as triazole alanine and established an ARfD of 3 mg/kg bw for triazole alanine and triazole acetic acid.
Penconazole was scheduled at the 47th session of the CCPR (2015) for periodic re-evaluation of residues by the 2016 JMPR. The Meeting received information on physical and chemical properties, metabolism and environmental fate, residue analysis, use patterns, supervised trials, processing and animal feeding studies.
IDENTITY
ISO Common name: Penconazole
Chemical name
IUPAC: (RS)-1-[2-(2,4-dicholorophenyl)pentyl]-1H-1,2,4-triazole
CAS: 1-[2-(2,4-dichlorophenyl)pentyl]-1H-1,2,4-triazole
CAS Registry number: 66246-88-6
CIPAC number: 446
Manufacturer’s code number:
CGA71818
Structural formula:
Penconazole
1812
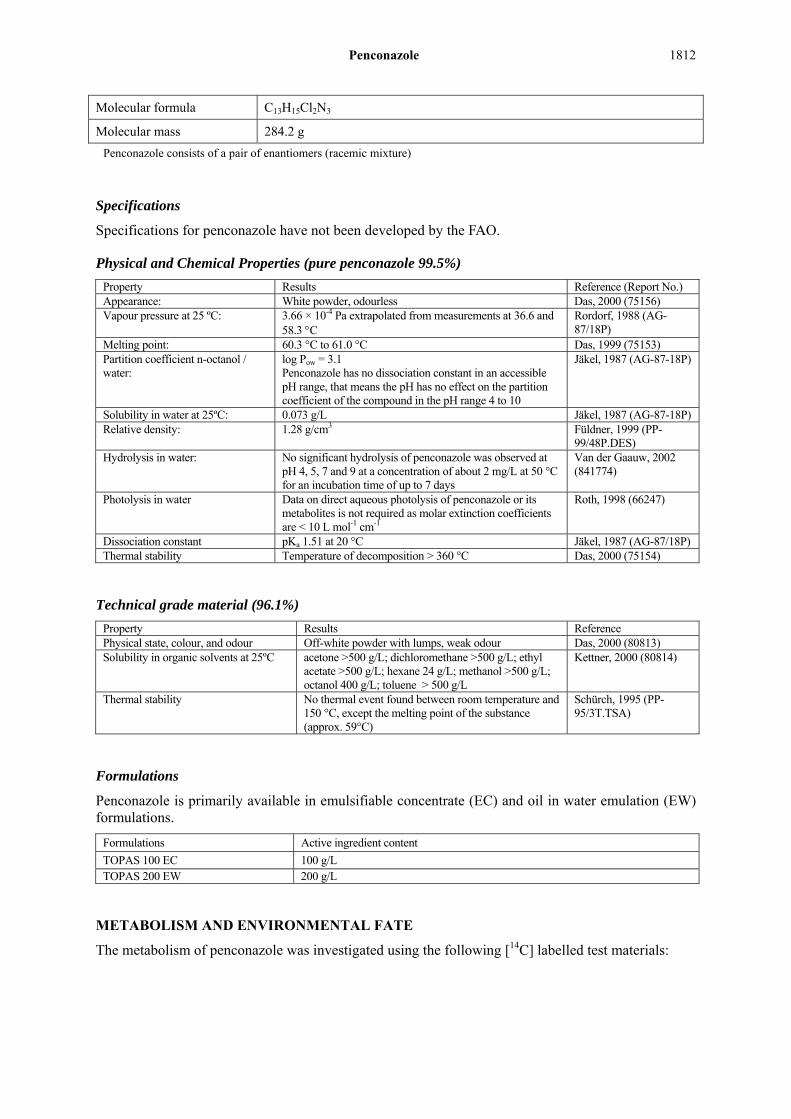
Molecular formula C13H15Cl2N3
Molecular mass 284.2 g
Penconazole consists of a pair of enantiomers (racemic mixture)
Specifications
Specifications for penconazole have not been developed by the FAO.
Physical and Chemical Properties (pure penconazole 99.5%)
Property Results Reference (Report No.) Appearance: White powder, odourless Das, 2000 (75156) Vapour pressure at 25 ºC: 3.66 × 10⁻⁴ Pa extrapolated from measurements at 36.6 and
58.3 C Rordorf, 1988 (AG-87/18P)
Melting point: 60.3 °C to 61.0 °C Das, 1999 (75153) Partition coefficient n-octanol / water:
log Pow = 3.1 Penconazole has no dissociation constant in an accessible pH range, that means the pH has no effect on the partition coefficient of the compound in the pH range 4 to 10
Jäkel, 1987 (AG-87-18P)
Solubility in water at 25ºC: 0.073 g/L Jäkel, 1987 (AG-87-18P) Relative density: 1.28 g/cm3 Füldner, 1999 (PP-
99/48P.DES) Hydrolysis in water: No significant hydrolysis of penconazole was observed at
pH 4, 5, 7 and 9 at a concentration of about 2 mg/L at 50 °C for an incubation time of up to 7 days
Van der Gaauw, 2002 (841774)
Photolysis in water Data on direct aqueous photolysis of penconazole or its metabolites is not required as molar extinction coefficients are < 10 L mol-1 cm-1
Roth, 1998 (66247)
Dissociation constant pKa 1.51 at 20 °C Jäkel, 1987 (AG-87/18P) Thermal stability Temperature of decomposition > 360 °C Das, 2000 (75154)
Technical grade material (96.1%)
Property Results Reference Physical state, colour, and odour Off-white powder with lumps, weak odour Das, 2000 (80813) Solubility in organic solvents at 25ºC acetone >500 g/L; dichloromethane >500 g/L; ethyl
acetate >500 g/L; hexane 24 g/L; methanol >500 g/L; octanol 400 g/L; toluene > 500 g/L
Kettner, 2000 (80814)
Thermal stability No thermal event found between room temperature and 150 °C, except the melting point of the substance (approx. 59°C)
Schürch, 1995 (PP-95/3T.TSA)
Formulations
Penconazole is primarily available in emulsifiable concentrate (EC) and oil in water emulation (EW) formulations.
Formulations Active ingredient content
TOPAS 100 EC 100 g/L TOPAS 200 EW 200 g/L
METABOLISM AND ENVIRONMENTAL FATE
The metabolism of penconazole was investigated using the following [14C] labelled test materials:

Penconazole
1813
Phenyl labelled (*) Penconazole Triazole labelled (*) Penconazole
The chemical names and structures of the major degradation compounds arising from the metabolism of penconazole are presented in Table 1.
Table 1 Degradation compounds from metabolism of penconazole in plants, animals and environment
Compound code/Abbreviation
Chemical name Structure Found in:
CGA71818 Penconazole; (RS)-1-[2-(2,4-dicholorophenyl)pentyl]-1H-1,2,4-triazole; 1-[2-(2,4-dichlorophenyl)pentyl]-1H-1,2,4-triazole
Primary crops Rotational crops (traces)
CGA132465 (a mixture of two diastereoisomers CGA132465a, CGA132465b)
4-(2,4-dichloro-phenyl)-5-[1,2,4]triazol-1-yl-pentan-2-ol
Grape, Tomato, Apple, Rotational crops
CGA127841 4-(2,4-dichloro-phenyl)-5-[1,2,4]triazol-1-yl-pentan-1-ol
Grape, Tomato, Apple, Rotational crops
CGA190503 4-(2,4-dichloro-phenyl)-5-[1,2,4]triazol-1-yl-pentan-3-ol
Cl
Cl
N
N
N
OH
Tomato

Penconazole
1814
Compound code/Abbreviation
Chemical name Structure Found in:
CGA131013 (TA)
2-amino-3-(1H-1,2,4 triazol-1-yl)propanoic acid; 3-(1H-1,2,4-triazol-1-yl)-D,L-alanine; Triazole alanine
Grape, Tomato, Apple, Wheat, Radish, Lettuce, Rotational crops
CGA142856 (TAA)
1H-1,2,4-triazol-1-yl-acetic acid; Triazole acetic acid
Grape, Tomato, Apple, Wheat, Radish, Lettuce, Rotational crops
CGA205369 (TLA)
2-hydroxy-3-[1,2,4]triazol-1-yl-propionic acid; Triazole lactic acid
Grape, Tomato, Apple, Wheat, Radish, Lettuce, Rotational crops
CGA71019 (1,2,4-Triazole)
1H-1,2,4-triazole
Tomato, Wheat, Radish, Rotational crops
CGA91304 2-(2,4-dichlorophenyl)-1-(1H-1,2,4-triazol-1-yl) ethanone
Apple
CGA91305 2-(2,4-dichlorophenyl)-1-(1H-1,2,4-triazol-1-yl) ethanol
Apple

Penconazole
1815
Compound code/Abbreviation
Chemical name Structure Found in:
CGA189659 2-(2,4-dichloro-phenyl)-3-[1,2,4]triazol-1-yl-propan-1-ol
Apple
CGA179944 2-(2,4-dichloro-phenyl)-3-[1,2,4]triazol-1-yl-propionic acid
Rotational crops
CGA 177279 4-(2,4-dichloro-phenyl)-5-[1,2,4]triazol-1-yl-pentanoic acid
Goat
CGA 177281 4-(2,4-dichloro-phenyl)-2-hydroxy-5-[1,2,4]triazol-1-yl-pentanoic acid
Goat
CGA 177280 3-(2,4-dichloro-phenyl)-4-[1,2,4]triazol-1-yl-butyric acid
Goat

Penconazole
1816
Plant metabolism
Grape
Study 1
The metabolic behaviour of 14C-penconazole was investigated in field grown grape vine and fruit (Blattman, P., 1982; Report No. 7/82). A plot of four plants (var., Riesling X Sylvaner) in Sisseln, Switzerland was treated four times with [14C-triazole] penconazole (EC 100) until run off, at a rate of 5 g ai/hL (0.02–0.05 kg ai/ha, assuming 400–1000 L/ha of spray volume). Spraying took place at 14 to 18 day intervals under the same conditions as recommend for commercial practice. Spray volume per plant was each 175, 200, 250 and 300 mL. The vines (whole grapes and leaves) at maturity were harvested once 68 days after the last application.
Total radioactive residue (TRR) levels in the samples were determined by oxidative combustion followed by liquid scintillation counting (LSC) or by direct LSC. The extracted radioactivity was analysed by TLC and HPLC.
Leaves were extracted with 80% methanol and then methanol in Soxhlet, and the extracts were partitioned with dichloromethane. The organic phase was cleaned up with Dowex 50 and silica gel. The eluted fraction was further fractionised by HPLC, treated with enzyme (cellulase) and then subjected to analysis by HPLC, MS, or NMR. The aqueous phase was hydrolysed with acid and cleaned up with XAD-4 chromatography. The resultant methanol eluate was fractionised by HPLC, treated with acid or enzymes (cellulase or β-glucosidase) and analysed by HPLC or MS; for water eluate, only radioactivity was measured.
Grapes were rinsed with water and shredded in a cutter. Grape juice was diluted with water and extracted with dichloromethane. The organic phase was analysed by TLC. The aqueous phase was hydrolysed with acid and cleaned up with XAD-4 chromatography. The water eluate was cleaned up using Dowex 50 and analysed by TLC for triazole alanine. The methanol eluate was not further analysed.
Grape press cake was extracted with 80% methanol and partitioned with dichloromethane. The organic phase was analysed by TLC The aqueous phase was subjected to analysis in the same way as the juice. However, the water eluate, obtained from XAD-4 chromatography after acid hydrolysis, was not analysed for triazole alanine. The results are shown in Tables 2 and 3.
Table 2 Radioactive residues in grapes and leaves following application of [14C-triazole] penconazole to grape vines on four occasions, followed by harvest 68 days post application
Component Total residuesa (mg eq/kg)
% TRR MeOH extract Water
rinse Soxhletextractc
Unextracted Total
Organic phaseb Aqueous phaseb
Whole grape 0.100 20.2 63.4 d na 16.4 100 Grape juice 0.044 2.0 33.6 na na na 35.6 Press cake 0.344 18.2 29.8 na na 16.4 64.4 Leaves 5.34 25.6 68.9 na <5 5.5 100
a Total residues expressed as penconazole equivalents b Methanol extract was partitioned with dichloromethane. The aqueous phase was hydrolysed with acid and cleaned up using an XAD-4 column for characterization. c Soxhlet extraction with methanol only for grape leaves d Grapes were rinsed with water prior to analysis, however, the radioactivity in water rinse was not analysed.
na: not applicable
Total radioactive residues (TRRs) in whole grape and leaves were 0.100 mg eq/kg and 5.34 mg eq/kg, respectively. TRRs in grape comprised 36% from juice and 64% from press cake. Methanol extraction recovered 84% of the TRR in grape.
Penconazole
1817
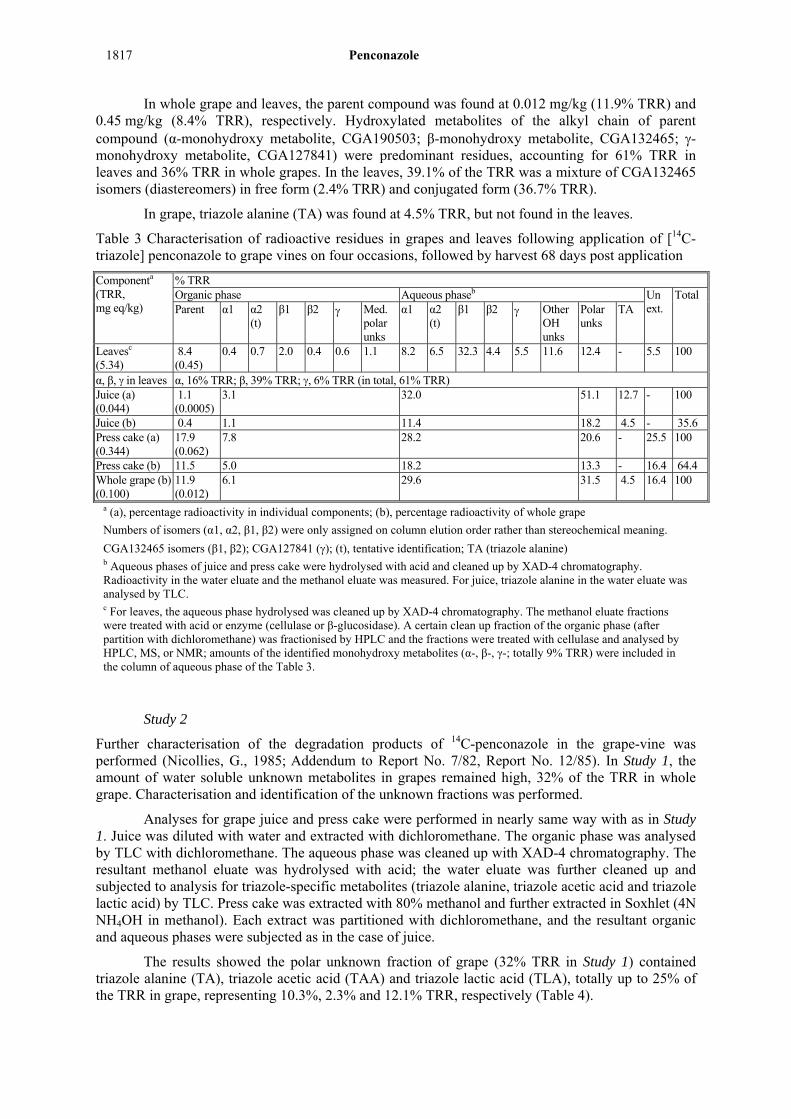
In whole grape and leaves, the parent compound was found at 0.012 mg/kg (11.9% TRR) and 0.45 mg/kg (8.4% TRR), respectively. Hydroxylated metabolites of the alkyl chain of parent compound (α-monohydroxy metabolite, CGA190503; β-monohydroxy metabolite, CGA132465; -monohydroxy metabolite, CGA127841) were predominant residues, accounting for 61% TRR in leaves and 36% TRR in whole grapes. In the leaves, 39.1% of the TRR was a mixture of CGA132465 isomers (diastereomers) in free form (2.4% TRR) and conjugated form (36.7% TRR).
In grape, triazole alanine (TA) was found at 4.5% TRR, but not found in the leaves.
Table 3 Characterisation of radioactive residues in grapes and leaves following application of [14C-triazole] penconazole to grape vines on four occasions, followed by harvest 68 days post application
Componenta (TRR, mg eq/kg)
% TRR Organic phase Aqueous phaseb Un
ext. Total
Parent α1 α2 (t)
β1 β2 Med.polar unks
α1 α2(t)
β1 β2 Other OH unks
Polar unks
TA
Leavesc (5.34)
8.4 (0.45)
0.4 0.7 2.0 0.4 0.6 1.1 8.2 6.5 32.3 4.4 5.5 11.6 12.4 - 5.5 100
α, β, in leaves α, 16% TRR; β, 39% TRR; , 6% TRR (in total, 61% TRR) Juice (a) (0.044)
1.1 (0.0005)
3.1 32.0 51.1 12.7 - 100
Juice (b) 0.4 1.1 11.4 18.2 4.5 - 35.6 Press cake (a) (0.344)
17.9 (0.062)
7.8 28.2 20.6 - 25.5 100
Press cake (b) 11.5 5.0 18.2 13.3 - 16.4 64.4 Whole grape (b) (0.100)
11.9 (0.012)
6.1 29.6 31.5 4.5 16.4 100
a (a), percentage radioactivity in individual components; (b), percentage radioactivity of whole grape
Numbers of isomers (α1, α2, β1, β2) were only assigned on column elution order rather than stereochemical meaning.
CGA132465 isomers (β1, β2); CGA127841 (); (t), tentative identification; TA (triazole alanine) b Aqueous phases of juice and press cake were hydrolysed with acid and cleaned up by XAD-4 chromatography. Radioactivity in the water eluate and the methanol eluate was measured. For juice, triazole alanine in the water eluate was analysed by TLC. c For leaves, the aqueous phase hydrolysed was cleaned up by XAD-4 chromatography. The methanol eluate fractions were treated with acid or enzyme (cellulase or β-glucosidase). A certain clean up fraction of the organic phase (after partition with dichloromethane) was fractionised by HPLC and the fractions were treated with cellulase and analysed by HPLC, MS, or NMR; amounts of the identified monohydroxy metabolites (α-, β-, γ-; totally 9% TRR) were included in the column of aqueous phase of the Table 3.
Study 2
Further characterisation of the degradation products of 14C-penconazole in the grape-vine was performed (Nicollies, G., 1985; Addendum to Report No. 7/82, Report No. 12/85). In Study 1, the amount of water soluble unknown metabolites in grapes remained high, 32% of the TRR in whole grape. Characterisation and identification of the unknown fractions was performed.
Analyses for grape juice and press cake were performed in nearly same way with as in Study 1. Juice was diluted with water and extracted with dichloromethane. The organic phase was analysed by TLC with dichloromethane. The aqueous phase was cleaned up with XAD-4 chromatography. The resultant methanol eluate was hydrolysed with acid; the water eluate was further cleaned up and subjected to analysis for triazole-specific metabolites (triazole alanine, triazole acetic acid and triazole lactic acid) by TLC. Press cake was extracted with 80% methanol and further extracted in Soxhlet (4N NH4OH in methanol). Each extract was partitioned with dichloromethane, and the resultant organic and aqueous phases were subjected as in the case of juice.
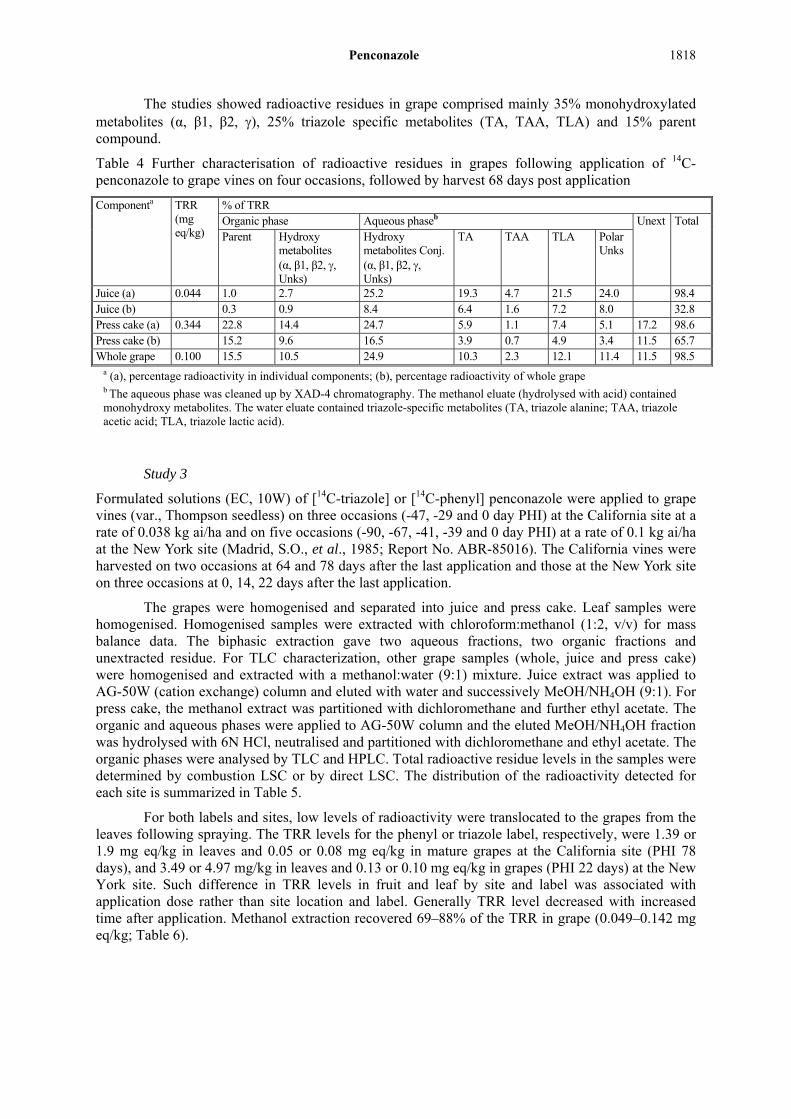
The results showed the polar unknown fraction of grape (32% TRR in Study 1) contained triazole alanine (TA), triazole acetic acid (TAA) and triazole lactic acid (TLA), totally up to 25% of the TRR in grape, representing 10.3%, 2.3% and 12.1% TRR, respectively (Table 4).
Penconazole
1818
The studies showed radioactive residues in grape comprised mainly 35% monohydroxylated metabolites (α, β1, β2, ), 25% triazole specific metabolites (TA, TAA, TLA) and 15% parent compound.
Table 4 Further characterisation of radioactive residues in grapes following application of 14C-penconazole to grape vines on four occasions, followed by harvest 68 days post application
Componenta TRR (mg eq/kg)
% of TRR Organic phase Aqueous phaseb Unext TotalParent Hydroxy
metabolites (α, β1, β2, , Unks)
Hydroxy metabolites Conj. (α, β1, β2, , Unks)
TA TAA TLA Polar Unks
Juice (a) 0.044 1.0 2.7 25.2 19.3 4.7 21.5 24.0 98.4 Juice (b) 0.3 0.9 8.4 6.4 1.6 7.2 8.0 32.8 Press cake (a) 0.344 22.8 14.4 24.7 5.9 1.1 7.4 5.1 17.2 98.6 Press cake (b) 15.2 9.6 16.5 3.9 0.7 4.9 3.4 11.5 65.7 Whole grape 0.100 15.5 10.5 24.9 10.3 2.3 12.1 11.4 11.5 98.5
a (a), percentage radioactivity in individual components; (b), percentage radioactivity of whole grape b The aqueous phase was cleaned up by XAD-4 chromatography. The methanol eluate (hydrolysed with acid) contained monohydroxy metabolites. The water eluate contained triazole-specific metabolites (TA, triazole alanine; TAA, triazole acetic acid; TLA, triazole lactic acid).
Study 3
Formulated solutions (EC, 10W) of [14C-triazole] or [14C-phenyl] penconazole were applied to grape vines (var., Thompson seedless) on three occasions (-47, -29 and 0 day PHI) at the California site at a rate of 0.038 kg ai/ha and on five occasions (-90, -67, -41, -39 and 0 day PHI) at a rate of 0.1 kg ai/ha at the New York site (Madrid, S.O., et al., 1985; Report No. ABR-85016). The California vines were harvested on two occasions at 64 and 78 days after the last application and those at the New York site on three occasions at 0, 14, 22 days after the last application.
The grapes were homogenised and separated into juice and press cake. Leaf samples were homogenised. Homogenised samples were extracted with chloroform:methanol (1:2, v/v) for mass balance data. The biphasic extraction gave two aqueous fractions, two organic fractions and unextracted residue. For TLC characterization, other grape samples (whole, juice and press cake) were homogenised and extracted with a methanol:water (9:1) mixture. Juice extract was applied to AG-50W (cation exchange) column and eluted with water and successively MeOH/NH4OH (9:1). For press cake, the methanol extract was partitioned with dichloromethane and further ethyl acetate. The organic and aqueous phases were applied to AG-50W column and the eluted MeOH/NH4OH fraction was hydrolysed with 6N HCl, neutralised and partitioned with dichloromethane and ethyl acetate. The organic phases were analysed by TLC and HPLC. Total radioactive residue levels in the samples were determined by combustion LSC or by direct LSC. The distribution of the radioactivity detected for each site is summarized in Table 5.
For both labels and sites, low levels of radioactivity were translocated to the grapes from the leaves following spraying. The TRR levels for the phenyl or triazole label, respectively, were 1.39 or 1.9 mg eq/kg in leaves and 0.05 or 0.08 mg eq/kg in mature grapes at the California site (PHI 78 days), and 3.49 or 4.97 mg/kg in leaves and 0.13 or 0.10 mg eq/kg in grapes (PHI 22 days) at the New York site. Such difference in TRR levels in fruit and leaf by site and label was associated with application dose rather than site location and label. Generally TRR level decreased with increased time after application. Methanol extraction recovered 69–88% of the TRR in grape (0.049–0.142 mg eq/kg; Table 6).

Penconazole
1819
Table 5 Radioactive residues in grapes and leaves following application of 14C-penconazole to grape vines in California and New York sites
Harvest number
Days after last application
Component Total residues (mg eq/kg)
% of Total radioactivity Organic Aqueous Unextracted
California site, three applications at 0.038 kg ai/ha Triazole label 1 0 Leaves 8.07 58 25 9 2 64 Leaves 2.50 21 51 15 2 64 Grapes 0.04 - - -
3 78 Leaves 1.90 40 54 19
3 78 Grapes 0.08 47 56 12 Phenyl label 1 0 Leaves 8.64 61 23 9 2 64 Leaves 3.35 23 51 14 2 64 Grapes 0.03 - - - 3 78 Leaves 1.39 34 59 16 3 78 Grapes 0.05 42 52 15 New York site, five applications at 0.10 kg ai/ha Triazole label 1 0 Leaves 12.58 90 21 5 2 14 Leaves 5.09 49 57 9 2 14 Grapes 0.12 52 39 19 3 22 Leaves 4.97 32 44 10 3 22 Grapes 0.10 55 38 17 Phenyl label 1 0 Leaves 10.53 64 20 5 2 14 Leaves 3.53 31 51 10 2 14 Grapes 0.08 52 27 13 3 22 Leaves 3.49 29 46 10 3 22 Grapes 0.13 53 38 21
Table 6 Extractability of 14C-penconazole from grape fruit
New York California Triazole label Phenyl label Triazole label
Days after last application 22 14 22 78
TRR (mg eq/kg) 0.142 0.080 0.121 0.049
% Total radioactivity in grapes
Extraction
MeOH:H2O 69 82 75 88
Unextracted residue 21 26 27 17
Total 90 108 102 105
Table 7 Characterisation of radioactive residues in grapes by TLC following application of 14C-penconazole to grape vines at New York and California sites
New York California Triazole label Phenyl label Triazole
label Days PHI 22 14 22 78 (mature
tomato) TRR, mg eq/kga 0.142 0.080 0.121 0.049 % Total radioactivity in grapes Whole Grapes Parent 23 38 29 11 Alcohols (CGA127841 & CGA132465) 5 10 8 14 Unk non-polar 10 7 7 19 Total, after acid hydrolysis 38 55 44 44 Unk polar 26 7 16 32b
Penconazole
1820
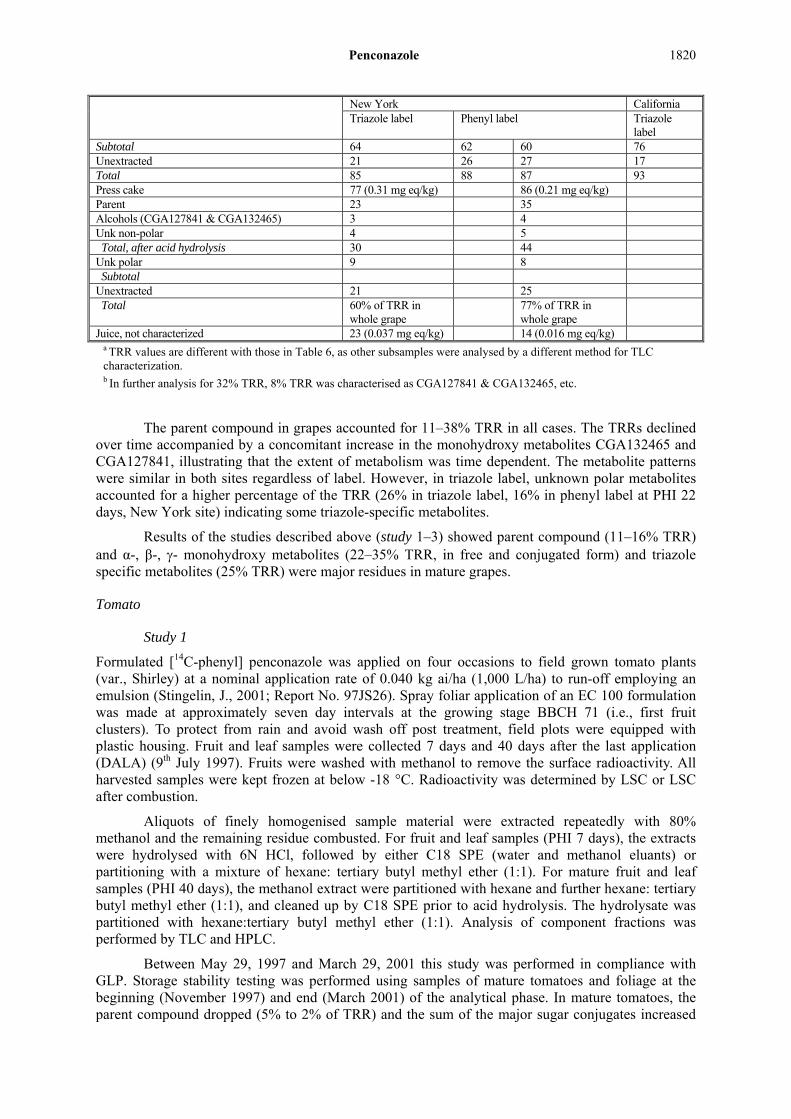
New York California Triazole label Phenyl label Triazole
label Subtotal 64 62 60 76 Unextracted 21 26 27 17 Total 85 88 87 93 Press cake 77 (0.31 mg eq/kg) 86 (0.21 mg eq/kg) Parent 23 35 Alcohols (CGA127841 & CGA132465) 3 4 Unk non-polar 4 5 Total, after acid hydrolysis 30 44 Unk polar 9 8 Subtotal Unextracted 21 25 Total 60% of TRR in
whole grape 77% of TRR in
whole grape
Juice, not characterized 23 (0.037 mg eq/kg) 14 (0.016 mg eq/kg) a TRR values are different with those in Table 6, as other subsamples were analysed by a different method for TLC characterization.
b In further analysis for 32% TRR, 8% TRR was characterised as CGA127841 & CGA132465, etc.
The parent compound in grapes accounted for 11–38% TRR in all cases. The TRRs declined over time accompanied by a concomitant increase in the monohydroxy metabolites CGA132465 and CGA127841, illustrating that the extent of metabolism was time dependent. The metabolite patterns were similar in both sites regardless of label. However, in triazole label, unknown polar metabolites accounted for a higher percentage of the TRR (26% in triazole label, 16% in phenyl label at PHI 22 days, New York site) indicating some triazole-specific metabolites.
Results of the studies described above (study 1–3) showed parent compound (11–16% TRR) and α-, β-, - monohydroxy metabolites (22–35% TRR, in free and conjugated form) and triazole specific metabolites (25% TRR) were major residues in mature grapes.
Tomato
Study 1
Formulated [14C-phenyl] penconazole was applied on four occasions to field grown tomato plants (var., Shirley) at a nominal application rate of 0.040 kg ai/ha (1,000 L/ha) to run-off employing an emulsion (Stingelin, J., 2001; Report No. 97JS26). Spray foliar application of an EC 100 formulation was made at approximately seven day intervals at the growing stage BBCH 71 (i.e., first fruit clusters). To protect from rain and avoid wash off post treatment, field plots were equipped with plastic housing. Fruit and leaf samples were collected 7 days and 40 days after the last application (DALA) (9th July 1997). Fruits were washed with methanol to remove the surface radioactivity. All harvested samples were kept frozen at below -18 °C. Radioactivity was determined by LSC or LSC after combustion.
Aliquots of finely homogenised sample material were extracted repeatedly with 80% methanol and the remaining residue combusted. For fruit and leaf samples (PHI 7 days), the extracts were hydrolysed with 6N HCl, followed by either C18 SPE (water and methanol eluants) or partitioning with a mixture of hexane: tertiary butyl methyl ether (1:1). For mature fruit and leaf samples (PHI 40 days), the methanol extract were partitioned with hexane and further hexane: tertiary butyl methyl ether (1:1), and cleaned up by C18 SPE prior to acid hydrolysis. The hydrolysate was partitioned with hexane:tertiary butyl methyl ether (1:1). Analysis of component fractions was performed by TLC and HPLC.
Between May 29, 1997 and March 29, 2001 this study was performed in compliance with GLP. Storage stability testing was performed using samples of mature tomatoes and foliage at the beginning (November 1997) and end (March 2001) of the analytical phase. In mature tomatoes, the parent compound dropped (5% to 2% of TRR) and the sum of the major sugar conjugates increased
Penconazole
1821
(55% to 65% of TRR). In foliage, the parent compound was < 0.1% of TRR to 3% of TRR and major sugar conjugates were 76% to 73% of TRR. Such changes did not impact the evaluation for the metabolic profiles.
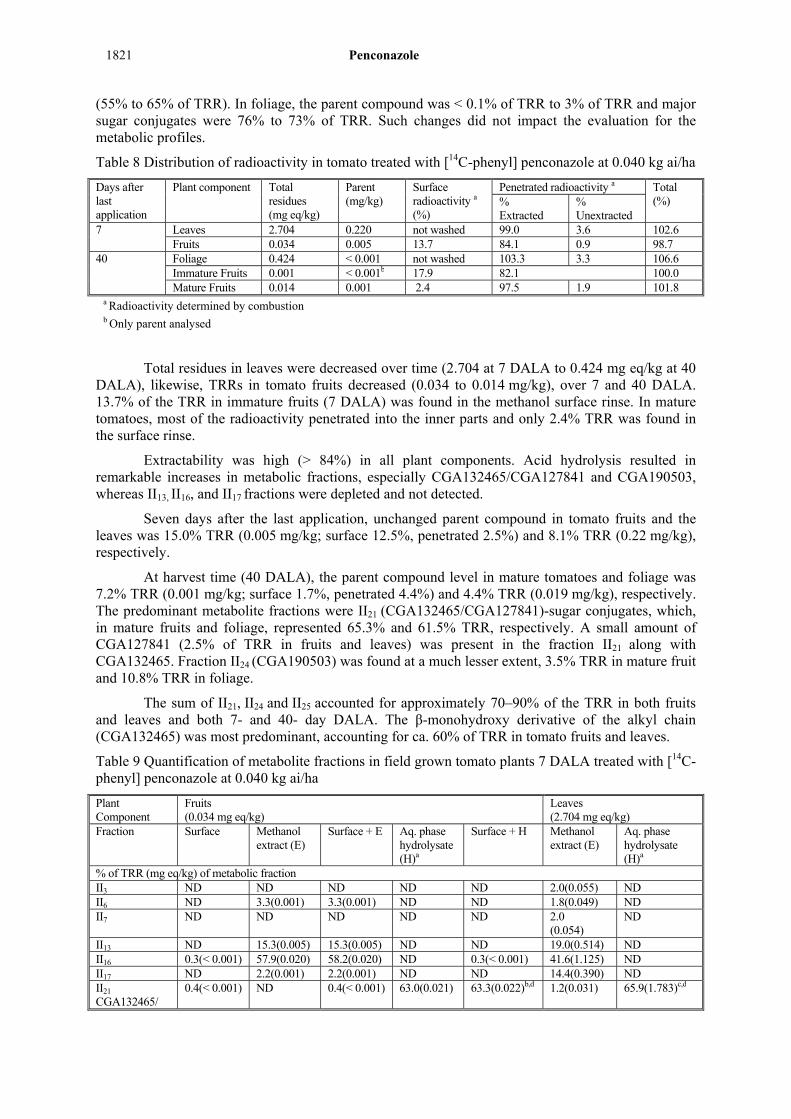
Table 8 Distribution of radioactivity in tomato treated with [14C-phenyl] penconazole at 0.040 kg ai/ha
Days after last application
Plant component Total residues (mg eq/kg)
Parent (mg/kg)
Surface radioactivity a (%)
Penetrated radioactivity a Total (%) %
Extracted %
Unextracted 7 Leaves 2.704 0.220 not washed 99.0 3.6 102.6
Fruits 0.034 0.005 13.7 84.1 0.9 98.7 40 Foliage 0.424 < 0.001 not washed 103.3 3.3 106.6
Immature Fruits 0.001 < 0.001b 17.9 82.1 100.0 Mature Fruits 0.014 0.001 2.4 97.5 1.9 101.8
a Radioactivity determined by combustion b Only parent analysed
Total residues in leaves were decreased over time (2.704 at 7 DALA to 0.424 mg eq/kg at 40 DALA), likewise, TRRs in tomato fruits decreased (0.034 to 0.014 mg/kg), over 7 and 40 DALA. 13.7% of the TRR in immature fruits (7 DALA) was found in the methanol surface rinse. In mature tomatoes, most of the radioactivity penetrated into the inner parts and only 2.4% TRR was found in the surface rinse.
Extractability was high (> 84%) in all plant components. Acid hydrolysis resulted in remarkable increases in metabolic fractions, especially CGA132465/CGA127841 and CGA190503, whereas II13, II16, and II17 fractions were depleted and not detected.
Seven days after the last application, unchanged parent compound in tomato fruits and the leaves was 15.0% TRR (0.005 mg/kg; surface 12.5%, penetrated 2.5%) and 8.1% TRR (0.22 mg/kg), respectively.
At harvest time (40 DALA), the parent compound level in mature tomatoes and foliage was 7.2% TRR (0.001 mg/kg; surface 1.7%, penetrated 4.4%) and 4.4% TRR (0.019 mg/kg), respectively. The predominant metabolite fractions were II21 (CGA132465/CGA127841)-sugar conjugates, which, in mature fruits and foliage, represented 65.3% and 61.5% TRR, respectively. A small amount of CGA127841 (2.5% of TRR in fruits and leaves) was present in the fraction II21 along with CGA132465. Fraction II24 (CGA190503) was found at a much lesser extent, 3.5% TRR in mature fruit and 10.8% TRR in foliage.
The sum of II21, II24 and II25 accounted for approximately 70–90% of the TRR in both fruits and leaves and both 7- and 40- day DALA. The β-monohydroxy derivative of the alkyl chain (CGA132465) was most predominant, accounting for ca. 60% of TRR in tomato fruits and leaves.
Table 9 Quantification of metabolite fractions in field grown tomato plants 7 DALA treated with [14C-phenyl] penconazole at 0.040 kg ai/ha
Plant Component
Fruits (0.034 mg eq/kg)
Leaves (2.704 mg eq/kg)
Fraction Surface Methanol extract (E)
Surface + E Aq. phase hydrolysate (H)a
Surface + H Methanol extract (E)
Aq. phase hydrolysate (H)a
% of TRR (mg eq/kg) of metabolic fraction II3 ND ND ND ND ND 2.0(0.055) ND II6 ND 3.3(0.001) 3.3(0.001) ND ND 1.8(0.049) ND II7 ND ND ND ND ND 2.0
(0.054) ND
II13 ND 15.3(0.005) 15.3(0.005) ND ND 19.0(0.514) ND II16 0.3(< 0.001) 57.9(0.020) 58.2(0.020) ND 0.3(< 0.001) 41.6(1.125) ND II17 ND 2.2(0.001) 2.2(0.001) ND ND 14.4(0.390) ND II21
CGA132465/ 0.4(< 0.001) ND 0.4(< 0.001) 63.0(0.021) 63.3(0.022)b,d 1.2(0.031) 65.9(1.783)c,d

Penconazole
1822
Plant Component
Fruits (0.034 mg eq/kg)
Leaves (2.704 mg eq/kg)
Fraction Surface Methanol extract (E)
Surface + E Aq. phase hydrolysate (H)a
Surface + H Methanol extract (E)
Aq. phase hydrolysate (H)a
CGA127841 II24CGA190503 0.3(< 0.001) ND 0.3(< 0.001) 2.9(0.001) 3.2(0.001) 0.6(0.017) 16.4(0.444) II25 Parent 12.5(0.004) 2.5(0.001) 15.0(0.005) 2.6(0.001) 15.1(0.005) 8.1(0.220) 7.8(0.210) II25a ND ND ND 8.0 (0.003) 8.0 (0.003) ND ND Unretained 0.2(< 0.001) 2.9(0.001) 3.1(0.001) 7.7(0.003) 7.9(0.003) 8.2 (0.221) 8.9(0.240) Subtotal 13.7(0.005) 84.1(0.029) 97.8(0.033) 84.1 (0.029) 97.8(0.033) 99.0(2.677) 99.0(2.677) Non extractable - 0.9(< 0.001) 0.9(< 0.001) 0.9
(< 0.001) 0.9(< 0.001) 3.6(0.097) 3.6(0.097)
Total 13.7(0.005) 85.0(0.029) 98.7(0.034) 85.0 (0.029) 98.7(0.034) 102.6(2.775) 102.6(2.774) Accountability 81.6
(II21+II24+II25) 90.1
(II21+II24+II25) a Acid hydrolysis of the aqueous phase obtained from partitioning of crude methanol extract with organic solvents b CGA132465(a): CGA132465(b)=1:1 c CGA132465(a):CGA132465(b)=1.4:1 d Including II21, II24 or II25 , determined in the surface radioactivity and/or in methanol extract (E)
Table 10 Quantification of metabolite fractions in field grown tomato plants 40 DALA treated with [14C-phenyl] penconazole at 0.040 kg ai/ha
Plant component Fruits (TRR: 0.014 mg eq/kg)
Leaves (TRR: 0.424 mg eq/kg)
Fraction Surface Methanol extract (E)
Surface + E Aq. phase hydrolysate (H)a
Surface + H Methanol extract (E)
Aq. phase hydrolysate (H)a
% of TRR (mg eq/kg) of metabolic fraction II1 ND 5.3(0.001) 5.3(0.001) ND ND 1.0(0.004) ND II3 0.1(< 0.001) 0.8(< 0.001) 0.9(< 0.001) ND 0.1(< 0.001) 4.5(0.019) ND II4 ND ND ND ND ND ND II6 14.7(0.002) 14.7(0.002) ND ND 4.8(0.021) ND II7 7.8(0.001) 7.8(0.001) ND ND 3.2(0.014) ND II9 ND ND ND ND ND 2.8(0.012) ND II10 ND 5.4(0.001) 5.4(0.001) ND ND ND ND II13 <0.1(< 0.001) 27.8(0.004) 27.8(0.004) ND <0.1(< 0.001) 35.8(0.152) ND II16 0.1(< 0.001) ND 0.1(< 0.001) ND ND(< 0.001) 25.3(0.107) ND II16a ND ND ND ND ND 4.8(0.020) ND II16b ND 14.7(0.002) 14.7(0.002) ND ND 4.2(0.018) ND II17 <0.1(< 0.001) 6.6(0.001) 6.7(0.001) ND <0.1(< 0.001) 8.1(0.034) ND II21
CGA132465/CGA127841 0.1(< 0.001) ND 0.1(< 0.001) 65.2(0.009) 65.3(0.009)b,d 0.1(< 0.001) 61.5(0.261)c,d
II24CGA190503 0.1(< 0.001) ND 0.1(< 0.001) 3.4(< 0.001) 3.5(< 0.001)d ND 10.8(0.046)d II25 Parent 1.7(< 0.001) 4.4(0.001) 6.1(0.001) 1.1(< 0.001) 7.2(0.001)d 4.2(< 0.0178)e 0.2(0.002)d Unretained 0.2(< 0.001) 5.5(0.001) 5.8(0.001) 2.1(< 0.001) 2.3(< 0.001) 8.5(0.036) 2.0(0.009) Subtotal 2.4(< 0.001) 93.2(0.013) 95.6(0.013) 71.8(0.010) 78.6(0.011) 103.3(0.438) 74.6(0.316) Unextracted - 1.9(< 0.001) 1.9(< 0.001) 1.9( < 0.001) 1.9(< 0.001) 3.3(0.014) 3.3(0.014) Total 2.4(< 0.001) 95.1(0.014) 97.5(0.014) 73.7(0.010) 80.5(0.011) 106.6(0.452) 77.9(0.330) Accountability 76.1
(II21+II24+II25) 72.6
(II21+II24+II25)
a Acid hydrolysis of the aqueous phase obtained from partitioning of crude methanol extract with organic solvents b CGA132465 (a) : CGA127841 : CGA132465 (b) = 11.5:1:11.7 c CGA132465 (a) : CGA127841 : CGA132465 (b) = 12.6:1:17.8 d Including II21, II24 or II25, determined in the surface radioactivity and/or in methanol extract (E) e In leaves, the value was obtained from the organic phase partitioned.

Penconazole
1823
Study 2
The metabolism study of [C14-triazole] penconazole in field grown tomato plants (Stingelin, J., 2001; Report No. 97JS25) was performed in parallel with the [C14-phenyl] study described above. Experimental methods in the field phase were the same as described in Study 1, and additionally, an
overdose experiment with a 5xapplication rate of 0.20 kg ai/ha was run and harvested only 40 DALA. Extraction of total residues and quantification of metabolite fractions were also similar to those of Study 1. However, for mature tomato and foliage, further analysis was performed to characterize water-soluble metabolites. That is, samples were rinsed with methanol and extracted with 80% methanol. The methanol extract was partitioned with hexane and further with hexane:tert-butyl methyl ether (1:1, v/v). The water phase was cleaned up by C18 SPE and the resultant methanol eluate was hydrolysed with acid. The received water eluate was cleaned up using Dowed 50w and the eluate fraction (eluted with methanol:NH3conc., 9:1, v/v) was analysed by TLC. Metabolites, CGA 132465 and CGA 190503, were elucidated by LC-MS and NMR. All harvested samples used for analysis were stored frozen at ≤-18 °C.
A storage stability test was performed with mature tomatoes and foliage from the 1× treatment experiment. Crude extracts (initial methanol extracts) were analysed at the beginning (November 1997) and at the end (March 2001) of the analytical phase. The parent compound and the sum of sugar conjugates in mature tomatoes dropped over time from 9% to 2% of TRR and from 52% to 48% of TRR, respectively. For foliage, the amount of parent compound did not change over time as about 4% of TRR and the sum of the major conjugates amounted to from 68% to 79% of TRR. Such changes on the TRRs did not impact the evaluation for the metabolic profiles. Hydrolysis of the crude extracts showed the initial aglycones pattern.
Distribution of radioactivity in tomato plants is shown in Table 11. Quantification and characterisation of components are shown in Tables 12–15.
Total residues in leaves decreased from 3.939 mg eq/kg (PHI 7 days) to 0.672 mg eq/kg (PHI 40 days). In tomato fruits the total residues decreased from 0.071 mg eq/kg (PHI 7 days) to 0.029 mg eq/kg in mature tomatoes (PHI 40 days). The surface radioactivity of 15.5% TRR in fruits at 7 days PHI was washed off, while in mature fruits 3.1% TRR was washed off. More than 87% of the TRR in fruits and leaves was extracted. In tomatoes treated with an overdose application, the TRR levels were 0.357 mg eq/kg in mature tomatoes and 5.682 mg eg/kg in the foliage (Table 14).
Table 11 Distribution of radioactivity in tomato treated with [14C-triazole] penconazole
Days last application
Plant Component
Total Residues (mg eq/kg)
Parent (mg/kg)
Surface radioactivitya (%)
Penetrated radioactivitya Total (%) % Extracted % Unext.
0.040 kg ai/ha (1x treatment) 7 Leaves 3.939 0.383 not washed 98.7 3.9 102.6
Fruits 0.071 0.013 15.5 90.7 0.7 106.9
40 Foliage 0.672 0.025 not washed 99.8 3.4 103.2
Imma. fruits 0.004 < 0.001b 12.7 87.3 100.0
Mature fruits 0.029 0.003 3.1 109.9 1.8 114.8
0.20 kg ai/ha (5x treatment)
40 Foliage 5.682 0.562 not washed 93.2 7.5 100.7
Imma. fruits 0.026 na not washed na na na
Mature fruits 0.357 0.025 not washed 110.0 1.7 111.7
a Radioactivity determined by combustion b Only parent analysed
Penconazole
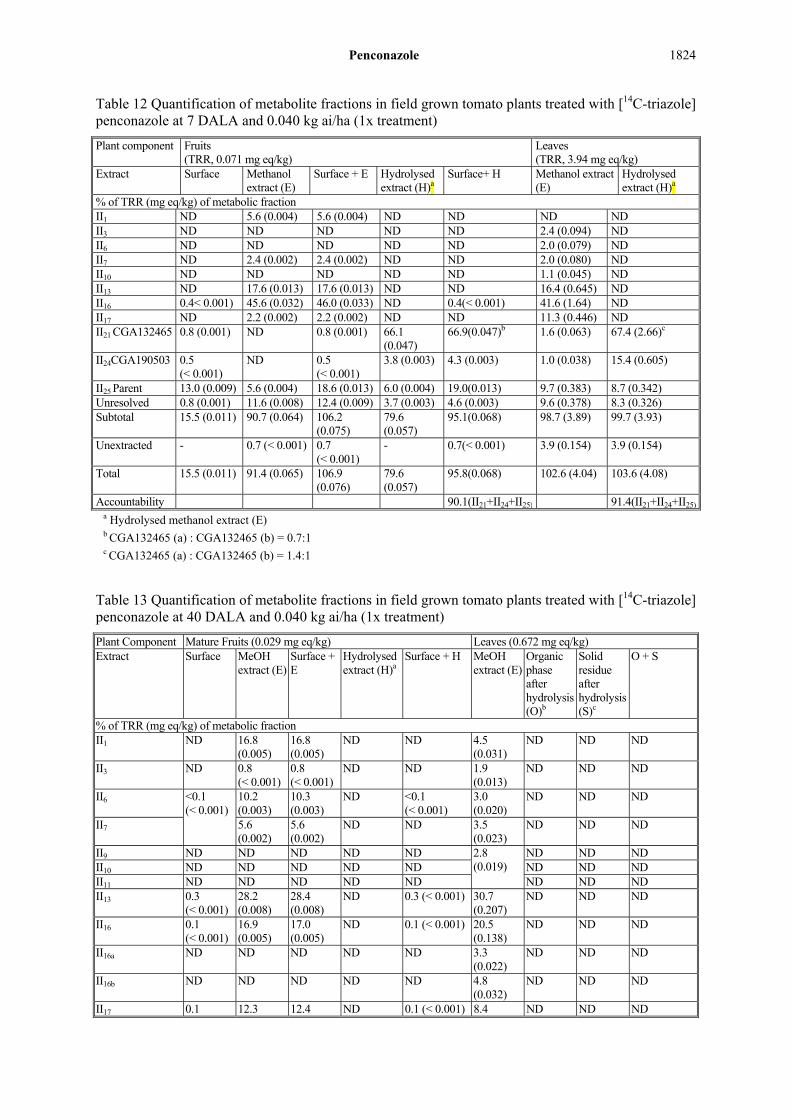
1824
Table 12 Quantification of metabolite fractions in field grown tomato plants treated with [14C-triazole] penconazole at 7 DALA and 0.040 kg ai/ha (1x treatment)
Plant component Fruits (TRR, 0.071 mg eq/kg)
Leaves (TRR, 3.94 mg eq/kg)
Extract Surface Methanol extract (E)
Surface + E Hydrolysed extract (H)a
Surface+ H Methanol extract (E)
Hydrolysed extract (H)a
% of TRR (mg eq/kg) of metabolic fraction II1 ND 5.6 (0.004) 5.6 (0.004) ND ND ND ND II3 ND ND ND ND ND 2.4 (0.094) ND II6 ND ND ND ND ND 2.0 (0.079) ND II7 ND 2.4 (0.002) 2.4 (0.002) ND ND 2.0 (0.080) ND II10 ND ND ND ND ND 1.1 (0.045) ND II13 ND 17.6 (0.013) 17.6 (0.013) ND ND 16.4 (0.645) ND II16 0.4< 0.001) 45.6 (0.032) 46.0 (0.033) ND 0.4(< 0.001) 41.6 (1.64) ND II17 ND 2.2 (0.002) 2.2 (0.002) ND ND 11.3 (0.446) ND II21 CGA132465 0.8 (0.001) ND 0.8 (0.001) 66.1
(0.047) 66.9(0.047)b 1.6 (0.063) 67.4 (2.66)c
II24CGA190503 0.5 (< 0.001)
ND 0.5 (< 0.001)
3.8 (0.003) 4.3 (0.003) 1.0 (0.038) 15.4 (0.605)
II25 Parent 13.0 (0.009) 5.6 (0.004) 18.6 (0.013) 6.0 (0.004) 19.0(0.013) 9.7 (0.383) 8.7 (0.342) Unresolved 0.8 (0.001) 11.6 (0.008) 12.4 (0.009) 3.7 (0.003) 4.6 (0.003) 9.6 (0.378) 8.3 (0.326) Subtotal 15.5 (0.011) 90.7 (0.064) 106.2
(0.075) 79.6 (0.057)
95.1(0.068) 98.7 (3.89) 99.7 (3.93)
Unextracted - 0.7 (< 0.001) 0.7 (< 0.001)
- 0.7(< 0.001) 3.9 (0.154) 3.9 (0.154)
Total 15.5 (0.011) 91.4 (0.065) 106.9 (0.076)
79.6 (0.057)
95.8(0.068) 102.6 (4.04) 103.6 (4.08)
Accountability 90.1(II21+II24+II25) 91.4(II21+II24+II25)a Hydrolysed methanol extract (E) b CGA132465 (a) : CGA132465 (b) = 0.7:1 c CGA132465 (a) : CGA132465 (b) = 1.4:1
Table 13 Quantification of metabolite fractions in field grown tomato plants treated with [14C-triazole] penconazole at 40 DALA and 0.040 kg ai/ha (1x treatment)
Plant Component Mature Fruits (0.029 mg eq/kg) Leaves (0.672 mg eq/kg) Extract Surface MeOH
extract (E) Surface + E
Hydrolysed extract (H)a
Surface + H MeOH extract (E)
Organic phase after hydrolysis (O)b
Solid residue after hydrolysis (S)c
O + S
% of TRR (mg eq/kg) of metabolic fraction II1 ND 16.8
(0.005) 16.8 (0.005)
ND ND 4.5 (0.031)
ND ND ND
II3 ND 0.8 (< 0.001)
0.8 (< 0.001)
ND ND 1.9 (0.013)
ND ND ND
II6 <0.1 (< 0.001)
10.2 (0.003)
10.3 (0.003)
ND <0.1 (< 0.001)
3.0 (0.020)
ND ND ND
II7 5.6 (0.002)
5.6 (0.002)
ND ND 3.5 (0.023)
ND ND ND
II9 ND ND ND ND ND 2.8 (0.019)
ND ND ND II10 ND ND ND ND ND ND ND ND II11 ND ND ND ND ND ND ND ND II13 0.3
(< 0.001) 28.2 (0.008)
28.4 (0.008)
ND 0.3 (< 0.001) 30.7 (0.207)
ND ND ND
II16 0.1 (< 0.001)
16.9 (0.005)
17.0 (0.005)
ND 0.1 (< 0.001) 20.5 (0.138)
ND ND ND
II16a ND ND ND ND ND 3.3 (0.022)
ND ND ND
II16b ND ND ND ND ND 4.8 (0.032)
ND ND ND
II17 0.1 12.3 12.4 ND 0.1 (< 0.001) 8.4 ND ND ND
Penconazole
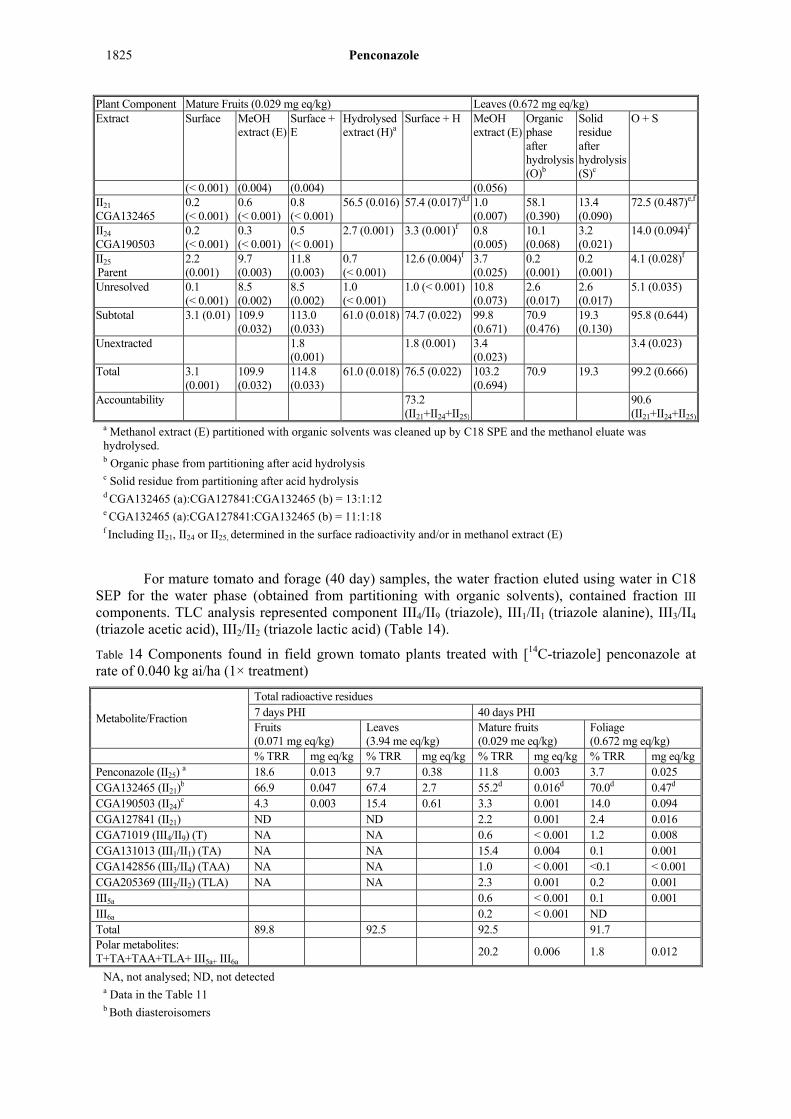
1825
Plant Component Mature Fruits (0.029 mg eq/kg) Leaves (0.672 mg eq/kg) Extract Surface MeOH
extract (E) Surface + E
Hydrolysed extract (H)a
Surface + H MeOH extract (E)
Organic phase after hydrolysis (O)b
Solid residue after hydrolysis (S)c
O + S
(< 0.001) (0.004) (0.004) (0.056) II21
CGA132465 0.2 (< 0.001)
0.6 (< 0.001)
0.8 (< 0.001)
56.5 (0.016) 57.4 (0.017)d,f 1.0 (0.007)
58.1 (0.390)
13.4 (0.090)
72.5 (0.487)e,f
II24
CGA190503 0.2 (< 0.001)
0.3 (< 0.001)
0.5 (< 0.001)
2.7 (0.001) 3.3 (0.001)f 0.8 (0.005)
10.1 (0.068)
3.2 (0.021)
14.0 (0.094)f
II25
Parent 2.2 (0.001)
9.7 (0.003)
11.8 (0.003)
0.7 (< 0.001)
12.6 (0.004)f 3.7 (0.025)
0.2 (0.001)
0.2 (0.001)
4.1 (0.028)f
Unresolved 0.1 (< 0.001)
8.5 (0.002)
8.5 (0.002)
1.0 (< 0.001)
1.0 (< 0.001) 10.8 (0.073)
2.6 (0.017)
2.6 (0.017)
5.1 (0.035)
Subtotal 3.1 (0.01) 109.9 (0.032)
113.0 (0.033)
61.0 (0.018) 74.7 (0.022) 99.8 (0.671)
70.9 (0.476)
19.3 (0.130)
95.8 (0.644)
Unextracted 1.8 (0.001)
1.8 (0.001) 3.4 (0.023)
3.4 (0.023)
Total 3.1 (0.001)
109.9 (0.032)
114.8 (0.033)
61.0 (0.018) 76.5 (0.022) 103.2 (0.694)
70.9 19.3 99.2 (0.666)
Accountability 73.2 (II21+II24+II25)
90.6 (II21+II24+II25)
a Methanol extract (E) partitioned with organic solvents was cleaned up by C18 SPE and the methanol eluate was hydrolysed. b Organic phase from partitioning after acid hydrolysis c Solid residue from partitioning after acid hydrolysis d CGA132465 (a):CGA127841:CGA132465 (b) = 13:1:12 e CGA132465 (a):CGA127841:CGA132465 (b) = 11:1:18 f Including II21, II24 or II25, determined in the surface radioactivity and/or in methanol extract (E)
For mature tomato and forage (40 day) samples, the water fraction eluted using water in C18 SEP for the water phase (obtained from partitioning with organic solvents), contained fraction III
components. TLC analysis represented component III4/II9 (triazole), III1/II1 (triazole alanine), III3/II4
(triazole acetic acid), III2/II2 (triazole lactic acid) (Table 14).
Table 14 Components found in field grown tomato plants treated with [14C-triazole] penconazole at rate of 0.040 kg ai/ha (1× treatment)
Metabolite/Fraction
Total radioactive residues 7 days PHI 40 days PHI Fruits (0.071 mg eq/kg)
Leaves (3.94 me eq/kg)
Mature fruits (0.029 me eq/kg)
Foliage (0.672 mg eq/kg)
% TRR mg eq/kg % TRR mg eq/kg % TRR mg eq/kg % TRR mg eq/kg Penconazole (II25)
a 18.6 0.013 9.7 0.38 11.8 0.003 3.7 0.025 CGA132465 (II21)
b 66.9 0.047 67.4 2.7 55.2d 0.016d 70.0d 0.47d CGA190503 (II24)
c 4.3 0.003 15.4 0.61 3.3 0.001 14.0 0.094 CGA127841 (II21) ND ND 2.2 0.001 2.4 0.016 CGA71019 (III4/II9) (T) NA NA 0.6 < 0.001 1.2 0.008 CGA131013 (III1/II1) (TA) NA NA 15.4 0.004 0.1 0.001 CGA142856 (III3/II4) (TAA) NA NA 1.0 < 0.001 <0.1 < 0.001 CGA205369 (III2/II2) (TLA) NA NA 2.3 0.001 0.2 0.001 III5a 0.6 < 0.001 0.1 0.001 III6a 0.2 < 0.001 ND Total 89.8 92.5 92.5 91.7 Polar metabolites: T+TA+TAA+TLA+ III5a+ III6a
20.2 0.006 1.8 0.012
NA, not analysed; ND, not detected a Data in the Table 11 b Both diasteroisomers
Penconazole
1826
c Only one of two possible diasteroisomers d Excluding CGA127841
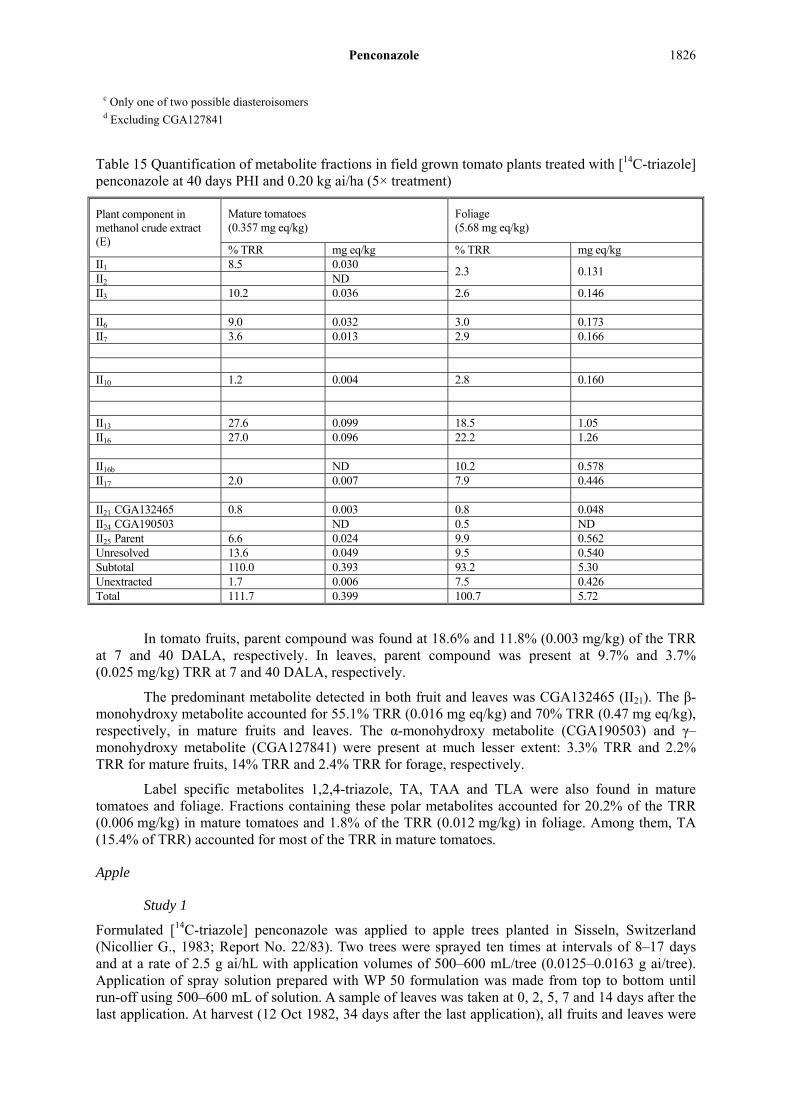
Table 15 Quantification of metabolite fractions in field grown tomato plants treated with [14C-triazole] penconazole at 40 days PHI and 0.20 kg ai/ha (5× treatment)
Plant component in methanol crude extract (E)
Mature tomatoes (0.357 mg eq/kg)
Foliage (5.68 mg eq/kg)
% TRR mg eq/kg % TRR mg eq/kg II1 8.5 0.030
2.3 0.131 II2 ND II3 10.2 0.036 2.6 0.146 II6 9.0 0.032 3.0 0.173 II7 3.6 0.013 2.9 0.166 II10 1.2 0.004 2.8 0.160 II13 27.6 0.099 18.5 1.05 II16 27.0 0.096 22.2 1.26 II16b ND 10.2 0.578 II17 2.0 0.007 7.9 0.446 II21 CGA132465 0.8 0.003 0.8 0.048 II24 CGA190503 ND 0.5 ND II25 Parent 6.6 0.024 9.9 0.562 Unresolved 13.6 0.049 9.5 0.540 Subtotal 110.0 0.393 93.2 5.30 Unextracted 1.7 0.006 7.5 0.426 Total 111.7 0.399 100.7 5.72
In tomato fruits, parent compound was found at 18.6% and 11.8% (0.003 mg/kg) of the TRR at 7 and 40 DALA, respectively. In leaves, parent compound was present at 9.7% and 3.7% (0.025 mg/kg) TRR at 7 and 40 DALA, respectively.
The predominant metabolite detected in both fruit and leaves was CGA132465 (II21). The β-monohydroxy metabolite accounted for 55.1% TRR (0.016 mg eq/kg) and 70% TRR (0.47 mg eq/kg), respectively, in mature fruits and leaves. The α-monohydroxy metabolite (CGA190503) and γ–monohydroxy metabolite (CGA127841) were present at much lesser extent: 3.3% TRR and 2.2% TRR for mature fruits, 14% TRR and 2.4% TRR for forage, respectively.
Label specific metabolites 1,2,4-triazole, TA, TAA and TLA were also found in mature tomatoes and foliage. Fractions containing these polar metabolites accounted for 20.2% of the TRR (0.006 mg/kg) in mature tomatoes and 1.8% of the TRR (0.012 mg/kg) in foliage. Among them, TA (15.4% of TRR) accounted for most of the TRR in mature tomatoes.
Apple
Study 1
Formulated [14C-triazole] penconazole was applied to apple trees planted in Sisseln, Switzerland (Nicollier G., 1983; Report No. 22/83). Two trees were sprayed ten times at intervals of 8–17 days and at a rate of 2.5 g ai/hL with application volumes of 500–600 mL/tree (0.0125–0.0163 g ai/tree). Application of spray solution prepared with WP 50 formulation was made from top to bottom until run-off using 500–600 mL of solution. A sample of leaves was taken at 0, 2, 5, 7 and 14 days after the last application. At harvest (12 Oct 1982, 34 days after the last application), all fruits and leaves were

Penconazole
1827
collected along with samples of the branches and roots. Plant samples were washed with methanol/water and homogenised prior to quantification by combustion and LSC.
Plant samples were extracted with 80% methanol followed by Soxhlet extraction in methanol. The methanol extract was partitioned with dichloromethane/water. The aqueous phase from the partition was subjected to hydrolysis with 1N HCl at 100C and subsequently partitioned with dichloromethane/water. For pulp, a portion of the aqueous phase was applied to an XAD-4 column and then the water eluate was cleaned up using Dowex-50 resin, eluting with 1M aqueous ammonia: methanol (9:1). Analysis was performed by TLC.
Total residues in the leaves at various time intervals are shown in Table 16. Radioactivity in the leaves decreased over time from 5.47 mg eq/kg (0 day) to 3.83 mg eq/kg at harvest. The surface radioactivity in leaves at day 0 accounted for 57% of the TRR, but was not found at harvest.
Table 16 Dissipation of total residues in the leaves of apple trees treated with [14C-triazole] penconazole at 34 DALA and a rate of 2.5 g ai/100 L
Days after last application Total residues (mg eq/kg) Penetrated radioactivity (mg eq/kg)
0 5.47 2.35
2 4.37 2.58
5 4.36 3.01
7 4.15 2.91
14 3.35 3.08
34 (Harvest) 3.83 3.83
Table 17 Distribution of radioactivity in various plant parts of apple trees treated with [14C-triazole] penconazole at 34 DALA and a rate of 2.5 g ai/hL
Plant component
Total residues (mg eq/kg)
Penconazole (mg/kg)a
Extracted TRR (%) Unextracted TRR (%)
Total (%)
Extract Methanol Soxhlet Tree 1 2 1 2 1 2 1 2 1 2 1 2
Fruit peel 0.374 0.356 0.080 0.088 68.0 77.3 5.8 7.2 19.9 24.4 93.7 108.9
Fruit pulp 0.075 0.057 0.003 0.003 76.3 92.1 2.7 1.0 4.7 11.4 83.7 104.5
Whole fruit 0.109 0.090 0.011 0.011
Leaves 3.93 3.74 0.278 0.273 82.2 83.1 4.0 3.7 5.2 4.7 91.4 91.5
Branches 0.658 0.552 0.280 0.265 63.3 73.7 12.2 14.2 14.2 15.6 89.7 103.3
Roots 0.191 0.143 0.025 0.015 78.5 90.7 8.4 5.8 17.7 18.6 104.6 115.1 a Inclusive of Soxhlet extract
Peel and pulp contained 39% and 61% of TRR, respectively.
Radioactivity in methanol rinse of fruit peel, wood and roots was analysed but not reported.
Total residues in mature fruits were present at about 0.10 mg eq/kg, representing 0.37 mg eq/kg in peel and 0.066 mg eq/kg in pulp. The TRR in the leaves was 3.83 mg eq/kg as already described, and in branches and roots 0.61 mg eq/kg and 0.17 mg eq/kg, respectively. Extractability of the radioactivity by methanol extraction was > 70% of the TRR. In peel and pulp, about 20% and 8% TRR remained in the unextracted residues, respectively.
In whole apple, 24% of the TRR was partitioned into organic phase and 49% into aqueous phase. The parent compound in whole apple was found at up to 11.6 of the TRR (0.012 mg/kg). The monohydroxy metabolites and TA were predominant residues. In pulp, TA was found at 21% TRR but not present in the peel.
In leaves and roots, the parent was present at 7% TRR (0.28 mg/kg) and 13% (0.025 mg/kg) TRR, respectively. Branches contained it up to 43% TRR (0.28 mg/kg). In leaves, monohydroxy

Penconazole
1828
metabolites (mainly CGA132465) were predominant residues. In the roots, the majority (61%) of the radioactivity remained in the aqueous phase.
Table 18 Quantification of metabolite fractions in apple plants treated with [14C-triazole] penconazole at 34 days PHI and a rate of 2.5 g ai/hL
Comp. (TRR, mg eq/kg)
% TRRa Organic phase (DCM) Aqueous phase Soxhlet Un
ext. Total
Total Org.
Apolar Unk
Parentb R3c R4c Polar Unk
Total Aq.
HCl hydrolysis
Org. phase
Aqueous phase
Unk CGA 131013
Peel (0.374)
36 (15)
2 (1)
21 (8)
2 (1)
7 (3)
4 (2)
32 (13)
14 (6)
18 (7)
- 4 (2)
20 (8)
92 (38)
Pulp (0.075)
16 (9)
- 5 (2)
1 (1)
9 (5)
1 (1)
60 (36)
7 (4)
18 (11)
35 (21)
3 (2)
5 (3)
84 (50)
Whole fruit (0.109)
24 1 10 2 8 3 49 10 18 21 4 11 88
Leaves (3.930)
58 1 7 3 42 5 25 9 16 - 3 5 91
Branches (0.658)
52 1 43 1 4 3 20 1 19 - 5 14 91
Roots (0.191)
18 2 13 - 1 2 61 1 60 - 7 18 104
a % radioactivity in individual component and as a % of whole fruit in parentheses b Including parent found in Soxhlet extract c R3, region 3; R4, region 4. R4 was characterised mainly as CGA132465 and CGA127841
Study 2
Further quantification and characterisations were performed with apple tree samples from Study 1 (Nicollier G., 1985; Report No. 25/84). Metabolites in leaves, peel and pulp were isolated and purified for analysis. The methods were similar to those in Study 1. The component fractions were further fractionised, analysed by TLC and HPLC, and the structures were elucidated by MS and NMR. Results are shown Table 19. As an addendum study, rates of depletion of penconazole and its metabolites were investigated at one year (harvest 03 October 1983) and two years (harvest 28 September 1984) after the treatment (Table 20).
In whole apple, parent compound accounted for 11.6% TRR (0.012 mg/kg), 8.5% TRR from peel and 3.1% TRR from pulp. The β-monohydroxy metabolite (CGA132465) was found at 14.3% TRR (0.014 mg eq/kg; free 8.8%, conjugated 5.5%). Triazole alanine (CGA 131013) was most abundant, accounting for 23% TRR (0.023 mg eq/kg; 21% from pulp). CGA127841was present but only at 0.5% TRR (< 0.001). Other minor residues (CGA 190503, TLA, CGA189659, TAA, dihydroxy metabolites, 1,2,4-triazole glycolic acid, CGA179944) were present at < 5% TRR.
In pulp, 3.1% TRR was the parent compound. CGA132465 was present at 7.3% TRR (1.6% conjugated) and triazole alanine 22% TRR. In peel, 8.5% TRR was the parent compound and CGA132465 was present at 7.0% TRR (3.9% conjugated). Triazole alanine in peel was present at 1.0% TRR.
In leaves, 6.8% TRR was the parent compound. CGA132465 was the predominant residue (38% TRR), and CGA189659 was found at 14% TRR. Triazole alanine was not found in the leaves.

Penconazole
1829
Table 19 Quantification of metabolite fractions in field apple trees treated with [14C-triazole] penconazole at 34 DALA and a rate of 2.5 g ai/hL – further characterisation
Fraction (TRR, mg eq/kg)
% TRR
Par. Organic phasea
(DCM) Aqueous phasea Sh Total Unext
Hydrolysed Non-hydrolysed β-b -b (α)c OHe β-b -b (α)c OHe Gf (α)d TA TAA Unksg
Peel (a) (0.37)
22 7.8 0.3 0.8 5.0 9.8 - 5.3 - 3.8 0.5 2.5 0.1 14 4.1 76 22
Peel (b) 8.5 3.1 0.1 0.3 2.0 3.9 - 2.0 - 1.5 0.2 1.0 - 5.5 1.6 30 8.6 Pulp (a) (0.066)
5.2 9.6 0.6 0.2 3.0 2.7 - 1.0 1.1 1.7 - 37 1.4 20 1.8 85 8.0
Pulp (b) 3.1 5.7 0.4 0.1 1.7 1.6 - 0.6 0.7 1.0 - 22.0 0.8 12 1.1 51 4.8 Whole (0.10)
11.6 8.8 0.5 0.4 3.7 5.5 - 2.6 0.7 2.5 0.2 23.0 0.8 18 2.7 81 13
Leavesi (3.8)
6.8 29 1.6 14 7.8 9.1 0.4 - 1.2 1.3 3.8 - 3.2 7.7 3.0 90 4.9
Branches (0.61)
43 9 1 19 5.0 77 14
Roots (0.17)
13 5 1 60 7.0 86 18
* Fraction materials from two trees combined; (a) % TRR in individual plant component ; (b) % TRR in whole fruit. a From partitioning of initial methanol extracts with dichloromethane
b β-, CGA132465; -, GCA127841 c CαH2OH =2-(2,4-dichloro-phenyl)-3-[1,2,4]triazol-1-yl-propan-1-ol (CGA189659) d CαOOH = 2-(2,4-dichloro-phenyl)-3-[1,2,4]triazol-1-yl-propionic acid (CGA179944)
e Hydroxy isomers, α-monohydroxy, α, β- and β, -dihydroxy isomers f Other OH-glycosides g Further identified: 1,2,4-triazolylglycolic acid, 0.3% and 0.7% of the TRR in leaves and peels, respectively; 1,2,4-triazolyllactic acid, 1.2%, 5.0% and 7.6% (including TA) of the TRR in leaves, peel and pulp, respectively. h S, soxhlet extracted, excluding parent content, which included in TRR of parent. i Only in leaves, in the organic phase, CGA91304 and the acetyl derivative CGA90305 were found at 0.03% and 0.04% of TRR, respectively.
Table 20 Comparison of total residues in field apple trees treated with [14C-triazole] penconazole at initial harvest and one and two years post treatment
Plant component
Total residues (mg eq/kg) Harvest 12 October 1982 Harvest 03 October 1983 (1 year) Harvest 28 September 1984 (2 years)
Tree 1 Tree 2 Mean Tree 1 Tree 2 Mean % of initial mean
Tree 1 Tree 2 Mean % of initial mean
Fruit peel 0.374 0.356 0.365 0.143 0.091 0.117 32 0.085 0.069 0.077 21 Fruit pulp 0.075 0.057 0.066 0.119 0.059 0.089 134 0.044 0.046 0.045 68 Whole fruit
0.109 0.090 0.099 0.120 0.062 0.091 92 0.049 0.048 0.048 49
Leaves 3.930 3.740 3.830 1.189 1.111 1.150 30 0.861 0.773 0.817 21 Branches 0.658 0.552 0.605 0.200 0.158 0.179 30 0.138 0.142 0.140 23
TRR levels in field treated apple trees one and two years post treatment are shown in Table 20. In fruits, TRR levels were maintained at 92% one year post treatment and decreased to 49% by two year. In the leaves and branches, the TRRs decreased one year post treatment to 30% and further to ca. 22% by two years.
In fruit samples there was a marked difference in the distribution of radioactivity between the peel and the pulp. In the peel, one year after treatment, the relative level of radioactivity decreased significantly to 32%, whereas TRR level in fruit pulp increased to 134% (dropping to 68% by two years post treatment).

Penconazole
1830
Table 21 Quantification of metabolite fractions in field apple trees treated with [14C-triazole] penconazole at one year post treatment
Fractiona
(TRR, mg eq/kg)
% TRR Organic phase (DCM)
Aqueous phaseb Soxhl. Total ext.
Unext.
Total Org.
Parent Unks Total Aq.
TA TAA TLA Unks
Peel (a) (0.12)
0.5 - 0.5 95.7 24.2 21.5 27.5 22.5 - 96.2 4.5
Peel (b) - - - 12.2 3.1 2.7 3.5 2.9 - 12.2 0.6 Pulp (a) (0.089)
0.2 - 0.2 97.9 53.3 11.0 - 33.6 - 98.1 2.0
Pulp (b) 0.2 - 0.2 84.2 45.8 9.5 - 28.9 - 84.4 1.7 Whole (0.091)
0.2 - 0.2 96.4 48.9 12.2 3.5 31.8 - 96.6 2.3
Leaves (1.2)
0.1 - 0.1 93.7 4.2 4.8 65.1 19.6 - 93.8 6.2
Branches (0.18)
4.9 - 4.9 81.5 - 51.0 - 30.5 5.2 91.6 8.4
a (a) %TRR in individual plant component (b) %TRR in whole fruit b Aqueous phase, not hydrolysed with acid or enzyme, was analysed by TLC. The Unks were not further characterised. 1,2,4-triazole was only detected in soil.
One year post treatment showed 82 to 98% TRR of the radioactivity was found in the aqueous phase from partitioning with dichloromethane in all plant parts. Parent compound was not found in any part. The main metabolites found at this stage were TA, TAA and TLA.
CGA13013 (TA) was found in fruits (49% TRR) and leaves (4% of TRR), but not found in branches. TAA was found in all plant parts and accounted for 12% TRR in fruits, 5% TRR in leaves and 51% TRR in branches. TLA represented 3.5% TRR in fruits and 65% TRR in leaves. 1,2,4-triazole was only found in soil.
Additionally, TRR levels in wood (old branch) and bark of branches two years post treatment were investigated. The majority of radioactivity in the branches was located in the wood (79% TRR), with only 21% TRR in the bark. Parent compound remained in the bark only at a small amount (< 2% of TRR). This indicated that remaining radioactivity in fruits and leaves at this time probably originated from root uptake from the soil.
Summary in plant metabolism
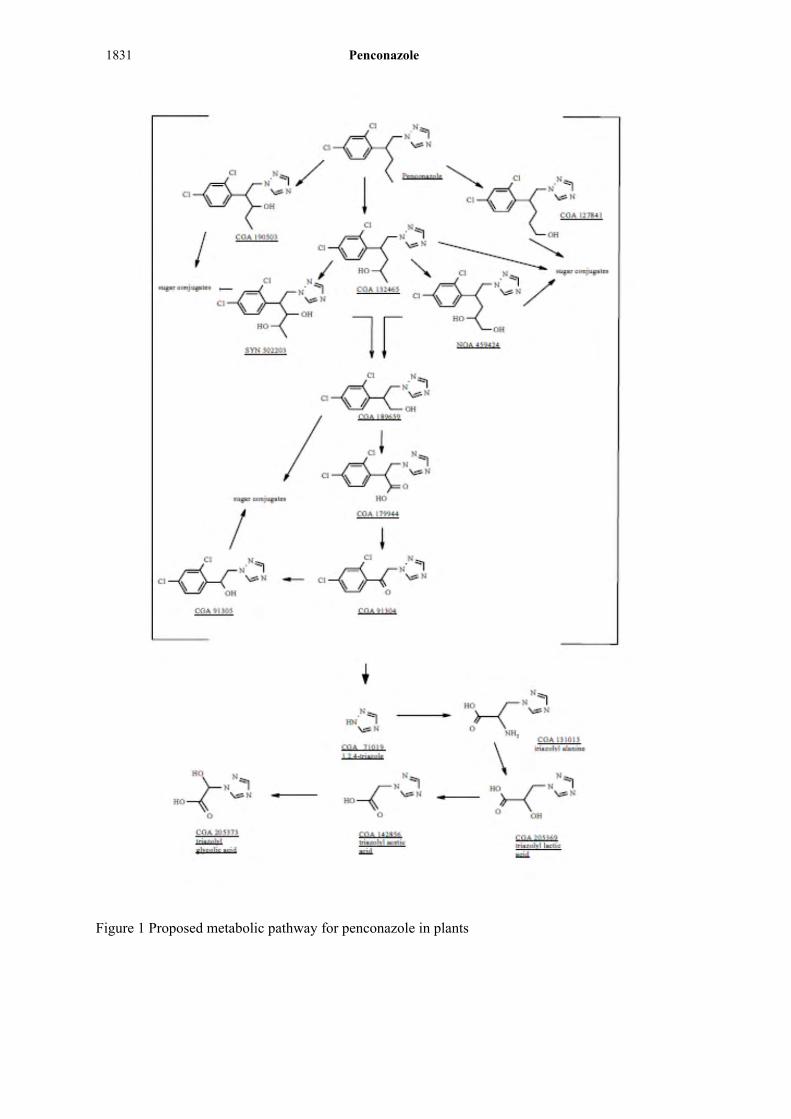
In summary, the nature of the residues was essentially the same in grape, tomato and apple. The biotransformation of penconazole results from the oxidation of penconazole at the 1, 2 and 3 positions of the alkyl chain and subsequent conjugation with sugar. Thus the monohydroxy metabolites (α-, β-, γ-monohydroxy metabolite) were abundant in plant and acid hydrolysis or enzyme treatment was needed to release the aglycones. Among the metabolites, β-monohydroxy metabolite (CGA132465) was the most predominant, accounting for 14–62% TRR (0.009–0.016 mg eq/kg). Metabolites in plants were also observed in rats.
Label-specific metabolism from the 14C-triazole treatments resulted from the cleavage of the triazole moiety (1,2,4-triazole) and subsequent conjugation with serine to form TA and by catabolism to form TAA and TLA. Total triazole-specific residues amounted to 20–29% TRR in the crops (0.006–0.029 mg eq/kg), comprising TA 10–23% TRR, TAA 0.8–2.3% TRR and TLA 2.3–12% TRR. After one year following direct application on apple tree, cleavage of the triazole moiety resulted in non-detection of parent compound and abundance of triazole-specific metabolites.
Based on data from tomato and apple, penconazole remains mainly as a surface residue on fruits. However, most of radioactivity in fruits was found as conjugated monohydroxy metabolites within the fruit.
Penconazole
1831
Figure 1 Proposed metabolic pathway for penconazole in plants
Penconazole
1832
Residues in succeeding or rotational crops
Confined rotational crop study
Formulated [14C-triazole] or [14C-phenyl] penconazole was applied on bare ground at each plot in St Aubin, Switzerland as an EC 100 formulation (Völlmin S., 2000; Report No. 97JS27 for triazole- label study and Völlmin S., 2001; Report No.97JS28 for phenyl-label study). Application was made on one occasion (April 10th, 1997) at a rate of 0.24 kg ai/ha. Four crops, lettuce, radish, spring wheat and winter wheat, were planted or seeded (lettuce seedlings transplanted) at 32-, 126-, and 358-day plant-back intervals (179-day PBI only for winter wheat). Samples were stored frozen (-18 C) until analysis. For determination of total radioactive residues in the homogenised samples, aliquots were combusted and quantified by LSC.
In the triazole-label study, samples were extracted with 80% methanol and the residues were extracted again with 80% n-propanol by microwave. The unextracted residues of grain and fodder (32-day PBI) were subjected to more rigorous extraction, namely, extracted in boiling water, treated with macerozyme, and refluxed with 1N HCl (or further with NaOH solution). Total radioactive residues were quantified by LSC and metabolites at levels 10% of TRR (0.05 mg eq/kg) in any sample identified by TLC and HPLC. A specific metabolite (triazole lactic acid) was identified by LC-MS and LC-NMR. In the phenyl-label study, similar methods were used for quantification and identification of metabolic fractions.
In the triazole- and phenyl-label studies, whole tops of spring wheat and tops/roots of radish (including head of lettuce in phenyl-label study) were tested for storage stability at the beginning and the end of analytical phase: December 1997 and April 2000 in the former study and December 1997 (or January 1998) and October 2000 in the latter study. No significant changes of the metabolite profiles were observed.
Results are summarized in Tables 22–23 for triazole-label study and Tables 24–25 for phenyl-label study.
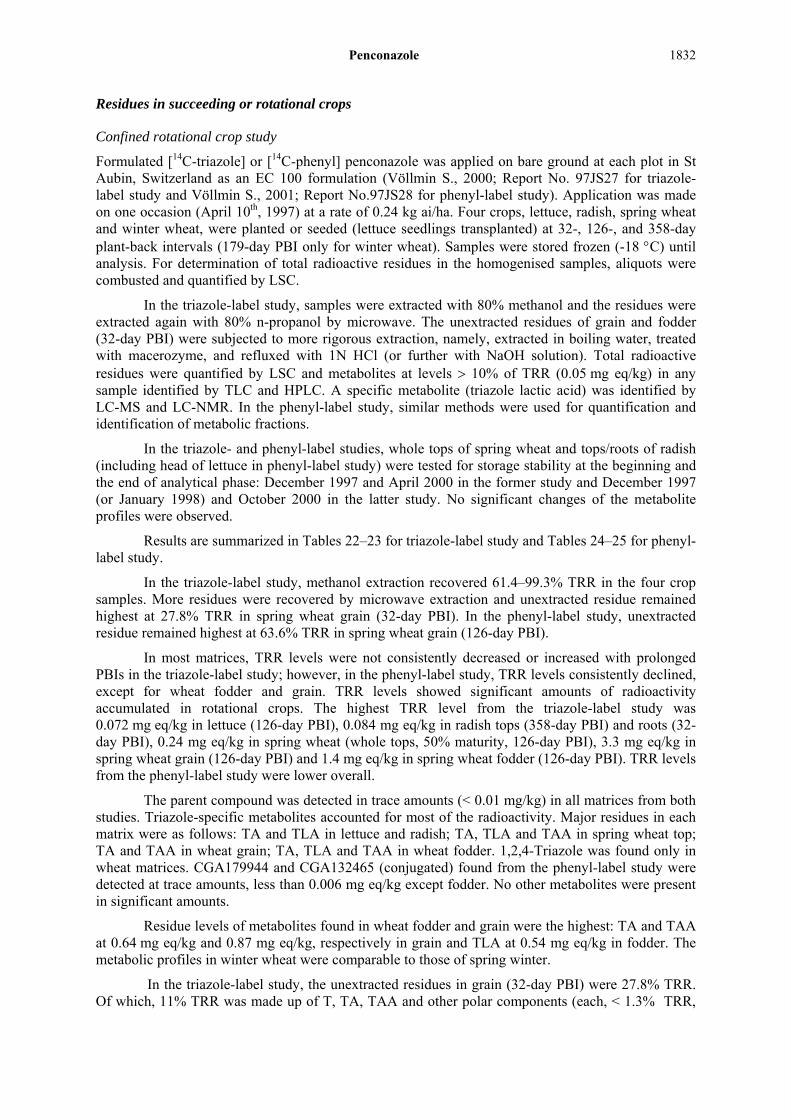
In the triazole-label study, methanol extraction recovered 61.4–99.3% TRR in the four crop samples. More residues were recovered by microwave extraction and unextracted residue remained highest at 27.8% TRR in spring wheat grain (32-day PBI). In the phenyl-label study, unextracted residue remained highest at 63.6% TRR in spring wheat grain (126-day PBI).
In most matrices, TRR levels were not consistently decreased or increased with prolonged PBIs in the triazole-label study; however, in the phenyl-label study, TRR levels consistently declined, except for wheat fodder and grain. TRR levels showed significant amounts of radioactivity accumulated in rotational crops. The highest TRR level from the triazole-label study was 0.072 mg eq/kg in lettuce (126-day PBI), 0.084 mg eq/kg in radish tops (358-day PBI) and roots (32-day PBI), 0.24 mg eq/kg in spring wheat (whole tops, 50% maturity, 126-day PBI), 3.3 mg eq/kg in spring wheat grain (126-day PBI) and 1.4 mg eq/kg in spring wheat fodder (126-day PBI). TRR levels from the phenyl-label study were lower overall.
The parent compound was detected in trace amounts (< 0.01 mg/kg) in all matrices from both studies. Triazole-specific metabolites accounted for most of the radioactivity. Major residues in each matrix were as follows: TA and TLA in lettuce and radish; TA, TLA and TAA in spring wheat top; TA and TAA in wheat grain; TA, TLA and TAA in wheat fodder. 1,2,4-Triazole was found only in wheat matrices. CGA179944 and CGA132465 (conjugated) found from the phenyl-label study were detected at trace amounts, less than 0.006 mg eq/kg except fodder. No other metabolites were present in significant amounts.
Residue levels of metabolites found in wheat fodder and grain were the highest: TA and TAA at 0.64 mg eq/kg and 0.87 mg eq/kg, respectively in grain and TLA at 0.54 mg eq/kg in fodder. The metabolic profiles in winter wheat were comparable to those of spring winter.
In the triazole-label study, the unextracted residues in grain (32-day PBI) were 27.8% TRR. Of which, 11% TRR was made up of T, TA, TAA and other polar components (each, < 1.3% TRR,
Penconazole
1833
0.013 mg eq/kg). In wheat fodder (32-day PBI), 11.2% of the unextracted residues (16.4% TRR) was found to be composed of various components (each, < 4.4% TRR).
In the phenyl-label study, in grain and fodder (126-day PBI), the unextracted residues were 63.6% and 35.5% TRR, respectively. Further extractions and characterisations were performed and final unextracted residues were 57% TRR (grain) and 9.6% TRR (fodder).
Table 22 Distribution of radioactivity in rotational crops planted in soil treated with [14C- triazole] penconazole on at various plant-back and sampling intervals
Crop planting
PBI (days)
DAT Plant part TRR (mg eq/kg)
Parent (mg/kg)
Extracted TRR (%)a
Unext. TRR (%)
Total (%)
E1 E2
Lettuce 32 74 Heads 0.016 < 0.001 76.3 10.5 15.8 102.6 126 179 Heads 0.072 ND 94.7 3.2 2.4 100.3 358 424 Heads 0.062 ND 97.4 NP 4.6 102.1 Radish
32 74 Tops Roots
0.076 0.084
0.005 0.006
97.8 99.3
5.3 3.2
2.8 1.1
105.9 103.6
126 179 Tops Roots
0.035 0.031
ND ND
87.8 98.6
3.1 1.0
5.2 1.9
96.1 101.5
358 424 Tops Roots
0.084 0.047
0.002 0.002
94.4 94.8
NP NP
7.9 7.4
102.3 102.2
Spring Wheat
32 74 Whole tops (50% maturity) 0.13 < 0.001 92.9 4.3 3.1 100.2 125 Fodder 0.43 0.008 63.7 17.5 16.4 97.6
Grain 0.98 < 0.001 61.4 5.7 27.8 94.9 126 179 Whole tops (50% maturity) 0.23 ND 88.9 3.1 5.6 97.6
245 Fodder 1.4 0.005 72.0 15.1 11.1 98.2 Grain 3.3 0.001 86.2 1.4 10.9 98.6
358 452 Whole tops (50% maturity) 0.19 ND 94.3 NP 8.3 102.5 475 Fodder 0.43 ND 86.8 8.1 7.6 102.5
Grain 1.1 ND 88.9 9.0 7.8 105.7 Winter Wheat
179 249 Whole tops (fall cutting) 0.17 ND 93.1 1.5 1.6 96.3 424 Whole tops (50% maturity) 0.084 ND 91.1 NP 10.6 101.7 461 Fodder 0.34 0.011 79.5 11.6 7.2 98.3
Grain 0.42 ND 98.6 NP 13.8 112.5
PBI, plant- back interval; DAT, days after treatment a E1, methanol extraction; E2, microwave extraction
ND, not detected; NP, not performed
Table 23 Quantification of radioactivity in rotational crops planted in soil treated with [14C- triazole] penconazole on at various plant- back and sampling intervals
Crop planting
PBI (days)
D A T
Plant part TRR (mg eq/kg)
Parent, mg/kg (%TRR)
TA, mg eq/kg (%TRR)
TLA, mg eq/kg (%TRR)
TAA, mg eq/kg (%TRR)
T, mg eq/kg (%TRR)
Unext., mg eq/kg (%TRR)
Lettuce
32 74 Heads 0.016 < 0.001(2.8) 0.004 (23) 0.006(37) ND ND 0.003
126 179 Heads 0.072 ND 0.007 (9.1) 0.055(76) ND ND 0.002 358 424 Heads 0.062 ND 0.013 (21) 0.042
(68) ND ND 0.003
Radish
32 74 Tops Roots
0.076 0.084
0.005 (7.1) 0.006 (6.9)
0.034 (45) 0.056 (67)
0.005 (7.0) 0.007 (7.9)
< 0.001 0.001
ND 0.001
< 0.001
126 179 Tops Roots
0.035 0.031
ND ND
0.015 (44) 0.027 (87)
0.006 (17) ND
ND ND
ND ND
0.002 < 0.001
358 424 Tops Roots
0.084 0.047
0.002 (2.0) 0.002 (3.8)
0.057 (68) 0.036 (76)
0.005 (6.4) 0.003 (5.7)
< 0.001 ND
0.002 ND
0.007 0.003
Spring Wheat
32 74 Whole tops (50% mat.)
0.13 < 0.001 (6.9) 0.052(39) 0.029 (22) 0.021 (16) 0.006 (4.4) 0.004
125 Fodder 0.43 0.008 (1.9) 0.015 (3.5) 0.15 (34) 0.084 (20) 0.026 (6.1) 0.070

Penconazole
1834
Crop planting
PBI (days)
D A T
Plant part TRR (mg eq/kg)
Parent, mg/kg (%TRR)
TA, mg eq/kg (%TRR)
TLA, mg eq/kg (%TRR)
TAA, mg eq/kg (%TRR)
T, mg eq/kg (%TRR)
Unext., mg eq/kg (%TRR)
Grain 0.98 < 0.001 (0.1) 0.34 (35) 0.006 (0.6) 0.23 (23) 0.026 (2.7) 0.27 126 179 Whole tops
(50% mat.) 0.24 ND 0.12 (52) 0.059 (26) 0.015 (6.6) 0.004 (1.7) 0.013
245 Fodder 1.4 0.005 0.12 (8.3) 0.54 (38) 0.30 (21) 0.057 (4.1) 0.15 Grain 3.3 0.001 (<0.1) 0.19 (5.8) < 0.001 (<0.1) 0.87 (26) 0.029 (0.9) 0.36
358 452 Whole tops (50% mat.)
0.19 ND 0.070 (37) 0.042 (22) 0.057 (30) ND 0.016
475 Fodder 0.43 ND 0.037 (8.8) 0.23 (52) 0.091 (21) 0.008 (1.9) 0.033 Grain 1.1 ND 0.64 (59) ND 0.36 (33) 0.013 (1.2) 0.084
Winter Wheat
179 249 Whole tops (fall cutting)
0.17 ND 0.063 (37) 0.058 (34)
0.004 (2.2) 0.005 (2.9) 0.003
424 Whole tops (50% mat.)
0.084 ND 0.035 (42) 0.028 (33) 0.007 (8.7) ND 0.009
461 Fodder 0.34 0.011 (3.3) 0.014 (4.1) 0.22 (63) 0.030 (9.1) 0.009 (2.7) 0.024 Grain 0.42 ND 0.26 (61) ND 0.14 (33) 0.007 (1.7) 0.058
The values in parentheses mean % TRR.
The other metabolite fractions in the rotational crops represented ≤ 0.004 mg eq/kg except for fodder and fraction II16 in grain and whole tops (25% maturity). II16 was present at up to 0.023-0.031 mg eq/kg (2.3-2.9% TRR) in wheat grain and up to 0.014 mg eq/kg (7.9% TRR) in whole tops.
Table 24 Distribution of radioactivity in rotational crops planted in soil treated with [14C- phenyl] penconazole on at various plant-back and sampling intervals
Crop planting
PBI (days)
DAT Plant part TRR, mg eq/kg
Parent, mg/kg
Extracted TRR (%)a
Unext. TRR (%)
Total (%)
E1 E2 Lettuce 32 74 Heads 0.071 0.002 94.9 2.9 2.8 100.6 126 179 Heads 0.003 NA NA NA NA NA Radish 32 74 Tops
roots 0.032 0.013
0.004 0.004
85.5 77.5
7.9 11.7
6.8 10.1
100.3 99.3
126 179 Tops roots
0.014 0.004
< 0.001 NA
87.6 NA
4.6 NA
9.8 NA
102.1 NA
358 424 Tops roots
0.008 0.004
NA NA
NA NA
NA NA
NA NA
NA NA
Spring Wheat
32 74 Whole tops (50% maturity) 0.024 0.002 72.2 13.9 12.0 98.1 125 Fodder 0.13 0.003 55.1 20.7 22.7 98.5 Grain 0.017 ND 34.7 13.5 54.1 102.2
126 179 Whole tops (50% maturity) 0.035 ND 57.7 10.9 33.1 101.7 245 Fodder 0.29 < 0.001 53.2 13.9 35.5 102.6 Grain 0.13 ND 22.3 11.3 63.6 97.2
358 452 Whole tops (50% maturity) 0.011 ND 75.6 16.5 10.9 103.0 475 Fodder 0.047 ND 61.0 14.9 27.5 103.3 Grain 0.013 ND 47.9 19.9 47.0 114.9
Winter Wheat
358 249 Whole tops (fall cutting) 0.027 NA 91.3 ND 11.2 103.1 424 Whole tops (50% maturity) 0.012 ND 76.5 21.9 5.4 103.8 461 Fodder 0.077 ND 93.0 16.5 10.7 120.2 Grain 0.005 NA NA NA NA NA
a E1, methanol extraction; E2, microwave extraction
NA, not analysed; ND, not detected
Penconazole
1835
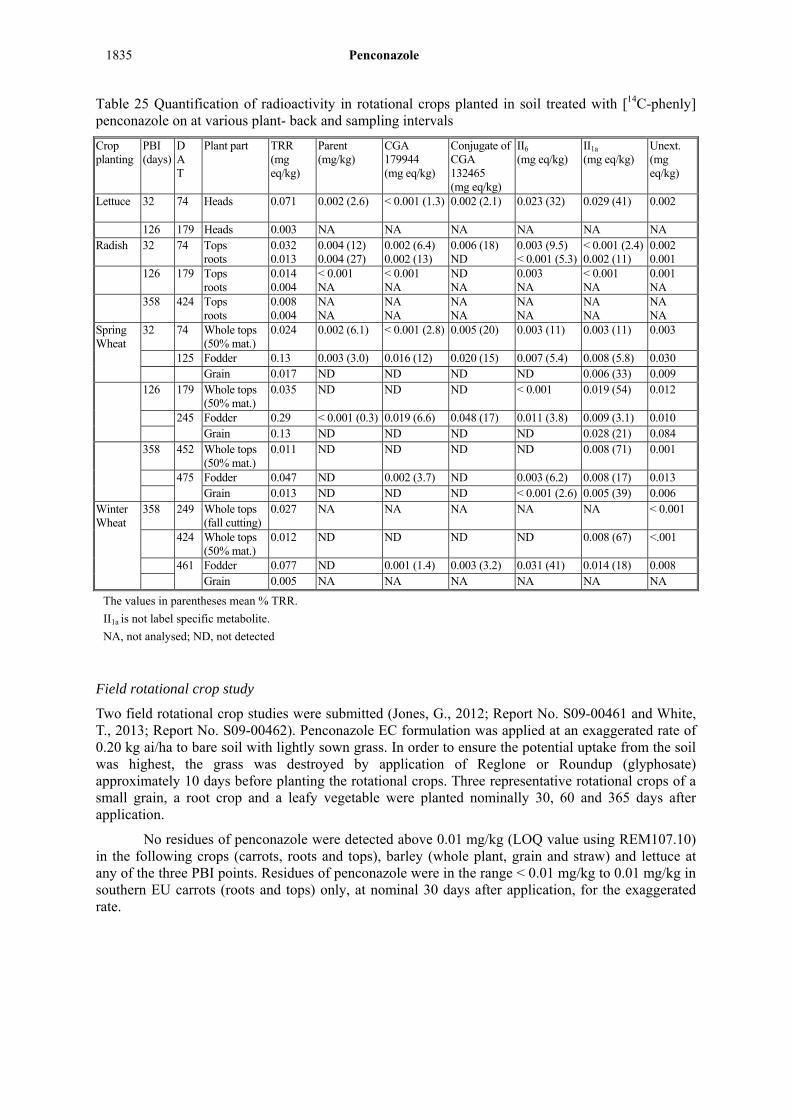
Table 25 Quantification of radioactivity in rotational crops planted in soil treated with [14C-phenly] penconazole on at various plant- back and sampling intervals
Crop planting
PBI (days)
D A T
Plant part TRR (mg eq/kg)
Parent (mg/kg)
CGA 179944 (mg eq/kg)
Conjugate of CGA 132465 (mg eq/kg)
II6
(mg eq/kg) II1a
(mg eq/kg) Unext. (mg eq/kg)
Lettuce
32 74 Heads 0.071 0.002 (2.6) < 0.001 (1.3) 0.002 (2.1) 0.023 (32) 0.029 (41) 0.002
126 179 Heads 0.003 NA NA NA NA NA NA Radish 32 74 Tops
roots 0.032 0.013
0.004 (12) 0.004 (27)
0.002 (6.4) 0.002 (13)
0.006 (18) ND
0.003 (9.5) < 0.001 (5.3)
< 0.001 (2.4) 0.002 (11)
0.002 0.001
126 179 Tops roots
0.014 0.004
< 0.001 NA
< 0.001 NA
ND NA
0.003 NA
< 0.001 NA
0.001 NA
358 424 Tops roots
0.008 0.004
NA NA
NA NA
NA NA
NA NA
NA NA
NA NA
Spring Wheat
32 74 Whole tops (50% mat.)
0.024 0.002 (6.1) < 0.001 (2.8) 0.005 (20) 0.003 (11) 0.003 (11) 0.003
125 Fodder 0.13 0.003 (3.0) 0.016 (12) 0.020 (15) 0.007 (5.4) 0.008 (5.8) 0.030 Grain 0.017 ND ND ND ND 0.006 (33) 0.009
126 179 Whole tops (50% mat.)
0.035 ND ND ND < 0.001 0.019 (54) 0.012
245 Fodder 0.29 < 0.001 (0.3) 0.019 (6.6) 0.048 (17) 0.011 (3.8) 0.009 (3.1) 0.010 Grain 0.13 ND ND ND ND 0.028 (21) 0.084
358 452 Whole tops (50% mat.)
0.011 ND ND ND ND 0.008 (71) 0.001
475 Fodder 0.047 ND 0.002 (3.7) ND 0.003 (6.2) 0.008 (17) 0.013 Grain 0.013 ND ND ND < 0.001 (2.6) 0.005 (39) 0.006
Winter Wheat
358 249 Whole tops (fall cutting)
0.027 NA NA NA NA NA < 0.001
424 Whole tops (50% mat.)
0.012 ND ND ND ND 0.008 (67) <.001
461 Fodder 0.077 ND 0.001 (1.4) 0.003 (3.2) 0.031 (41) 0.014 (18) 0.008 Grain 0.005 NA NA NA NA NA NA
The values in parentheses mean % TRR.
II1a is not label specific metabolite.
NA, not analysed; ND, not detected
Field rotational crop study
Two field rotational crop studies were submitted (Jones, G., 2012; Report No. S09-00461 and White, T., 2013; Report No. S09-00462). Penconazole EC formulation was applied at an exaggerated rate of 0.20 kg ai/ha to bare soil with lightly sown grass. In order to ensure the potential uptake from the soil was highest, the grass was destroyed by application of Reglone or Roundup (glyphosate) approximately 10 days before planting the rotational crops. Three representative rotational crops of a small grain, a root crop and a leafy vegetable were planted nominally 30, 60 and 365 days after application.
No residues of penconazole were detected above 0.01 mg/kg (LOQ value using REM107.10) in the following crops (carrots, roots and tops), barley (whole plant, grain and straw) and lettuce at any of the three PBI points. Residues of penconazole were in the range < 0.01 mg/kg to 0.01 mg/kg in southern EU carrots (roots and tops) only, at nominal 30 days after application, for the exaggerated rate.

Penconazole
1836
Table 26 Quantification of triazole metabolites in field rotational crops treated with penconazole
Crop planting Location 1,2,4-Triazole (mg/kg) Triazole alanine (mg/kg) Triazole acetic acid (mg/kg)
Triazole lactic acid (mg/kg)
30 PBI
60 PBI
365 PBI
30 PBI
60 PBI
365 PBI
30 PBI
60 PBI
365 PBI
30 PBI
60 PBI
365 PBI
Lettuce 1 < 0.01 < 0.01 < 0.01 0.03 0.02 0.01 < 0.01 < 0.01 < 0.01 0.04 0.10 0.06
2 < 0.01 < 0.01 < 0.01 0.02 < 0.01 < 0.01 < 0.01 < 0.01 < 0.01 0.08 0.05 0.03
Carrot tops 1 < 0.01 < 0.01 < 0.01 0.02 < 0.01 0.02 < 0.01 < 0.01 < 0.01 0.45 0.22 0.09
2 < 0.01 < 0.01 < 0.01 < 0.01 < 0.01 < 0.01 < 0.01 < 0.01 < 0.01 0.20 0.14 0.06
Carrot roots 1 < 0.01 < 0.01 < 0.01 0.07 0.04 0.03 < 0.01 < 0.01 < 0.01 0.04 0.02 0.01
2 < 0.01 < 0.01 < 0.01 0.09 0.07 0.03 < 0.01 < 0.01 < 0.01 0.02 0.02 < 0.01
Barley whole plant
1 < 0.01 < 0.01 < 0.01 0.14 0.22 0.12 0.08 0.12 0.02 0.25 0.80 0.22
2 < 0.01 < 0.01 < 0.01 0.09 0.08 0.08 0.06 0.13 0.03 0.33 0.37 0.13
Barley straw 1 < 0.01 < 0.01 < 0.01 0.32 0.06 0.14 0.22 0.11 0.21 0.30 0.32 0.13
2 < 0.01 < 0.01 < 0.01 0.07 0.13 0.04 0.27 0.39 0.14 0.08 0.22 0.06
Barley grain 1 < 0.01 < 0.01 < 0.01 0.59 0.63 0.58 0.44 0.82 0.47 0.02 0.03 0.03
2 < 0.01 < 0.01 < 0.01 0.34 0.44 0.23 0.26 0.56 0.27 < 0.01 0.01 < 0.01
Table 26 shows the highest level detected.
PBI: nominal day
Location: 1- Northern Europe (France and UK); 2-Southern Europe (France and Spain)
The results from the two field rotational crop studies followed residue patterns shown in the confined studies. No parent compound was detected (< 0.01 mg/kg) in the follow-on crops. Major metabolites were the same and residue levels detected were similar, except for higher concentrations of triazole lactic acid detected in carrot tops and roots.
Animal metabolism
Laboratory animal
Lactating goats
Two lactating goats were given [3,5-14C-triazole] penconazole and two were given [phenyl-U-14C] penconazole for ten consecutive days at 5 ppm in the feed (Madrid, S.O., et al., 1985: Report No. ABR-85015). The majority of the administered radioactivity was excreted in urine (77–92%, AR, 8% AR in faeces). Radioactive residues in the edible tissues were < 0.01 mg eq/kg in fat, up to 0.02 mg eq/kg in muscle, 0.075–0.1 mg eq/kg (0.1% AR) in liver and 0.036–0.061 mg eq/kg (0.01% AR) in kidney. Excretion in the milk reached a plateau by day four at 0.009 mg eq/kg (phenyl label) and 0.013 mg eq/kg (triazole label), representing 0.2% and 0.3% of the AR. 98–103% AR of the radioactivity was extracted in faces and the parent compound accounted for 17–21% AR.
Two lactating goats were administered [phenyl-U-14C] penconazole at a rate of 5.13 mg/kg body weight corresponding to 112 ppm in the feed for 4 consecutive days by capsule dosing (Lutringer, C., 1999; Report No. E97-02). Milk and excreta were collected daily at 0–78 hour intervals. The concentration of radioactive residues in milk reached a plateau level of 0.092 mg eq/kg during the interval of 0-24 hours. The goats were sacrificed 6 hours after the last dose and tissues (muscle, fat, kidney and liver) were taken post mortem. In addition, the cage wash, cage debris, blood and bile, and the contents of the gastrointestinal tract/rumen were taken for analysis after 78 hours.
Tissues were cut into smaller pieces and frozen with liquid nitrogen. Frozen tissue samples (including frozen excreta and rumen content) were homogenised using a blender and subjected to combustion analysis. The remaining samples were stored frozen (-18 °C) prior to solvent extraction. Radioactivity in blood was determined by combustion analysis and aliquots of milk, urine, bile and cage wash were analysed directly by LSC.
Penconazole
1837
Samples were extracted with acetonitrile and acetonitrile/water (80:20) and partitioned with hexane. The aqueous phase (water and acetonitrile) was cleaned up by C18 SPE. The methanol eluate was analysed by TLC and HPLC. For fat, liver and kidney, the post-extraction solids were extracted with 1-propanol/water (80:20) by microwave. The extract was cleaned up and analysed by TLC. For isolation and identification of metabolites, urinary metabolites were cleaned up by C18 SPE. The methanol eluate was separated by preparative TLC or HPLC and then subjected to analyses by TLC and HPLC or LC-MS and NMR. β-glucuronidase treatment was made for some metabolite fractions.
The stability of metabolites present in milk and liver upon storage during the analytical period was investigated. The chromatographic profiles were compared initially, after 4 months and at the end of the experimental phase (13 months). There was no difference in extractability and the metabolite patterns did not change significantly during the storage of milk and liver samples.
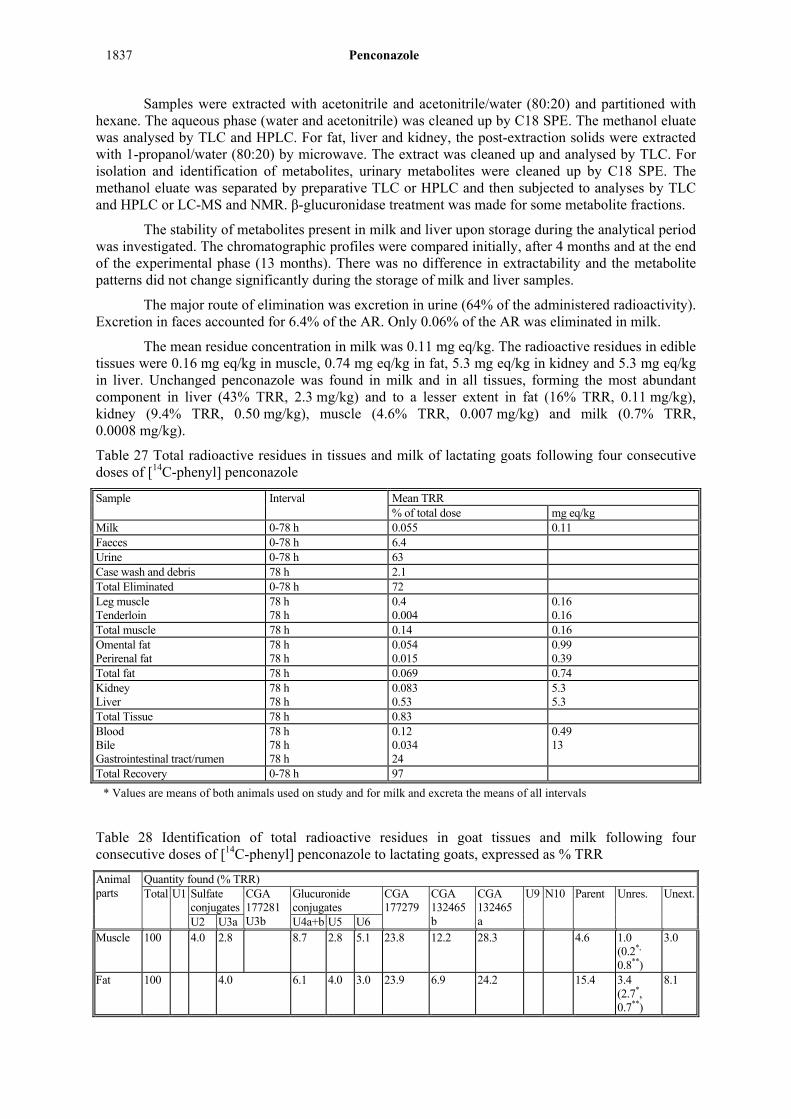
The major route of elimination was excretion in urine (64% of the administered radioactivity). Excretion in faces accounted for 6.4% of the AR. Only 0.06% of the AR was eliminated in milk.
The mean residue concentration in milk was 0.11 mg eq/kg. The radioactive residues in edible tissues were 0.16 mg eq/kg in muscle, 0.74 mg eq/kg in fat, 5.3 mg eq/kg in kidney and 5.3 mg eq/kg in liver. Unchanged penconazole was found in milk and in all tissues, forming the most abundant component in liver (43% TRR, 2.3 mg/kg) and to a lesser extent in fat (16% TRR, 0.11 mg/kg), kidney (9.4% TRR, 0.50 mg/kg), muscle (4.6% TRR, 0.007 mg/kg) and milk (0.7% TRR, 0.0008 mg/kg).
Table 27 Total radioactive residues in tissues and milk of lactating goats following four consecutive doses of [14C-phenyl] penconazole
Sample Interval Mean TRR % of total dose mg eq/kg
Milk 0-78 h 0.055 0.11 Faeces 0-78 h 6.4 Urine 0-78 h 63 Case wash and debris 78 h 2.1 Total Eliminated 0-78 h 72 Leg muscle Tenderloin
78 h 78 h
0.4 0.004
0.16 0.16
Total muscle 78 h 0.14 0.16 Omental fat Perirenal fat
78 h 78 h
0.054 0.015
0.99 0.39
Total fat 78 h 0.069 0.74 Kidney Liver
78 h 78 h
0.083 0.53
5.3 5.3
Total Tissue 78 h 0.83 Blood Bile Gastrointestinal tract/rumen
78 h 78 h 78 h
0.12 0.034 24
0.49 13
Total Recovery 0-78 h 97
* Values are means of both animals used on study and for milk and excreta the means of all intervals
Table 28 Identification of total radioactive residues in goat tissues and milk following four consecutive doses of [14C-phenyl] penconazole to lactating goats, expressed as % TRR
Animal parts
Quantity found (% TRR) Total U1 Sulfate
conjugatesCGA 177281 U3b
Glucuronide conjugates
CGA 177279
CGA 132465 b
CGA 132465 a
U9 N10 Parent Unres. Unext.
U2 U3a U4a+b U5 U6 Muscle 100 4.0 2.8 8.7 2.8 5.1 23.8 12.2 28.3 4.6 1.0
(0.2*, 0.8**)
3.0
Fat 100 4.0 6.1 4.0 3.0 23.9 6.9 24.2 15.4 3.4 (2.7*, 0.7**)
8.1
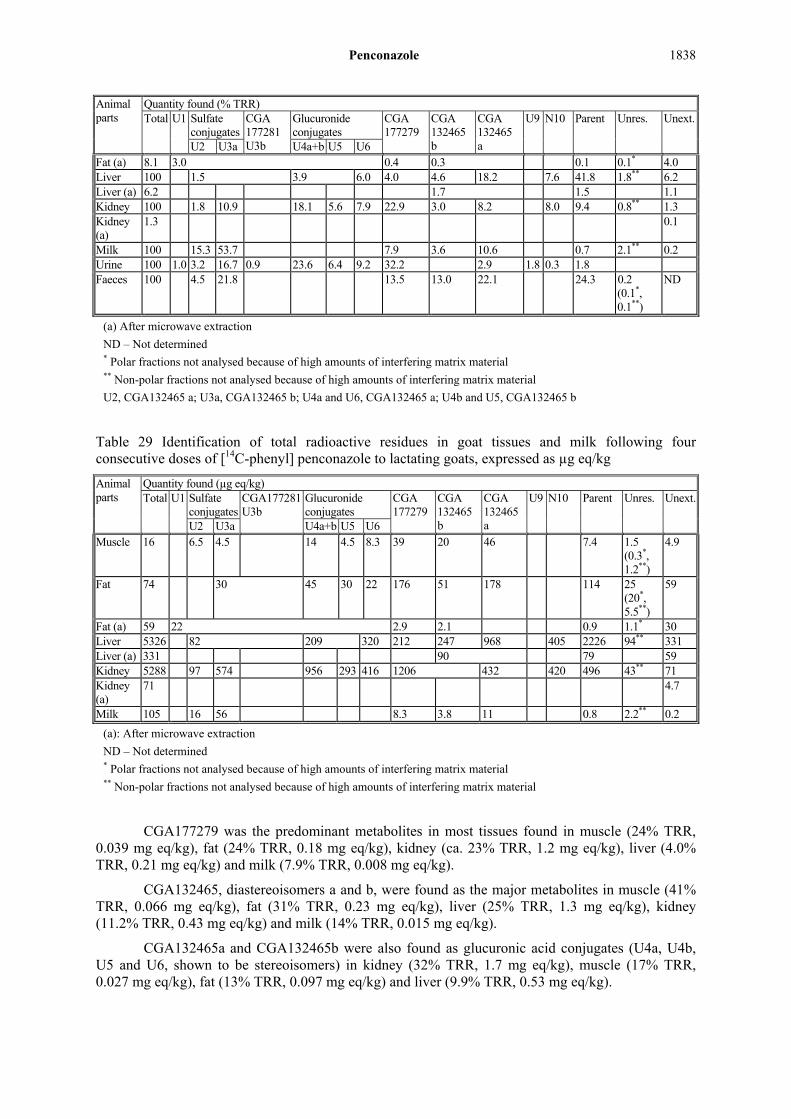
Penconazole
1838
Animal parts
Quantity found (% TRR) Total U1 Sulfate
conjugatesCGA 177281 U3b
Glucuronide conjugates
CGA 177279
CGA 132465 b
CGA 132465 a
U9 N10 Parent Unres. Unext.
U2 U3a U4a+b U5 U6 Fat (a) 8.1 3.0 0.4 0.3 0.1 0.1* 4.0 Liver 100 1.5 3.9 6.0 4.0 4.6 18.2 7.6 41.8 1.8** 6.2 Liver (a) 6.2 1.7 1.5 1.1 Kidney 100 1.8 10.9 18.1 5.6 7.9 22.9 3.0 8.2 8.0 9.4 0.8** 1.3 Kidney (a)
1.3 0.1
Milk 100 15.3 53.7 7.9 3.6 10.6 0.7 2.1** 0.2 Urine 100 1.0 3.2 16.7 0.9 23.6 6.4 9.2 32.2 2.9 1.8 0.3 1.8 Faeces 100 4.5 21.8 13.5 13.0 22.1 24.3 0.2
(0.1*, 0.1**)
ND
(a) After microwave extraction
ND – Not determined * Polar fractions not analysed because of high amounts of interfering matrix material ** Non-polar fractions not analysed because of high amounts of interfering matrix material
U2, CGA132465 a; U3a, CGA132465 b; U4a and U6, CGA132465 a; U4b and U5, CGA132465 b
Table 29 Identification of total radioactive residues in goat tissues and milk following four consecutive doses of [14C-phenyl] penconazole to lactating goats, expressed as µg eq/kg
Animal parts
Quantity found (µg eq/kg) Total U1 Sulfate
conjugatesCGA177281 U3b
Glucuronide conjugates
CGA 177279
CGA 132465 b
CGA 132465 a
U9 N10 Parent Unres. Unext.
U2 U3a U4a+b U5 U6 Muscle 16 6.5 4.5 14 4.5 8.3 39 20 46 7.4 1.5
(0.3*, 1.2**)
4.9
Fat 74 30 45 30 22 176 51 178 114 25 (20*, 5.5**)
59
Fat (a) 59 22 2.9 2.1 0.9 1.1* 30 Liver 5326 82 209 320 212 247 968 405 2226 94** 331 Liver (a) 331 90 79 59 Kidney 5288 97 574 956 293 416 1206 432 420 496 43** 71 Kidney (a)
71 4.7
Milk 105 16 56 8.3 3.8 11 0.8 2.2** 0.2
(a): After microwave extraction
ND – Not determined * Polar fractions not analysed because of high amounts of interfering matrix material ** Non-polar fractions not analysed because of high amounts of interfering matrix material
CGA177279 was the predominant metabolites in most tissues found in muscle (24% TRR, 0.039 mg eq/kg), fat (24% TRR, 0.18 mg eq/kg), kidney (ca. 23% TRR, 1.2 mg eq/kg), liver (4.0% TRR, 0.21 mg eq/kg) and milk (7.9% TRR, 0.008 mg eq/kg).
CGA132465, diastereoisomers a and b, were found as the major metabolites in muscle (41% TRR, 0.066 mg eq/kg), fat (31% TRR, 0.23 mg eq/kg), liver (25% TRR, 1.3 mg eq/kg), kidney (11.2% TRR, 0.43 mg eq/kg) and milk (14% TRR, 0.015 mg eq/kg).
CGA132465a and CGA132465b were also found as glucuronic acid conjugates (U4a, U4b, U5 and U6, shown to be stereoisomers) in kidney (32% TRR, 1.7 mg eq/kg), muscle (17% TRR, 0.027 mg eq/kg), fat (13% TRR, 0.097 mg eq/kg) and liver (9.9% TRR, 0.53 mg eq/kg).

Penconazole
1839
Two sulfuric acid conjugates of CGA132465 were found as major metabolites in milk (69% TRR, 0.072 mg eq/kg). They were also found in other samples, kidney (13% TRR, 0.67 mg eq/kg), muscle (6.8% TRR, 0.01 mg eq/kg), fat (ca. 4.0% TRR, including others) and liver (1.5% TRR, including others).
The metabolite N10, a glucuronic acid conjugate of penconazole, was found only in liver (7.6% TRR, 0.41 mg eq/kg), kidney (8.0% TRR 0.42 mg eq/kg) and urine (0.3% TRR). Hydroxylation of CGA177279 led to metabolite U3b (CGA177281), which was a minor urinary metabolite.
Extractability from initial extraction was high ( 90% TRR). Metabolite profiles of microwave extracts on unextracted residues were comparable to those from the initial extraction.
Figure 2 Proposed metabolic pathway of penconazole in lactating goat
The metabolic pathway of penconazole in goats is shown as proceeded by way of the following steps (Figure 2):
oxidation of penconazole to form the carboxylic acid CGA177279
hydroxylation of penconazole to form the secondary alcohol CGA132465
hydroxylation of CGA177279 to CGA177281 as a minor metabolite in urine
conjugation of CGA132465 with glucuronic acid to produce stereoisomers U4a (CGA132465 a), U4b (CGA132465 b), U5 (CGA132465 b) and U6 (CGA132465 a)found in tissues and urine
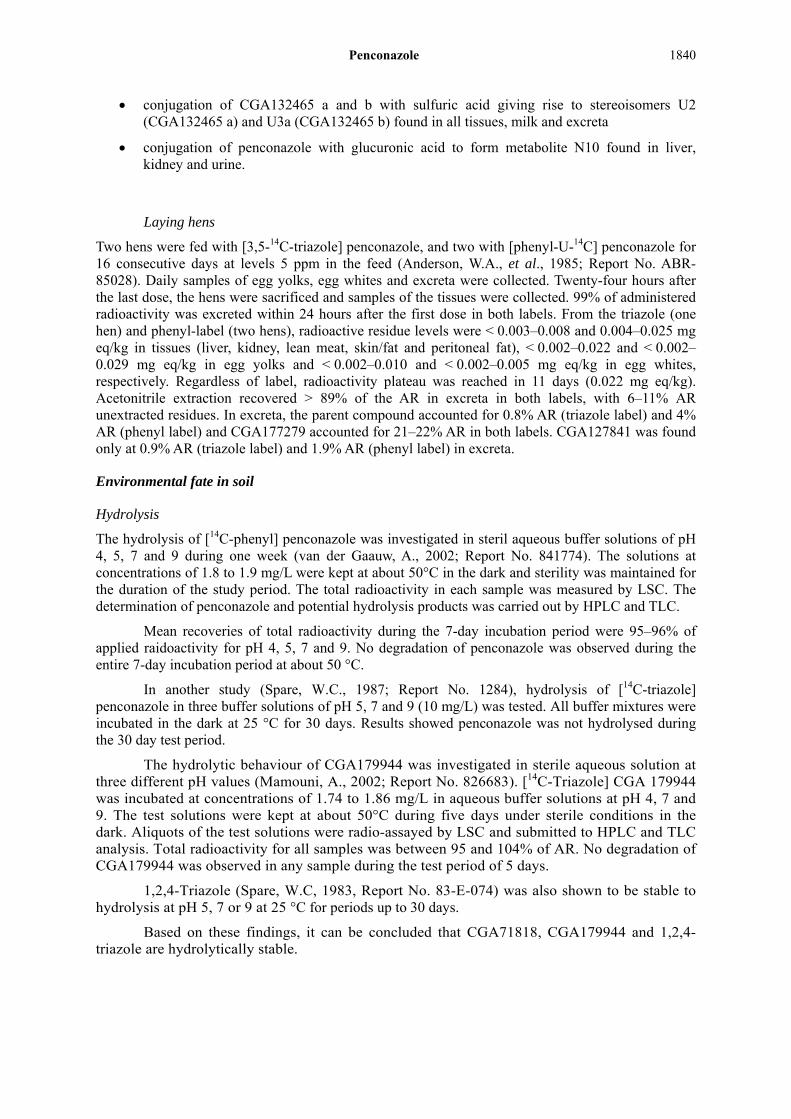
Penconazole
1840
conjugation of CGA132465 a and b with sulfuric acid giving rise to stereoisomers U2 (CGA132465 a) and U3a (CGA132465 b) found in all tissues, milk and excreta
conjugation of penconazole with glucuronic acid to form metabolite N10 found in liver, kidney and urine.
Laying hens
Two hens were fed with [3,5-14C-triazole] penconazole, and two with [phenyl-U-14C] penconazole for 16 consecutive days at levels 5 ppm in the feed (Anderson, W.A., et al., 1985; Report No. ABR-85028). Daily samples of egg yolks, egg whites and excreta were collected. Twenty-four hours after the last dose, the hens were sacrificed and samples of the tissues were collected. 99% of administered radioactivity was excreted within 24 hours after the first dose in both labels. From the triazole (one hen) and phenyl-label (two hens), radioactive residue levels were < 0.003–0.008 and 0.004–0.025 mg eq/kg in tissues (liver, kidney, lean meat, skin/fat and peritoneal fat), < 0.002–0.022 and < 0.002–0.029 mg eq/kg in egg yolks and < 0.002–0.010 and < 0.002–0.005 mg eq/kg in egg whites, respectively. Regardless of label, radioactivity plateau was reached in 11 days (0.022 mg eq/kg). Acetonitrile extraction recovered > 89% of the AR in excreta in both labels, with 6–11% AR unextracted residues. In excreta, the parent compound accounted for 0.8% AR (triazole label) and 4% AR (phenyl label) and CGA177279 accounted for 21–22% AR in both labels. CGA127841 was found only at 0.9% AR (triazole label) and 1.9% AR (phenyl label) in excreta.
Environmental fate in soil
Hydrolysis
The hydrolysis of [14C-phenyl] penconazole was investigated in steril aqueous buffer solutions of pH 4, 5, 7 and 9 during one week (van der Gaauw, A., 2002; Report No. 841774). The solutions at concentrations of 1.8 to 1.9 mg/L were kept at about 50°C in the dark and sterility was maintained for the duration of the study period. The total radioactivity in each sample was measured by LSC. The determination of penconazole and potential hydrolysis products was carried out by HPLC and TLC.
Mean recoveries of total radioactivity during the 7-day incubation period were 95–96% of applied raidoactivity for pH 4, 5, 7 and 9. No degradation of penconazole was observed during the entire 7-day incubation period at about 50 °C.
In another study (Spare, W.C., 1987; Report No. 1284), hydrolysis of [14C-triazole] penconazole in three buffer solutions of pH 5, 7 and 9 (10 mg/L) was tested. All buffer mixtures were incubated in the dark at 25 °C for 30 days. Results showed penconazole was not hydrolysed during the 30 day test period.
The hydrolytic behaviour of CGA179944 was investigated in sterile aqueous solution at three different pH values (Mamouni, A., 2002; Report No. 826683). [14C-Triazole] CGA 179944 was incubated at concentrations of 1.74 to 1.86 mg/L in aqueous buffer solutions at pH 4, 7 and 9. The test solutions were kept at about 50°C during five days under sterile conditions in the dark. Aliquots of the test solutions were radio-assayed by LSC and submitted to HPLC and TLC analysis. Total radioactivity for all samples was between 95 and 104% of AR. No degradation of CGA179944 was observed in any sample during the test period of 5 days.
1,2,4-Triazole (Spare, W.C, 1983, Report No. 83-E-074) was also shown to be stable to hydrolysis at pH 5, 7 or 9 at 25 °C for periods up to 30 days.
Based on these findings, it can be concluded that CGA71818, CGA179944 and 1,2,4-triazole are hydrolytically stable.

Penconazole
1841
Photolysis
Photolytic degradation of penconazole was tested at a concentration of 10 mg/kg using natural sunlight on soil (Spare W.C., 1987; Report No. 1282-A). Analytical grade triazole ring labelled 14C-penconazole was prepared in acetonitrile. Aliquots of the solution were evaporated on California clay loam soil films which were prepared on the inner surface of Pyrex petri dishes. Natural sunlight
intensity ranged from 10 to 2000 µW/cm2 during the exposure period (0, 1, 2, 4, 7, 14, 21 and 30 days). The dark controls were covered with aluminium foil but had the same environmental exposure as the exposed dished. Soil samples were extracted with methanol, spotted on TLC plates. Data were finally evaluated using pseudo-first order reaction kinetics to determine the half-life and rate constant.
The results demonstrated that penconazole was slowly photolyzed under natural sunlight,
accounting for 80% of AR at day 30. The half-life was 148 days with a 4.68x10⁻² day -1 rate constant. No photodegradation products greater than 5% of applied radioactivity were observed at any time during the study.
In investigation of the molar extinction coefficient above 290 nm (Roth, M., 1998; Report No. 66247), penconazole in buffer solutions of pH 5, 7 and 9 was stable in the range of 290–400 nm against photolysis.
Aerobic degradation in soil
Aerobic laboratory soil degradation studies (Völkl S., 2002; Report No. 822778/Glänzel, A., 1999; Report No. 98AG01/Knoch, E., 1993; Report No. 246903/Abildt, U., 1989; Report No. 08/89, 9/89, 10/89/Keller, A., 1982; Report No. 41/82) demonstrated that penconazole is degraded under non-sterile incubation conditions to several metabolites and unextractable residues, and progressively mineralised to carbon dioxide. The degradation rate is shown in Table 30.
Penconazole was stable in aerobic sterile soil, accounting for 86% of AR at day 84 (Keller, A., 1982; Report No. 41/82). The principle mechanism of penconazole degradation in soil is therefore via aerobic soil microorganisms. Only two metabolites exceeded 10% of the AR, CGA179944 with a maximum of 20% AR and
1,2,4-triazole with a maximum of 40% AR. Under standard aerobic conditions concentrations decreased towards the end of the studies. No degradation products derived from the phenyl-moiety of penconazole were detected indicating rapid breakdown.
Most metabolites found in aerobic penconazole degradation were minor metabolites accounting for less than 5% of AR. Identification was not generally possible due to the low amounts formed and transient occurrence.
CGA179944 was unstable in aerobic soil, < 1% of the AR at day 100 (Völkl S., 2002; Report No. 826536). The most prominent metabolite, 1,2,4-triazole, was at a high peak of 49% of AR and a further metabolite (M2) accounted for 11% of AR. All the others were very minor (0.1–2.3% of AR).
1,2,4-Triazole was unstable in aerobic soil, accounting for 2–31% of the AR at day 120 (Slangen, P.J., 2000; Report No. 278336). The major metabolite, TA, was at < 7% of the AR and
others were ≤ 2.6% of the AR. The principal fate of 1,2,4-triazole is believed to lead to the formation of bound residues and some carbon dioxide. Under anaerobic conditions 1,2,4-triazole degraded at a moderate rate to TAA, which accounted for 30% AR from water logged soil and 20% AR from soil at day 122 (Mamouni, A., 2003; Report No. 798660).
The mineralisation of penconazole to carbon dioxide proceeded continuously throughout the aerobic incubation periods. Penconazole is mineralised in laboratory studies within 12 months up to ca. 38% AR, depending on soil type, soil moisture, temperature and application rate (Abildt, U., 1989; Report No. 08/89; Knoch, E., 1993; Report No. 246903).
Data from comparable experiments with both radiolabels indicated that degradation to carbon dioxide was about one order of magnitude greater in the phenyl-ring (31% of AR at day 364; Abildt,
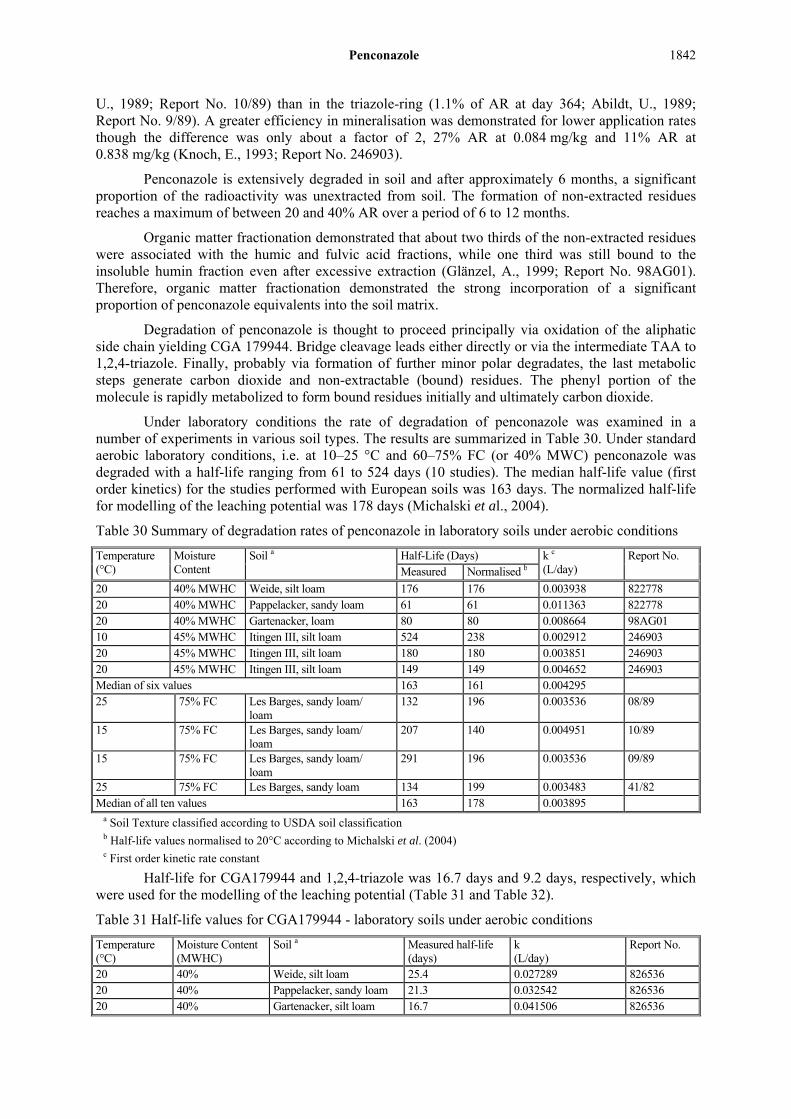
Penconazole
1842
U., 1989; Report No. 10/89) than in the triazole-ring (1.1% of AR at day 364; Abildt, U., 1989; Report No. 9/89). A greater efficiency in mineralisation was demonstrated for lower application rates though the difference was only about a factor of 2, 27% AR at 0.084 mg/kg and 11% AR at 0.838 mg/kg (Knoch, E., 1993; Report No. 246903).
Penconazole is extensively degraded in soil and after approximately 6 months, a significant proportion of the radioactivity was unextracted from soil. The formation of non-extracted residues reaches a maximum of between 20 and 40% AR over a period of 6 to 12 months.
Organic matter fractionation demonstrated that about two thirds of the non-extracted residues were associated with the humic and fulvic acid fractions, while one third was still bound to the insoluble humin fraction even after excessive extraction (Glänzel, A., 1999; Report No. 98AG01). Therefore, organic matter fractionation demonstrated the strong incorporation of a significant proportion of penconazole equivalents into the soil matrix.
Degradation of penconazole is thought to proceed principally via oxidation of the aliphatic side chain yielding CGA 179944. Bridge cleavage leads either directly or via the intermediate TAA to 1,2,4-triazole. Finally, probably via formation of further minor polar degradates, the last metabolic steps generate carbon dioxide and non-extractable (bound) residues. The phenyl portion of the molecule is rapidly metabolized to form bound residues initially and ultimately carbon dioxide.
Under laboratory conditions the rate of degradation of penconazole was examined in a number of experiments in various soil types. The results are summarized in Table 30. Under standard aerobic laboratory conditions, i.e. at 10–25 °C and 60–75% FC (or 40% MWC) penconazole was degraded with a half-life ranging from 61 to 524 days (10 studies). The median half-life value (first order kinetics) for the studies performed with European soils was 163 days. The normalized half-life for modelling of the leaching potential was 178 days (Michalski et al., 2004).
Table 30 Summary of degradation rates of penconazole in laboratory soils under aerobic conditions
Temperature (°C)
Moisture Content
Soil a Half-Life (Days) k c (L/day)
Report No. Measured Normalised b
20 40% MWHC Weide, silt loam 176 176 0.003938 822778 20 40% MWHC Pappelacker, sandy loam 61 61 0.011363 822778 20 40% MWHC Gartenacker, loam 80 80 0.008664 98AG01 10 45% MWHC Itingen III, silt loam 524 238 0.002912 246903 20 45% MWHC Itingen III, silt loam 180 180 0.003851 246903 20 45% MWHC Itingen III, silt loam 149 149 0.004652 246903 Median of six values 163 161 0.004295 25 75% FC Les Barges, sandy loam/
loam 132 196 0.003536 08/89
15 75% FC Les Barges, sandy loam/ loam
207 140 0.004951 10/89
15 75% FC Les Barges, sandy loam/ loam
291 196 0.003536 09/89
25 75% FC Les Barges, sandy loam 134 199 0.003483 41/82 Median of all ten values 163 178 0.003895
a Soil Texture classified according to USDA soil classification b Half-life values normalised to 20°C according to Michalski et al. (2004) c First order kinetic rate constant
Half-life for CGA179944 and 1,2,4-triazole was 16.7 days and 9.2 days, respectively, which were used for the modelling of the leaching potential (Table 31 and Table 32).
Table 31 Half-life values for CGA179944 - laboratory soils under aerobic conditions
Temperature (°C)
Moisture Content (MWHC)
Soil a Measured half-life (days)
k (L/day)
Report No.
20 40% Weide, silt loam 25.4 0.027289 826536 20 40% Pappelacker, sandy loam 21.3 0.032542 826536 20 40% Gartenacker, silt loam 16.7 0.041506 826536

Penconazole
1843
Temperature (°C)
Moisture Content (MWHC)
Soil a Measured half-life (days)
k (L/day)
Report No.
20 40% Weide, silt loam 7.3 0.094952 822778 20 40% Pappelacker, sandy loam 8.6 0.080599 822778 Median 0.041506 (16.7 days)
a Soil Texture classified according to USDA soil classification
Table 32 Half-life Values for 1,2,4-triazole - laboratory soils under aerobic conditions Temperature
(°C) Moisture Content (MWHC)
Soil a Measured half-life (days)
k (L/day)
Report No.
20 40% Laacherhof AXXa, sandy loam 6.3 0.110023 278336 20 40% Hanhofen, loamy sand 9.9 0.070015 278336 20 40% Lacherhof III, silt loam 12.3 0.056353 278336
Geometric Mean 0.075718(9.2 days) a Soil Texture classified according to USDA soil classification
Penconazole was very rapidly adsorbed onto sediment with a water dissipation half-life of 2.2 to 3.3 days, and its degradation in the sediment was relatively slow (Mamouni, A., 1998; Report No. 616860). The total system half-life was 706 days determined at 20°C. CGA179944 was the only major metabolite, occurring at maximum amounts of 22% AR in the river system (a maximum of 17% AR in the water phase) and 6% of AR in the pond system. The half-life of CGA179944 in the river system was estimated to be 235 days. No calculation was possible for the dissipation of CGA179944 from the pond system due to the low amounts formed. Small amounts (< 3% of the applied dose) of four unknown metabolites were found in the water and sediment compartments of the aquatic systems.
Figure 3 Proposed degradation pathway for penconazole in soil
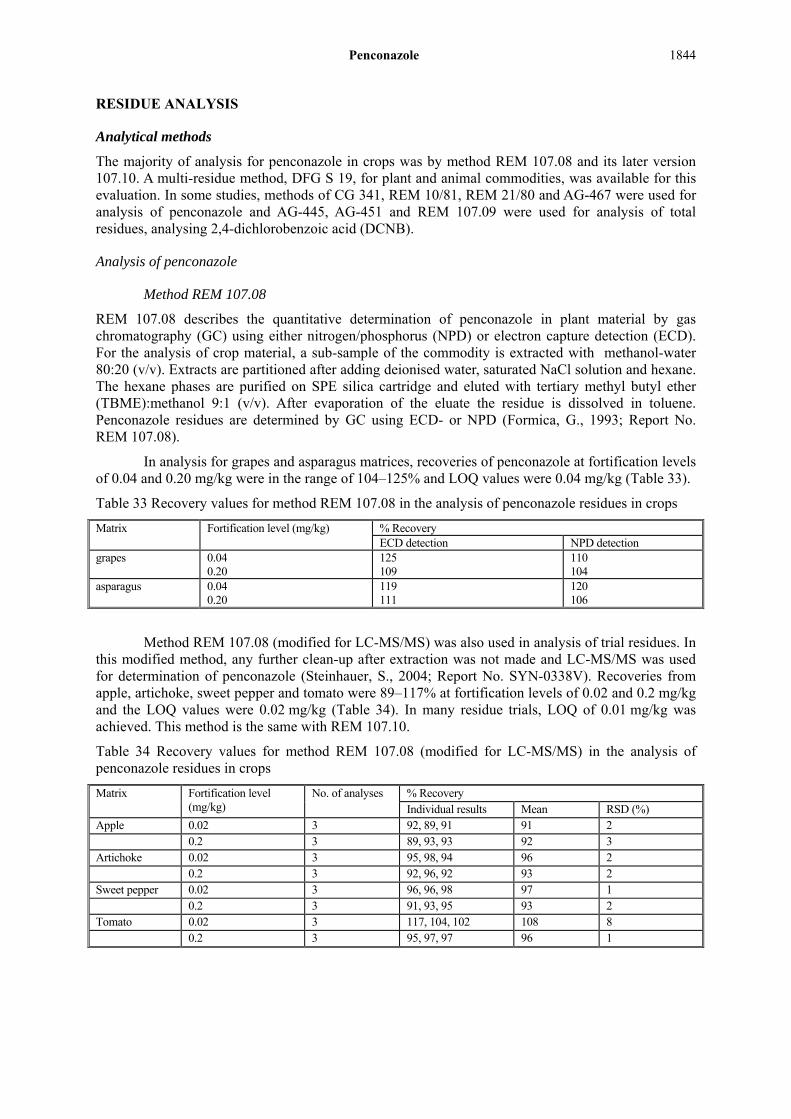
Penconazole
1844
RESIDUE ANALYSIS
Analytical methods
The majority of analysis for penconazole in crops was by method REM 107.08 and its later version 107.10. A multi-residue method, DFG S 19, for plant and animal commodities, was available for this evaluation. In some studies, methods of CG 341, REM 10/81, REM 21/80 and AG-467 were used for analysis of penconazole and AG-445, AG-451 and REM 107.09 were used for analysis of total residues, analysing 2,4-dichlorobenzoic acid (DCNB).
Analysis of penconazole
Method REM 107.08
REM 107.08 describes the quantitative determination of penconazole in plant material by gas chromatography (GC) using either nitrogen/phosphorus (NPD) or electron capture detection (ECD). For the analysis of crop material, a sub-sample of the commodity is extracted with methanol-water 80:20 (v/v). Extracts are partitioned after adding deionised water, saturated NaCl solution and hexane. The hexane phases are purified on SPE silica cartridge and eluted with tertiary methyl butyl ether (TBME):methanol 9:1 (v/v). After evaporation of the eluate the residue is dissolved in toluene. Penconazole residues are determined by GC using ECD- or NPD (Formica, G., 1993; Report No. REM 107.08).
In analysis for grapes and asparagus matrices, recoveries of penconazole at fortification levels of 0.04 and 0.20 mg/kg were in the range of 104–125% and LOQ values were 0.04 mg/kg (Table 33).
Table 33 Recovery values for method REM 107.08 in the analysis of penconazole residues in crops
Matrix Fortification level (mg/kg) % Recovery ECD detection NPD detection
grapes 0.04 0.20
125 109
110 104
asparagus 0.04 0.20
119 111
120 106
Method REM 107.08 (modified for LC-MS/MS) was also used in analysis of trial residues. In this modified method, any further clean-up after extraction was not made and LC-MS/MS was used for determination of penconazole (Steinhauer, S., 2004; Report No. SYN-0338V). Recoveries from apple, artichoke, sweet pepper and tomato were 89–117% at fortification levels of 0.02 and 0.2 mg/kg and the LOQ values were 0.02 mg/kg (Table 34). In many residue trials, LOQ of 0.01 mg/kg was achieved. This method is the same with REM 107.10.
Table 34 Recovery values for method REM 107.08 (modified for LC-MS/MS) in the analysis of penconazole residues in crops
Matrix Fortification level (mg/kg)
No. of analyses % Recovery Individual results Mean RSD (%)
Apple 0.02 3 92, 89, 91 91 2 0.2 3 89, 93, 93 92 3 Artichoke 0.02 3 95, 98, 94 96 2 0.2 3 92, 96, 92 93 2 Sweet pepper 0.02 3 96, 96, 98 97 1 0.2 3 91, 93, 95 93 2 Tomato 0.02 3 117, 104, 102 108 8 0.2 3 95, 97, 97 96 1

Penconazole
1845
Method REM 107.10
The method REM 107.10 is the same with the method REM 107.08 (modified for LC-MS/MS) (Gill, J.P., 2004; Report No. REM 107. 10). Samples are extracted by shaking with methanol: water (80:20, v/v). Extracts are filtered and diluted with water acidified with formic acid (0.1%). Final determination is by HPLC with column switching and LC-MS/MS (Q1, m/z 284; Q3, m/z 159 for quantitation and m/z 70 for confirmation).
In a validation study for grape and cucumbers (Gill, J.P., 2004; Report No., RJ3494B), the linearity of the detector response covered a working range of 0.0001–0.05 µg/L penconazole and a correlation coefficient of 1.0. Recoveries at fortification levels of 0.01 and 0.1 mg/kg were in the range of 89–112% and LOQs were 0.01 mg/kg.
In another validation study for strawberry, peach and apple (Rzepka, S., 2005; Report No., SYN-0338V), recoveries ranged from 80% to 109% (RSD, <11%) at a fortification level of 0.01 mg/kg and LOQs were 0.01 mg/kg.
Table 35 Recovery values for method REM 107.10 in the analysis of penconazole residues in crops
Matrix Fortification level (mg/kg)
No. of analyses
% Recovery Report No.
Individual results Mean RSD (%)
Cucumbers 0.01 5 106, 101, 101, 106, 100 103 3 RJ3494B 0.10 5 111, 101, 112, 108, 110 108 4
Grapes 0.01 5 93, 89, 94, 93, 97 93 3 RJ3494B 0.10 5 91, 92, 90, 91, 89 91 1
Strawberry 0.01 3 96, 109, 107 104 7 SYN-0338V, 2005 Peach 0.01 3 109, 87, 96 91 11 SYN-0338V, 2005 Apple 0.01 3 95, 80, 98 97 11 SYN-0338V, 2005
Method CG 341
This method was used in two trials on blackcurrant (Report No., CSTR/016:1, 1989; CSTR/016:2, 1990). Sample is extracted using methanol, then partitioned into dichloromethane. Final determination is carried out by GC-ECD. The LOQ was 0.01 (Report No. CSTR/016:2) or 0.02 (Report No. CSTR/016:1) mg/kg, which were not validated.
Table 36 Recovery values for method CG 341 in the analysis of penconazole residues in blackcurrants
Matrix Fortification level (mg/kg)
No. of analyses
Residue (mg/kg) Individual value
Mean residue % Mean recovery
RSD (%)
Report No.
Blackcurrants 0.11 4 0.10, 0.10, 0.14, 0.15 0.12 109 21 CSTR/016:1 0.21 4 0.24, 0.25, 0.25, 0.24 0.25 119 2 0.53 4 0.59, 0.57, 0.61, 0.60 0.59 111 3 0.22 6 0.26, 0.26, 0.27, 0.26,
0.20, 0.19 0.24 109 15 CSTR/016:2
0.45 4 0.40, 0.45, 0.35, 0.43 0.41 91 11 0.90 4 0.70, 0.70, 0.75, 0.77 0.73 81 5
Method REM 10/81, REM 21/80
Methanol is used for extraction. Extracts are partitioned with dichloromethane and cleaned up by gel permeation chromatography (GPC) (REM10/81) or EXTREULT column (REM 21/80) and then penconazole is determined by GC-NPD. A validation study was not performed. These were used in storage stability tests, where 0 day analysis or procedural recovery tests showed satisfactory recoveries at fortification levels of 5 mg/kg in apple and grape (REM 10/81) and 0.5 mg/kg in grape (REM 21/80). Taking efficiency of analysis of penconazole in a similar method (CG 341) into account, the storage stability test results were considered as valid.
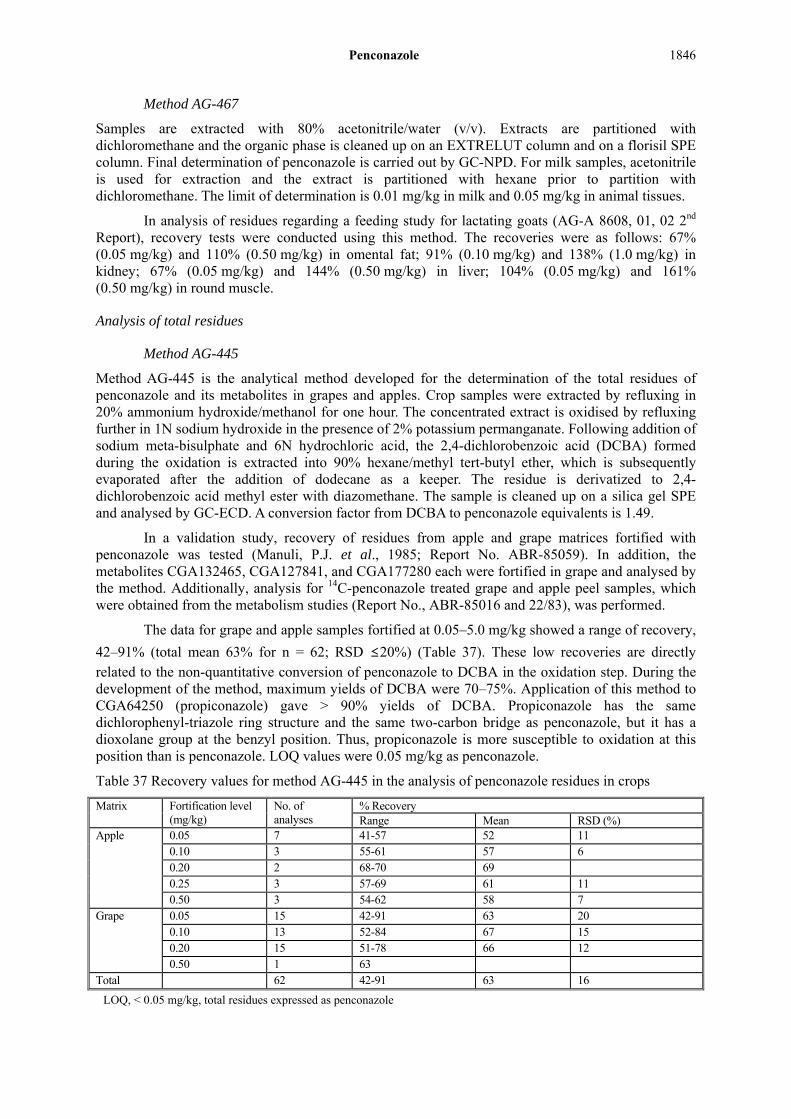
Penconazole
1846
Method AG-467
Samples are extracted with 80% acetonitrile/water (v/v). Extracts are partitioned with dichloromethane and the organic phase is cleaned up on an EXTRELUT column and on a florisil SPE column. Final determination of penconazole is carried out by GC-NPD. For milk samples, acetonitrile is used for extraction and the extract is partitioned with hexane prior to partition with dichloromethane. The limit of determination is 0.01 mg/kg in milk and 0.05 mg/kg in animal tissues.
In analysis of residues regarding a feeding study for lactating goats (AG-A 8608, 01, 02 2nd Report), recovery tests were conducted using this method. The recoveries were as follows: 67% (0.05 mg/kg) and 110% (0.50 mg/kg) in omental fat; 91% (0.10 mg/kg) and 138% (1.0 mg/kg) in kidney; 67% (0.05 mg/kg) and 144% (0.50 mg/kg) in liver; 104% (0.05 mg/kg) and 161% (0.50 mg/kg) in round muscle.
Analysis of total residues
Method AG-445
Method AG-445 is the analytical method developed for the determination of the total residues of penconazole and its metabolites in grapes and apples. Crop samples were extracted by refluxing in 20% ammonium hydroxide/methanol for one hour. The concentrated extract is oxidised by refluxing further in 1N sodium hydroxide in the presence of 2% potassium permanganate. Following addition of sodium meta-bisulphate and 6N hydrochloric acid, the 2,4-dichlorobenzoic acid (DCBA) formed during the oxidation is extracted into 90% hexane/methyl tert-butyl ether, which is subsequently evaporated after the addition of dodecane as a keeper. The residue is derivatized to 2,4-dichlorobenzoic acid methyl ester with diazomethane. The sample is cleaned up on a silica gel SPE and analysed by GC-ECD. A conversion factor from DCBA to penconazole equivalents is 1.49.
In a validation study, recovery of residues from apple and grape matrices fortified with penconazole was tested (Manuli, P.J. et al., 1985; Report No. ABR-85059). In addition, the metabolites CGA132465, CGA127841, and CGA177280 each were fortified in grape and analysed by the method. Additionally, analysis for 14C-penconazole treated grape and apple peel samples, which were obtained from the metabolism studies (Report No., ABR-85016 and 22/83), was performed.
The data for grape and apple samples fortified at 0.05–5.0 mg/kg showed a range of recovery,
42–91% (total mean 63% for n = 62; RSD ≤20%) (Table 37). These low recoveries are directly related to the non-quantitative conversion of penconazole to DCBA in the oxidation step. During the development of the method, maximum yields of DCBA were 70–75%. Application of this method to CGA64250 (propiconazole) gave > 90% yields of DCBA. Propiconazole has the same dichlorophenyl-triazole ring structure and the same two-carbon bridge as penconazole, but it has a dioxolane group at the benzyl position. Thus, propiconazole is more susceptible to oxidation at this position than is penconazole. LOQ values were 0.05 mg/kg as penconazole.
Table 37 Recovery values for method AG-445 in the analysis of penconazole residues in crops
Matrix Fortification level (mg/kg)
No. of analyses
% Recovery Range Mean RSD (%)
Apple 0.05 7 41-57 52 11 0.10 3 55-61 57 6 0.20 2 68-70 69 0.25 3 57-69 61 11 0.50 3 54-62 58 7
Grape 0.05 15 42-91 63 20 0.10 13 52-84 67 15 0.20 15 51-78 66 12 0.50 1 63
Total 62 42-91 63 16
LOQ, < 0.05 mg/kg, total residues expressed as penconazole

Penconazole
1847
With recoveries of metabolites fortified at 0.1 mg/kg in grape, CGA132465 and CGA127841 were recovered at levels of 60–63% (n = 2) and 54–58% (n = 2), respectively. CGA177280 was recovered at a lower level of 28–32% (n = 2).
In analysis for grapes (three samples) and apple peel freeze-dried (one sample) treated with 14C-penconazole, the recovery of residues resulted in 48% TRR, 60% TRR, 54% TRR and 52% TRR (apple peel), while penconazole accounted for 11% TRR (TRR, 0.049 mg eq/kg), 38% TRR (TRR, 0.080 mg/kg), 29% TRR (TRR, 0.12 mg/kg) and 21% TRR (TRR, 2.36 mg/kg) TRR, respectively. The recoveries were not corrected with recovery for penconazole.
The specificity of the method AG-445 was tested for 108 pesticide chemicals having permanent tolerances (maximum residue limits) for use in grapes and apples (Kahrs, R.A., 1987: Report No. ABR-85040). Fortifications of each compound were calculated for the maximum tolerance level assuming a 15 g sample size. In addition to the fortified samples, a recovery sample for penconazole (fortified at 0.1 mg/kg) and the reagent blank were also included in the analysis. The results demonstrated that none of the 108 pesticides tested caused interference (> 0.05 mg/kg). Therefore, the method AG-445 was suitably specific for determination of penconazole along with the tested 108 chemicals. Untested 9 chemicals having tolerances were not considered likely sources of interferences based on their chemical and/or physical properties or their similarity to other compounds included in the study. It is noted, however, that compounds yielding DCBA, e.g., propiconazole, were not considered in the study. Recovery of penconazole fortified was 55%.
Method AG-451
This method is the same with the AG-445 (for crop) except extraction using 80% acetonitrile instead of refluxing in 20% ammonium hydroxide/methanol. LOQ of total residues was 0.01 mg/kg in milk and 0.05 mg/kg in animal tissues.
The validation study (Williams, R.K. and Ross, J.A., 1985; Report No., ABR-85008) showed recovery results as follows: 60–67% in milk; 76–82% in eggs; 70–83% in cow liver; 71–77% in cow kidney; 61–65% in cow round; 39–62% in cow perirenal fat; 48–70% in poultry lean meat; 50–63% in poultry fat; 55–61% in poultry liver; 52–62% in poultry skin. The tests were performed at fortification levels of 0.05, 0.20 and 0.20 mg/kg except milk (0.01, 0.02 and 0.05 mg/kg) and number of analyses was totally 3 in each matrix.
Method REM 107.09
This method is similar to the method AG-445 except final determination by HPLC. Residues are extracted by refluxing with 20% concentrated (25%) ammonium hydroxide/methanol for one hour. The mixture is allowed to cool and filtered. An aliquot of the filtrate is evaporated to dryness. Sodium hydroxide is added to the residue and to the aliquot of the liquid samples into the round bottom flask. Potassium permanganate is added and the mixtures are then refluxed for 30 minutes. The excess of permanganate is reduced to manganese dioxide with ethanol. Concentrated hydrochloric acid and sodium disulfite are added and then partitioned using hexane and methyl tert.-butyl ether. An aliquot of the re-extract is cleaned up by alkaline/acidic partition. Additional clean-up and final determination are performed by a two column HPLC switching system with UV-detection.
In the validation study, recoveries of penconazole from liquid matrices (wine, must, juice) were 62–80% and 64–70% at fortification levels of 0.06 and 0.60 mg/kg, respectively. The recoveries from grape and raisin matrices were 72% and 58–61% at a level of 0.07 mg/kg, and 67% and 52–67% at a level of 0.70 mg/kg, respectively. For raisin waste, dry pomace and wet pomace, the recoveries were 57–65% at a level of 0.20 mg/kg and 59–67% at a level of 2.0 mg/kg. In the recoveries, some were corrected for control values. LOQs were 0.06 mg/kg for the liquid matrices, 0.07 mg/kg for grape and raisin and 0.20 mg/kg for pomace and raisin waste.

Penconazole
1848
Multi-residue analysis for parent penconazole
Multi-residue method, DFG S 19
The analytical method DFG S 19 (extended revision) for the determination of penconazole residues in plant material was validated for lettuce, apple, wheat grain, and sunflower seeds (Weber, H., 2000: Report No. NOV-0001V, Az. G0089). To check the method efficiency, recovery experiments were conducted with fortifications of 0.01 mg/kg and 0.1 mg/kg. The extractions of penconazole were performed according to extraction module E1 (lettuce and apple), E2 (wheat grain) and E7 (sunflower seed). Briefly, specimen material of lettuce, apple and wheat grain was extracted with acetone:water (2:1, v:v) and partitioned with ethyl acetate/cyclohexane (1+1). For sunflower seed, it was mixed intensively with a suspension of acetonitrile, acetone and synthetic calcium silicate and filtered. The evaporated residue of an aliquot of each organic phase was cleaned up by GPC on Bio Beads S-X3 polystyrene gel using a mixture of ethyl acetate/cyclohexane (1+1) as eluate. The fraction containing residues was concentrated, and analysed for penconazole by GC-MSD (module D4). The mass transition used for quantitation was m/e 248, and verification was done at m/e 159, 161 and 250.
This method was highly specific, in addition, no peaks and no matrix or reagent interferences were found at retention time corresponding to penconazole in control or blank samples. The linearity of the detector response covered a working range of 0.005–0.500 mg/L penconazole and a correlation coefficient of 0.9996. The LOQ was 0.01 mg/kg. The recoveries across all matrices and fortification levels ranged from 76–123% (RSD, <9.7%).
Table 38 Recovery values for method DFG S19 in the determination of penconazole residues in the four crop categories
Matrix Fortification level (mg/kg)
Number of analyses
Recovery (%) Individual results Mean RSD
Lettuce head 0.01 5 101, 123, 102, 112, 101 108 9.7 0.10 5 100, 99, 103, 115, 117 107 8.6 Overall 10 107 8.6
Apple fruit 0.01 5 91, 97, 111, 99, 97 99 7.3 0.10 5 109, 111, 101, 102, 108 106 4.4 Overall 10 103 6.9
Wheat grain 0.01 5 77, 76, 84, 78, 79 79 3.1 0.10 5 83, 86, 96, 84, 93 88 5.8 Overall 10 84 6.7
Sunflower seed 0.01 5 82, 94, 89, 98, 107 94 9.4 0.10 5 95, 102, 102, 99, 96 99 3.3 Overall 10 96 7.1
The method underwent independent laboratory validation (Pelz, S., 2001; Report No. NOV-0003V). Two crops, apple and sunflower seeds were fortified at 0.01 and 0.1 mg/kg. The recoveries across matrices and fortification levels were in the range of 72–88% (RSD, 6.9%) and therefore the multi–residue method DFG S 19 is suitable for routine analysis and post-registration enforcement.
Table 39 Recovery values for the independent laboratory validation (ILV) in the determination of penconazole in apple and sunflower
Matrix Fortification level (mg/kg)
No. of analyses
Recovery (%) Individual results Mean
RSD
Apple fruit 0.01 5 81, 77, 79, 84, 87 82 4.0 0.10 5 80, 87, 81, 77, 85 82 4.0 Overall 10 82 3.8
Sunflower seed 0.01 5 79, 72, 73, 73, 76 75 2.9 0.10 5 76, 88, 87, 80, 72 81 6.9 Overall 10 78 5.9

Penconazole
1849
The multi-residue method DFG S 19 (extended revision) was tested for animal matrices (Weber, H., 2001; Report No. NOV-0002V). The validation was conducted with milk, meat, egg, liver, kidney and animal fat at fortification levels of 0.01 mg/kg and 0.1 mg/kg. The extractions of penconazole were performed according to extraction module E1 (milk, meat, kidney, liver and eggs) and E7 (fat). Extracts were cleaned up by GPC and analysed by GC-MSD (module D4). The mass transition used for quantitation was m/e 248, and verification was done at m/e 159, 161 and 250. This method was highly specific, in addition, no peaks and no matrix or reagent interferences were found at retention time corresponding to penconazole in control or blank samples. The linearity of the detector response covered a working range of 0.005-0.500 mg/L penconazole and a correlation coefficient of 0.9996 for all samples except fat where the correlation coefficient was 0.9982. The LOQ was 0.01 mg/kg in milk, meat, eggs and fat and 0.1 mg/kg in liver and kidney (dilution needed due to matrix interferences in kidney and liver). The recoveries ranged 70–126% (RSD, < 23%) across matrices and fortification levels.
Table 40 Recovery values for DFG method S 19 in the determination of penconazole residues in the animal products
Matrix Fortification level (mg/kg)
No. of analyses
Recovery (%) Individual results Mean RSD
Milk 0.01 5 105, 103, 103, 86, 103 100 7.9 0.10 5 79, 113, 94, 93, 83 92 13.2 Overall 10 96 11.0 Meat 0.01 5 93, 116, 94, 114, 99 103 11.0 0.10 5 93, 96, 92, 93, 96 94 1.9 Overall 10 99 8.9 Egg 0.01 5 70, 79, 85, 76, 75 77 5.5 0.10 5 83, 87, 89, 90, 82 86 3.6 Overall 10 82 6.5 Liver 0.01 5 * 0.10 5 126, 103, 103, 120, 66 104 23.4 Kidney 0.01 5 * 0.10 5 99, 123, 99, 106, 99 105 10.4 Animal fat 0.01 5 93, 88, 82, 88, 95 89 5.1 0.10 5 92, 89, 65, 72, 68 77 12.4 Overall 10 83 11.0
* No evaluation possible due to interferences from the sample matrix.
The method underwent independent laboratory validation (Weeren, R.D., 2001; Report No. NOV-0004V). Meat, milk and eggs were fortified at 0.01 and 0.1 mg/kg. The recoveries across matrices and fortification levels were in the range of 76–119% (RSD, < 10%) and therefore the multi–residue method DFG S 19 is suitable for routine analysis and post-registration enforcement.
Table 41 Recovery values for the independent laboratory validation (ILV) in the determination of penconazole in milk, meat and egg
Matrix Fortification level (mg/kg)
No. of analyses
Recovery (%) Individual results Mean RSD
Milk 0.01 5 87, 87, 81, 84, 80 84 3.3 0.10 5 76, 81, 83, 95, 94 86 8.3 Overall 10 85 6.1 Meat 0.01 5 86, 92, 89, 89, 78 87 5.4 0.10 5 93, 93, 97, 92, 90 93 2.5 Overall 10 90 5.1 Egg 0.01 5 91, 119, 100, 99, 102 102 10.3 0.10 5 96, 101, 104, 88, 85 95 8.2 Overall 10 99 9.6

Penconazole
1850
Stability of pesticide residues in stored analytical samples
A study to demonstrate the stability of penconazole residues in samples of apples and grapes was conducted in 1982 (Büttler, B., 1982; Report No.SPR 17/82). Apple and grape samples were separately fortified, at a concentration of 5 mg/kg, with penconazole. These samples were then placed in frozen storage at <-20 °C. Samples of the crop matrices were analysed immediately after fortification and throughout a storage period of 16 months. Samples were analysed for penconazole by method REM 10/81. Concurrent recovery test was not performed and LOQ value was not reported.
Table 42 Stability of penconazole in apple and grape stored at -20 °C
Commodity Storage period (months)
Penconazole fortification level (mg/kg)
Penconazole found (mg/kg) Recovery (%)
Apple 0 day 5 4.7 94 1 5 4.6 92 3 5 4.5 90 6 5 4.3 86 16 5 4.8 96
Grape 0 5 4.8 96 1 5 4.6 92 3 5 4.6 92 6 5 4.4 88 16 5 4.6 92
The residues found in the crop commodities tested at each interval are detailed in Table 42. There was no significant change in the residue level of penconazole in any commodity during the 16–month storage period to date. Penconazole was found to be stable in grape and apple commodities when stored at -20 °C for periods up to 16 months.
A freezer storage study to determine the stability of penconazole and its metabolite residues in crop residues of grapes was conducted in 1985 (Clayton, F.B., et al., 1982; Report No. ABR-85051). Grape samples were fortified at a concentration of 0.5 mg/kg with penconazole. These samples were then placed in frozen storage at -15 °C for up to five months. Residues were analysed by a method REM 21/80. Procedural recovery tests were run concurrently with storage sample analyses. LOQ value was 0.05 mg/kg. Penconazole residue was found to be stable in grapes when stored at -15 °C for periods up to 5 months.
Table 43: Stability of penconazole in grape stored at -15 °C
Storage period (months)
Penconazole fortified at 0.5 mg/kg Fortified control (0 day) Storage sample mg/kg % mg/kg Recovery (%)
0 - - 0.50 100 0.55 109 1 0.46 92 0.63 126 0.64 128 2 0.65 131 0.54 108 0.60 120 4 0.44 87 0.42 84 0.43 86 5 0.38 75 0.58 116 0.55 110
In another experiment of the Report, grapes treated in the field with [14C-phenyl] penconazole (100 g ai/ha, 5 applications, 14 day PHI) were analysed following six months of freezer storage (≤ 15 °C) and the level of residues compared to those from the original sample analysis. The field derived samples were analysed for combined residues of parent compound and its metabolites by a

Penconazole
1851
method AG-445, in which LOQ is 0.05 mg/kg expressed as penconazole equivalents. Initial concentrations of residues were 0.081 mg/kg and 0.088 mg/kg, which were determined at 0.066 mg/kg and 0.098 mg/kg, respectively after 6 months. These results showed penconazole and its metabolites in grapes when stored frozen at ≤ 15 °C for a period of up to 6 months were stable.
A storage stability study of penconazole was conducted with cucumber and grapes (Rzepka S., 2005; Report No. SYN-0337). Samples of cucumbers and grapes were fortified with penconazole at a level of 0.5 mg/kg. The samples were stored in amber-glass bottles at or below -18 C and were analysed at 0, 1, 3, 6, 12 and 24 months. Analysis of penconazole was performed by a method 107.08 (modified for LC-MS/MS). LOQ value was 0.02 mg/kg in each matrix. Procedural recovery tests were run concurrently with storage sample analyses. There was no significant change in the residue level of penconazole in either commodity during the 24 months of storage. Penconazole was found to be stable in cucumber and grapes when stored at -18 °C for periods up to 24 months (Table 44).
Table 44 Stability of penconazole in cucumber and grape fortified at 0.5 mg/kg, stored at -18 °C
Storage period (month) 0 1 3 6(6.5)a 12 24 Cucumber samples Recovery (%) 95, 91, 92,
91, 92 91, 91, 94 98, 98, 98 80, 90, 84 93, 89, 91 84, 87, 85
Procedural recovery (%) - 92 103 93 97 86, 87, 83, 85
Grape samples Recovery (%) 94, 94, 96
90, 88 94, 91, 95 98, 98,
100 79, 74, 85 83, 86, 83 82, 79, 79
Procedural recovery (%) - 95 103 88 87 83, 82, 83
a 6 months for cucumber and 6.5 months for grapes
USE PATTERN
Penconazole is a systemic fungicide with protective and curative action. It is registered in many countries for foliar use on a wide range of crops. Table 45 represents a summary of GAPs from the labels submitted and relevant to the uses of penconazole proposed in this submission.
Table 45 Registered uses of penconazole
Crop Country Form.a Timing of application
Rate (kg ai/ha)
Water volume ( L/ha)
No. of appl.
Interval days
PHI (days)
Apple Italy (IT) EW pre-harvest 0.060-0.0675 1000-1500 2-3 7 14 Apple (outdoor) Belgium (BE) EC at first
symptoms 0.0255 - 4 7 14
Apples United Kingdom (GB)
EC 0.050 - 10 - 14
Apricot (field), Peach (field)
Germany (DE) EC 71- 0.0125 100-500 3 7-14 14
Artichoke, globe Italy (IT) EW - 0.025-0.050 600-1000 2-4 14-16 14 Blackcurrants United
Kingdom (GB) EC fist sigh of
disease 0.050 1,000-2,000 4 10-14 28
Cherries Lithuania (LT) EC first spray buds stage
0.050 600-1,000 2 10-14 20
Courgette Germany (DE) EC at beginning of infestation
0.050 400-600 4 7 3
Courgette, patisson (protected)
Belgium (BE) EC - 0.020 - 4 7 3
Cucumber (greenhouse)
Germany (DE) EC at beginning of infestation
0.025-0.050 600-1,200 4 7 3
Cucumber, gherkin (protected)
Belgium (BE) EC - 0.050 - 4 7 3
Fruiting vegetables, cucurbits
Italy (IT) EW - 0.025-0.050 600-1000 2-4 14-16 14
Grape (outdoor) Belgium (BE) EC preventively 0.021 - 3 - 35 Grape vine (table Germany (DE) EC 15-81 0.008-0.032 400-1,600 4 10-14 28 or 31
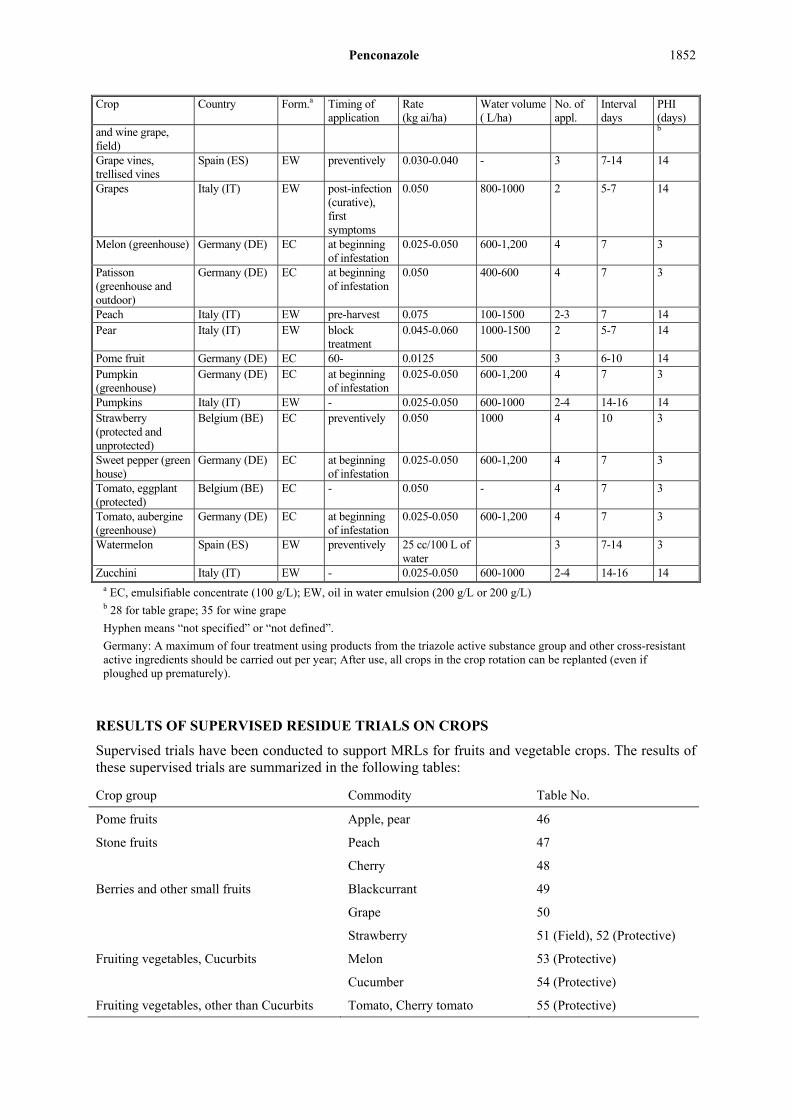
Penconazole
1852
Crop Country Form.a Timing of application
Rate (kg ai/ha)
Water volume ( L/ha)
No. of appl.
Interval days
PHI (days)
and wine grape, field)
b
Grape vines, trellised vines
Spain (ES) EW preventively 0.030-0.040 - 3 7-14 14
Grapes Italy (IT) EW
post-infection (curative), first symptoms
0.050 800-1000 2 5-7 14
Melon (greenhouse) Germany (DE) EC at beginning of infestation
0.025-0.050 600-1,200 4 7 3
Patisson (greenhouse and outdoor)
Germany (DE) EC at beginning of infestation
0.050 400-600 4 7 3
Peach Italy (IT) EW pre-harvest 0.075 100-1500 2-3 7 14 Pear Italy (IT) EW block
treatment 0.045-0.060 1000-1500 2 5-7 14
Pome fruit Germany (DE) EC 60- 0.0125 500 3 6-10 14 Pumpkin (greenhouse)
Germany (DE) EC at beginning of infestation
0.025-0.050 600-1,200 4 7 3
Pumpkins Italy (IT) EW - 0.025-0.050 600-1000 2-4 14-16 14 Strawberry (protected and unprotected)
Belgium (BE) EC preventively 0.050 1000 4 10 3
Sweet pepper (green house)
Germany (DE) EC at beginning of infestation
0.025-0.050 600-1,200 4 7 3
Tomato, eggplant (protected)
Belgium (BE) EC - 0.050 - 4 7 3
Tomato, aubergine (greenhouse)
Germany (DE) EC at beginning of infestation
0.025-0.050 600-1,200 4 7 3
Watermelon Spain (ES) EW preventively 25 cc/100 L of water
3 7-14 3
Zucchini Italy (IT) EW - 0.025-0.050 600-1000 2-4 14-16 14 a EC, emulsifiable concentrate (100 g/L); EW, oil in water emulsion (200 g/L or 200 g/L) b 28 for table grape; 35 for wine grape
Hyphen means “not specified” or “not defined”.
Germany: A maximum of four treatment using products from the triazole active substance group and other cross-resistant active ingredients should be carried out per year; After use, all crops in the crop rotation can be replanted (even if ploughed up prematurely).
RESULTS OF SUPERVISED RESIDUE TRIALS ON CROPS
Supervised trials have been conducted to support MRLs for fruits and vegetable crops. The results of these supervised trials are summarized in the following tables:
Crop group Commodity Table No.
Pome fruits Apple, pear 46
Stone fruits Peach 47
Cherry 48
Berries and other small fruits Blackcurrant 49
Grape 50
Strawberry 51 (Field), 52 (Protective)
Fruiting vegetables, Cucurbits Melon 53 (Protective)
Cucumber 54 (Protective)
Fruiting vegetables, other than Cucurbits Tomato, Cherry tomato 55 (Protective)
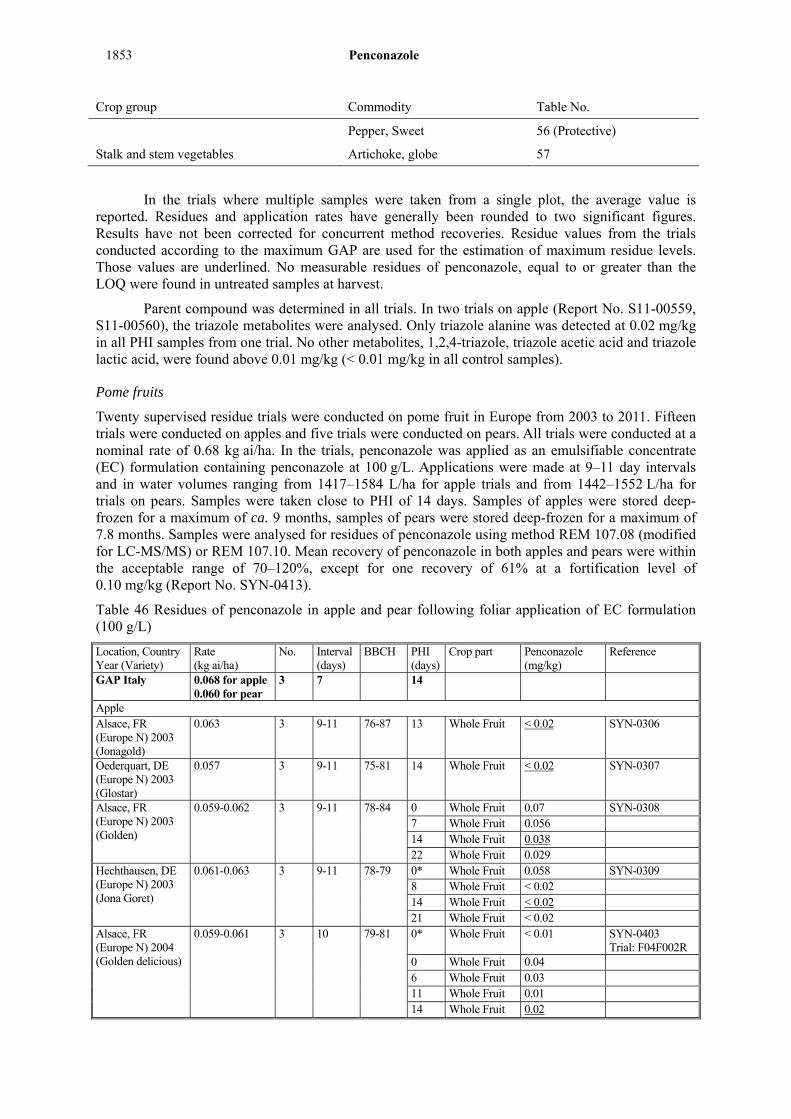
Penconazole
1853
Crop group Commodity Table No.
Pepper, Sweet 56 (Protective)
Stalk and stem vegetables Artichoke, globe 57
In the trials where multiple samples were taken from a single plot, the average value is reported. Residues and application rates have generally been rounded to two significant figures. Results have not been corrected for concurrent method recoveries. Residue values from the trials conducted according to the maximum GAP are used for the estimation of maximum residue levels. Those values are underlined. No measurable residues of penconazole, equal to or greater than the LOQ were found in untreated samples at harvest.
Parent compound was determined in all trials. In two trials on apple (Report No. S11-00559, S11-00560), the triazole metabolites were analysed. Only triazole alanine was detected at 0.02 mg/kg in all PHI samples from one trial. No other metabolites, 1,2,4-triazole, triazole acetic acid and triazole lactic acid, were found above 0.01 mg/kg (< 0.01 mg/kg in all control samples).
Pome fruits
Twenty supervised residue trials were conducted on pome fruit in Europe from 2003 to 2011. Fifteen trials were conducted on apples and five trials were conducted on pears. All trials were conducted at a nominal rate of 0.68 kg ai/ha. In the trials, penconazole was applied as an emulsifiable concentrate (EC) formulation containing penconazole at 100 g/L. Applications were made at 9–11 day intervals and in water volumes ranging from 1417–1584 L/ha for apple trials and from 1442–1552 L/ha for trials on pears. Samples were taken close to PHI of 14 days. Samples of apples were stored deep-frozen for a maximum of ca. 9 months, samples of pears were stored deep-frozen for a maximum of 7.8 months. Samples were analysed for residues of penconazole using method REM 107.08 (modified for LC-MS/MS) or REM 107.10. Mean recovery of penconazole in both apples and pears were within the acceptable range of 70–120%, except for one recovery of 61% at a fortification level of 0.10 mg/kg (Report No. SYN-0413).
Table 46 Residues of penconazole in apple and pear following foliar application of EC formulation (100 g/L)
Location, Country Year (Variety)
Rate (kg ai/ha)
No. Interval (days)
BBCH PHI (days)
Crop part Penconazole (mg/kg)
Reference
GAP Italy 0.068 for apple 0.060 for pear
3 7 14
Apple Alsace, FR (Europe N) 2003 (Jonagold)
0.063
3 9-11 76-87 13 Whole Fruit < 0.02 SYN-0306
Oederquart, DE (Europe N) 2003 (Glostar)
0.057 3 9-11 75-81 14 Whole Fruit < 0.02 SYN-0307
Alsace, FR (Europe N) 2003 (Golden)
0.059-0.062 3 9-11 78-84 0 Whole Fruit 0.07 SYN-0308 7 Whole Fruit 0.056 14 Whole Fruit 0.038 22 Whole Fruit 0.029
Hechthausen, DE (Europe N) 2003 (Jona Goret)
0.061-0.063 3 9-11 78-79 0* Whole Fruit 0.058 SYN-0309 8 Whole Fruit < 0.02 14 Whole Fruit < 0.02 21 Whole Fruit < 0.02
Alsace, FR (Europe N) 2004 (Golden delicious)
0.059-0.061 3 10 79-81 0* Whole Fruit < 0.01 SYN-0403 Trial: F04F002R
0 Whole Fruit 0.04 6 Whole Fruit 0.03 11 Whole Fruit 0.01 14 Whole Fruit 0.02

Penconazole
1854
Location, Country Year (Variety)
Rate (kg ai/ha)
No. Interval (days)
BBCH PHI (days)
Crop part Penconazole (mg/kg)
Reference
21 Whole Fruit 0.01 Alsace, FR (Europe N) 2004 (Boskop)
0.064-0.065 3 9-11 79-85 13 Whole Fruit 0.03 SYN-0405 Trial: F04F003R
Niedersachsen, DE (Europe N) 2004 (Elstar)
0.060-0.063 3 9-11 78-82 13 Whole Fruit 0.02 SYN-0405 Trial: G04F002R
Niedersachsen, DE (Europe N) 2011 (Jonagored)
0.060-0.062 (A6209G)
3 10-11 81-87 7 Fruit 0.08 S11-00559 Trial: S11-00559-01**
14 Fruit 0.05 21 Fruit 0.04
Languedoc-Roussillon, FR (Europe S) 2002 (Grany)
0.060 3 10-11 81-79 14 Whole Fruit < 0.02 SYN-0311
Teruel, ES (Europe S) 2003 (Esperiega)
0.057-0.060 3 9-10 76- 78 13 Whole Fruit 0.065 SYN-0310a
Valencia, ES (Europe S) 2003 (Esperiega)
0.057-0.063 3 9-10 76- 78 0 Whole Fruit 0.18 SYN-0312a 7 Whole Fruit 0.057 13 Whole Fruit 0.047 19 Whole Fruit 0.079
Languedoc-Roussillon, FR (Europe S) 2003 (Golden)
0.060-0.061 3 10-11 77- 79 0 Whole Fruit 0.064 SYN-0313 8 Whole Fruit 0.039 14 Whole Fruit 0.031 21 Whole Fruit 0.048
Languedoc-Roussillon, FR (Europe S) 2004 (Golden Delicious)
0.060-0.062 3 10 85- 85 0* Whole Fruit 0.03 SYN-0404 Trial: F04F004R
0 Whole Fruit 0.06 7 Whole Fruit 0.05 11 Whole Fruit 0.01 14 Whole Fruit 0.02 19 Whole Fruit < 0.01
Villena, ES (Europe S) 2004 (Royal Gala)
0.059-0.061 3 9-11 73- 81 14 Whole Fruit 0.01 SYN-0406 Trial: S04F007R
Languedoc-Roussillon, FR (Europe S) 2011 (Golden)
0.059-0.061 3 10-11 81- 87 7 Fruit 0.02 S11-00560 Trial: S11-00560-01**
14 Fruit < 0.01 21 Fruit 0.01
Pear Alsace, FR (Europe N) 2004 (Williams)
0.058-0.061 3 10-11 74- 78 0* Whole Fruit < 0.01 SYN-0411 Trial: F04F005R
0 Whole Fruit 0.03 7 Whole Fruit < 0.01 11 Whole Fruit 0.01 13 Whole Fruit < 0.01 20 Whole Fruit < 0.01
Niedersachen, DE (Europe ) 2004 (Condo)
0.060 3 9-11 81- 83 15 Whole Fruit 0.04 SYN-0413 Trial: G04F003R
Languedoc-Roussillon, FR (Europe S) 2004 (Williams)
0.060-0.061 3 10 75- 79 0* Whole Fruit < 0.01 SYN-0412 Trial: F04F007Rb
0 Whole Fruit 0.05 7 Whole Fruit < 0.01 14 Whole Fruit < 0.01 21 Whole Fruit < 0.01

Penconazole
1855
Location, Country Year (Variety)
Rate (kg ai/ha)
No. Interval (days)
BBCH PHI (days)
Crop part Penconazole (mg/kg)
Reference
Alicante, ES (Europe S) 2004 (Flor de Ruvierno)
0.058-0.060 3 10 78- 79 0* Whole Fruit < 0.01 SYN-0412 Trial: S04F008R
0 Whole Fruit 0.06 7 Whole Fruit 0.01 10 Whole Fruit 0.01 14 Whole Fruit 0.01 21 Whole Fruit 0.01
Languedoc-Roussillon, FR (Europe S) 2004 (Williams)
0.060-0.061 3 10 75-79 14 Whole Fruit 0.01 SYN-0414 Trial: F04F006Rb
* indicates sample taken prior to last application ** Triazole metabolites were analysed: 1,2,4-triazole, triazole alanine, triazole acetic acid and triazole lactic acid were present at below 0.01 mg/kg, except for triazole alanine being found at 0.02 mg/kg in apple samples taken at PHI 7, 14 and 21 days in the trial S11-00559-01. a Not independent. Trials were conducted at very close locations and applications were made at the same dates
b Not independent. Trials were conducted at very close locations and applications were made at the same dates.
Peaches
Twelve supervised residue trials were conducted on peaches in Europe from 1984 to 2004. Eleven of the trials were conducted with three applications of penconazole at a nominal rate of 0.1 kg ai/ha. One trial matched the label with three applications of penconazole at a nominal rate of 0.075 kg ai/ha. In the trials, penconazole was applied as EC formulation containing penconazole at 100 g/L. Applications were made in water volumes ranging from 785–1573 L/ha. Samples were taken close to the proposed minimum PHI of 14 days (13 to 15 days). Samples of peaches were stored deep-frozen for a maximum of ca. 15 months. Samples were analysed for residues of penconazole using method REM 107.08 (modified for LC-MS/MS) or REM 107.10. Mean recovery of penconazole were within the acceptable range of 70–120%.
Table 47 Residues of penconazole in peach following foliar application of EC formulation (100 g/L)
Location, Country, Year (Variety)
Rate (kg ai/ha)
No. Interval days
BBCH PHI (days)
Crop part Penconazole (mg/kg)
Reference
GAP, Italy 0.075 3 7 14 Baden-Württemberg, DE (Europe N) 2003 (South Haven)
0.098-0.10 3 10-11 78 - 85 0 Flesh 0.12 SYN-0318 0 Whole Fruit 0.11 7 Flesh 0.036 7 Whole Fruit 0.034 14 Flesh 0.021 14 Whole Fruit 0.020 21 Flesh < 0.02 21 Whole Fruit < 0.02
Baden-Württemberg, DE (Europe N) 2003 (South Haven)
0.095-0.10 3 9-12 75- 85 13 Flesh 0.027 SYN-0321 13 Whole Fruit 0.025
Saint Mesmin, FR (Europe N) 2005 (Hearly Red Haven)
0.10 3 10 73 - 79 14 Flesh 0.030 T009906-04-REG/SYN-0507 Trial: AF/8588/SY/1
14 Whole Fruit 0.030
Ligniéres de Touraine, FR (Europe N) 2005 (Dixy Red)
0.099-0.10 3 10 74- 81 14 Flesh 0.040 T009906-04-REG/SYN-0507 Trial: AF/8588/SY/2
14 Whole Fruit 0.03
Verona, IT (Europe S) 1984 (Hearly Red Haven)
0.075 3 - 0 Fruit 0.15 2208/84 Trial: Verona 7 Fruit 0.11
10 Fruit 0.05 14 Fruit 0.03
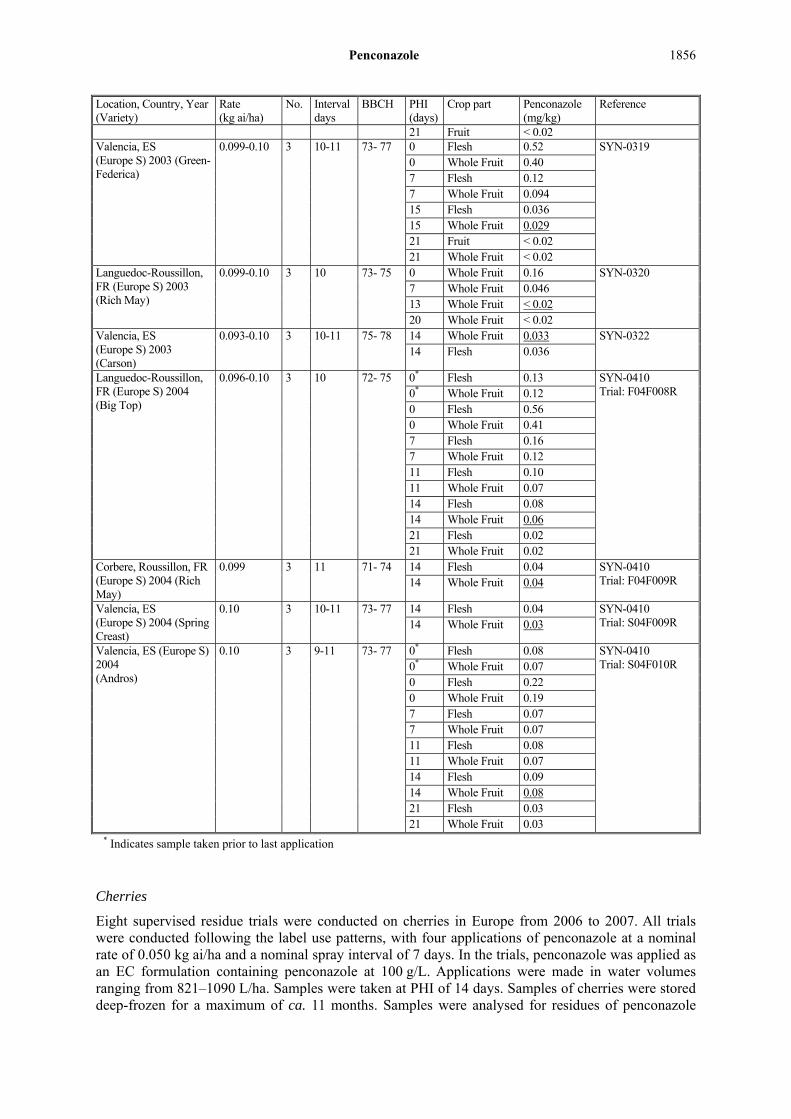
Penconazole
1856
Location, Country, Year (Variety)
Rate (kg ai/ha)
No. Interval days
BBCH PHI (days)
Crop part Penconazole (mg/kg)
Reference
21 Fruit < 0.02 Valencia, ES (Europe S) 2003 (Green-Federica)
0.099-0.10 3 10-11 73- 77 0 Flesh 0.52 SYN-0319 0 Whole Fruit 0.40 7 Flesh 0.12 7 Whole Fruit 0.094 15 Flesh 0.036 15 Whole Fruit 0.029 21 Fruit < 0.02 21 Whole Fruit < 0.02
Languedoc-Roussillon, FR (Europe S) 2003 (Rich May)
0.099-0.10 3 10 73- 75 0 Whole Fruit 0.16 SYN-0320 7 Whole Fruit 0.046 13 Whole Fruit < 0.02 20 Whole Fruit < 0.02
Valencia, ES (Europe S) 2003 (Carson)
0.093-0.10 3 10-11 75- 78 14 Whole Fruit 0.033 SYN-0322 14 Flesh 0.036
Languedoc-Roussillon, FR (Europe S) 2004 (Big Top)
0.096-0.10 3 10 72- 75 0* Flesh 0.13 SYN-0410 Trial: F04F008R 0* Whole Fruit 0.12
0 Flesh 0.56 0 Whole Fruit 0.41 7 Flesh 0.16 7 Whole Fruit 0.12 11 Flesh 0.10 11 Whole Fruit 0.07 14 Flesh 0.08 14 Whole Fruit 0.06 21 Flesh 0.02 21 Whole Fruit 0.02
Corbere, Roussillon, FR (Europe S) 2004 (Rich May)
0.099 3 11 71- 74 14 Flesh 0.04 SYN-0410 Trial: F04F009R 14 Whole Fruit 0.04
Valencia, ES (Europe S) 2004 (Spring Creast)
0.10 3 10-11 73- 77 14 Flesh 0.04 SYN-0410 Trial: S04F009R 14 Whole Fruit 0.03
Valencia, ES (Europe S) 2004 (Andros)
0.10 3 9-11 73- 77 0* Flesh 0.08 SYN-0410 Trial: S04F010R 0* Whole Fruit 0.07
0 Flesh 0.22 0 Whole Fruit 0.19 7 Flesh 0.07 7 Whole Fruit 0.07 11 Flesh 0.08 11 Whole Fruit 0.07 14 Flesh 0.09 14 Whole Fruit 0.08 21 Flesh 0.03 21 Whole Fruit 0.03
* Indicates sample taken prior to last application
Cherries
Eight supervised residue trials were conducted on cherries in Europe from 2006 to 2007. All trials were conducted following the label use patterns, with four applications of penconazole at a nominal rate of 0.050 kg ai/ha and a nominal spray interval of 7 days. In the trials, penconazole was applied as an EC formulation containing penconazole at 100 g/L. Applications were made in water volumes ranging from 821–1090 L/ha. Samples were taken at PHI of 14 days. Samples of cherries were stored deep-frozen for a maximum of ca. 11 months. Samples were analysed for residues of penconazole

Penconazole
1857
using method REM 107.10. Mean recovery of penconazole in cherries were within the acceptable range of 70–120%.
Table 48 Residues of penconazole in cherry following foliar application of EC formulation (100 g/L)
Location, Country, Year (Variety)
Rate (kg ai/ha)
No. Interval days
BBCH PHI (days)
Crop part Penconazole (mg/kg)
Reference
GAP 0.050 2 10-14 20 Jussy, FR (Europe N) 2006 (Sour, Montmorency)
0.050-0.053 4 7 77- 85 0* Flesh 0.02 T000652-06-REG SYN-0605 Trial: AF/10400/SY/1
0* Whole Fruit 0.02 0 Flesh 0.15 0 Whole Fruit 0.13 1 Flesh 0.05 1 Whole Fruit 0.04 3 Flesh 0.02 3 Whole Fruit 0.02 7 Flesh < 0.01 7 Whole Fruit < 0.01 14 Flesh < 0.01 14 Whole Fruit < 0.01
Nuit St Georges, FR (Europe N) 2006 (Sour, Chatel Morel)
0.049-0.050 4 7 81- 85 0* Flesh 0.01 T000652-06-REG SYN-0605 Trial: AF/10400/SY/2
0* Whole Fruit < 0.01 0 Flesh 0.15 0 Whole Fruit 0.13 1 Flesh 0.12 1 Whole Fruit 0.10 3 Flesh 0.02 3 Whole Fruit 0.02 7 Flesh < 0.01 7 Whole Fruit < 0.01 14 Flesh < 0.01 14 Whole Fruit < 0.01
Les Vignes, FR (Europe N) 2006 (Sweet, Hedelfingen)
0.050-0.051
4 7 75- 85 0* Flesh 0.02 T000652-06-REG: SYN-0605 Trial: AF/10400/SY/3
0* Whole Fruit 0.02 0 Flesh 0.09 0 Whole Fruit 0.08 1 Flesh < 0.01 1 Whole Fruit < 0.01 3 Flesh 0.02 3 Whole Fruit 0.02 7 Flesh < 0.01 7 Whole Fruit < 0.01 14 Flesh < 0.01 14 Whole Fruit < 0.01
St Mesmin, FR (Europe N) 2006 (Sweet, Regina)
0.048-0.050 4 7 78- 85 0* Flesh 0.04 T000652-06-REG SYN-0605 Trial: AF/10400/SY/4
0* Whole Fruit 0.04 0 Flesh 0.17 0 Whole Fruit 0.16 1 Flesh 0.07 1 Whole Fruit 0.07 3 Flesh 0.04 3 Whole Fruit 0.04 7 Flesh < 0.01 7 Whole Fruit < 0.01 14 Flesh < 0.01 14 Whole Fruit < 0.01
Lower Saxony, DE (Europe N) 2007 (Sweet, Regina)
0.047-0.054 4 7 78- 87 0* Fruit without stone
0.04 T010996-06-REG SYN-0717 Trial: 0* Whole Fruit 0.03
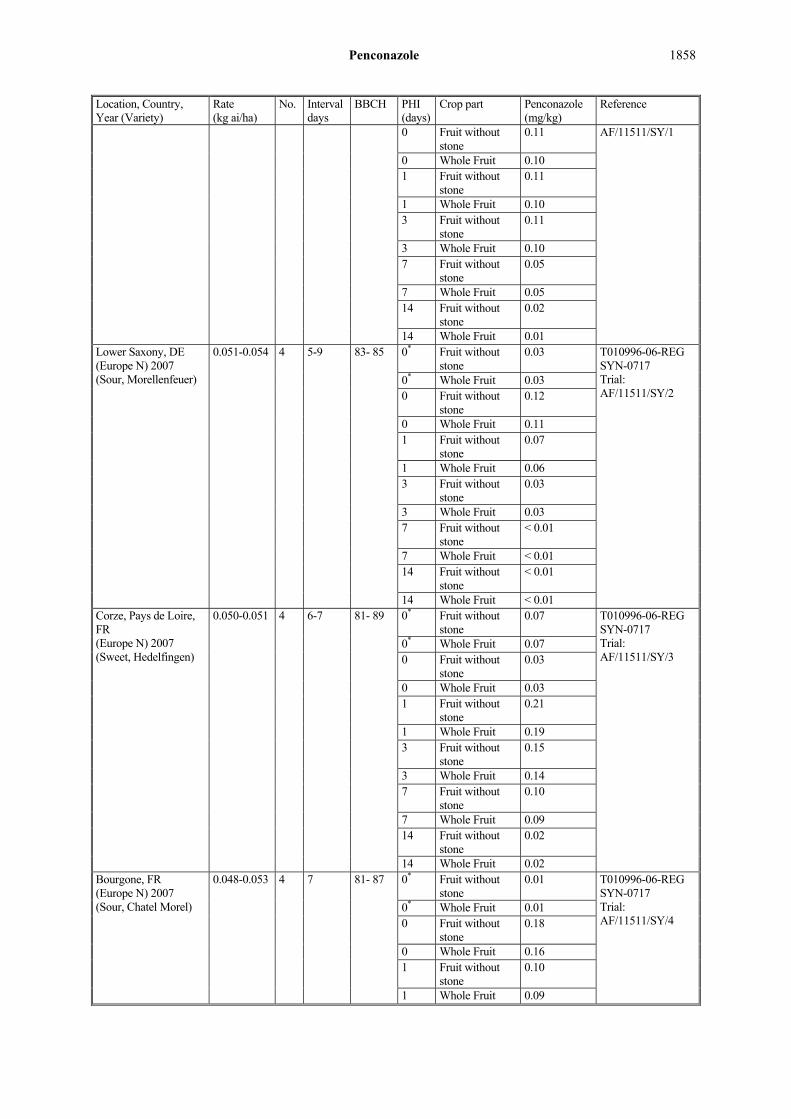
Penconazole
1858
Location, Country, Year (Variety)
Rate (kg ai/ha)
No. Interval days
BBCH PHI (days)
Crop part Penconazole (mg/kg)
Reference
0 Fruit without stone
0.11 AF/11511/SY/1
0 Whole Fruit 0.10 1 Fruit without
stone 0.11
1 Whole Fruit 0.10 3 Fruit without
stone 0.11
3 Whole Fruit 0.10 7 Fruit without
stone 0.05
7 Whole Fruit 0.05 14 Fruit without
stone 0.02
14 Whole Fruit 0.01 Lower Saxony, DE (Europe N) 2007 (Sour, Morellenfeuer)
0.051-0.054 4 5-9 83- 85 0* Fruit without stone
0.03 T010996-06-REG SYN-0717 Trial: AF/11511/SY/2
0* Whole Fruit 0.03 0 Fruit without
stone 0.12
0 Whole Fruit 0.11 1 Fruit without
stone 0.07
1 Whole Fruit 0.06 3 Fruit without
stone 0.03
3 Whole Fruit 0.03 7 Fruit without
stone < 0.01
7 Whole Fruit < 0.01 14 Fruit without
stone < 0.01
14 Whole Fruit < 0.01 Corze, Pays de Loire, FR (Europe N) 2007 (Sweet, Hedelfingen)
0.050-0.051 4 6-7 81- 89 0* Fruit without stone
0.07 T010996-06-REG SYN-0717 Trial: AF/11511/SY/3
0* Whole Fruit 0.07 0 Fruit without
stone 0.03
0 Whole Fruit 0.03 1 Fruit without
stone 0.21
1 Whole Fruit 0.19 3 Fruit without
stone 0.15
3 Whole Fruit 0.14 7 Fruit without
stone 0.10
7 Whole Fruit 0.09 14 Fruit without
stone 0.02
14 Whole Fruit 0.02 Bourgone, FR (Europe N) 2007 (Sour, Chatel Morel)
0.048-0.053 4 7 81- 87 0* Fruit without stone
0.01 T010996-06-REG SYN-0717 Trial: AF/11511/SY/4
0* Whole Fruit 0.01 0 Fruit without
stone 0.18
0 Whole Fruit 0.16 1 Fruit without
stone 0.10
1 Whole Fruit 0.09
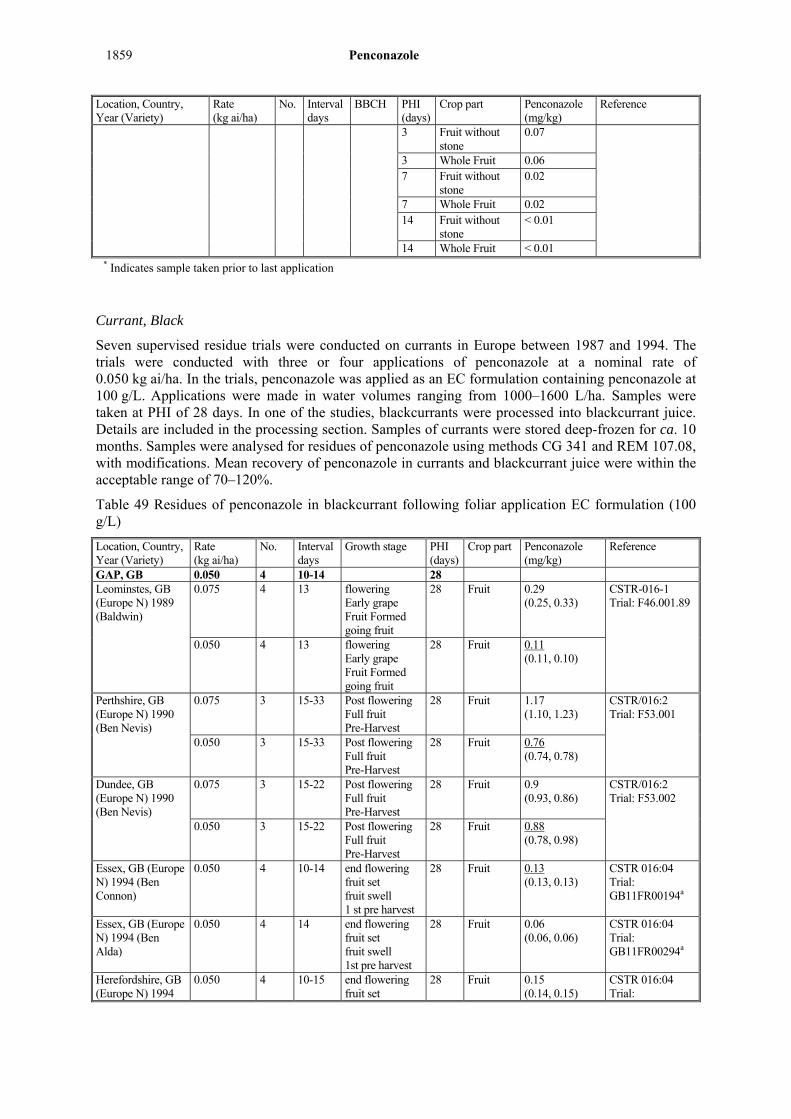
Penconazole
1859
Location, Country, Year (Variety)
Rate (kg ai/ha)
No. Interval days
BBCH PHI (days)
Crop part Penconazole (mg/kg)
Reference
3 Fruit without stone
0.07
3 Whole Fruit 0.06 7 Fruit without
stone 0.02
7 Whole Fruit 0.02 14 Fruit without
stone < 0.01
14 Whole Fruit < 0.01 * Indicates sample taken prior to last application
Currant, Black
Seven supervised residue trials were conducted on currants in Europe between 1987 and 1994. The trials were conducted with three or four applications of penconazole at a nominal rate of 0.050 kg ai/ha. In the trials, penconazole was applied as an EC formulation containing penconazole at 100 g/L. Applications were made in water volumes ranging from 1000–1600 L/ha. Samples were taken at PHI of 28 days. In one of the studies, blackcurrants were processed into blackcurrant juice. Details are included in the processing section. Samples of currants were stored deep-frozen for ca. 10 months. Samples were analysed for residues of penconazole using methods CG 341 and REM 107.08, with modifications. Mean recovery of penconazole in currants and blackcurrant juice were within the acceptable range of 70–120%.
Table 49 Residues of penconazole in blackcurrant following foliar application EC formulation (100 g/L)
Location, Country, Year (Variety)
Rate (kg ai/ha)
No. Interval days
Growth stage PHI (days)
Crop part Penconazole (mg/kg)
Reference
GAP, GB 0.050 4 10-14 28 Leominstes, GB (Europe N) 1989 (Baldwin)
0.075 4 13 flowering Early grape Fruit Formed going fruit
28 Fruit 0.29 (0.25, 0.33)
CSTR-016-1 Trial: F46.001.89
0.050 4 13 flowering Early grape Fruit Formed going fruit
28 Fruit 0.11 (0.11, 0.10)
Perthshire, GB (Europe N) 1990 (Ben Nevis)
0.075 3 15-33 Post flowering Full fruit Pre-Harvest
28 Fruit 1.17 (1.10, 1.23)
CSTR/016:2 Trial: F53.001
0.050 3 15-33 Post flowering Full fruit Pre-Harvest
28 Fruit 0.76 (0.74, 0.78)
Dundee, GB (Europe N) 1990 (Ben Nevis)
0.075 3 15-22 Post flowering Full fruit Pre-Harvest
28 Fruit 0.9 (0.93, 0.86)
CSTR/016:2 Trial: F53.002
0.050 3 15-22 Post flowering Full fruit Pre-Harvest
28 Fruit 0.88 (0.78, 0.98)
Essex, GB (Europe N) 1994 (Ben Connon)
0.050 4 10-14 end flowering fruit set fruit swell 1 st pre harvest
28 Fruit 0.13 (0.13, 0.13)
CSTR 016:04 Trial: GB11FR00194a
Essex, GB (Europe N) 1994 (Ben Alda)
0.050 4 14 end flowering fruit set fruit swell 1st pre harvest
28 Fruit 0.06 (0.06, 0.06)
CSTR 016:04 Trial: GB11FR00294a
Herefordshire, GB (Europe N) 1994
0.050 4 10-15 end flowering fruit set
28 Fruit 0.15 (0.14, 0.15)
CSTR 016:04 Trial:
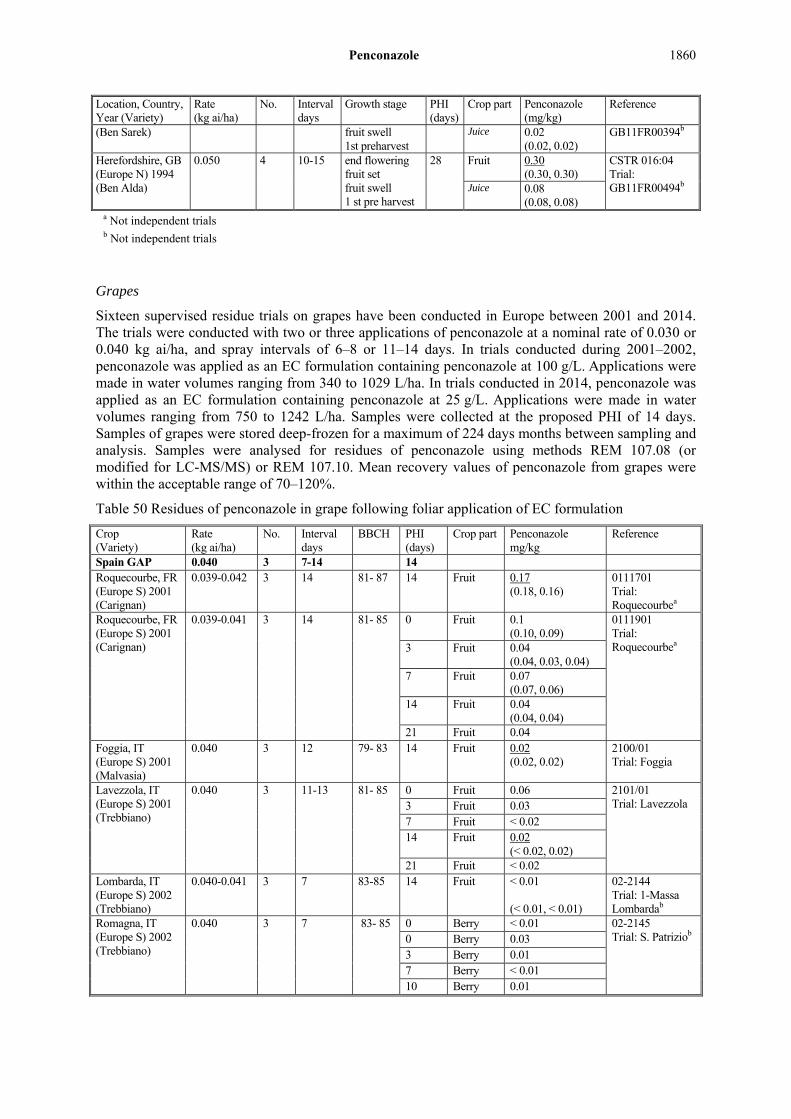
Penconazole
1860
Location, Country, Year (Variety)
Rate (kg ai/ha)
No. Interval days
Growth stage PHI (days)
Crop part Penconazole (mg/kg)
Reference
(Ben Sarek) fruit swell 1st preharvest
Juice 0.02 (0.02, 0.02)
GB11FR00394b
Herefordshire, GB (Europe N) 1994 (Ben Alda)
0.050 4 10-15 end flowering fruit set fruit swell 1 st pre harvest
28 Fruit 0.30 (0.30, 0.30)
CSTR 016:04 Trial: GB11FR00494b Juice 0.08
(0.08, 0.08) a Not independent trials b Not independent trials
Grapes
Sixteen supervised residue trials on grapes have been conducted in Europe between 2001 and 2014. The trials were conducted with two or three applications of penconazole at a nominal rate of 0.030 or 0.040 kg ai/ha, and spray intervals of 6–8 or 11–14 days. In trials conducted during 2001–2002, penconazole was applied as an EC formulation containing penconazole at 100 g/L. Applications were made in water volumes ranging from 340 to 1029 L/ha. In trials conducted in 2014, penconazole was applied as an EC formulation containing penconazole at 25 g/L. Applications were made in water volumes ranging from 750 to 1242 L/ha. Samples were collected at the proposed PHI of 14 days. Samples of grapes were stored deep-frozen for a maximum of 224 days months between sampling and analysis. Samples were analysed for residues of penconazole using methods REM 107.08 (or modified for LC-MS/MS) or REM 107.10. Mean recovery values of penconazole from grapes were within the acceptable range of 70–120%.
Table 50 Residues of penconazole in grape following foliar application of EC formulation
Crop (Variety)
Rate (kg ai/ha)
No. Interval days
BBCH PHI (days)
Crop part Penconazole mg/kg
Reference
Spain GAP 0.040 3 7-14 14 Roquecourbe, FR (Europe S) 2001 (Carignan)
0.039-0.042 3 14 81- 87 14 Fruit 0.17 (0.18, 0.16)
0111701 Trial: Roquecourbea
Roquecourbe, FR (Europe S) 2001 (Carignan)
0.039-0.041 3 14 81- 85 0 Fruit 0.1 (0.10, 0.09)
0111901 Trial: Roquecourbea 3 Fruit 0.04
(0.04, 0.03, 0.04) 7 Fruit 0.07
(0.07, 0.06) 14 Fruit 0.04
(0.04, 0.04) 21 Fruit 0.04
Foggia, IT (Europe S) 2001 (Malvasia)
0.040 3 12 79- 83 14 Fruit 0.02 (0.02, 0.02)
2100/01 Trial: Foggia
Lavezzola, IT (Europe S) 2001 (Trebbiano)
0.040 3 11-13 81- 85 0 Fruit 0.06 2101/01 Trial: Lavezzola 3 Fruit 0.03
7 Fruit < 0.02 14 Fruit 0.02
(< 0.02, 0.02) 21 Fruit < 0.02
Lombarda, IT (Europe S) 2002 (Trebbiano)
0.040-0.041 3 7 83-85 14 Fruit < 0.01 (< 0.01, < 0.01)
02-2144 Trial: 1-Massa Lombardab
Romagna, IT (Europe S) 2002 (Trebbiano)
0.040 3 7 83- 85 0 Berry < 0.01 02-2145 Trial: S. Patriziob
0 Berry 0.03 3 Berry 0.01 7 Berry < 0.01 10 Berry 0.01

Penconazole
1861
Crop (Variety)
Rate (kg ai/ha)
No. Interval days
BBCH PHI (days)
Crop part Penconazole mg/kg
Reference
14 Berry 0.02 (0.02, < 0.01)
Fronton, FR (Europe S) 2002 (Sauvignon)
0.039-0.041 3 7 83- 85 0 Fruit 0.08 (0.04, 0.11)
02-2146 Trial: 02-2146
3 Fruit 0.06 7 Fruit 0.04 10 Fruit 0.02 14 Fruit 0.03
(0.03, 0.02) Labastine Du Themple, FR (Europe S) 2002 (Cabernet)
0.039-0.040 3 7 85- 85 14 Fruit 0.03 (0.02, 0.03)
02-2147
Pays de la Loire, FR (Europe N) 2014 (Cabernet Franc)
0.031-0.032 2 7 83- 85 14 Fruit 0.05 36140 Study: 699061 Trial: 1
28 Fruit 0.03 0.030-0.032 3 7 83- 85 14 Fruit 0.02
28 Fruit 0.02 Heves, HU (Europe N) 2014 (Tramini)
0.031 2 7 83- 83 14 Fruit 0.03 36140 Study: 699061 Trial: 2
28 Fruit 0.02 0.030-0.031 3 7 81- 83 14 Fruit 0.03
28 Fruit 0.03 Essex, GB (Europe N) 2014 (Müller Thurgau)
0.029-0.031 2 7 75-77 14 Fruit 0.02 36140 Study: 699061 Trial: 3
28 Fruit 0.02 0.028-0.032 3 73- 77 14 Fruit 0.04
28 Fruit 0.01 Lower Silesia, PL (Europe N) 2014 (Agat Donski)
0.030-0.031 2 7 81-83 14 Fruit 0.05 36140 Study: 699061 Trial: 4
27 Fruit 0.01 0.029-0.030 3 7 81-83 14 Fruit 0.08
27 Fruit 0.04 Picardie, FR (Europe N) 2014 (Pinot Meunier)
0.030 2 7 78-83 0 Fruit 0.03 36140 Study: 699061 Trial: 5
7 Fruit 0.01 14 Fruit < 0.01 21 Fruit < 0.01 28 Fruit < 0.01
0.028-0.031 3 7 78- 83 0 Fruit 0.03 7 Fruit 0.01 14 Fruit < 0.01 21 Fruit < 0.01 28 Fruit < 0.01
Essex, GB (Europe N) 2014 (Reichen-steiner)
0.029-0.031 2 7 75-77 0 Fruit 0.09 36140 Study: 699061 Trial: 6
7 Fruit 0.03 14 Fruit 0.03 21 Fruit 0.02 28 Fruit 0.01
0.030-0.033 3 7 73- 77 0 Fruit 0.09 7 Fruit 0.09 14 Fruit 0.03 21 Fruit 0.02 28 Fruit 0.02
Fejér, HU (Europe N) 2014 (Juhfark)
0.031 2 6 77- 79 0 Fruit 0.10 36140 Study: 699061 Trial: 7
7 Fruit 0.02 14 Fruit 0.01 21 Fruit 0.01 28 Fruit < 0.01
0.031 3 6-8 77- 79 0 Fruit 0.06 7 Fruit 0.04 14 Fruit < 0.01

Penconazole
1862
Crop (Variety)
Rate (kg ai/ha)
No. Interval days
BBCH PHI (days)
Crop part Penconazole mg/kg
Reference
21 Fruit < 0.01 28 Fruit < 0.01
Bavaria, DE (Europe N) 2014 (Blauer Spätburgunder)
0.030 2 8 83- 85 0 Fruit 0.32* (0.41, 0.27, 0.29)
36140 Study: 699061 Trial: 9 7 Fruit 0.21*
(0.28, 0.17, 0.18) 14 Fruit 0.19*
(0.21, 0.19, 0.17) 21 Fruit 0.26*
(0.31, 0.25, 0.23) 28 Fruit 0.26*
(0.28, 0.24, 0.22, 0.26, 0.28)
0.029-0.031 3 7-8 83- 85 0 Fruit 0.25*
(0.28, 0.23, 0.24) 7 Fruit 0.28*
(0.29, 0.27, 0.27) 14 Fruit 0.32*
(0.38, 0.29, 0.28) 21 Fruit 0.20*
(0.22, 0.18, 0.20) 28 Fruit 0.26*
(0.34, 0.21, 0.29, 0.24, 0.23)
a Not independent, conducted under the same weather conditions and on the same application dates b Not independent, conducted at very close locations and application made one day apart
* In the study No. 699061, trial 8 was abandoned due to disease and restarted as trial 9 (applications: 19 September to October 4). The samples were re-analysed to confirm results after initial single analysis.
Strawberry
Seventeen outdoor and eight protected supervised residue trials were conducted on strawberries in Europe from 2002 to 2004. All trials were conducted with four applications of penconazole at a nominal rate of 0.050 kg ai/ha and 6–8 interval days. In the trials, penconazole was applied as EC formulation containing penconazole at 100 g/L. Applications were made in water volumes ranging from 197–1611 L/ha for outdoor trials and from 199–1087 L/ha for protected trials. Samples of strawberries were stored deep-frozen for a maximum of ca 10 months. Samples were analysed for residues of penconazole using method REM 107.08 (modified for LC-MS/MS) or REM 107.10. Mean recovery of penconazole in strawberries were within the acceptable range of 70–120%. No measurable residues of penconazole, equal to or greater than the LOQ were found in untreated samples at harvest.
Table 51 Residues of penconazole in strawberry following foliar application of EC formulation - field
Location, Country, Year (Variety)
Rate (kg ai/ha)
No. Interval days
BBCH PHI (days)
Crop part Penconazole (mg/kg)
Reference
GAP Belgium 0.050 4 10 3 Lamenitre, FR (Europe N) 2002 (Darselect)
0.049-0.053
7 65 - 85 0* Berry 0.16 02-2030 Trial: 1 - La Menitre 0 Berry 0.40
3 Berry 0.17 7 Berry 0.13 14 Berry 0.03 21 Berry 0.02
Loiret, FR (Europe N) 2002 (Maria des Bois)
0.050-0.052 4 7 65 -85 0* Berry 0.06 02-2031 Trial: 1 - St Hilaire
0 Berry 0.10 3 Berry 0.14 7 Berry 0.11 14 Berry 0.02 21 Berry 0.01
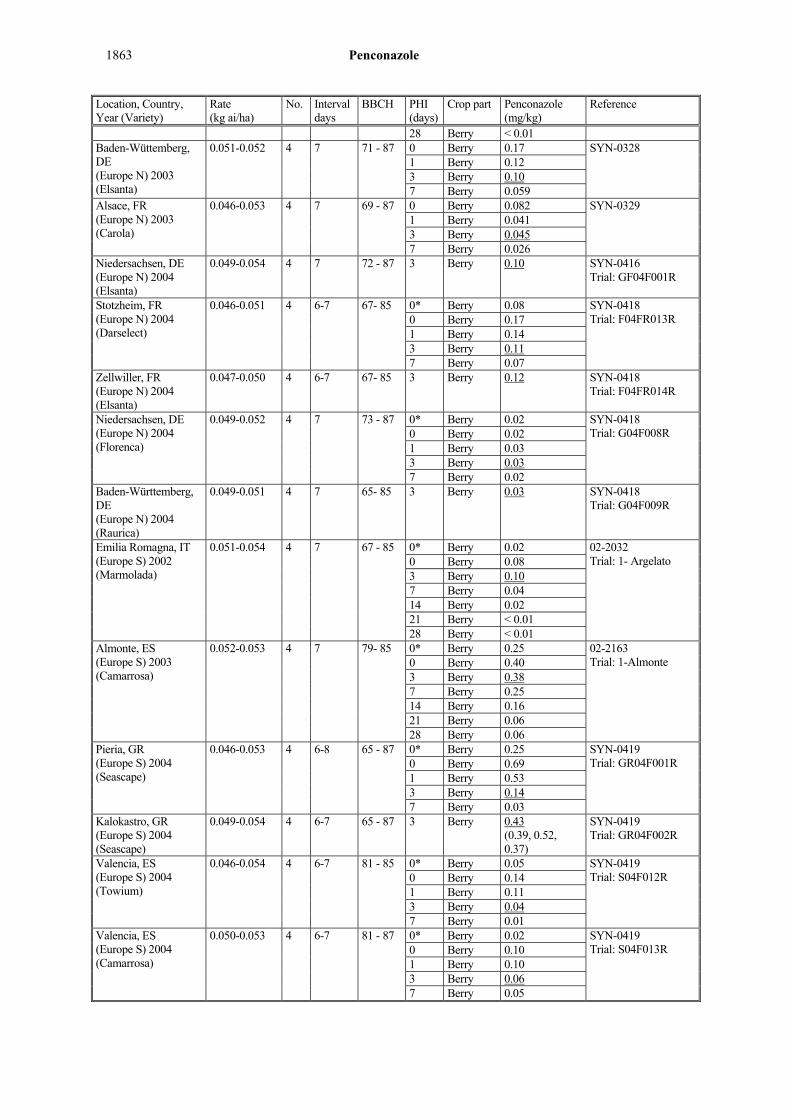
Penconazole
1863
Location, Country, Year (Variety)
Rate (kg ai/ha)
No. Interval days
BBCH PHI (days)
Crop part Penconazole (mg/kg)
Reference
28 Berry < 0.01 Baden-Wüttemberg, DE (Europe N) 2003 (Elsanta)
0.051-0.052 4 7 71 - 87 0 Berry 0.17 SYN-0328 1 Berry 0.12 3 Berry 0.10 7 Berry 0.059
Alsace, FR (Europe N) 2003 (Carola)
0.046-0.053 4 7 69 - 87 0 Berry 0.082 SYN-0329 1 Berry 0.041 3 Berry 0.045 7 Berry 0.026
Niedersachsen, DE (Europe N) 2004 (Elsanta)
0.049-0.054 4 7 72 - 87 3 Berry 0.10 SYN-0416 Trial: GF04F001R
Stotzheim, FR (Europe N) 2004 (Darselect)
0.046-0.051 4 6-7 67- 85 0* Berry 0.08 SYN-0418 Trial: F04FR013R 0 Berry 0.17
1 Berry 0.14 3 Berry 0.11 7 Berry 0.07
Zellwiller, FR (Europe N) 2004 (Elsanta)
0.047-0.050 4 6-7 67- 85 3 Berry 0.12 SYN-0418 Trial: F04FR014R
Niedersachsen, DE (Europe N) 2004 (Florenca)
0.049-0.052 4 7 73 - 87 0* Berry 0.02 SYN-0418 Trial: G04F008R 0 Berry 0.02
1 Berry 0.03 3 Berry 0.03 7 Berry 0.02
Baden-Württemberg, DE (Europe N) 2004 (Raurica)
0.049-0.051 4 7 65- 85 3 Berry 0.03 SYN-0418 Trial: G04F009R
Emilia Romagna, IT (Europe S) 2002 (Marmolada)
0.051-0.054 4 7 67 - 85 0* Berry 0.02 02-2032 Trial: 1- Argelato 0 Berry 0.08
3 Berry 0.10 7 Berry 0.04 14 Berry 0.02 21 Berry < 0.01 28 Berry < 0.01
Almonte, ES (Europe S) 2003 (Camarrosa)
0.052-0.053 4 7 79- 85 0* Berry 0.25 02-2163 Trial: 1-Almonte 0 Berry 0.40
3 Berry 0.38 7 Berry 0.25 14 Berry 0.16 21 Berry 0.06 28 Berry 0.06
Pieria, GR (Europe S) 2004 (Seascape)
0.046-0.053 4 6-8 65 - 87 0* Berry 0.25 SYN-0419 Trial: GR04F001R
0 Berry 0.69 1 Berry 0.53 3 Berry 0.14 7 Berry 0.03
Kalokastro, GR (Europe S) 2004 (Seascape)
0.049-0.054 4 6-7 65 - 87 3 Berry 0.43 (0.39, 0.52, 0.37)
SYN-0419 Trial: GR04F002R
Valencia, ES (Europe S) 2004 (Towium)
0.046-0.054 4 6-7 81 - 85 0* Berry 0.05 SYN-0419 Trial: S04F012R 0 Berry 0.14
1 Berry 0.11 3 Berry 0.04 7 Berry 0.01
Valencia, ES (Europe S) 2004 (Camarrosa)
0.050-0.053 4 6-7 81 - 87 0* Berry 0.02 SYN-0419 Trial: S04F013R 0 Berry 0.10
1 Berry 0.10 3 Berry 0.06 7 Berry 0.05
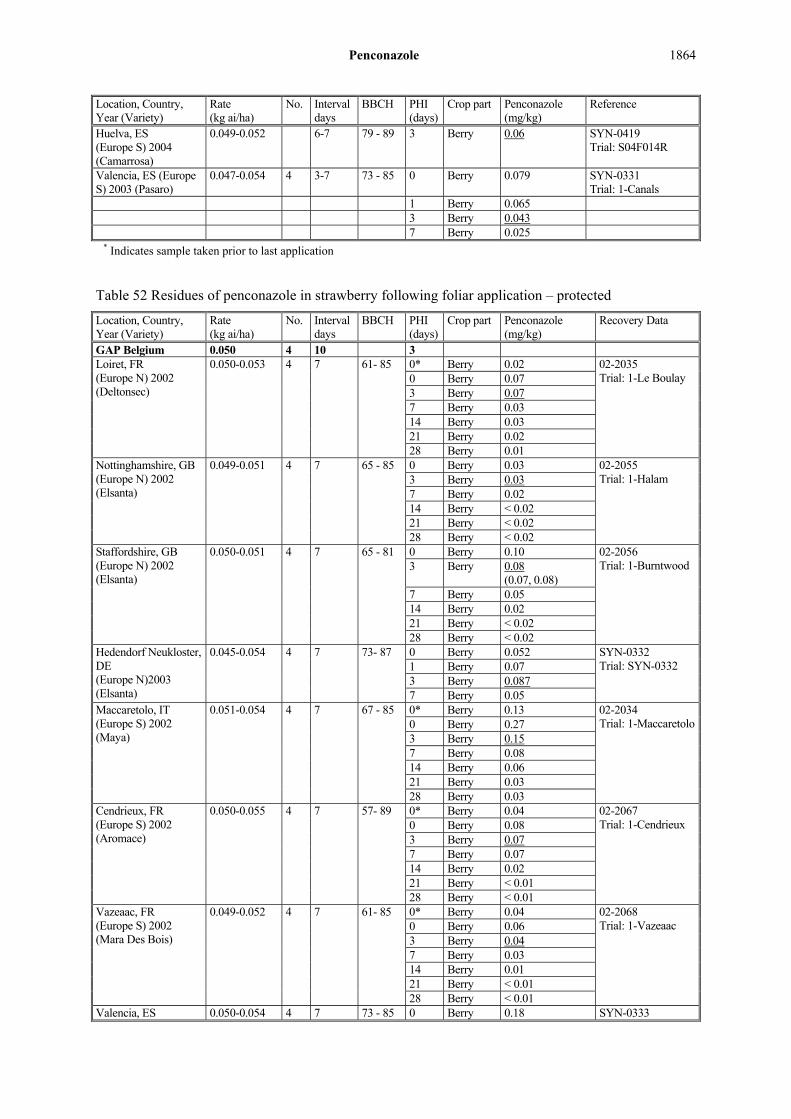
Penconazole
1864
Location, Country, Year (Variety)
Rate (kg ai/ha)
No. Interval days
BBCH PHI (days)
Crop part Penconazole (mg/kg)
Reference
Huelva, ES (Europe S) 2004 (Camarrosa)
0.049-0.052 6-7 79 - 89 3 Berry 0.06 SYN-0419 Trial: S04F014R
Valencia, ES (Europe S) 2003 (Pasaro)
0.047-0.054 4 3-7 73 - 85 0 Berry 0.079 SYN-0331 Trial: 1-Canals
1 Berry 0.065 3 Berry 0.043 7 Berry 0.025
* Indicates sample taken prior to last application
Table 52 Residues of penconazole in strawberry following foliar application – protected
Location, Country, Year (Variety)
Rate (kg ai/ha)
No. Interval days
BBCH PHI (days)
Crop part Penconazole (mg/kg)
Recovery Data
GAP Belgium 0.050 4 10 3 Loiret, FR (Europe N) 2002 (Deltonsec)
0.050-0.053 4 7 61- 85 0* Berry 0.02 02-2035 Trial: 1-Le Boulay 0 Berry 0.07
3 Berry 0.07 7 Berry 0.03 14 Berry 0.03 21 Berry 0.02 28 Berry 0.01
Nottinghamshire, GB (Europe N) 2002 (Elsanta)
0.049-0.051 4 7 65 - 85 0 Berry 0.03 02-2055 Trial: 1-Halam 3 Berry 0.03
7 Berry 0.02 14 Berry < 0.02 21 Berry < 0.02 28 Berry < 0.02
Staffordshire, GB (Europe N) 2002 (Elsanta)
0.050-0.051 4 7 65 - 81 0 Berry 0.10 02-2056 Trial: 1-Burntwood 3 Berry 0.08
(0.07, 0.08) 7 Berry 0.05 14 Berry 0.02 21 Berry < 0.02 28 Berry < 0.02
Hedendorf Neukloster, DE (Europe N)2003 (Elsanta)
0.045-0.054 4 7 73- 87 0 Berry 0.052 SYN-0332 Trial: SYN-0332 1 Berry 0.07
3 Berry 0.087 7 Berry 0.05
Maccaretolo, IT (Europe S) 2002 (Maya)
0.051-0.054 4 7 67 - 85 0* Berry 0.13 02-2034 Trial: 1-Maccaretolo0 Berry 0.27
3 Berry 0.15 7 Berry 0.08 14 Berry 0.06 21 Berry 0.03 28 Berry 0.03
Cendrieux, FR (Europe S) 2002 (Aromace)
0.050-0.055 4 7 57- 89 0* Berry 0.04 02-2067 Trial: 1-Cendrieux
0 Berry 0.08 3 Berry 0.07 7 Berry 0.07 14 Berry 0.02 21 Berry < 0.01 28 Berry < 0.01
Vazeaac, FR (Europe S) 2002 (Mara Des Bois)
0.049-0.052 4 7 61- 85 0* Berry 0.04 02-2068 Trial: 1-Vazeaac 0 Berry 0.06
3 Berry 0.04 7 Berry 0.03 14 Berry 0.01 21 Berry < 0.01 28 Berry < 0.01
Valencia, ES 0.050-0.054 4 7 73 - 85 0 Berry 0.18 SYN-0333

Penconazole
1865
Location, Country, Year (Variety)
Rate (kg ai/ha)
No. Interval days
BBCH PHI (days)
Crop part Penconazole (mg/kg)
Recovery Data
(Europe S) 2003 (Pasaro)
1 Berry 0.24 Trial: 1-Canals 3 Berry 0.19 7 Berry 0.17
* Indicates sample taken prior to last application
Melon
Nine supervised residue trials were conducted on melons between 2001 and 2002. All trials were conducted with four applications of penconazole at a nominal rate of 0.050 kg ai/ha. In the trials, penconazole was applied as EC formulation containing penconazole at 100 g/L. Applications were made in water volumes ranging from 946 to 1067 L/ha. In all trials samples were taken at PHI of 3 days. Samples of were stored deep-frozen for a maximum of ca. 10 months. Samples were analysed for residues of penconazole using method REM 107.08 (modified for LC-MS/MS) with minor modifications. Mean recovery of penconazole in cucurbits were within the acceptable range of 70–120%, except for a recovery of 64% at a fortification level of 0.02 mg/kg (Trial No. 2068/01). In the two trials (2062/01 and 2063/01), seeds were removed and discarded.
Table 53 Residues of penconazole in melon following foliar application – protected
Location, Country, Year (Variety)
Rate (kg ai/ha)
No. Interval days
BBCH PHI (days)
Crop part Penconazole (mg/kg)
Reference
GAP Germany 0.050 4 7 3 Modena, IT (Europe S) 2001 (Harper)
0.049-0.051 4 9-10 73- 87 0 Whole Fruit 0.05 2062/01 Trial: 1- Mirandolaa
3 Peel < 0.02, 0.02
3
Pulp
< 0.02, < 0.02
3 Whole Fruit < 0.02 (< 0.02, < 0.02)
Ferrara, IT (Europe S) 2001 (Capitol)
0.051-0.052 4 10 72 - 85 0 Fruit < 0.02 2063/01 Trial: 1-S. Bartolomeoa
3 Fruit 0.03 (0.03, < 0.02)
3 Peel < 0.02, 0.05
3 Pulp < 0.02, < 0.02
Nijar, ES (Europe S) 2001 (Polvar)
0.047-0.050 4 7 75-78 0 Whole Fruit 0.02 2068/01 Trial: 1- Vistabella3 Peel 0.07, 0.10
3 Pulp < 0.02, < 0.02
3 Whole Fruit 0.06 (0.07, 0.05)
Almeria, ES (Europe S) 2001 (Siglo (Galia))
0.048-0.050 4 7 81-87 0 Whole Fruit 0.03 2069/01 Trial: El Ejido 3 Fruit 0.05
(0.04, 0.05) 3 Peel 0.07, 0.08
3 Pulp < 0.02, < 0.02
DosHermanas, ES (Europe S) 2002 (Gallia)
0.051-0.053 4 7 73- 82 3 Fruit 0.04 (0.04, 0.03)
02-2023 Trial: 1-Dos Hermanas 3 Peel 0.09, 0.09
3 Pulp < 0.01, < 0.01
Cadiz, ES (Europe S) 2002
0.049-0.052 4 7 64-74 3 Fruit 0.01 (0.01, < 0.01)
02-2024 Trial: 1-Conil de
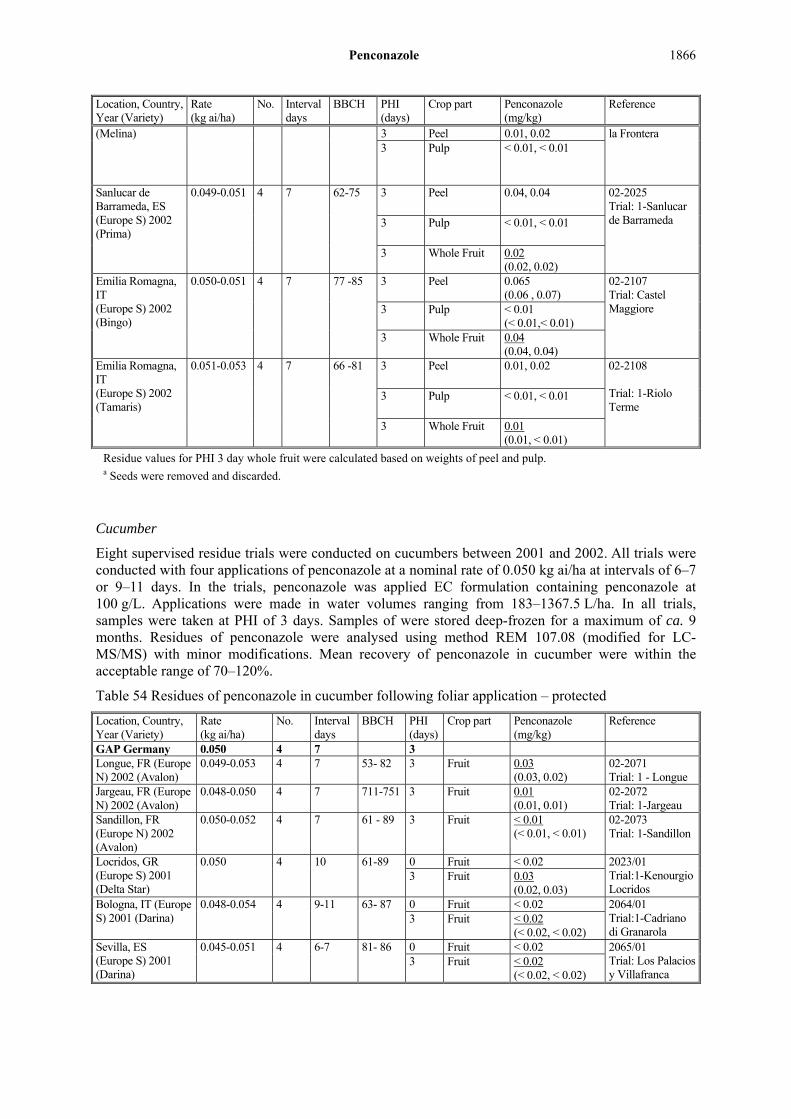
Penconazole
1866
Location, Country, Year (Variety)
Rate (kg ai/ha)
No. Interval days
BBCH PHI (days)
Crop part Penconazole (mg/kg)
Reference
(Melina) 3 Peel 0.01, 0.02 la Frontera 3 Pulp < 0.01, < 0.01
Sanlucar de Barrameda, ES (Europe S) 2002 (Prima)
0.049-0.051 4 7 62-75 3 Peel 0.04, 0.04 02-2025 Trial: 1-Sanlucar de Barrameda 3 Pulp < 0.01, < 0.01
3 Whole Fruit 0.02 (0.02, 0.02)
Emilia Romagna, IT (Europe S) 2002 (Bingo)
0.050-0.051 4 7 77 -85 3 Peel 0.065 (0.06 , 0.07)
02-2107 Trial: Castel Maggiore 3 Pulp < 0.01
(< 0.01,< 0.01) 3 Whole Fruit 0.04
(0.04, 0.04) Emilia Romagna, IT (Europe S) 2002 (Tamaris)
0.051-0.053 4 7 66 -81 3 Peel 0.01, 0.02 02-2108 Trial: 1-Riolo Terme
3 Pulp < 0.01, < 0.01
3 Whole Fruit 0.01 (0.01, < 0.01)
Residue values for PHI 3 day whole fruit were calculated based on weights of peel and pulp. a Seeds were removed and discarded.
Cucumber
Eight supervised residue trials were conducted on cucumbers between 2001 and 2002. All trials were conducted with four applications of penconazole at a nominal rate of 0.050 kg ai/ha at intervals of 6–7 or 9–11 days. In the trials, penconazole was applied EC formulation containing penconazole at 100 g/L. Applications were made in water volumes ranging from 183–1367.5 L/ha. In all trials, samples were taken at PHI of 3 days. Samples of were stored deep-frozen for a maximum of ca. 9 months. Residues of penconazole were analysed using method REM 107.08 (modified for LC-MS/MS) with minor modifications. Mean recovery of penconazole in cucumber were within the acceptable range of 70–120%.
Table 54 Residues of penconazole in cucumber following foliar application – protected
Location, Country, Year (Variety)
Rate (kg ai/ha)
No. Interval days
BBCH PHI (days)
Crop part
Penconazole (mg/kg)
Reference
GAP Germany 0.050 4 7 3 Longue, FR (Europe N) 2002 (Avalon)
0.049-0.053 4 7 53- 82 3 Fruit 0.03 (0.03, 0.02)
02-2071 Trial: 1 - Longue
Jargeau, FR (Europe N) 2002 (Avalon)
0.048-0.050 4 7 711-751 3 Fruit 0.01 (0.01, 0.01)
02-2072 Trial: 1-Jargeau
Sandillon, FR (Europe N) 2002 (Avalon)
0.050-0.052 4 7 61 - 89 3 Fruit < 0.01 (< 0.01, < 0.01)
02-2073 Trial: 1-Sandillon
Locridos, GR (Europe S) 2001 (Delta Star)
0.050 4 10 61-89 0 Fruit < 0.02 2023/01 Trial:1-Kenourgio Locridos
3 Fruit 0.03 (0.02, 0.03)
Bologna, IT (Europe S) 2001 (Darina)
0.048-0.054 4 9-11 63- 87 0 Fruit < 0.02 2064/01 Trial:1-Cadriano di Granarola
3 Fruit < 0.02 (< 0.02, < 0.02)
Sevilla, ES (Europe S) 2001 (Darina)
0.045-0.051 4 6-7 81- 86 0 Fruit < 0.02 2065/01 Trial: Los Palacios y Villafranca
3 Fruit < 0.02 (< 0.02, < 0.02)

Penconazole
1867
Location, Country, Year (Variety)
Rate (kg ai/ha)
No. Interval days
BBCH PHI (days)
Crop part
Penconazole (mg/kg)
Reference
Orgueil, FR (Europe S) 2002 (Defense)
0.050-0.052 4 7 63- 74 3 Fruit 0.02 (0.03, 0.01)
02-2142 Trial: 1- Tarn-et-Garonne
Asques, FR (Europe S) 2002 (Defence)
0.046-0.054 4 7 66- 82 3 Fruit 0.01 (0.01, 0.01)
02-2143 Trial: 1- Les Burgues
Tomato
Fourteen supervised residue trials were conducted on tomatoes between 1998 and 2004 under protected conditions. All trials were conducted with four applications of penconazole at a nominal rate of 0.050 kg ai/ha and intervals of 4–7 or 10–11 days. In the trials, penconazole was applied as EC formulation containing penconazole at 100 g/L. Applications were made in water volumes ranging from 188 to 1092 L/ha. In all trials samples were taken at PHI of 3 days. Samples of were stored deep-frozen for a maximum of ca 11 months. Residues of penconazole were analysed by using method REM 107.08 (modified for LC-MS/MS) with minor modifications and REM 107.10. Mean recovery of penconazole in tomatoes and peppers were within the acceptable range of 70–120%.
Table 55 Residues of penconazole in tomato and cherry tomato following foliar application – protected
Location, Country, Year (Variety)
Rate (kg ai/ha)
No. Interval days
BBCH PHI (days)
Crop part Penconazole (mg/kg)
Reference
GAP Germany 0.050 4 7 3 Tomato Shropshire, GB (Europe N) 2002 (Solution)
0.04-0.050 4 7 77- 87 0* Fruit < 0.01 02-2074 Trial: 1-Charlton 0 Fruit 0.04
3 Fruit 0.03 7 Fruit < 0.01 14 Fruit < 0.01 21 Fruit < 0.01 28 Fruit < 0.01
Jargeau, FR (Europe N) 2002 (Paola)
0.049-0.052 4 7 75 0 Fruit 0.01 02-2115 Trial: 1- Jargeau 3 Fruit < 0.01
7 Fruit < 0.01 13 Fruit < 0.01 20 Fruit < 0.01 27 Fruit < 0.01
Dampierre en Burly , FR (Europe N) 2002 (Recento)
0.049-0.052 4 7 71- 82 0 Fruit 0.0 02-2116 Trial: 1-Dampierre en Burly
3 Fruit 0.02 7 Fruit < 0.01 14 Fruit < 0.01 21 Fruit < 0.01 28 Fruit < 0.01
NL-Bemmel, NL (Europe N) 2003 (Clothilde)
0.052-0.055 4 7 60 - 89 0 Fruit 0.029 SYN-0334 1 Fruit 0.032 3 Fruit < 0.02 7 Fruit < 0.006
Huissen, NL (Europe N) 2003 (Cedrico)
0.051-0.056 4 7 60 - 89 0 Fruit 0.035 SYN-0335 1 Fruit 0.034 3 Fruit < 0.02 7 Fruit < 0.006
Murcia, ES (Europe S) 1998 (Royesta)
0.060 4 10-11 81- 83 0 Fruit < 0.02 2101/98 Trial: 1-Cañada de Gallego- Mazarró
3 Fruit 0.02 7 Fruit < 0.02 14 Fruit < 0.02
Penaflor, ES (Europe S) 2002 (Bon)
0.049-0.050 4 7 73 - 81 0* Fruit < 0.01 02-2137 Trial: 1-Penaflor 0 Fruit 0.03
3 Fruit 0.07 7 Fruit < 0.01

Penconazole
1868
Location, Country, Year (Variety)
Rate (kg ai/ha)
No. Interval days
BBCH PHI (days)
Crop part Penconazole (mg/kg)
Reference
14 Fruit < 0.01 21 Fruit < 0.01 28 Fruit < 0.01
Orgueil, FR (Europe S) 2002 (Brenda)
0.051-0.052 4 7 72-75 0* Fruit < 0.01 02-2140 Trial: 1-Rieux 0 Fruit 0.01
3 Fruit 0.02 7 Fruit < 0.01 14 Fruit < 0.01 21 Fruit < 0.01 28 Fruit < 0.01
Montauban, FR (Europe S) 2002 (Camelo)
0.048-0.051 4 7 81- 83 0* Fruit < 0.01 02-2141 Trial: 1-Montauban
0 Fruit 0.03 3 Fruit < 0.01 7 Fruit < 0.01 14 Fruit < 0.01 21 Fruit < 0.01 28 Fruit < 0.01
Valencia, ES (Europe S) 2003 (Bond)
0.048-0.055 4 4-7 65- 81 0 Fruit 0.038 SYN-0336 1 Fruit 0.031
3 Fruit < 0.02 7 Fruit < 0.02
Lokridos, GR (Europe S) 2004 (Belladonna, Hybrid)
0.049-0.050 4 6-7 85- 88 0* Fruit 0.02 SYN-0417 Trial: GRVV0F001
0 Fruit 0.01 1 Fruit < 0.01 3 Fruit < 0.01 7 Fruit < 0.01
Domokou, GR (Europe S) 2004 (9491, hybrid)
0.048-0.049 4 6-7 85- 88 0* Fruit < 0.01 SYN-0417 Trial: GRVV0F002
0 Fruit 0.06 1 Fruit 0.02 3 Fruit 0.02 7 Fruit 0.02
Cherry tomato Almeria, ES (Europe S) 2004 (Ankara)
0.050-0.052 4 7 69 -89 0* Fruit 0.02 SYN-0408 Trial: S04F005R 0 Fruit 0.06
1 Fruit 0.04 3 Fruit 0.03 7 Fruit 0.01
Almeria, ES (Europe S) 2004 (Eltiti; cocktail type)
0.050-0.054 4 7 69 - 84 0* Fruit 0.04 SYN-0408 Trial: S04F006R 0 Fruit 0.06
1 Fruit 0.04 3 Fruit 0.04 7 Fruit 0.02
* Indicates sample taken prior to last application
Peppers, Sweet
Eight protected trials were conducted with four applications at 0.050 kg ai/ha and intervals of 6–7 days between 2002 and 2003. In the trials, penconazole was applied as EC formulation containing penconazole at 100 g/L. Applications were made in water volumes ranging from 185 to 1120 L/ha. In all trials samples were taken at the minimum PHI of 3 days. Samples of were stored deep-frozen for a maximum of ca 10 months. Residues of penconazole were analysed by using method REM 107.08 (modified for LC-MS/MS). Mean recovery of penconazole in peppers were within the acceptable range of 70–120%.

Penconazole
1869
Table 56 Residues of penconazole in sweet pepper following foliar application of EC formulation –protected
Location, Country, Year (Variety)
Rate (kg ai/ha)
No. Interval days
BBCH PHI (days)
Crop part Penconazole (mg/kg)
Reference
GAP Germany 0.050 4 7 3 Loiret, FR (Europe N) 2002 (Vidi)
0.049-0.053 4 7 69- 73 0* Fruit < 0.02 02-2104 Trial: 1-Dampierre en Burly
0 Fruit 0.04 1 Fruit 0.03 3 Fruit < 0.02 7 Fruit < 0.02
St. Jeau le Blauc, FR (Europe N) 2002 (Spaitakus)
0.051-0.056 4 7 81 - 85 0* Fruit 0.03 02-2105 Trial: 1-St. Jeau le Blauc
0 Fruit < 0.02 1 Fruit 0.03 3 Fruit < 0.02 7 Fruit < 0.02
Maine-et-Loire, FR (Europe N) 2002 (Denver)
0.049-0.052 4 7 62- 81 0* Fruit 0.01 02-2106 Trial: 1-Longue 0 Fruit 0.05
1 Fruit 0.03 3 Fruit 0.02 7 Fruit 0.01
Huissen, NL (Europe N) 2003 (Mandy)
0.052-0.058 4 7 60 - 89 0 Fruit 0.043 SYN-0323 1 Fruit 0.039 3 Fruit 0.036 7 Fruit < 0.02
Villafranca, ES (Europe S) 2002 (Gallego)
0.048-0.050 4 7 72-76 0* Fruit 0.02 02-2019 Trial:1-Los Palacios y Villafranca
0 Fruit 0.28 1 Fruit 0.19 3 Fruit 0.12 7 Fruit 0.07
Seville, ES (Europe S) 2002 (Atol)
0.046-0.054 4 7 71- 74 0* Fruit < 0.01 02-2020 Trial: 1-Coria del Rio
0 Fruit 0.08 1 Fruit 0.04 3 Fruit 0.02 7 Fruit 0.01
Emilia Romagna, IT (Europe, S) 2002 (Valdor)
0.054-0.058 4 7 71 - 85 0* Fruit 0.02 02-2029 Trial: 1-Spadarolo
0 Fruit 0.07 1 Fruit 0.05 3 Fruit 0.04 7 Fruit 0.04
Valencia, ES (Europe S) 2003 (Canal)
0.049-0.056 4 6-7 66 - 82 0 Fruit 0.11 SYN-0324 1 Fruit 0.051 3 Fruit 0.041 7 Fruit < 0.02
* Indicates sample taken prior to last application
Artichoke, globe
Seven supervised residue trials were conducted on artichokes between 2002 and 2004. All trials were conducted with four applications of penconazole at a nominal rate of 0.050 kg ai/ha and intervals of 5–8 days. In the trials, penconazole was applied as EC formulation containing penconazole at 100 g/L. Applications were made in water volumes ranging from 201–1224 L/ha. In all trials samples were taken at or close to the minimum PHI of 14 days. Samples of were stored deep-frozen for a maximum of ca 10 months. Samples were analysed for residues of penconazole using method REM 107.08 (modified for LC-MS/MS) or REM 107.10. Mean recovery of penconazole in artichokes were within the acceptable range of 70–120%.

Penconazole
1870
Table 57 Residues of penconazole in artichoke, globe following foliar application of EC formulation
Location, Country, Year (Variety)
Rate (kg ai/ha)
No. Interval days
BBCH PHI (days)
Crop Part
Penconazole (mg/kg)
Reference
GAP Italy 0.050 4 14-16 14 Schleswig-Holstein, DE (Europe N) 2003 (Green Globe)
0.049-0.062 4 5-7 32-60 0 Flower heads 0.37 SYN-0314 7 Flower heads 0.071 14 Flower heads < 0.02 21 Flower heads < 0.02
Ochsenwerder,DE (Europe N) 2003 (not informed)
0.052-0.053 4 6-7 29-59 0 Flower heads 0.23 SYN-0315 7 Flower heads 0.033 14 Flower heads < 0.02 21 Flower heads < 0.02
Schleswig-Holstein, DE (Europe N) 2004 (not informed)
0.051-0.054 4 6-8 52- 58 0* Flower heads 0.03 SYN-0407 Trial: G04F004R 0 Flower heads 0.20
6 Flower heads 0.11 9 Flower heads 0.07 14 Flower heads 0.04 21 Flower heads 0.01
Niedersachsen, DE (Europe N) 2004 (not informed)
0.050-0.054 4 6-7 51- 56 0* Flower heads 0.07 SYN-0407 Trial: G04F005R 0 Flower heads 0.28
8 Flower heads 0.05 10 Flower heads 0.02 15 Flower heads 0.02 20 Flower heads < 0.01
Aldean ueva de Ebro, ES (Europe S) 2002 (Blanca de Tudela)
0.050-0.051 4 7 55 0* Flower heads 0.04 02-2003 Trial: 02-2003 0 Flower heads 0.12
7 Flower heads 0.02 14 Flower heads < 0.01
(< 0.01, < 0.01) 21 Flower heads < 0.01
Valencia, ES (Europe S) 2003 (Comun)
0.049-0.051 4 7-8 43- 48 0 Flower heads 0.14 SYN-0316 7 Flower heads < 0.02 14 Flower heads < 0.02 21 Flower heads < 0.02
Languedoc-Roussillon, FR (Europe S) 2004 (Petit violet)
0.050 4 7-8 39-43 0 Flower heads 0.17 SYN-0317 7 Flower heads 0.071 14 Flower heads < 0.02 21 Flower heads < 0.02
* Indicates sample taken prior to last application
FATE OF RESIDUES IN STORAGE AND PROCESSING
Nature of the residue during processing
High-temperature hydrolysis
A high-temperature hydrolysis study was conducted to determine the nature of the residues generated under processing conditions (Crawford, N.A., 2002; Report No. 02JH008). Individual buffered solutions of [14C-triazole] penconazole (4.7-5.2 mg/L) at pH 4, 5 and 6 were placed in vacuum hydrolysis vials before being heated to 90, 100 and 120°C for 20, 60 and 20 minutes, respectively. Control samples were prepared for each buffer and maintained at ambient temperature for one hour. Characterisation and possible identification of the degradation products were carried out by co-chromatography with reference markers in three TLC systems of different polarities.
Overall, recoveries of penconazole ranged from 107.9 to 118.5% for treated samples. Penconazole was stable in all conditions of temperature, pH and reaction time that mimic pasteurisation, baking, brewing, boiling and sterilisation.
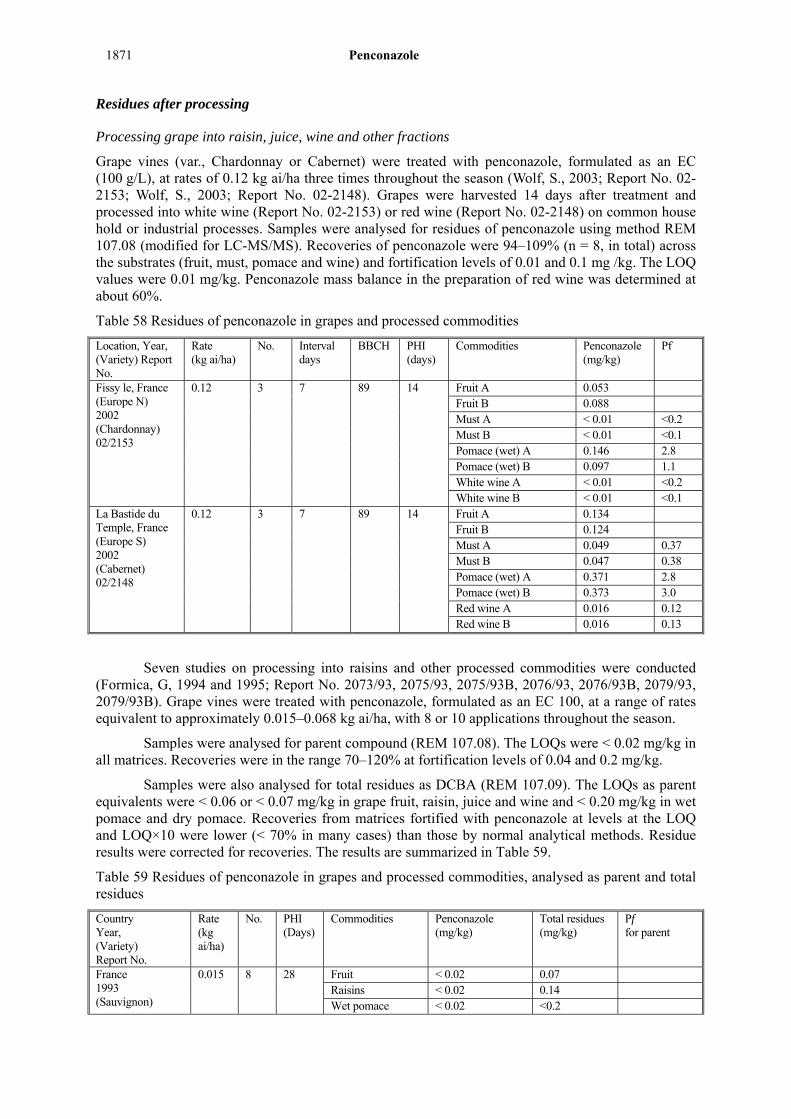
Penconazole
1871
Residues after processing
Processing grape into raisin, juice, wine and other fractions
Grape vines (var., Chardonnay or Cabernet) were treated with penconazole, formulated as an EC (100 g/L), at rates of 0.12 kg ai/ha three times throughout the season (Wolf, S., 2003; Report No. 02-2153; Wolf, S., 2003; Report No. 02-2148). Grapes were harvested 14 days after treatment and processed into white wine (Report No. 02-2153) or red wine (Report No. 02-2148) on common house hold or industrial processes. Samples were analysed for residues of penconazole using method REM 107.08 (modified for LC-MS/MS). Recoveries of penconazole were 94–109% (n = 8, in total) across the substrates (fruit, must, pomace and wine) and fortification levels of 0.01 and 0.1 mg /kg. The LOQ values were 0.01 mg/kg. Penconazole mass balance in the preparation of red wine was determined at about 60%.
Table 58 Residues of penconazole in grapes and processed commodities
Location, Year, (Variety) Report No.
Rate (kg ai/ha)
No. Interval days
BBCH PHI (days)
Commodities Penconazole (mg/kg)
Pf
Fissy le, France (Europe N) 2002 (Chardonnay) 02/2153
0.12 3 7 89 14 Fruit A 0.053 Fruit B 0.088 Must A < 0.01 <0.2 Must B < 0.01 <0.1 Pomace (wet) A 0.146 2.8 Pomace (wet) B 0.097 1.1 White wine A < 0.01 <0.2 White wine B < 0.01 <0.1
La Bastide du Temple, France (Europe S) 2002 (Cabernet) 02/2148
0.12 3 7 89 14 Fruit A 0.134 Fruit B 0.124 Must A 0.049 0.37 Must B 0.047 0.38 Pomace (wet) A 0.371 2.8 Pomace (wet) B 0.373 3.0 Red wine A 0.016 0.12 Red wine B 0.016 0.13
Seven studies on processing into raisins and other processed commodities were conducted (Formica, G, 1994 and 1995; Report No. 2073/93, 2075/93, 2075/93B, 2076/93, 2076/93B, 2079/93, 2079/93B). Grape vines were treated with penconazole, formulated as an EC 100, at a range of rates equivalent to approximately 0.015–0.068 kg ai/ha, with 8 or 10 applications throughout the season.
Samples were analysed for parent compound (REM 107.08). The LOQs were < 0.02 mg/kg in all matrices. Recoveries were in the range 70–120% at fortification levels of 0.04 and 0.2 mg/kg.
Samples were also analysed for total residues as DCBA (REM 107.09). The LOQs as parent equivalents were < 0.06 or < 0.07 mg/kg in grape fruit, raisin, juice and wine and < 0.20 mg/kg in wet pomace and dry pomace. Recoveries from matrices fortified with penconazole at levels at the LOQ and LOQ×10 were lower (< 70% in many cases) than those by normal analytical methods. Residue results were corrected for recoveries. The results are summarized in Table 59.
Table 59 Residues of penconazole in grapes and processed commodities, analysed as parent and total residues
Country Year, (Variety) Report No.
Rate (kg ai/ha)
No. PHI (Days)
Commodities Penconazole (mg/kg)
Total residues (mg/kg)
Pf for parent
France 1993 (Sauvignon)
0.015 8 28 Fruit < 0.02 0.07 Raisins < 0.02 0.14 Wet pomace < 0.02 <0.2
Penconazole
1872
Country Year, (Variety) Report No.
Rate (kg ai/ha)
No. PHI (Days)
Commodities Penconazole (mg/kg)
Total residues (mg/kg)
Pf for parent
2073/93 Dry pomace 0.04 0.41 Juice < 0.02 0.08 Wine < 0.02 < 0.06
France 1993 (Cinsault) 2075/93
0.015 8 30 Fruit < 0.02 0.06 Raisins 0.02 0.23 Wet pomace 0.03 0.20 Dry pomace 0.05 0.33 Juice < 0.02 < 0.07 Wine < 0.02 0.05
France 1993 (Cinsault) 2075/93B
0.031 8 30 Fruit < 0.02 0.13 Raisins 0.03 0.77 Wet pomace 0.06 0.42 Dry pomace 0.10 0.58 Juice < 0.02 0.07 Wine < 0.02 0.10
Italy 1993 (Schiava grossa) 2076/93
0.032 10 14 Fruit 0.05 0.24 Raisins 0.11 0.87 2.2 Wet pomace 0.26 0.83 5.2 Dry pomace 1.05 2.5 21 Juice < 0.02 0.09 <0.4 Wine < 0.02 0.14 <0.4
Italy 1993 (Schiava grossa) 2076/93B
0.064 10 14 Fruit 0.08 0.34 Raisins 0.32 2.90 4.0 Wet pomace 0.6 1.94 7.5 Dry pomace 2.1 5.3 26 Juice 0.02 0.16 0.25 Wine 0.02 0.27 0.25
Italy 1993 (Trebbiano) 2079/93
0.030 10 14 Fruit 0.02 0.17 Raisins 0.08 0.65 4.0 Wet pomace 0.05 0.29 2.5 Dry pomace 0.25 1.6 13 Juice < 0.02 0.08 <1 Wine < 0.02 < 0.06 <1
Italy 1993 (Trebbiano) 2079/93B
0.064 10 14 Fruit 0.05 0.32 Raisins 0.18 1.69 3.6 Wet pomace 0.16 0.78 3.2 Dry pomace 0.51 3.03 10 Juice < 0.02 0.13 <0.4 Wine < 0.02 0.08 <0.4
Wine: stored at 6-15 °C for 6 month
Processing factors for total residues were not reliable due to the analytical method.
Processing apple into juice, sauce, and other fractions
A field trial on apples (var. Golden) was conducted in 2005 in Courcy aux Loges, Northern France. Penconazole (EC formulation, 100 g/L) was applied three times to apple trees at a nominal rate of 0.18 kg ai/ha (1000 L/ha, 10 day spray intervals) (Boxwell, C., 2007; Report No. 05-6043). Samples of mature fruit were collected 14 days after the last application (growth stage BBCH 87). Samples were transferred to the processing laboratory on the day of sampling. One balance and three follow-up studies were conducted.
A sub-sample of apples was washed and strained, and the washed apples crushed, pressed and sieved to separate wet pomace from juice. The juice was treated with pectolytic enzymes, filtered and pasteurised (85 ºC, 1 minute). A sub-sample of apples was washed, blanched (100 ºC, 2 minutes),
Penconazole
1873
crushed and sieved to separate puree from peel. Sugar was added and the puree reduced by heating to Brix 24%. The pH of the puree was then adjusted to 3.6 with citric acid and the puree sterilised in glass jars at 115–120 ºC for 10 minutes.
Samples of unwashed apples (RAC) and processed commodities were analysed using method REM 107.10. Recoveries for RAC and individual processed commodities were in the range 78–112% at fortification levels of 0.01 and 1.0 mg/kg.
Residue mass balances of 83% and 113% for apple juice and apple sauce, respectively were achieved in the apple processing study. Processing factors are shown in Table 60.
Table 60 Residues of penconazole in apple and processed commodities
Process Balance study Follow-up study 1 Follow-up study 2 Follow-up study 3 Penconazole (mg/kg)
Pf Penconazole (mg/kg)
Pf Penconazole (mg/kg)
Pf Penconazole (mg/kg)
Pf
Unwashed apples (RAC)
0.15 0.15 0.15 0.15
Washed apples 0.12 0.80 0.22 1.5 0.12 0.75 0.13 0.87 Wet pomace 0.31 2.1 0.30 2.0 0.33 2.2 0.47 3.1 Dry pomace 1.3 8.7 1.1 7.3 1.4 9.3 1.4 9.3 Apple juice < 0.01 < 0.07 < 0.01 < 0.07 < 0.01 < 0.07 < 0.01 < 0.07 Washed apples 0.10 0.67 0.19 1.3 0.10 0.67 0.14 0.93 Apple sauce 0.02 0.13 0.03 0.20 0.02 0.13 0.03 0.20
Processing strawberry into jam and canned fruits
An outdoor trial on strawberry (var. Camarrosa) was conducted in 2004 in Quatretonda, Valencia, Spain (Richards, S., 2006; Report No. 04-6027). EC formulation (100 g/L) was applied four times to strawberry at a nominal rate of 0.2 kg ai/ha. Samples were collected 3 days after the last application (growth stage BBCH 87).
The strawberries were washed in 2 L of water per kg of strawberries and the calyxes were removed. Jam was prepared from washed strawberries with the calyxes removed. The strawberries were crushed and the degrees Brix measured. White sugar was added and the strawberry puree was then reduced in a double jacketed saucepan in order to reach 62% degree Brix. The pH was measured and corrected if necessary with citric acid to obtain approximately pH 3.5. Sterilization was done at 115 °C for 10 minutes. Canned strawberries were prepared from washed strawberries with the calyxes removed. The sorted strawberries were blanched in boiling water (1 L/kg of strawberries) for 1 minute and canned. One third (ca. 250 g) sugar syrup was added to about two thirds (ca. 500 g) of blanched strawberries. Pasteurization was made at +90/+95 °C for 1 minute.
All samples were analysed using method REM 107.10. Recoveries for RAC and individual processed commodities were in the range 94–112% at fortification levels of 0.01 and 0.1/0.2/0.5 mg/kg.
One full balance study and three follow-up processing studies were performed. The balance study achieved good recoveries of penconazole through the process, 122%. Processing factors are shown in Table 61.
Table 61 Residues of penconazole in strawberry and processed commodities
Process Balance study Follow-up study 1 Follow-up study 2 Follow-up study 3 Penconazole (mg/kg)
Pf Penconazole (mg/kg)
Pf Penconazole (mg/kg)
Pf Penconazole (mg/kg)
Pf
Unwashed apples (RAC)a
0.30 0.30 0.30 0.30
Washed strawberry 0.49 1.6 0.34 1.1 0.34 1.1 0.38 1.3
Penconazole
1874
Process Balance study Follow-up study 1 Follow-up study 2 Follow-up study 3 Penconazole (mg/kg)
Pf Penconazole (mg/kg)
Pf Penconazole (mg/kg)
Pf Penconazole (mg/kg)
Pf
Jam, sterilized 0.27 0.90 0.22 0.73 0.31 1.0 0.23 0.77
Canned strawberry , pasteurized
0.18 0.60 0.15 0.50 0.18 0.60 0.15 0.50
a Analysed after removal of calyx
Processing blackcurrants into juice
One of the supervised trials on blackcurrants included a processing phase for the production of blackcurrant juice (Grabe, D., 1995; Report No CSTR 016:04). Blackcurrant plants treated four times, (at nominally 14 day intervals), at a rate of 0.050 kg ai/ha with EC formulation (100 g/L) were harvested 28 days after the final application.
Blackcurrants were processed into juice. Samples were analysed using methods CG 341 and REM 107.08 (modified for LC-MS/MS). Recoveries of penconazole in RAC and juice were within the acceptable range of 70–120%.
Table 62 Residues of penconazole in blackcurrant and juice
Trial RAC Juice Pf CSTR 016:04 Trial: GB11FR00394
0.15 (0.14, 0.15)
0.02 (0.02, 0.02)
0.13
CSTR 016:04 Trial: GB11FR00494
0.30 (0.30, 0.30)
0.08 (0.08, 0.08)
0.27
Table 63 Summary of processing results
Crop Commodity Processing factor for parent compound
Individual values Best estimate
Grapes
Raisin 2.2 (3.6), 3.6 (5.3), 4.0 (3.8), 4.0 (8.5) 3.8
Wet pomace 1.1, 2.5 (1.7), 2.8, 2.8, 3.0, 3.2 (2.4), 5.2 (3.5), 7.5 (5.6) 2.9
Dry pomace 10 (9.5), 13 (9.4), 21 (10), 26 (16) 17
Juice <0.4 (0.38), <0.4 (0.41), <1 (0.35), <1 (0.47), 0.25 (0.47), 0.25 (0.79) < 1
Wine <0.1, <0.2, <0.4 (0.25), <0.4 (0.58), 0.12, 0.13 < 0.4
Apple
Washed apples 0.67, 0.67, 0.75, 0.80, 0.87, 0.93, 1.3, 1.5 0.84
Wet pomace 2.0, 2.1, 2.2, 3.1 2.2
Dry pomace 7.3, 8.7, 9.3, 9.3 9.0
Juice < 0.07 (4) < 0.07
Sauce 0.13, 0.13, 0.20, 0.20 0.17
Strawberry
Washed strawberries 1.1, 1.1, 1.3, 1.6 1.2
Jam, sterilized 0.73, 0.77, 0.90, 1.0 0.84
Canned, pasteurized 0.50, 0.50, 0.60, 0.60 0.55
Blackcurrant Juice 0.13, 0.27 0.20
RESIDUES IN ANIMAL COMMODITIES
Livestock feeding Studies
Lactating ruminants
Cows were fed diets containing 10, 50 and 100 ppm penconazole for up to 28 days (Cheung, M.W., et al., 1985; Report No. ABR-85053 and Seim, V.W. et al., 1985; Report No. BIOL-84034). Milk was sampled from daily production, and tissues were taken at weekly sacrifices. Residue levels were
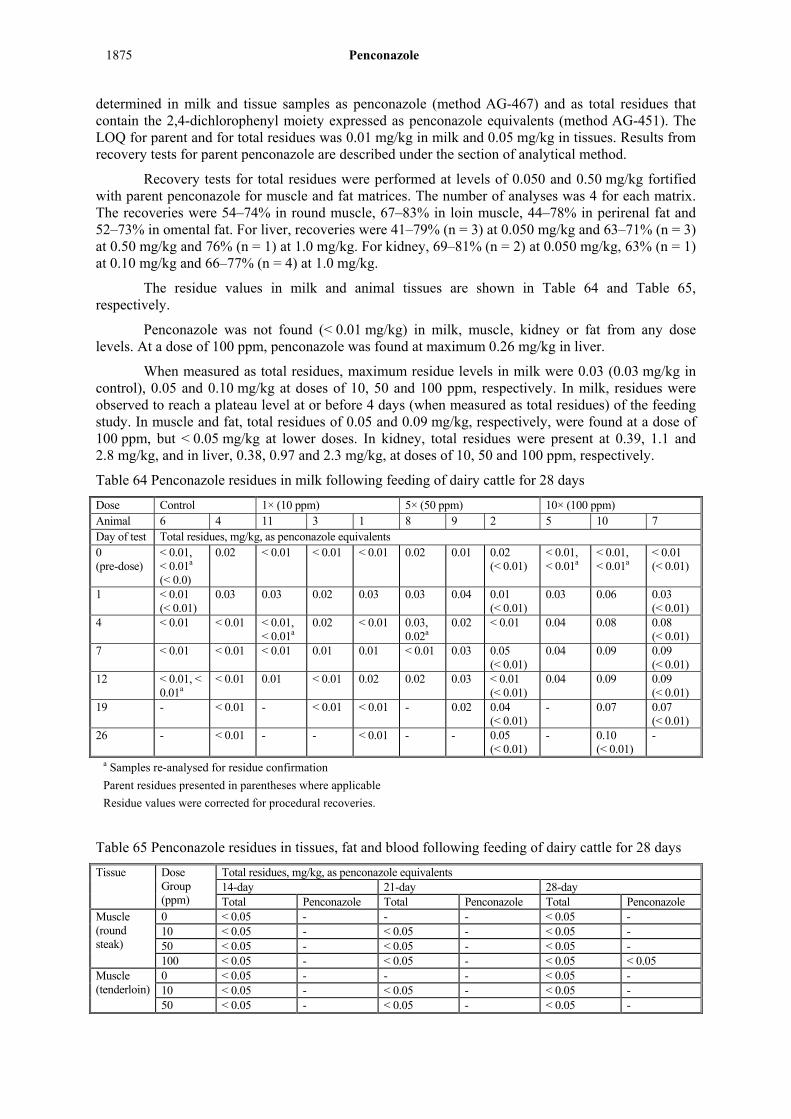
Penconazole
1875
determined in milk and tissue samples as penconazole (method AG-467) and as total residues that contain the 2,4-dichlorophenyl moiety expressed as penconazole equivalents (method AG-451). The LOQ for parent and for total residues was 0.01 mg/kg in milk and 0.05 mg/kg in tissues. Results from recovery tests for parent penconazole are described under the section of analytical method.
Recovery tests for total residues were performed at levels of 0.050 and 0.50 mg/kg fortified with parent penconazole for muscle and fat matrices. The number of analyses was 4 for each matrix. The recoveries were 54–74% in round muscle, 67–83% in loin muscle, 44–78% in perirenal fat and 52–73% in omental fat. For liver, recoveries were 41–79% (n = 3) at 0.050 mg/kg and 63–71% (n = 3) at 0.50 mg/kg and 76% (n = 1) at 1.0 mg/kg. For kidney, 69–81% (n = 2) at 0.050 mg/kg, 63% (n = 1) at 0.10 mg/kg and 66–77% (n = 4) at 1.0 mg/kg.
The residue values in milk and animal tissues are shown in Table 64 and Table 65, respectively.
Penconazole was not found (< 0.01 mg/kg) in milk, muscle, kidney or fat from any dose levels. At a dose of 100 ppm, penconazole was found at maximum 0.26 mg/kg in liver.
When measured as total residues, maximum residue levels in milk were 0.03 (0.03 mg/kg in control), 0.05 and 0.10 mg/kg at doses of 10, 50 and 100 ppm, respectively. In milk, residues were observed to reach a plateau level at or before 4 days (when measured as total residues) of the feeding study. In muscle and fat, total residues of 0.05 and 0.09 mg/kg, respectively, were found at a dose of 100 ppm, but < 0.05 mg/kg at lower doses. In kidney, total residues were present at 0.39, 1.1 and 2.8 mg/kg, and in liver, 0.38, 0.97 and 2.3 mg/kg, at doses of 10, 50 and 100 ppm, respectively.
Table 64 Penconazole residues in milk following feeding of dairy cattle for 28 days
Dose Control 1× (10 ppm) 5× (50 ppm) 10× (100 ppm) Animal 6 4 11 3 1 8 9 2 5 10 7 Day of test Total residues, mg/kg, as penconazole equivalents 0 (pre-dose)
< 0.01, < 0.01a (< 0.0)
0.02 < 0.01 < 0.01 < 0.01 0.02 0.01 0.02 (< 0.01)
< 0.01, < 0.01a
< 0.01, < 0.01a
< 0.01 (< 0.01)
1 < 0.01 (< 0.01)
0.03 0.03 0.02 0.03 0.03 0.04 0.01 (< 0.01)
0.03 0.06 0.03 (< 0.01)
4 < 0.01 < 0.01 < 0.01, < 0.01a
0.02 < 0.01 0.03, 0.02a
0.02 < 0.01 0.04 0.08 0.08 (< 0.01)
7 < 0.01 < 0.01 < 0.01 0.01 0.01 < 0.01 0.03 0.05 (< 0.01)
0.04 0.09 0.09 (< 0.01)
12 < 0.01, < 0.01a
< 0.01 0.01 < 0.01 0.02 0.02 0.03 < 0.01 (< 0.01)
0.04 0.09 0.09 (< 0.01)
19 - < 0.01 - < 0.01 < 0.01 - 0.02 0.04 (< 0.01)
- 0.07 0.07 (< 0.01)
26 - < 0.01 - - < 0.01 - - 0.05 (< 0.01)
- 0.10 (< 0.01)
-
a Samples re-analysed for residue confirmation
Parent residues presented in parentheses where applicable
Residue values were corrected for procedural recoveries.
Table 65 Penconazole residues in tissues, fat and blood following feeding of dairy cattle for 28 days
Tissue Dose Group (ppm)
Total residues, mg/kg, as penconazole equivalents 14-day 21-day 28-day Total Penconazole Total Penconazole Total Penconazole
Muscle (round steak)
0 < 0.05 - - - < 0.05 - 10 < 0.05 - < 0.05 - < 0.05 - 50 < 0.05 - < 0.05 - < 0.05 - 100 < 0.05 - < 0.05 - < 0.05 < 0.05
Muscle (tenderloin)
0 < 0.05 - - - < 0.05 - 10 < 0.05 - < 0.05 - < 0.05 - 50 < 0.05 - < 0.05 - < 0.05 -

Penconazole
1876
100 < 0.05 - < 0.05 - 0.05 - Kidney 0 < 0.05 - - - 0.06, 0.06b -
10 (0.14) 0.13, 0.14b
- (0.37) 0.39, 0.34, 0.39b
- (0.10) 0.12, 0.08b
-
50 (0.50) 0.48, 0.51b
- (0.69) 0.71, 0.55, 0.80b
- (0.97) 1.1, 0.83b
-
100 (1.8) 1.8, 1.7b
- (2.6) 2.4, 2.8, 2.6b
< 0.05 (1.2) 0.97, 1.4b
< 0.05
Liver 0 < 0.05 - - - < 0.05 - 10 0.38 - 0.19 - (0.13)
0.10, 0.16b -
50 0.75 - 0.97 - (0.78) 0.71, 0.84b
-
100 2.0 - 2.1 0.23 (2.1) 2.3, 1.8b
0.26
Omental fat
0 < 0.05 - - - < 0.05 - 10 < 0.05 - < 0.05 - < 0.05 - 50 < 0.05 - < 0.05 - < 0.05 - 100 < 0.05 - 0.06 < 0.05 0.09 < 0.05
Perirenal fat
0 < 0.05 - - - < 0.05 - 10 < 0.05 - < 0.05 - < 0.05 - 50 < 0.05 - < 0.05 - < 0.05 - 100 < 0.05 - 0.06 < 0.05 0.07 < 0.05
Blood a 0 < 0.05 - - - < 0.05 - 10 < 0.05 - < 0.05 - < 0.05 - 50 < 0.05 - 0.08 - 0.07 - 100 0.10 - 0.15 < 0.05 0.12 < 0.05
a Blood samples taken on day 13, 20 and 27 b Samples re-analysed for residue confirmation; the mean value in parentheses
Residue values were corrected for procedural recoveries.
Laying hens
Laying hens were fed diets containing 1.25, 6.25 and 12.5 mg/kg feed penconazole, for up to 29 days (Cheung, M.W; 1985; Report No. ABR-85054). Eggs were sampled from daily production and tissues were taken weekly and total residues (as DCBA) were determined. Samples were stored at -15 °C until analysis. Except one liver sample from the group treated with the highest dose at Day 7, which contained 0.09 mg/kg, total residues were < 0.05 mg/kg in eggs, breast plus thigh, fat, skin and the remainder of the liver samples at any of the feeding levels.
APPRAISAL
Penconazole is a systemic triazole fungicide used for the control of powdery mildew, pome fruit scab and other fungal pathogens on fruit and vegetables. It belongs to the class of sterol demethylation inhibitors (DMI inhibitors), inhibiting the biosynthesis of cell membrane ergosterol.
Penconazole was first evaluated by JMPR in 1992 for toxicology and residues. In 1995, residue data for pome fruits and grapes were reviewed. In 2015, penconazole and the metabolites, 1,2,4-triazole, triazole alanine and triazole acetic acid were re-evaluated for toxicology by JMPR within the periodic review programme of CCPR. The Meeting reaffirmed the ADI of 0–0.03 mg/kg bw and established an ARfD of 0.8 mg/kg bw for penconazole. For 1,2,4-triazole, the Meeting reaffirmed the previous ADI of 0–0.2 mg/kg bw and ARfD of 0.3 mg/kg bw. For triazole alanine and triazole acetic acid, the Meeting reaffirmed the group ADI (alone or in combination) of 0–1 mg/kg bw
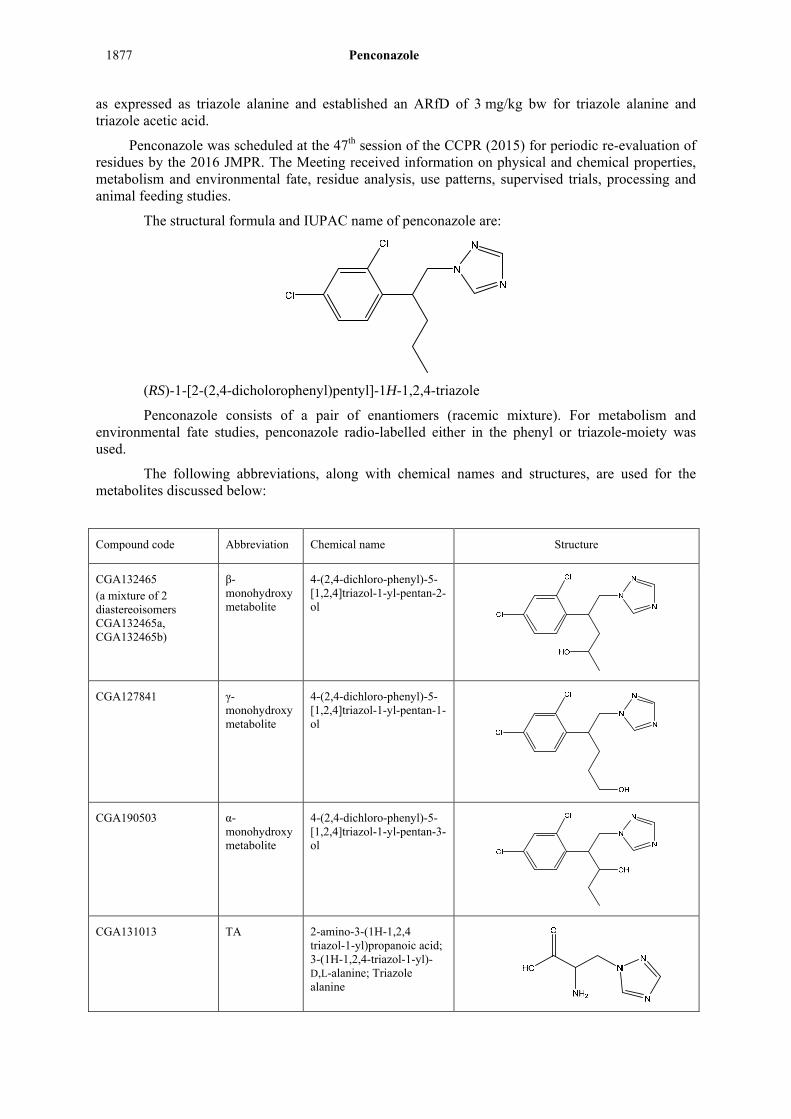
Penconazole
1877
as expressed as triazole alanine and established an ARfD of 3 mg/kg bw for triazole alanine and triazole acetic acid.
Penconazole was scheduled at the 47th session of the CCPR (2015) for periodic re-evaluation of residues by the 2016 JMPR. The Meeting received information on physical and chemical properties, metabolism and environmental fate, residue analysis, use patterns, supervised trials, processing and animal feeding studies.
The structural formula and IUPAC name of penconazole are:
(RS)-1-[2-(2,4-dicholorophenyl)pentyl]-1H-1,2,4-triazole
Penconazole consists of a pair of enantiomers (racemic mixture). For metabolism and environmental fate studies, penconazole radio-labelled either in the phenyl or triazole-moiety was used.
The following abbreviations, along with chemical names and structures, are used for the metabolites discussed below:
Compound code Abbreviation Chemical name Structure
CGA132465 (a mixture of 2 diastereoisomers CGA132465a, CGA132465b)
β-monohydroxy metabolite
4-(2,4-dichloro-phenyl)-5-[1,2,4]triazol-1-yl-pentan-2-ol
CGA127841 γ-monohydroxy metabolite
4-(2,4-dichloro-phenyl)-5-[1,2,4]triazol-1-yl-pentan-1-ol
CGA190503 α-monohydroxy metabolite
4-(2,4-dichloro-phenyl)-5-[1,2,4]triazol-1-yl-pentan-3-ol
CGA131013 TA 2-amino-3-(1H-1,2,4 triazol-1-yl)propanoic acid; 3-(1H-1,2,4-triazol-1-yl)-D,L-alanine; Triazole alanine

Penconazole
1878
Compound code Abbreviation Chemical name Structure
CGA142856 TAA 1H-1,2,4-triazol-1-yl-acetic acid; Triazole acetic acid
CGA205369 TLA 2-hydroxy-3-[1,2,4]triazol-1-yl-propionic acid; Triazole lactic acid
CGA71019 1,2,4-triazole 1H-1,2,4-triazole
CGA177279 4-(2,4-dichloro-phenyl)-5-[1,2,4]triazol-1-yl-pentanoic acid
CGA179944 2-(2,4-dichloro-phenyl)-3-[1,2,4]triazol-1-yl-propionic acid
Plant metabolism
The metabolism of penconazole was studied in grapes, tomatoes and apples.
Grapes
A plot of four plants was treated four times with [14C-triazole] penconazole, with a 14–18 day interval, at rates of 5 g ai/hL by foliar spraying. Mature grapes and leaves were harvested 68 days after treatment. Total radioactive residues (TRRs) in grapes and the leaves were 0.10 mg eq/kg and 5.3 mg eq/kg, respectively. The grape TRRs were partitioned into the juice fraction (36%) and the press cake fraction (64%). Juice was partitioned with dichloromethane and the aqueous phase was hydrolysed. Press cake was extracted with 80% methanol and the extract was partitioned with dichloromethane. Then the aqueous phase was hydrolysed. Extraction with methanol recovered 84% of the TRR in juice and press cake and 95% TRR in the leaves.
The parent compound was found at up to 16% (0.016 mg/kg) of the TRR in grapes and 8% TRR (0.45 mg/kg) in the leaves. Hydroxylated metabolites including CGA190503, CGA132465 and CGA127841 (α-, β- and -monohydroxylated of the alkyl chain of parent, respectively) were the predominant residues in both grapes and leaves. In total, the monohydroxy metabolites (free or conjugated) accounted for 61% TRR (3.3 mg eq/kg) in the leaves. CGA132465, a mixture of diastereomers of CGA132465 and CGA132465 b, was the predominant residue (39% TRR, 2.1 mg eq/kg) and CGA190503 and CGA127841 were at a lesser extent (16% and 6% TRR, respectively). Polar fractions likely containing triazole-specific metabolites were not further

Penconazole
1879
characterized in leaves. In grapes, the monohydroxy metabolites, not characterised individually, accounted for 35% TRR (0.035 mg eq/kg). Polar fractions analysed contained TA, TAA and TLA, totalling 25% TRR (0.025 mg eq/kg), representing 10% TRR (0.01 mg eq/kg), 2.3% TRR (0.0023 mg eq/kg) and 12% TRR (0.012 mg eq/kg), respectively, in grapes.
Penconazole, radiolabelled with [14C-triazole] or [14C-phenyl], was applied to grape vines planted at two sites. Grape vines were treated by foliar spraying with different doses by site (3×0.038 kg ai/ha at 1st application, -47-day PHI, at Site 1 and 5×0.10 kg ai/ha, 1st application, -90-day PHI, at Site 2). At Site 1, grapes were harvested 64 (immature) and 78 (mature) days after the last application (DALA) and at Site 2, harvested 0, 14 and 22 DALA.
Overall total radioactive residues were different depending on the dose and harvest times but not related to difference with radiolabelling. In grapes (78 DALA), total radioactivity from triazole-label application was 0.08 or 0.049 mg eq/kg and was 0.05 mg eq/kg from phenyl-label application. Overall total residues in the leaves decreased over time, e.g. for Site 1 from the triazole-label, 8.1 mg eq/kg (0 DALA) to 2.5 mg eq/kg (64 DALA) and 1.9 mg eq/kg (78 DALA). Extraction of radioactive residues with methanol recovered 69–88% of the TRR in grapes. Overall metabolic fractions and distribution pattern of radioactivity were similar among the treatments.
In the mature grapes from a triazole label study (78 days, 0.049 mg eq/kg), the parent compound was found at a level of 11% TRR (0.005 mg/kg). CGA132465 (mainly), CGA127841 and CGA190503 were the predominant residues, accounting for totalling 22% TRR mainly found after acid hydrolysis. Polar fraction (likely containing triazole-specific metabolites) making up 24% TRR (0.012 mg eq/kg) was not further characterised.
Tomato
[14C-phenyl] penconazole was applied four times to field grown tomato plants (BBCH 71, first fruit clusters) at a 7-day interval and rates of 0.040 kg ai/ha by foliar spraying. Fruit and leaf samples were collected 7 and 40 days after treatment. Total radioactive residues decreased over time (7 to 40 DALA), 0.034 mg eq/kg to 0.014 mg eq/kg in fruit and 2.7 mg eq/kg to 0.42 mg eq/kg in the leaves. The majority (> 84%) of radioactive residues in fruit and leaves were able to be recovered by methanol extraction. Surface methanol wash of mature fruits removed only 2.4% TRR, indicating that the majority of the residue was internal to the fruits.TRR levels of the parent compound decreased over time (7 to 40 DALA), 15% TRR (0.005 mg/kg) to 7% TRR (0.001 mg/kg). In tomatoes both at 7 and 40 DALA, CGA132465 (including trace amount of CGA127841) was the predominant residues, accounting for 63–65% TRR found after acid hydrolysis (CGA132465, 62% TRR). CGA190503 was also found but at a trace level, 3–4% TRR. The metabolic patterns in the leaves were qualitatively very similar to those in fruits.
Using penconazole radiolabelled with [14C-triazole], metabolism in tomatoes was investigated in the same way as the study described above, running in parallel with it.
TRRs in fruits were 0.071 mg eq/kg (7 DALA) and 0.029 mg eq/kg (40 DALA), which was two-fold higher than in fruits treated with the phenyl label. Surface wash with methanol removed 16% (7 DALA) and 3% TRR (40 DALA). The majority (> 87%) of radioactivity was able to be recovered by methanol extraction.
The results were nearly the same with those from the phenyl-label study, except for triazole specific metabolites. In mature tomatoes, the parent compound was found at 0.003 mg/kg (12% TRR). The monohydroxy metabolites, CGA132465 (55% TRR), CGA127841 (2% TRR, < 0.001) and CGA190503 (3% TRR, < 0.001) were found in total, 60% TRR level (0.017 mg eq/kg) after acid hydrolysis.
The sum of 1,2,4-triazole, TA, TAA and TLA amounted to 20% TRR (0.006 mg eq/kg). TA was most predominant, accounting for 15% TRR (0.004 mg eq/kg).

Penconazole
1880
Apple
Penconazole, radio-labelled with [14C-triazole], was applied ten times to two apple trees at a 8–17 day interval and rates of 2.5 g ai/hL by foliar spraying. A sample of leaves was taken at 0, 2, 5, 7 and 14 DALA. At harvest (34 DALA), all fruits, leaves, branches and roots were collected. Total radioactive residues in apple fruit were 0.10 mg eq/kg, which comprised 39% TRR in peel and 61% TRR in pulp. In leaves, branches and roots, TRR levels were 3.8, 0.61 and 0.17 mg eq/kg, respectively.
Radioactivity in the leaves decreased over time from 5.5 mg eq/kg (0 DALA) to 3.8 mg eq/kg at harvest (34 DALA). The surface radioactivity in leaves (0 DALA) accounted for 57% TRR, but was not detected at harvest (34 DALA). Methanol extraction was able to recover > 70% of the TRRs in various matrices. Soxhlet extraction in methanol recovered an additional 3% TRR in whole fruit.
In apple fruit, the parent compound was found at 12% of the TRR (0.012 mg/kg). CGA132465 and TA were the predominant residues, accounting for 14% TRR (0.014 mg eq/kg, 5.5% TRR released after acid hydrolysis) and 23% TRR (0.023 mg eq/kg, 22% TRR from pulp), respectively. CGA127841 was present but only at 0.5% TRR (< 0.001). Other minor residues (CGA190503, CGA189659, dihydroxy metabolites, CGA179944, TAA, TLA, 1,2,4-triazole glycolic acid) were present at < 5% TRR.
In leaves, branches and roots, TRR levels of the parent compound were 7% (0.26 mg/kg), 43% (0.26 mg/kg) and 13% (0.022 mg/kg), respectively. In leaves, CGA132465 and CGA189659 were found at 38% and 14% of the TRR, while TA was not found. CGA91304 and the acetyl derivative CGA90305 were found only in the leaves at trace levels (0.03% and 0.04% TRR, respectively). For branches and roots, identification of components was not made except for parent compound.
Fractions from apple trees were collected at one and two years after last treatment. In fruits, TRR levels compared to the initial level was 92% after one year (134% in pulp and 32% in peel) and 49% after two years (68% in pulp). In both leaves and branches, TRR levels dropped to 30% and 22% after one and two years, respectively.
In one year post treatment samples, the majority of the radioactivity (82–98% TRR) was water soluble. Parent compound was not found in any part of the plants. The main metabolites found in this stage were TA, TAA and TLA, accounting for 4–65% TRR in apple, leaves and branches.
In summary, the nature of the residues was essentially the same in grape, tomato and apple. The biotransformation of penconazole results from the oxidation of penconazole at the 1, 2 and 3 positions of the alkyl chain and subsequent conjugation with sugar. Thus the monohydroxy metabolites (α-, β-, γ-monohydrxoy metabolite) were abundant in plant and acid hydrolysis or enzyme treatment was needed to release the aglycones. Among the metabolites, β-monohydroxy metabolite (CGA132465) was most predominant, accounting for 14–62% TRR (0.009–0.016 mg eq/kg). Metabolites in plants were also observed in rats.
Label-specific metabolism from the 14C-triazole treatments resulted from the cleavage of the triazole moiety (1,2,4-triazole) and subsequent conjugation with serine to form TA and by catabolism to form TAA and TLA. Total triazole-specific residues amounted to 20–29% TRR in the crops (0.006–0.029 mg eq/kg), comprising TA 10–23% TRR, TAA 0.8–2.3% TRR and TLA 2.3–12% TRR. After one year following direct application on apple tree, cleavage of the triazole moiety resulted in non-detection of parent compound and abundance of triazole-specific metabolites.
Based on data from tomato and apple, penconazole remains mainly as a surface residue on fruits. However, most of radioactivity in fruits was found as conjugated monohydroxy metabolites within the fruit.
Rotational crop studies
In the two confined rotational crop studies (triazole-label and phenyl-label study), a single application was made on bare soil at a rate of 0.24 kg ai/ha. Lettuce, radish, spring wheat and winter wheat were

Penconazole
1881
put into the treated soil at plant-back intervals (PBIs) of 32, 126 and 358 days (only 179-day PBI for winter wheat).
TRR levels were variable with respect to increases or decreases with longer PBIs in the triazole-label study, while TRR levels consistently declined in the phenyl-label study, except in wheat fodder and grain. TRR levels demonstrated significant amounts of radioactivity transferred into the succeeding crops. The highest TRR level from the triazole-label study was 0.072 mg eq/kg in lettuce (126-day PBI), 0.084 mg eq/kg in radish tops (358-day PBI) and roots (32-day PBI), 0.24 mg eq/kg in spring wheat whole top (126-day PBI) and 3.3 mg eq/kg in wheat grain (126-day PBI) and 1.4 mg eq/kg in wheat fodder (126-day PBI). TRR levels from the phenyl-label study were lower overall.
For food commodities, TA was found at 23–87% TRR (0.013–0.057 mg eq/kg) in lettuce and radish (tops and roots). TLA was present in lettuce (76% TRR, 0.055 mg eq/kg) and wheat grain (0.6%, 0.006 mg eq/kg). 1,2,4-Triazole and TAA were present only in wheat grain (2.7% TRR, 0.029 mg eq/kg and 33% TRR, 0.87 mg eq/kg, respectively).
In wheat whole tops and wheat fodder, 1,2,4-triazole, TA, TLA and TAA were present at 4.4–6.1% TRR (0.006–0.057 mg eq/kg), 8.8–52% TRR (0.12–0.12 mg eq/kg), 26–52% TRR (0.059–0.54 mg eq/kg) and 21–30% TRR (0.057–0.30 mg eq/kg), respectively.
Two field rotational crop studies were conducted in European locations (Northern and Southern). A single application was made to bare soil with lightly sown grass at a rate of 0.20 kg ai/ha. Barley, carrots, and lettuce were planted at nominal PBIs of 30, 60 and 365 days.
The results followed the residue patterns shown in the confined studies. No parent compound was detected in the follow-on crops except carrots (< 0.01 to 0.01 mg/kg in roots and tops). The same metabolites were identified and residue levels detected were similar, except carrot tops and roots where TLA residues were found at higher levels.
For food commodities, 1,2,4-triazole was not detected in lettuce, carrot roots and barley grain. In lettuce and carrot roots, TA, TAA and TLA were detected at 0.03–0.09 mg/kg, < 0.01 mg/kg and 0.04–0.10 mg/kg, respectively. In barley grain, TA, TAA and TLA were present at 0.63 mg/kg, 0.82 mg/kg and 0.03 mg/kg, respectively.
In carrot tops and barley (whole plant and straw), 1,2,4-triazole was not detected and TA, TAA and TLA were present at 0.02–0.32 mg/kg, < 0.01–0.39 mg/kg and 0.32–0.80 mg/kg, respectively.
Based on the findings, the Meeting concluded that residues of the parent compound and monohydroxy metabolites found in plant metabolism study are not expected in rotational crops following treatments according to the GAPs under consideration. Conversely, the triazole-specific metabolites may be detected in rotational crops.
Animal metabolism
Laboratory animals
The toxicological evaluation for penconazole was performed by the 2015 JMPR. Absorption by rats was rapid and extensive, and maximum blood concentrations were reached in 4–6 hours. Over a 6-day period, the highest tissue concentrations of radioactivity were observed in liver, lungs and kidneys. Radioactivity administered was excreted mainly in urine (62–85% of the dose). 14–39% of the dose was excreted in faeces.
Primary metabolic reactions involved cleavage of the triazole ring (estimated 15% of the dose), oxidation of the ω-position of the alkane chain to form the respective carboxylic acid (CGA177279, 30% of the dose), oxidation of the 3- or 4-position of the alkane chain to form monohydroxy and dihydroxy derivatives (2.5% of the dose) and oxidation of the triazole ring in the 3- or 5-position (0.7% of the dose). Furthermore, secondary metabolic reactions produced various metabolites, CGA177281, CGA177280, CGA179944, 3- or 4-keto derivatives produced from

Penconazole
1882
oxidation of 3,4-dihydroxy derivatives and conjugates of all alkanol derivatives with glucuronic acid. A small amount of parent compound was identified in faeces, representing unabsorbed dose.
Lactating goats
Two lactating goats were administered [14C-phenyl] penconazole at a rate of 5.1 mg/kg body weight corresponding to 112 ppm in the feed for 4 consecutive days by capsule dosing. Milk and excreta were collected daily at 0–78 hour intervals. Radioactive residues in milk reached plateau by 24 hr. The goats were sacrificed 6 hours after the last dose. The majority of the AR (64%) was excreted in urine. Excretion in faces accounted for 6.4% of the AR. Only 0.06% of the AR was eliminated in milk.
The mean residue concentration in milk was 0.11 mg eq/kg. The radioactive residues in edible tissues were 0.16 mg eq/kg in muscle, 0.74 mg eq/kg in fat, 5.3 mg eq/kg in kidney and 5.3 mg eq/kg in liver. Unchanged penconazole was found in milk and in all tissues, forming the most abundant component in liver (43% TRR, 2.3 mg/kg) and to a lesser extent in fat (16% TRR, 0.11 mg/kg), kidney (9.4% TRR, 0.50 mg/kg), muscle (4.6% TRR, 0.007 mg/kg) and milk (0.7% TRR, 0.0008 mg/kg).
In tissues and milk, CGA132465 (diastereomers, a and b), found in free or conjugated form (sulfate or glucuronide), was the predominant residue, and followed by the metabolite CGA177279. The N10 metabolite (glucuronic acid conjugate of penconazole) found only in kidney, liver and urine was minor, accounting for less than 8% TRR (0.42 mg eq/kg TRR) in kidney and liver each.
In muscle, fat, liver, kidney and milk, the metabolite found and the radioactivity level were as follows:
In muscle, CGA132465 (41%, 0.066 mg eq/kg), CGA132465 glucuronide (17% TRR, 0.027 mg eq/kg), CGA132465 sulfate (7% TRR, 0.01 mg eq/kg) and CGA177279 (24% TRR, 0.039 mg eq/kg).
In fat, CGA132465 (31% TRR, 0.23 mg eq/kg), CGA132465 glucuronide (13% TRR, 0.097 mg eq/kg), CGA132465 sulfate (ca. 4% TRR, 0.030 mg eq/kg) and CGA177279 (24% TRR, 0.18 mg eq/kg).
In liver, CGA132465 (25% TRR, 1.3 mg eq/kg), CGA132465 glucuronide (10% TRR, 0.53 mg eq/kg), CGA132465 sulfate (ca. 1.5% TRR, 0.082 mg eq/kg) and CGA177279 (4% TRR, 0.21 mg eq/kg).
In kidney, CGA132465 (11% TRR, 0.43 mg eq/kg), CGA132465 glucuronide (32% TRR, 1.7 mg eq/kg), CGA132465 sulfate (13% TRR, 0.67 mg eq/kg) and CGA177279 (23% TRR, 1.2 mg eq/kg).
In milk, CGA132465 (14% TRR, 0.015 mg eq/kg), CGA132465 glucuronide (not detectected), CGA132465 sulfate (69% TRR, 0.072 mg eq/kg) and CGA177279 (7.9% TRR, 0.008 mg eq/kg).
Laying hens
Two hens were fed [3, 5-14C-triazole] penconazole, and two with [14C-phenyl] penconazole for 16 consecutive days at 5 ppm in the feed. Twenty-four hours after the last dose, the hens were sacrificed and samples of the tissues were collected. 99% of administered radioactivity was excreted within 24 hours after the first dose in both labels. From the triazole and phenyl-label, radioactive residue levels were up to 0.025 mg eq/kg in tissues (liver, kidney, lean meat, skin/fat and peritoneal fat), 0.029 mg eq/kg in egg yolks and 0.010 mg eq/kg in egg whites, respectively. Regardless of label, radioactivity in eggs plateaued within 11 days (0.022 mg eq/kg). Identification of radioactive residues in edible tissues was not performed.
In summary, the principal residues in goat tissues and milk are the parent compound, CGA132465 (free and conjugated) and CGA177279. The main metabolic pathways of penconazole processed in goats are hydroxylation of penconazole to form CGA132465, conjugation of
Penconazole
1883
CGA132465 with glucuronic acid or sulfuric acid, and oxidation of penconazole to form the carboxylic acid CGA177279.
Environmental fate in soil
Soil photolysis
Penconazole was relatively stable with a half-life of 148 days. No photodegradation products greater than 5% of the AR were observed after 30 days.
Hydrolysis
Penconazole, CGA 179944 and 1,2,4-triazole were stable in aqueous solutions representative of environmental conditions ( pH 4, 5, 7 and 9 during one week at 50 °C or 30 days at 25 °C).
Aerobic degradation in soil
Penconazole was stable in aerobic sterile soil, accounting for 86% of the AR at day 84. Penconazole in soil was degraded under aerobic and unsterile conditions with a half-life of 178 days (61–238 days).
Degradation of penconazole proceeds principally via oxidation of the alkyl chain of the parent compound yielding CGA179944. Bridge cleavage in CGA179944 leads either directly or via the intermediate TAA to 1, 2, 4-triazole. Finally, the last metabolic steps generate carbon dioxide and bound residues. CGA179944 and 1,2,4-triazole were degraded with a half-life of 17 days (7.3–25. days) and 9.2 days (6.3–12 days), respectively.
Penconazole was moderately persistent in soil. However, following subsequent annual application, accumulation of penconazole in soil is not expected.
Methods of residue analysis
The basic method for analysis of penconazole in plants and animal matrices employs extraction with methanol (plant) or acetonitrile (animal), partitioning with hexane or dichloromethane, a clean-up step and GC-ECD/NPD analysis. This method achieves LOQ levels of 0.01–0.02 mg/kg in fruit plant matrices, 0.01 mg/kg in milk and 0.05 mg/kg in animal tissues. In addition, LC-MS/MS may be used, omitting a clean-up step and achieving a LOQ level of 0.01 mg/kg in various plant matrices (m/z 284→159 for quantification, m/z 284→70 for confirmation).
An analysis method for residues convertible to 2,4-dichlorobenzoic acid (DCBA; total residues) in plants and animal commodities is available. In grape and apple samples, mean recovery of penconazole was 63% (42–91%, RSD, < 20%). In addition, recoveries for the metabolites from grape were 62%, 56%, 30% for CGA132465, CGA127841 and CGA177280, respectively. In animal commodities, 39–83% of penconazole was recovered. This method is not considered as suitable due to low recoveries for penconazole and its metabolites.
The application of multi-residue methods was tested with DFG S19 for analysis of penconazole in plant and animal matrices. The method was shown suitable with a LOQ of 0.01 mg/kg in plant matrices and animal matrices (milk, meat, eggs and fat). For liver and kidney, LOQ is 0.1 mg/kg due to matrix interference.
Stability of residues in stored analytical samples
Penconazole was stable for at least 24 months in cucumber and apple (high water) and grape (high acid) samples stored at -18 °C. Other matrices were not tested. No storage stability data were provided for animal matrices.

Penconazole
1884
Definition of the residue
In plants (grape, tomato, apple), major residues were parent penconazole (7–16% TRR), free and conjugated CGA132465 (14–62% TRR), and triazole-specific metabolites (TA, TAA, TLA; in total, 20–25% TRR).
In determining residues suitable for monitoring compliance with MRLs in plant commodities, the Meeting noted that parent penconazole was found in all plants investigated and that suitable methods are available for its analysis. Analytical methods are not available for CGA132465 (free or conjugated), and the triazole-specific metabolites are not unique to penconazole; therefore neither of these compounds is suitable for compliance purposes. The Meeting concluded that the residue definition for compliance with MRLs for residues of penconazole in plant commodities is penconazole.
For evaluation of dietary risk assessment from residues in plants, the Meeting noted that all metabolites found in plants were also identified in rats. Dietary exposure to residues in plants is likely to be to penconazole, CGA132465 (free and conjugated), and the triazole-specific metabolites. The toxicity of CGA132465 is considered to be addressed by the toxicity of parent penconazole based on structural similarity. In the absence of data specific to CGA132465, it is assumed to be no more toxic than penconazole. The triazole-specific metabolites have toxicities known to be different from penconazole and are assessed separately. Therefore, the Meeting determined that the residue definition for assessing dietary intake from plants is the combined residues of penconazole and CGA132465 (free and conjugated), expressed as penconazole.
In goats, the principal residues were parent penconazole (0.7–43% TRR), CGA177279 (4–24% TRR), and free and conjugated CGA132465 (37–83% TRR). In laying hens, components of residues were not identified, as total radioactive residues were too low.
For monitoring compliance with MRLs in livestock commodities, residues of penconazole were observed in all commodities and there is a method available for analysis. Analytical methods are not available for either CGA177279 or CGA132465. Therefore, the Meeting concluded that the residue definition for compliance with MRLs for residues of penconazole in livestock commodities is penconazole.
In goat, penconazole concentrations in fat tissues were at least one order of magnitude higher than in muscle tissues. The log Pow of penconazole is 3.1. The Meeting decided that residues of penconazole are fat soluble.
For evaluation of dietary risk assessment from residues in livestock commodities, exposures are likely to be to penconazole and the metabolites CGA177279 and CGA132465 (free and conjugated). In the absence of metabolite-specific data, these two metabolites are assumed to be no more toxic than penconazole. The Meeting determined that the residue definition for assessing dietary intake from livestock commodities is the combined residues of penconazole, CGA177279, and CGA132465 (free and conjugated), expressed as penconazole.
Definition of the residue for compliance with MRL for plant and animal commodities: penconazole
Definition of the residue for estimation of dietary intake for plant commodities: sum of penconazole and 4-(2,4-dichloro-phenyl)-5-[1,2,4]triazol-1-yl-pentan-2-ol (free and conjugated), expressed as penconazole
Definition of the residue for estimation of dietary intake for animal commodities: sum of penconazole, 4-(2,4-dichloro-phenyl)-5-[1,2,4]triazol-1-yl-pentan-2-ol (free and conjugated) and 4-(2,4-dichloro-phenyl)-5-[1,2,4]triazol-1-yl-pentanoic acid, expressed as penconazole
The residue is fat-soluble.

Penconazole
1885
Results of supervised residue trials on crops
The Meeting received supervised residue trial data for pome fruits (apple, pear), stone fruits (peach, cherry), berries and other small fruits (blackcurrant, grape, strawberry), fruiting vegetables (melon, cucumber, tomato, sweet pepper) and globe artichoke. All residue trials were conducted in European countries.
The Meeting withdraws its previous recommendations for hops, dry, as the residue trial data were not provided.
Data depicting residues of free and conjugated CGA132465 were not provided for residue trials conducted with penconazole. In order to estimate residues for dietary intake from plants, the Meeting examined metabolism data from grapes, tomato, and apple. Comparison of residues in analytical fractions, containing CGA132465 (following hydrolysis) with residues of parent penconazole, resulted in conversion factors [(penconazole + CGA132465) ÷ penconazole] of 2.8 for mature grapes, 4.5 and 5.4 for tomato 7 DALA (approximating the registered GAP for tomato), and 2.2 for apples sampled 34 days after the last application. As a conservative estimate of residues for dietary risk assessment, the Meeting used the mean conversion factor, 5, obtained from tomato for all crops.
Pome fruits
Apple, pear
Penconazole is registered in Italy for apple and pear at rates of 3×0.060–0.068 kg ai/ha on a 7-day interval and with a 14 day-PHI. Independent residue trials from France, Germany and Spain matching the Italian GAP were submitted.
The residues in apple were (n = 14): < 0.02 (4), 0.01, 0.01, 0.02 (3), 0.030, 0.038, 0.048, 0.05, and 0.079 mg/kg.
The residues in pear were (n = 4): < 0.01, 0.01, 0.01 and 0.04 mg/kg.
As residue values of apple and pear were comparable and not different significantly, the values were combined for mutual support.
The combined data set for apple and pear was (n = 18): < 0.01, < 0.02 (4), 0.01 (4), 0.02 (3), 0.030, 0.038, 0.04, 0.048, 0.05 and 0.079 mg/kg.
The Meeting estimated a maximum residue level of 0.1 mg/kg, an STMR of 0.10 (0.02×5) mg/kg and an HR of 0.40 (0.079×5) mg/kg for apple and pear, noting that the GAP in Italy is not for the pome fruit crop group. Furthermore, the Meeting withdrew its previous recommendations for pome fruits.
Stone fruits
Peach
Penconazole is registered in Italy for peach at rates of 3×0.075 kg ai/ha on a 7-day interval and with a 14-day PHI. Twelve independent trials from Germany, France, Italy and Spain were submitted. One trial matched the GAP, having a residue of 0.03 mg/kg in whole peach (no flesh data).
Eleven trials were conducted at rates of 0.1 kg ai/ha, which is higher than the GAP. The residues in whole peach were (n = 11): < 0.02, 0.02, 0.025, 0.029, 0.03 (3), 0.033, 0.04, 0.06 and 0.08 mg/kg. Using the factor of 0.75, the scaled residues in whole peach were (n = 11): < 0.02, 0.015, 0.019, 0.022, 0.023 (3), 0.025, 0.03 , 0.045 and 0.06 mg/kg.
Combined residues in whole peach were (n = 12): < 0.02, 0.015, 0.019, 0.022, 0.023 (3), 0.025, 0.03 (2), 0.045 and 0.06 mg/kg.
The residues in flesh of peach from the trials conducted at the higher rate were (n = 10): 0.021, 0.027, 0.03, 0.036 (2), 0.04 (3), 0.08 and 0.09 mg/kg. Using the scaling factor of 0.75, the
Penconazole
1886
scaled residue values in peach flesh were (n = 10): 0.016, 0.020, 0.023, 0.027 (2), 0.03 (3), 0.06 and 0.068 mg/kg.
The Meeting estimated a maximum residue level of 0.08 mg/kg for peach subgroup and an STMR of 0.14 (0.028×5) mg/kg and an HR of 0.34 (0.068×5) mg/kg. The Meeting, therefore, withdraws its previous recommendations for peach.
Cherry
Penconazole is registered in Lithuania for use in cherries at rates of 2×0.050 kg ai/ha on a 10- or 14-day interval and with a 20-day PHI. Eight residue trials from France and Germany were conducted at 5- or 9-day intervals and at 14-day PHI. No trials matched the GAP.
Berries and other small fruits
Blackcurrants
Penconazole is registered in the UK for blackcurrants at rates of 4×0.05 kg ai/ha on a 10- or 14-day interval with a 28-day PHI. Five independent trials from the UK matching GAP were submitted.
The residues in blackcurrants were (n = 5): 0.11, 0.13, 0.30, 0.76 and 0.88 mg/kg.
The Meeting estimated a maximum residue level of 2 mg/kg, an STMR of 1.5 (0.30×5) mg/kg
and an HR of 4.4 (0.88×5) mg/kg for blackcurrants.
Grapes
Penconazole is registered in Spain for grape vines, trellised vines at rates of 3×0.040 kg ai/ha on a 7- or 14-day interval with a 14-day PHI. Fourteen independent trials from Italy, France, Hungary, the UK, Poland and Germany matching the Spanish GAP were submitted.
The residues in grapes were (n = 14): < 0.01, 0.01, 0.02 (3) 0.03 (4), 0.04, 0.05, 0.08, 0.17 and 0.32 mg/kg.
The Meeting estimated a maximum residue level of 0.4 mg/kg, an STMR of 0.15
(0.03×5) mg/kg and an HR of 1.6 (0.32x5) mg/kg for grapes. Furthermore, the Meeting withdrew its previous recommendation for grapes.
Strawberry
Penconazole is registered in Belgium for strawberry, protected and unprotected, at rates of 4×0.050 kg ai/ha on a 10-day interval with a 3-day PHI. Residue trials (protected and outdoor) from France, Germany, Italy, Spain and Greece matching Belgian GAP were submitted.
The residues in strawberry (outdoor) were (n = 17): 0.03, 0.03, 0.04, 0.043, 0.045, 0.06, 0.06, 0.1 (3), 0.11, 0.12, 0.14, 0.14, 0.17, 0.38 and 0.43 mg/kg
The residues in strawberry (protected) were (n = 8): 0.03, 0.04, 0.07, 0.07, 0.08, 0.087, 0.15 and 0.19 mg/kg.
As the median residues from outdoor and protected strawberry are within a 5-fold range and the residues are not significantly different by the Kruskal-Wallis test, the residues were combined for more robust estimation.
The combined data set for strawberry (outdoor and protected) were (n = 25): 0.03 (3) 0.04 (2), 0.043, 0.045, 0.06 (2), 0.07 (2), 0.08, 0.087, 0.1 (3) 0.11, 0.12, 0.14 (2), 0.15, 0.17, 0.19, 0.38 and 0.43 mg/kg.
The Meeting estimated a maximum residue level of 0.5 mg/kg, an STMR of 0.44
(0.087×5) mg/kg and an HR of 2.2 (0.43x5) mg/kg for strawberries. The Meeting withdrew its previous recommendations for strawberry.

Penconazole
1887
Fruiting vegetables, Cucurbits
Melons
Penconazole is registered in Germany for greenhouse melon at rates of 4×0.050 kg ai/ha on a 7-day interval and with a 3-day PHI. Nine residue trials from Germany, Italy and Spain according to this GAP were submitted. Two trials, in which melon seeds were removed and discarded, could not be used for estimation of a maximum residue level.
The residues in melons (greenhouse) were (n = 7): 0.01, 0.01, 0.02, 0.04, 0.04, 0.05 and 0.06 mg/kg.
The Meeting estimated a maximum residue level of 0.15 mg/kg, an STMR of 0.20 (0.04×5) mg/kg and an HR of 0.30 (0.06×5) mg/kg for melons, except watermelon. The Meeting withdraws its previous recommendations for melons.
Cucumber
Penconazole is registered in Germany for cucumber, protected and pâtisson squash, protected and outdoor, at rates of 4×0.050 kg ai/ha on a 7-day interval and with a 3-day PHI. Residue trials from France, Greece, Italy and Spain according to this GAP were submitted.
The residues in cucumber, protected, were (n = 8): < 0.01, < 0.02, < 0.02, 0.01, 0.01, 0.02, 0.03 and 0.03 mg/kg.
The Meeting estimated a maximum residue level of 0.06 mg/kg, an STMR of 0.05 (0.01× 5) mg/kg and an HR of 0.15 (0.03×5) mg/kg for cucumber, withdrawing its previous recommendations. Further the Meeting extrapolated the residue values for cucumber to summer squash and gherkin based on the same German GAP, and estimated maximum residue levels of 0.06 mg/kg, STMRs of 0.05 mg/kg and an HRs of 0.15 mg/kg for summer squash and gherkin.
Fruiting vegetables, other than Cucurbits
Tomato
Penconazole is registered in Germany for tomato and eggplant, greenhouse, at rates of 4×0.050 kg ai/ha on a 7-day interval and with a 3-day PHI. Residue trials from Germany, France, Netherlands, Spain and Greece according to this GAP were submitted.
The residues in tomato and cherry tomato, greenhouse, were (n = 14): < 0.01 (3), < 0.02 (3), 0.02 (4), 0.03, 0.03, 0.04 and 0.07 mg/kg.
The Meeting estimated a maximum residue level of 0.09 mg/kg, an STMR of 0.10 (0.02×5) mg/kg and an HR of 0.35 (0.07×5) mg/kg for tomato, withdrawing its previous recommendations. The Meeting also estimated a maximum residue level of 0.09 mg/kg, an STMR of 0.10 mg/kg and an HR of 0.35 mg/kg for egg plant, extrapolating tomato residues to egg plant under the same German GAP.
Pepper, Sweet
Penconazole is registered in Germany for sweet pepper, greenhouse, at rates of 4×0.050 kg ai/ha, on a 7-day interval with a 3-day PHI. Residue trials from France, Netherlands, Spain and Italy according to this GAP were submitted.
The residues in sweet pepper, greenhouse, were (n = 8): < 0.02, < 0.02, 0.02, 0.02, 0.036, 0.04, 0.041 and 0.12 mg/kg.
The Meeting estimated a maximum residue level of 0.2 mg/kg, an STMR of 0.14 (0.028 × 5) mg/kg and an HR of 0.60 (0.12×5) mg/kg for sweet pepper.
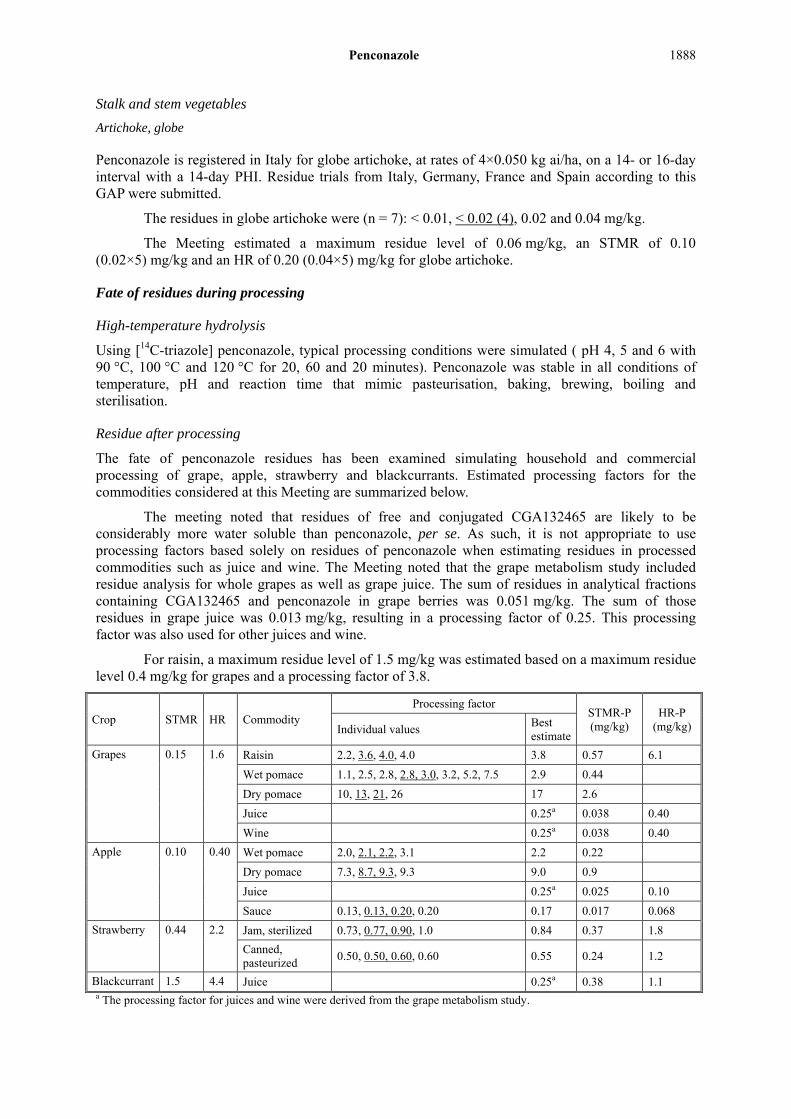
Penconazole
1888
Stalk and stem vegetables
Artichoke, globe
Penconazole is registered in Italy for globe artichoke, at rates of 4×0.050 kg ai/ha, on a 14- or 16-day interval with a 14-day PHI. Residue trials from Italy, Germany, France and Spain according to this GAP were submitted.
The residues in globe artichoke were (n = 7): < 0.01, < 0.02 (4), 0.02 and 0.04 mg/kg.
The Meeting estimated a maximum residue level of 0.06 mg/kg, an STMR of 0.10 (0.02×5) mg/kg and an HR of 0.20 (0.04×5) mg/kg for globe artichoke.
Fate of residues during processing
High-temperature hydrolysis
Using [14C-triazole] penconazole, typical processing conditions were simulated ( pH 4, 5 and 6 with 90 °C, 100 °C and 120 °C for 20, 60 and 20 minutes). Penconazole was stable in all conditions of temperature, pH and reaction time that mimic pasteurisation, baking, brewing, boiling and sterilisation.
Residue after processing
The fate of penconazole residues has been examined simulating household and commercial processing of grape, apple, strawberry and blackcurrants. Estimated processing factors for the commodities considered at this Meeting are summarized below.
The meeting noted that residues of free and conjugated CGA132465 are likely to be considerably more water soluble than penconazole, per se. As such, it is not appropriate to use processing factors based solely on residues of penconazole when estimating residues in processed commodities such as juice and wine. The Meeting noted that the grape metabolism study included residue analysis for whole grapes as well as grape juice. The sum of residues in analytical fractions containing CGA132465 and penconazole in grape berries was 0.051 mg/kg. The sum of those residues in grape juice was 0.013 mg/kg, resulting in a processing factor of 0.25. This processing factor was also used for other juices and wine.
For raisin, a maximum residue level of 1.5 mg/kg was estimated based on a maximum residue level 0.4 mg/kg for grapes and a processing factor of 3.8.
Crop STMR HR Commodity Processing factor
STMR-P (mg/kg)
HR-P (mg/kg) Individual values
Best estimate
Grapes 0.15 1.6 Raisin 2.2, 3.6, 4.0, 4.0 3.8 0.57 6.1
Wet pomace 1.1, 2.5, 2.8, 2.8, 3.0, 3.2, 5.2, 7.5 2.9 0.44
Dry pomace 10, 13, 21, 26 17 2.6
Juice 0.25a 0.038 0.40
Wine 0.25a 0.038 0.40
Apple 0.10 0.40 Wet pomace 2.0, 2.1, 2.2, 3.1 2.2 0.22
Dry pomace 7.3, 8.7, 9.3, 9.3 9.0 0.9
Juice 0.25a 0.025 0.10
Sauce 0.13, 0.13, 0.20, 0.20 0.17 0.017 0.068
Strawberry 0.44 2.2 Jam, sterilized 0.73, 0.77, 0.90, 1.0 0.84 0.37 1.8
Canned, pasteurized
0.50, 0.50, 0.60, 0.60 0.55 0.24 1.2
Blackcurrant 1.5 4.4 Juice 0.25a 0.38 1.1 a The processing factor for juices and wine were derived from the grape metabolism study.
Penconazole
1889
Residues in animal commodities
Estimation of dietary burden
The maximum and mean dietary burdens were calculated using the highest residues or median residues of penconazole (combined residues of parent and CGA132465) estimated at the current Meeting on the basis of the OECD Animal Feeding Table. Apple and grape pomace data were used for estimation of dietary burdens. The calculated maximum and mean animal burdens are summarized below. For broiler poultry and laying poultry, no feed items were applicable in this evaluation.
Summary of livestock dietary burdens (ppm of dry matter diet) US-Canada EU Australia Japan
max mean max mean max mean max mean
Beef cattle 0.11 0.11 0.11 0.11 - -
Dairy cattle 0.055 0.055 0.055 0.055 0.099 0.099 - -
Farm animal feeding studies
Lactating cows were fed diets containing 10, 50 and 100 ppm penconazole, for up to 28 days. Parent penconazole was analysed for milk and tissue samples. Parent compound was found at only the highest does only in liver, 0.26 mg/kg (milk, < 0.01 mg/kg; other tissues, < 0.05 mg/kg). All samples were also analysed for residues convertible to DCBN (total residues; including metabolites CGA132465 and CGA177279), however, the analytical method was not considered sufficiently reliable.
Laying hens were fed diets containing 1.25, 6.25 and 12.5 ppm penconazole, for up to 29 days. Only total residues (as DCBN) were analysed. No total residues (< 0.05 mg/kg) were found in any samples at any of the feeding levels, except liver sample at the highest dose, determined at 0.09 mg/kg.
Residues in animal commodities
In the feeding studies, no residues of total residues were found in milk and tissues, except liver. For liver, when a dose level of 100 ppm (0.26 mg/kg at the dose) was compared with the dietary burden, 0.11 ppm, no significant residue is expected. The Meeting estimated a maximum residue level of 0.01* mg/kg for milk and 0.05* mg/kg for meat, fat, liver and kidney.
From a goat metabolism study (112 ppm), sum of the residues of parent, CGA132465 and CGA177279 were muscle 0.15 mg eq/kg (92% TRR), fat 0.65 mg eq/kg (88% TRR), liver 4.4 mg eq/kg (83% TRR), kidney 4.5 mg eq/kg (88% TRR) and milk 0.096 mg eq/kg (92% TRR). Comparing with 1018-times lower dietary burden, residue levels would be expected < 0.001 mg/kg in muscle, milk and fat, and 0.004 mg/kg in liver and kidney. The Meeting estimated 0 mg/kg for STMR and HR for muscle, fat and milk; 0.004 mg/kg for STMR and HR for liver and kidney.
For poultry, no relevant feed item was identified. The Meeting estimated a maximum residue level of 0.05* mg/kg, an STMR of 0 mg/kg and an HR of 0 mg/kg for poultry and eggs.
RECOMMENDATIONS
On the basis of the data from supervised trials the Meeting concluded that the residue levels listed below are appropriate for establishing maximum residue limits and for IEDI and IESTI assessment.
Definition of the residue for compliance with MRL for plant and animal commodities: penconazole
Penconazole
1890
Definition of the residue for estimation of dietary intake for plant commodities: sum of penconazole and 4-(2,4-dichloro-phenyl)-5-[1,2,4]triazol-1-yl-pentan-2-ol (free and conjugated), expressed as penconazole
Definition of the residue for estimation of dietary intake for animal commodities: sum of penconazole, 4-(2,4-dichloro-phenyl)-5-[1,2,4]triazol-1-yl-pentan-2-ol (free and conjugated) and 4-(2,4-dichloro-phenyl)-5-[1,2,4]triazol-1-yl-pentanoic acid , expressed as penconazole
The residue is fat-soluble.
Commodity Recommended MRL (mg/kg)
STMR or STMR-P (mg /kg)
HR, HR-P, highest residue (mg /kg)
CCN Name New Previous MM 0812 Cattle meat W 0.05* ML 0812 Cattle milk W 0.01* MO 0812 Cattle, Edible offal of W 0.05* PE 0840 Chicken eggs W 0.05* PM 0840 Chicken meat W 0.05* MM 0095 Meat (from mammals other than marine
mammals) 0.05* - 0 0
MF 0100 Mammalian fats (except milk fats) 0.05* - 0 0 MO 0105 Edible offal (mammalian) 0.05* - 0.004 0.004 ML 0106 Milks 0.01* - 0 0 PM 0110 Poultry meat 0.05* - 0 0 PO 0111 Poultry, Edible offal of 0.05* - 0 0 PE 0112 Eggs 0.05* - 0 0 VC 0424 Cucumber 0.06 0.1 0.05 0.15 VC 0431 Squash, summer 0.06 - 0.05 0.15 VC 0425 Gherkin 0.06 - 0.05 0.15 DF 0269 Dried grape (=currants, raisins and sultanas) 1.5 0.5 0.57 6.1 FB 0269 Grapes 0.4 0.2 0.15 1.6 VC 0046 Melons, except watermelon 0.15 0.1 0.20 0.30 FS 0245 Nectarine W 0.1 FS 2001 Peaches 0.08 0.1 0.14 0.34 FS 0247 Peach W 0.1 FP 0009 Pome fruits W 0.2 FP 0226 Apple 0.1 - 0.10 0.40 FP 0230 Pear 0.1 - 0.10 0.40 FB 0278 Blackcurrant 2 - 1.5 4.4 VO 0445 Pepper, Sweet 0.2 - 0.14 0.60 VS 0620 Artichoke, globe 0.06 - 0.10 0.20 FB 0275 Strawberry 0.5 0.1 0.44 2.2 VO 0448 Tomato 0.09 0.2 0.10 0.35 VO 0440 Egg plant 0.09 - 0.10 0.35 DH 1100 Hops, dry W 0.5 Grape juice 0.038 0.40 Wine 0.038 0.40 Apple juice 0.025 0.10 Apple sauce 0.017 0.068 Strawberry Jam, sterilized 0.37 1.8 Strawberry, canned pasteurized 0.24 1.2 Blackcurrant juice 0.38 1.1

Penconazole
1891
DIETARY RISK ASSESSMENT
Long-term intake
The International Estimated Daily Intakes (IEDIs) of penconazole were calculated for the 17 GEMS/Food cluster diets using STMRs/STMR-Ps estimated by the current and previous Meetings. The results are shown in Annex 3 of the 2016 JMPR Report.
The ADI is 0–0.03 mg/kg bw and the calculated IEDIs were 0–3% of the maximum ADI. The Meeting concluded that the long-term exposure to residues of penconazole resulting from the uses considered by the JMPR is unlikely to present a public health concern.
Short-term intake
The International Estimated Short Term Intakes (IESTIs) of penconazole were calculated for the food commodities using HRs and STMR/STMR-Ps estimated by the current Meeting. The results are shown in Annex 4 to the 2016 JMPR Report.
The ARfD is 0.8 mg/kg bw and the calculated IESTIs were 0–6% of the ARfD for general population and 0–10% of the ARfD for children. The Meeting concluded that the short-term intake of penconazole resulting from uses that have been estimated by the 2016 JMPR is unlikely to present a public health concern when penconazole is used in ways that were considered by the Meeting.
REFERENCES
Code Author(s) Year Title, Institute, Report reference
10-89
Abildt, U. 1989 Degradation of 14C-phenyl labelled CGA 71818 in aerobic soil at 15°C, Novartis Crop Protection AG, Basel, Switzerland, Not GLP, not published, Syngenta File No CGA71818/0106
09-89
Abildt, U. 1989 Degradation of 14C-triazole labelled CGA 71818 in aerobic soil at 15°C, Novartis Crop Protection AG, Basel, Switzerland, Not GLP, not published, Syngenta File No CGA71818/0105
08-89 Abildt, U. 1989 Degradation of 14C-phenyl labelled CGA 71818 in aerobic soil at 25°C, Novartis Crop Protection AG, Basel, Switzerland, Not GLP, not published, Syngenta File No CGA71818/0104
7-82 Blattmann, P. 1982 Metabolism of CGA 71818 in grape-vine, Novartis Crop Protection AG, Basel, Switzerland, Not GLP, not published, Syngenta File No CGA71818/0779
05-6043 Boxwell, C. 2007 Penconazole (CGA71818) - Residue Study on Apples and Processed Products in France (North), Syngenta Crop Protection AG, Basel, Switzerland, GLP, not published, Syngenta File No CGA71818/4761
RVA-2207-84 Bussmann, W. 1985 CGA 71818, TOPAS 100 EC, peaches, Italy, Novartis Crop Protection AG, Basel, Switzerland, Not GLP, not published, Syngenta File No CGA71818/0530
2208/84 Bussmann, W. 1985 Determination of Residues in Peaches After Application of TOPAS 100 EC, CIBA-GEIGY, Corp., Greensboro, North Carolina, not published
SPR-17-82
Büttler, B. 1982 CGA 71818, Deep freeze stability of residues in apples and grapes, Novartis Crop Protection AG, Basel, Switzerland, Not GLP, not published, Syngenta File No CGA71818/0137
36140 Cairns, S. 2015 Penconazole - Residue Study on Grapes in North France, Hungary, Poland, United Kingdom and Germany in 2014, Syngenta, GLP, not published, Syngenta File No A20035A_10175
ABR-85054 Cheung, M.W. 1985 Residues of CGA-71818 and Metabolites in Eggs and Tissues of Laying Hens Receiving CGA-71818 in Their Diet, CIBA-GEIGY Corp., Greensboro, North Carolina, not published
ABR-85053 Cheung, M.W. and Williams, L.E.
1985 Residues of CGA 71818 and metabolites in tissues and milk of dairy cows receiving CGA 71818 in the diet, Novartis Crop Protection AG, Basel, Switzerland, Not GLP,
Penconazole
1892
Code Author(s) Year Title, Institute, Report reference
not published, Syngenta File No CGA71818/0597
ABR-85051 Clayton, F. B. and Beidler ,W.T
1985 Stability of residues of CGA 71818 under freezer storage conditions, Novartis Crop Protection AG, Basel, Switzerland, Not GLP, not published, Syngenta File No CGA71818/0844
RJ3330B Crawford, N. 2002 [Triazole-(U)14 C]GA 71818 (Penconazole) Aqueous Hydrolysis at 90, 100 & 120°C, Syngenta Crop Protection AG, Basel, Switzerland, GLP, not published, Syngenta File No CGA71818/4411
75153 Das, R. 1999 Melting point / melting range of CGA 71818, Novartis Crop Protection AG, Basel, Switzerland, GLP, not published, Syngenta File No CGA71818/4305
80813 Das, R. 2000 General physico-chemical properties of CGA 71818 tech., Novartis Crop Protection AG, Basel, Switzerland, GLP, not published, Syngenta File No CGA71818/4335
75156 Das, R. 2000 General physico-chemical properties of CGA 71818, Novartis Crop Protection AG, Basel, Switzerland, GLP, not published, Syngenta File No CGA71818/4336
75154 Das, R. 2000 Boiling point / boiling range of CGA 71818, Novartis Crop Protection AG, Basel, Switzerland, GLP, not published, Syngenta File No CGA71818/4337
REM 107.08
Formica, G. 1993 Determination of residues by gas liquid chromatography, soil, plant material, fruit, Novartis Crop Protection AG, Basel, Switzerland, GLP, not published, Syngenta File No CGA71818/1055
2075/93 Formica, G. 1994 Determination of Residues of CGA 71818, Parent Compound and of Total Residues as Dichlorobenzoic acid (DCBA, CGA177291) in Grapes and Processed Commodities-Field Trial, not published, Syngenta File No CGA71818/1103
2075/93B Formica, G. 1994 Determination of Residues of CGA 71818, Parent Compound and of Total Residues as Dichlorobenzoic acid (DCBA, CGA177291) in Grapes and Processed Commodities-Field Trial, not published, Syngenta File No CGA71818/1104
2073/93 Formica, G. 1994 Determination of Residues of CGA 71818 and of Total Residues as CGA 177291 [2,4-Dichlorobenzoic acid (DCBA)] in Grapes and Processed Commodities-Field Trial, not published, Syngenta File No CGA71818/1090
2079/93B Formica, G. 1995 Determination of Residues of CGA 71818, Parent Compound and of Total Residues as Dichlorobenzoic acid (DCBA, CGA177291) in Grapes and Processed Commodities-Field Trial, not published, Syngenta File No CGA71818/1115
2079/93 Formica, G. 1995 Determination of Residues of CGA 71818, Parent Compound and of Total Residues as Dichlorobenzoic acid (DCBA, CGA177291) in Grapes and Processed Commodities-Field Trial, not published, Syngenta File No CGA71818/1116
2076/93 Formica, G. 1995 Determination of Residues of CGA 71818, Parent Compound and of Total Residues as Dichlorobenzoic acid (DCBA, CGA177291) in Grapes and Processed Commodities-Field Trial, not published, Syngenta File No CGA71818/1111
2076/93B Formica, G. 1995 Determination of Residues of CGA 71818, Parent Compound and of Total Residues as Dichlorobenzoic acid (DCBA, CGA177291) in Grapes and Processed Commodities-Field Trial, not published, Syngenta File No CGA71818/1112
PP-99/48P.DES Füldner, H.H. 1999 Report on density of solids, Novartis Crop Protection AG, Basel, Switzerland, GLP, not published, Syngenta File No CGA71818/4321
S11-00559 Gemrot, F. 2012 Difenoconazole and Penconazole - Residue Study on Apple in Germany in 2011, Syngenta, GLP, not published, Syngenta File No A7402T_10170
S11-00560 Gemrot, F. 2012 Difenoconazole and Penconazole - Residue Study on Apple in Southern France in 2011, Syngenta, GLP, not published, Syngenta File No A7402T_10169
REM 107.10 Gill, J. P. 2004 Residue Method for the Determination on Residues of Penconazole (cGA71818) in Crop Samples, Final Determination by LC-LC-MS/MS. Syngenta Method REM 107.10
RJ3494B Gill, P. 2004 Penconazole (CGA 71818) : Validation of Residue Analytical Method REM 107.10 for the Determination of Residues in Crops, Syngenta Crop Protection AG, Basel, Switzerland, GLP, not published, Syngenta File No CGA71818/4520
98AG01 Glänzel, A. 1999 Metabolism and rate of degradation of 14C-Triazole labelled CGA 71818 under aerobic, anaerobic and aerobic/anaerobic laboratory conditions in one soil at 20°C, Novartis Crop Protection AG, Basel, Switzerland, GLP, not published, Syngenta File No CGA71818/1392
CSTR 016:04 Grabe, D. 1995 CGA 71818, Topas 100 EC, Blackcurrant (fruit and juice), United Kingdom, Novartis Crop Protection AG, Basel, Switzerland, GLP, not published, Syngenta

Penconazole
1893
Code Author(s) Year Title, Institute, Report reference
File No CGA71818/1237
CSTR/016:2 Griggs, N. 1990 CGA 71818, blackcurrant, Great Britain, Novartis Crop Protection AG, Basel, Switzerland, Not GLP, not published, Syngenta File No CGA71818/0808
AG-87/18P Jäkel, K. 1987 Report on dissociation constant in water, Novartis Crop Protection AG, Basel, Switzerland, GLP, not published. Syngenta File No CGA71818/0986
AG-87-18P Jäkel, K. 1987 Report on partition coefficient, Novartis Crop Protection AG, Basel, Switzerland, GLP, not published, Syngenta File No CGA71818/0984
AG-87-18P Jäkel, K. 1987 Report on water solubility, Novartis Crop Protection AG, Basel, Switzerland, GLP, not published, Syngenta File No CGA71818/0983
S09-00461 Jones, G. 2012 Difenoconazole, Paclobutrazol, Cyproconazole, Penconazole and Propiconazole-Residue Study on Rotational Crops in Northern France and the United Kinddom in 2009, Syngenta Ltd.
ABR-85040 Kahrs, R.A. 1987 Specificity of analytical method AG-445 for the determination of the total residues of CGA 71818 in grapes and apples, Novartis Crop Protection AG, Basel, Switzerland, Not GLP, not published, Syngenta File No CGA71818/0155
41-82 Keller, A. 1982 Degradation of CGA 71818 in aerobic, aerobic/anaerobic and sterile/aerobic soil, Novartis Crop Protection AG, Basel, Switzerland, Not GLP, not published, Syngenta File No CGA71818/0101
80814 Kettner, R. 2000 Solubility in organic solvents of CGA 71818, Novartis Crop Protection AG, Basel, Switzerland, GLP, not published, Syngenta File No CGA71818/4338
SYN-0717; T010996-06-REG, T010996-06
Klimmek, S 2008 PENCONAZOLE (CGA71818): RESIDUE STUDY ON SWEET AND SOUR CHERRIES IN NORTHERN FRANCE AND GERMANY IN 2007, Residue study on sweet and sour cherries in Northern France and Germany in 2007, Syngenta, GLP, not published, Syngenta File No A6209G_10000
SYN-0507, T009906-04-REG
Klimmek, S. 2006 Penconazole (CGA71818) - Residue study on Peach in France (North), Syngenta Crop Protection AG, Basel, Switzerland, GLP, not published, Syngenta File No CGA71818/4740
SYN-0605, T000652-06-REG
Klimmek, S. 2007 Penconazole (CGA71818) - Residue study on Cherries in Northern France in 2006, Syngenta Crop Protection AG, Basel, Switzerland, GLP, not published, Syngenta File No CGA71818/4787
246903 Knoch, E. 1993 Degradation of 14C-labelled penconazole (CGA 71818) in one soil incubated under various experimental conditions, Novartis Crop Protection AG, Basel, Switzerland, GLP, not published, Syngenta File No CGA71818/1058
E97-02 Lutringer, C. 1999 the Metabolism of [Phenyl-(U)-14C] CGA 71818 after Multiple Oral Administration to Lactating Goats, Novartis Crop Protection AG, Basel, Switzerland, GLP, not published, Syngenta File No CGA71818/4312
ABR-85015 Madrid, S.O., Edmonds, M.L., Cargile, N.L., Cassidy, J.E.
1985 Metabolism of Phenyl-14C-CGA-71818 and Triazole-14C-CGA-71818 by Lactating Goats Dosed at 5 ppm for Ten Consecutive Days, CIBA-GEIGY Corp., Greensboro, North Carolina, not published
ABR-85028 Madrid, S.O., Edmonds, M.L., Cargile, N.L., Cassidy, J.E.
1985 Metabolism of Phenyl-14C-CGA-71818 and Triazole-14C-CGA-71818 by Laying Hens Dosed at 5 ppm for Sixteen Consecutive Days, CIBA-GEIGY Corp., Greensboro, North Carolina, not published
ABR-85016 Madrid, S.O., Harper, J.C. and Cassidy, J.E.
1985 Metabolism of CGA 71818 in grapes sprayed with triazole and phenyl-14C-CGA 71818, Novartis Crop Protection AG, Basel, Switzerland, Not GLP, not published, Syngenta File No CGA71818/0781
826683 Mamouni, A 2002 14C-CGA179944: Hydrolysis at three different pH values, Syngenta Crop Protection AG, Basel, Switzerland, GLP, not published, Syngenta File No CGA179944/0014
616860 Mamouni, A. 1998 14C-CGA 71818: degradation and metabolism in aquatic systems, Novartis Crop Protection AG, Basel, Switzerland, GLP, not published, Syngenta File No CGA71818/1358
798660 Mamouni, A. 2003 [14C]-CGA71019: Anaerobic soil degradation, Syngenta Crop Protection AG, Basel, Switzerland, GLP, not published, Syngenta File No CGA71019/0062
ABR-85059 Manuli, P.J., Beidler, W.T. and Ross, J.A.
1985 Validation of anal. method AG-445 for the determination of the total residues of CGA 71818 in grapes and apples as 2,4-dichlorobenzoic acid, Novartis Crop Protection AG, Basel, Switzerland, Not GLP, not published, Syngenta File No

Penconazole
1894
Code Author(s) Year Title, Institute, Report reference
CGA71818/0162
No code Michalski, B., Resseler, H., Aden, K., Dechet, F., Dust, M., Fischer, R., Gottesbiiren, B., Holdt, G., Huber, A, Jene, B., Koch, W., Reinken, G and Stein, B,
2004 Recommendations for Simulation Calculations of Predicted Environmental Concentrations in Groundwater (PECgw) in the National Authorisation Procedure. Nachrichtenbl. Deut. Pflanzenschutzd., 59 (9), S. 193-201
12/85 Nicollier, G. 1985 Further characterisation of the degradation products of CGA71818 in Grape-Vine, Ciba-Geigy Limited, Basel, Switzerland, Not GLP, not published, Syngenta File No CGA71818/0779
25-84
Nicollier, G. 1985 Metabolism of CGA 71818 in field apple tree, Novartis Crop Protection AG, Basel, Switzerland, Not GLP, not published, Syngenta File No CGA71818/0775
11-85 Nicollier, G. 1985 Quantification and characterization of residues in field treated apple-tree one and two years after treatment with CGA 71818, Novartis Crop Protection AG, Basel, Switzerland, Not GLP, not published, Syngenta File No CGA71818/0777
10-85
Nicollier, G. 1985 Further characterization of degradation products of CGA 71818 n field apple-tree, Novartis Crop Protection AG, Basel, Switzerland, Not GLP, not published Syngenta File No CGA71818/0776
22-83
Nicollier, G. and Donzel, B.
1983 Dissipation and degradation of CGA 71818 in field apple tree, Novartis Crop Protection AG, Basel, Switzerland, Not GLP, not published Syngenta File No CGA71818/0774
NOV-0003V Pelz, S. 2001 Independent Laboratory Validation of the DFG Method S19 (extended Revision) for the Determination of the Residues of Penconazole (CGA 71818) in/on Apples and Sunflower seed, Syngenta Crop Protection AG, Basel, Switzerland, GLP, not published, Syngenta File No CGA71818/4367
0111901 Pointurier, R. 2002 Residue Study with Penconazole (CGA 71818) in or on Grapes in France (South), Syngenta Crop Protection AG, Basel, Switzerland, GLP, not published, Syngenta File No CGA71818/4385
0111701 Pointurier, R. 2002 Residue Study with Penconazole (CGA 71818) in or on Grapes in France (South), Syngenta Crop Protection AG, Basel, Switzerland, GLP, not published, Syngenta File No CGA71818/4386
04-6027 Richards, S. 2006 Penconazole (CGA71818): Residue study in or on outdoor strawberries and processed fractions in Spain, Syngenta Crop Protection AG, Basel, Switzerland, GLP, not published, Syngenta File No CGA71818/4724
AG-87/18P Rordorf, B. 1988 Report on vapor pressure curve, Novartis Crop Protection AG, Basel, Switzerland, Not GLP, not published, Syngenta File No CGA71818/0985
66247 Roth, M. 1998 Report on spectra (UV above 290 nm), Novartis Crop Protection AG, Basel, Switzerland, GLP, not published, Syngenta File No CGA71818/1360
66247 Roth, M. 1998 Report on Spectra, CGA71818, Unpublished, Report No, 66247, Syngenta File No CGA71818/1360
2101/01 Ryan, J. 2002 Residue Study with Penconazole (CGA 71818) in or on Grapes in Italy, Syngenta Crop Protection AG, Basel, Switzerland, GLP, not published, Syngenta File No CGA71818/4401
2100/01 Ryan, J. 2002 Residue Study with Penconazole (CGA 71818) in or on Grapes in Italy, Syngenta Crop Protection AG, Basel, Switzerland, GLP, not published, Syngenta File No CGA71818/4400
2069/01 Ryan, J. 2002 Residue Study with Penconazole (CGA 71818) in oe on Melons in Spain, Syngenta Crop Protection AG, Basel, Switzerland, GLP, not published, Syngenta File No CGA71818/4415
2068/01 Ryan, J. 2002 Residue Study with Penconazole (CGA 71818) in or on Melons in Spain, Syngenta Crop Protection AG, Basel, Switzerland, GLP, not published, Syngenta File No CGA71818/4413
2065/01 Ryan, J. 2002 Residue Study with Penconazole (CGA 71818) in or on Cucumbers in Spain, Syngenta Crop Protection AG, Basel, Switzerland, GLP, not published, Syngenta File No CGA71818/4405
Penconazole
1895
Code Author(s) Year Title, Institute, Report reference
2064/01 Ryan, J. 2002 Residue Study with Penconazole (CGA 71818) in or on Cucumbers in Italy, Syngenta Crop Protection AG, Basel, Switzerland, GLP, not published, Syngenta File No CGA71818/4402
2063/01 Ryan, J. 2002 Residue Study with Penconazole (CGA 71818) in or on Melons in Italy, Syngenta Crop Protection AG, Basel, Switzerland, GLP, not published, Syngenta File No CGA71818/4407
2062/01 Ryan, J. 2002 Residue Study with Penconazole (CGA 71818) in or on Melons in Italy, Syngenta Crop Protection AG, Basel, Switzerland, GLP, not published, Syngenta File No CGA71818/4406
2023/01 Ryan, J. 2002 Residue Study with Penconazole (CGA 71818) in or on Cucumbers in Greece, Syngenta Crop Protection AG, Basel, Switzerland, GLP, not published, Syngenta File No CGA71818/4408
SYN-0410 Rzepka S. 2005 Penconazole (CGA71818): Residue study in or on Peaches in Spain and France (South), Syngenta Crop Protection AG, Basel, Switzerland, GLP, not published, Syngenta File No CGA71818/4623
SYN-0337 Rzepka, S. 2005 Penconazole: Freezer Storage Stability Study of Penconazole in / on Cucumber and Grapes, Syngenta Crop Protection AG, Basel, Switzerland, GLP, not published, Syngenta File No CGA71818/4680
SYN-0338V
Rzepka, S. 2005 1st Amendment of Method, Penconazole (CGA 71818): Cross-Validation of Method REM 107.10 for the Determination of Residues of Penconazole (CGA 71818) in crop sample, final determination by LC-MS/MS, Dr. Specht & Partner GmbH, Hamburg, Germany
SYN-0403 Rzepka, S. 2005 Penconazole (CGA71818): Residue study in or on Apples in France (North), Syngenta Crop Protection AG, Basel, Switzerland, GLP, not published, Syngenta File No CGA71818/4628
SYN-0404 Rzepka, S. 2005 Penconazole (CGA71818): Residue study in or on Apples in France (South), Syngenta Crop Protection AG, Basel, Switzerland, GLP, not published, Syngenta File No CGA71818/4629
SYN-0405 Rzepka, S. 2005 Penconazole (CGA71818): Residue study in or on Apples in France (North) and Germany, Syngenta Crop Protection AG, Basel, Switzerland, GLP, not published, Syngenta File No CGA71818/4630
SYN-0406 Rzepka, S. 2005 Penconazole (CGA71818): Residue study in or on Apples in Spain, Syngenta Crop Protection AG, Basel, Switzerland, GLP, not published, Syngenta File No CGA71818/4631
SYN-0407 Rzepka, S. 2005 Penconazole (CGA71818): Residue study in or on Artichoke in Germany, Syngenta Crop Protection AG, Basel, Switzerland, GLP, not published, Syngenta File No CGA71818/4622
SYN-0408 Rzepka, S. 2005 Penconazole (CGA71818): Residue study in or on Protected Cherry Tomatoes in Spain, Syngenta Crop Protection AG, Basel, Switzerland, GLP, not published, Syngenta File No CGA71818/4632
SYN-0411 Rzepka, S. 2005 Penconazole (CGA71818): Residue study in or on Pear in France (North), Syngenta Crop Protection AG, Basel, Switzerland, GLP, not published, Syngenta File No CGA71818/4624
SYN-0412 Rzepka, S. 2005 Penconazole (CGA71818): Residue study in or on Pear in France (South) and Spain, Syngenta Crop Protection AG, Basel, Switzerland, GLP, not published, Syngenta File No CGA71818/4625
SYN-0413 Rzepka, S. 2005 Penconazole (CGA71818): Residue study in or on Pear in Germany, Syngenta Crop Protection AG, Basel, Switzerland, GLP, not published, Syngenta File No CGA71818/4626
SYN-0414 Rzepka, S. 2005 Penconazole (CGA71818): Residue study in or on Pear in France (South), Syngenta Crop Protection AG, Basel, Switzerland, GLP, not published, Syngenta File No CGA71818/4627
SYN-0416 Rzepka, S. 2005 Penconazole (CGA71818): Residue study on Outdoor Strawberries in Germany, Syngenta Crop Protection AG, Basel, Switzerland, GLP, not published, Syngenta File No CGA71818/4635
SYN-0417 Rzepka, S. 2005 Penconazole (CGA71818): Residue study in or on Protected and Outdoor Tomatoes in Greece, Syngenta Crop Protection AG, Basel, Switzerland, GLP, not published, Syngenta File No CGA71818/4633

Penconazole
1896
Code Author(s) Year Title, Institute, Report reference
SYN-0418 Rzepka, S. 2005 Penconazole (CGA71818): Residue study in or on Outdoor Strawberries in Germany and France (North), Syngenta Crop Protection AG, Basel, Switzerland, GLP, not published, Syngenta File No CGA71818/4637
SYN-0419 Rzepka, S. 2005 Penconazole (CGA71818): Residue study in or on Outdoor Strawberries in Spain and Greece, Syngenta Crop Protection AG, Basel, Switzerland, GLP, not published Syngenta File No CGA71818/4636
2101/98 Sack, St. 1999 Residue Study with Penconazole (CGA 71818) in or on Tomatoes in Spain, Novartis Crop Protection AG, Basel, Switzerland, GLP, not published, Syngenta File No CGA71818/4307
PP-95/3T.TSA
Schürch, H. 1995 Report on thermal stability and stability in air, Novartis Crop Protection AG, Basel, Switzerland, GLP, not published, Syngenta File No CGA71818/1138
BIOL-84034 Seim, V.W. and Brown G.E.
1985 Biological Report for CGA-71818 Residue Test in Lactating Cows, Novartis- Greensboro, Greensboro, USA, Not GLP, not published, Syngenta File No 3464
278336 Slangen, P.J. 2000 Degradation of 1,2,4-triazole in Three Soils under Aerobic Conditions, Novartis Crop Protection AG, Basel, Switzerland, GLP, not published, Syngenta File No CGA64250/4345
1284 Spare, W.C. 1987 Solution hydrolysis of CGA 71818, Novartis Crop Protection AG, Basel, Switzerland, GLP, not published, Syngenta File No CGA71818/0091
1282-A Spare, W.C. 1987 Soil Photolysis of CGA 71818 under natural sunlight, Novartis Crop Protection AG, Basel, Switzerland, GLP, not published, Syngenta File No CGA71818/0093
SYN-0310 Steinhauer ,S. 2004 Residue Study with Penconazole (CGA 71818) in Apple (Pyrus malus) in Spain, Syngenta Crop Protection AG, Basel, Switzerland, GLP, not published, Syngenta File No CGA71818/4589
SYN-0306 Steinhauer, S. 2004 Residue Study with Penconazole (CGA 71818) in Apple (Pyrus malus) in N-France, Syngenta Crop Protection AG, Basel, Switzerland, GLP, not published, Syngenta File No CGA71818/4596
SYN-0307 Steinhauer, S. 2004 Residue Study with Penconazole (CGA 71818) in Apple (Pyrus malus) in Germany, Syngenta Crop Protection AG, Basel, Switzerland, GLP, not published, Syngenta File No CGA71818/4595
SYN-0308 Steinhauer, S. 2004 Residue Study with Penconazole (CGA 71818) in Apple (Pyrus malus) in N-France, Syngenta Crop Protection AG, Basel, Switzerland, GLP, not published, Syngenta File No CGA71818/4593
SYN-0309 Steinhauer, S. 2004 Residue Study with Penconazole (CGA 71818) in Apple (Pyrus malus) in Germany, Syngenta Crop Protection AG, Basel, Switzerland, GLP, not published, Syngenta File No CGA71818/4594
SYN-0311 Steinhauer, S. 2004 Residue Study with Penconazole (CGA 71818) in Apple (Pyrus malus) in S-France, Syngenta Crop Protection AG, Basel, Switzerland, GLP, not published, Syngenta File No CGA71818/4590
SYN-0312 Steinhauer, S. 2004 Residue Study with Penconazole (CGA 71818) in Apple (Pyrus malus) in Spain, Syngenta Crop Protection AG, Basel, Switzerland, GLP, not published, Syngenta File No CGA71818/4591
SYN-0313 Steinhauer, S. 2004 Residue Study with Penconazole (CGA 71818) in Apple (Pyrus malus) in S-France, Syngenta Crop Protection AG, Basel, Switzerland, GLP, not published, Syngenta File No CGA71818/4592
SYN-0314 Steinhauer, S. 2004 Residue Study with Penconazole (CGA 71818) in Artichoke in Germany, Syngenta Crop Protection AG, Basel, Switzerland, GLP, not published, Syngenta File No CGA71818/4587
SYN-0315 Steinhauer, S. 2004 Residue Study with Penconazole (CGA 71818) in Artichoke in Germany, Syngenta Crop Protection AG, Basel, Switzerland, GLP, not published, Syngenta File No CGA71818/4588
SYN-0316 Steinhauer, S. 2004 Residue Study with Penconazole (CGA 71818) in Artichoke in Spain, Syngenta - Jealott’s Hill, Bracknell, United Kingdom, GLP, not published, Syngenta File No CGA71818/4608
SYN-0317 Steinhauer, S. 2004 Residue Study with Penconazole (CGA71818) in Artichoke in Southern France, Syngenta Crop Protection AG, Basel, Switzerland, GLP, not published, Syngenta File No CGA71818/4607
SYN-0318 Steinhauer, S. 2004 Residue Study with Penconazole (CGA 71818) in Peaches in Germany, Syngenta

Penconazole
1897
Code Author(s) Year Title, Institute, Report reference
Crop Protection AG, Basel, Switzerland, GLP, not published, Syngenta File No CGA71818/4586
SYN-0319 Steinhauer, S. 2004 Residue Study with Penconazole (CGA 71818) in Peach in Spain, Syngenta Crop Protection AG, Basel, Switzerland, GLP, not published, Syngenta File No CGA71818/4585
SYN-0320 Steinhauer, S. 2004 Residue Study with Penconazole (CGA71818) in Peaches in France (South), Syngenta Crop Protection AG, Basel, Switzerland, GLP, not published, Syngenta File No CGA71818/4615
SYN-0321 Steinhauer, S. 2004 Residue Study with Penconazole (CGA71818) in Peaches in Germany, Syngenta Crop Protection AG, Basel, Switzerland, GLP, not published, Syngenta File No CGA71818/4614
SYN-0322 Steinhauer, S. 2004 Residue Study with Penconazole (CGA71818) in Peaches in Spain, Syngenta Crop Protection AG, Basel, Switzerland, GLP, not published, Syngenta File No CGA71818/4616
SYN-0323 Steinhauer, S. 2004 Residue Study with Penconazole (CGA 71818) in Sweet Pepper (Capsicum annuum) in The Netherlands, Syngenta Crop Protection AG, Basel, Switzerland, GLP, not published, Syngenta File No CGA71818/4584
SYN-0324 Steinhauer, S. 2004 Residue Study with Penconazole (CGA 71818) in Sweet Pepper (Capsicum annuum) in Spain, Syngenta Crop Protection AG, Basel, Switzerland, GLP, Not published, Syngenta File No CGA71818/4603
SYN-0328 Steinhauer, S. 2004 Residue Study with Penconazole (CGA71818) in Strawberry in Germany, Syngenta Crop Protection AG, Basel, Switzerland, GLP, not published, Syngenta File No CGA71818/4613
SYN-0329 Steinhauer, S. 2004 Residue Study with Penconazole (CGA71818) in Strawberry in N-France, Syngenta Crop Protection AG, Basel, Switzerland, GLP, not published, Syngenta File No CGA71818/4612
SYN-0331 Steinhauer, S. 2004 Residue Study with Penconazole (CGA71818) in Strawberry in Spain, Syngenta Crop Protection AG, Basel, Switzerland, GLP, not published, Syngenta File No CGA71818/4611
SYN-0332 Steinhauer, S. 2004 Residue Study with Penconazole (CGA71818) in Strawberry in Germany, Syngenta Crop Protection AG, Basel, Switzerland, GLP, not published, Syngenta File No CGA71818/4610
SYN-0333 Steinhauer, S. 2004 Residue Study with Penconazole (CGA71818) in Strawberry in Spain, Syngenta Crop Protection AG, Basel, Switzerland, GLP, not published, Syngenta File No CGA71818/4609
SYN-0334 Steinhauer, S. 2004 Residue Study with Penconazole (CGA71818) in Tomato (Lycopersicon Esculentum Mill.) in the Netherlands, Syngenta Crop Protection AG, Basel, Switzerland, GLP, not published, Syngenta File No CGA71818/4606
SYN-0335 Steinhauer, S. 2004 Residue Study with Penconazole (CGA71818) in Tomato (Lycopersicon Esculentum Mill.) in Netherlands, Syngenta Crop Protection AG, Basel, Switzerland, GLP, not published, Syngenta File No CGA71818/4605
SYN-0336 Steinhauer, S. 2004 Residue Study with Penconazole (CGA71818) in tomato (lycopersicon esculentum mill.) in Spain, Syngenta Crop Protection AG, Basel, Switzerland, GLP, not published, Syngenta File No CGA71818/4604
SYN-0338V Steinhauer, S. 2004 Penconazole (CGA 71818): Cross-Validation of REM 107.08 method (short version for LC-MS/MS) for the Determination of Residues of Penconaozole in Apple, Artichoke, Sweet Pepper and Tomato, Dr. Specht & Partner GmbH, Hamburg, Germany
97JS25 Stingelin, J. 2001 Behaviour and Metabolism of [Triazole-(U)-14C] CGA 71818 in Field Grown Tomato Plants, Syngenta Crop Protection AG, Basel, Switzerland, GLP, not published, Syngenta File No CGA71818/4373
97JS26 Stingelin, J. 2001 Behaviour and Metabolism of [Phenyl-(U)-14C] CGA 71818 in Field Grown Tomato Plants, Syngenta Crop Protection AG, Basel, Switzerland, GLP, not published, Syngenta File No CGA71818/4374
CSTR-016-1 Tawiah, N.Y.B. 1989 CGA 71818, 100 EC, black currant, Gr. Britain, Novartis Crop Protection AG, Basel, Switzerland, Not GLP, not published, Syngenta File No CGA71818/0284
841774 van der Gaauw, A. 2002 Hydrolysis of 14C-phenyl Labelled Penconazole (CGA71818) at Four Different pH Values, Syngenta Crop Protection AG, Basel, Switzerland, GLP, not published,

Penconazole
1898
Code Author(s) Year Title, Institute, Report reference
Syngenta File No CGA71818/4397
841774 van der Gaauw, A. 2002 Hydrolysis of 14C-phenyl labelled penconazole (CGA 71818) at four different pH values. RCC Ltd., ltingen, Switzerland. Unpublished, Report No. 841774, Syngenta File No CGA 71818/4397.
826536 Völkl, S 2002 14C Triazole Labelled CGA179944: Degradation in Three Soils Incubated under Aerobic Conditions, Syngenta Crop Protection AG, Basel, Switzerland, GLP, not published, Syngenta File No CGA179944/0013
822778 Völkl, S 2002 14C-Triazole Labelled Penconazole (CGA71818): Degradation and metabolism in two Soils incubated under Aerobic Conditions, Syngenta Crop Protection AG, Basel, Switzerland, GLP, not published, Syngenta File No CGA71818/4403
97JS27 Völlmin, S. 2000 Outdoor confined Accumulation Study on Rotational Crops after Bareground Application of [Triazole-(U)-14C] CGA 71818, Syngenta Crop Protection AG, Basel, Switzerland, GLP, not published, Syngenta File No CGA71818/4369
97JS28 Völlmin, S. 2001 Outdoor confined Accumulation Study on Rotational Crops after Bareground Application of [Phenyl-(U)-14C] CGA 71818, Syngenta Crop Protection AG, Basel, Switzerland, GLP, not published, Syngenta File No CGA71818/4371
NOV-0001V(Az. G00-0089)
Weber, H. 2000 Validation of DFG method S19 (extended revision) for the determination of the residues of Penconazole (CGA 71818) in/on plant material, Novartis Crop Protection AG, Basel, Switzerland, GLP, not published, Syngenta File No CGA71818/4366
Nov-0002V Weber, H. 2001 Penconazole: Validation of the DFG Method S 19 (extended Revision) for the Determination of Residues of Penconazole (CGA 71818) in Foodstuffs of Animal Origin, Syngenta Crop Protection AG, Basel, Switzerland, GLP, not published, Syngenta File No CGA71818/4370
NOV-0004V Weeren, R.D. and Pelz, S.
2001 Penconazole: Independent Laboratory Validation of the DFG Method S 19 (extended Version) for the Determination of Residues of Penconazole (CGA 71818) in Milk, Meat and Egg, Syngenta Crop Protection AG, Basel, Switzerland, GLP, not published, Syngenta File No CGA71818/4372
S09-00462 White, T. 2013 Difenoconazole, Paclobutrazol, Cyproconazole, Penconazole and Propiconazole-Residue Study on Rotational Crops in Southern France and Spain in 2009-2012, Syngenta Ltd.
02-2023 Wolf, S 2003 Residue Study with Penconazole (CGA 71818) in or on Melons in Spain, Syngenta Crop Protection AG, Basel, Switzerland, GLP, not published, Syngenta File No CGA71818/4475
02-2024 Wolf, S 2003 Residue Study with Penconazole (CGA 71818) in or on Melons in Spain, Syngenta Crop Protection AG, Basel, Switzerland, GLP, not published, Syngenta File No CGA71818/4476
02-2153 Wolf, S 2003 Processing Study with Grapes from France (North) containing Penconazole (CGA 71818), Syngenta- ealott’s Hill, Bracknell, United Kingdom, GLP, not published, Syngenta File No CGA71818/4509
02-2163
Wolf, S 2003 Residue Study with Penconazole (CGA 71818) in or on Strawberries in Spain, Syngenta Crop Protection AG, Basel, Switzerland, GLP, not published, Syngenta File No CGA71818/4481
02-2003 Wolf, S. 2003 Residue Study with Penconazole (CGA 71818) in or on Artichokes in Spain, Syngenta-Jealott’s Hill, Bracknell, United Kingdom, GLP, not published, Syngenta File No CGA71818/4507
02-2003 Wolf, S. 2003 Residue Study with Penconazole (CGA 71818) in or on Artichokes in Spain, Syngenta - Jealott’s Hill, Bracknell, United Kingdom, GLP, not published, Syngenta File No CGA71818/4507
02-2019 Wolf, S. 2003 Residue Study with Penconazole (CGA 71818) in or on Sweet Peppers in Spain, Syngenta Crop Protection AG, Basel, Switzerland, GLP, not published, Syngenta File No CGA71818/4451
02-2020 Wolf, S. 2003 Residue Study with Penconazole (CGA 71818) in or on Sweet Peppers in Spain, Syngenta Crop Protection AG, Basel, Switzerland, GLP, not published, Syngenta File No CGA71818/4452
02-2025 Wolf, S. 2003 Residue Study with Penconazole (CGA 71818) in or on Melons in Spain, Syngenta - Jealott’s Hill, Bracknell, United Kingdom, GLP, not published, Syngenta File No CGA71818/4506
Penconazole
1899
Code Author(s) Year Title, Institute, Report reference
02-2029 Wolf, S. 2003 Residue Study with Penconazole (CGA 71818) in or on Sweet Peppers in Italy, Syngenta Crop Protection AG, Basel, Switzerland, GLP, not published, Syngenta File No CGA71818/4477
02-2030 Wolf, S. 2003 Residue Study with Penconazole (CGA 71818) in or on Strawberries in France (North), Syngenta Crop Protection AG, Basel, Switzerland, GLP, not published Syngenta File No CGA71818/4482
02-2031 Wolf, S. 2003 Residue Study with Penconazole (CGA 71818) in or on Strawberries in France (North), Syngenta Crop Protection AG, Basel, Switzerland, GLP, not published Syngenta File No CGA71818/4484
02-2032 Wolf, S. 2003 Residue Study with Penconazole (CGA 71818) in or on Strawberries in Italy Syngenta Crop Protection AG, Basel, Switzerland, GLP, not published, Syngenta File No CGA71818/4458
02-2034 Wolf, S. 2003 Residue Study with Penconazole (CGA 71818) in or on Strawberries in Italy, Syngenta Crop Protection AG, Basel, Switzerland, GLP, not published, Syngenta File No CGA71818/4459
02-2035 Wolf, S. 2003 Residue Study with Penconazole (CGA 71818) in or on Strawberries in France (North), Syngenta Crop Protection AG, Basel, Switzerland, GLP, not published, Syngenta File No CGA71818/4460
02-2055 Wolf, S. 2003 Residue Study with Penconazole (CGA 71818) in or on Strawberries in United Kingdom, Syngenta Crop Protection AG, Basel, Switzerland, GLP, not published, Syngenta File No CGA71818/4461
02-2056 Wolf, S. 2003 Residue Study with Penconazole (CGA 71818) in or on Strawberries in United Kingdom, Syngenta-Jealott’s Hill, Bracknell, United Kingdom, GLP, not published, Syngenta File No CGA71818/4470
02-2067 Wolf, S. 2003 Residue Study with Penconazole (CGA 71818) in or on Strawberries in France (South), Syngenta - Jealott’s Hill, Bracknell, United Kingdom, GLP, not published, Syngenta File No CGA71818/4469
02-2068 Wolf, S. 2003 Residue Study with Penconazole (CGA 71818) in or on Strawberries in France (South), Syngenta - Jealott’s Hill, Bracknell, United Kingdom, GLP, not published, Syngenta File No CGA71818/4490
02-2071 Wolf, S. 2003 Residue Study with Penconazole (CGA 71818) in or on Cucumbers in France (North), Syngenta -Jealott’s Hill, Bracknell, United Kingdom, GLP, not published, Syngenta File No CGA71818/4487
02-2072 Wolf, S. 2003 Residue Study with Penconazole (CGA 71818) in or on Cucumbers in France (North), Syngenta - Jealott’s Hill, Bracknell, United Kingdom, GLP, not published, Syngenta File No CGA71818/4473
02-2073 Wolf, S. 2003 Residue Study with Penconazole (CGA 71818) in or on Cucumbers in France (North), Syngenta - Jealott’s Hill, Bracknell, United Kingdom, GLP, not published, Syngenta File No CGA71818/4472
02-2074 Wolf, S. 2003 Residue Study with Penconazole (CGA 71818) in or on Tomatoes in the United Kingdom, Syngenta Crop Protection AG, Basel, Switzerland, GLP, not published Syngenta File No CGA71818/4466
02-2104 Wolf, S. 2003 Residue Study with Penconazole (CGA 71818) in or on Sweet Peppers in France (South), Syngenta Crop Protection AG, Basel, Switzerland, GLP, not published, Syngenta File No CGA71818/4455
02-2105 Wolf, S. 2003 Residue Study with Penconazole (CGA 71818) in or on Sweet Peppers in France (North), Syngenta - Jealott’s Hill, Bracknell, United Kingdom, GLP, not published, Syngenta File No CGA71818/4480
02-2106 Wolf, S. 2003n Residue Study with Penconazole (CGA 71818) in or on Sweet Peppers in France (North), Syngenta-Jealott’s Hill, Bracknell, United Kingdom, GLP, not published, Syngenta File No CGA71818/4474
02-2106 Wolf, S. 2003 Residue Study with Penconazole (CGA 71818) in or on Sweet Peppers in France (North), Syngenta - Jealott’s Hill, Bracknell, United Kingdom, GLP, not published, Syngenta File No CGA71818/4474
02-2107 Wolf, S. 2003 Residue Study with Penconazole (CGA 71818) in or on Melons in Italy, Syngenta - Jealott’s Hill, Bracknell, United Kingdom, GLP, not published, Syngenta File No CGA71818/4502
02-2108 Wolf, S. 2003 Residue Study with Penconazole (CGA 71818) in or on Melons in Italy, Syngenta -

Penconazole
1900
Code Author(s) Year Title, Institute, Report reference
Jealott’s Hill, Bracknell, United Kingdom, GLP, not published, Syngenta File No CGA71818/4504
02-2115 Wolf, S. 2003 Residue Study with Penconazole (CGA 71818) in or on Tomatoes in France (North), Syngenta Crop Protection AG, Basel, Switzerland, GLP, not published, Syngenta File No CGA71818/4464
02-2116 Wolf, S. 2003 Residue Study with Penconazole (CGA 71818) in or on Tomatoes in France (North), Syngenta Crop Protection AG, Basel, Switzerland, GLP, not published, Syngenta File No CGA71818/4465
02-2137 Wolf, S. 2003 Residue Study with Penconazole (CGA 71818) in or on Tomatoes in Spain, Syngenta Crop Protection AG, Basel, Switzerland, GLP, not published, Syngenta File No CGA71818/4467
02-2140 Wolf, S. 2003 Residue Study with Penconazole (CGA 71818) in or on Tomatoes in France (South), Syngenta Crop Protection AG, Basel, Switzerland, GLP, not published, Syngenta File No CGA71818/4462
02-2141 Wolf, S. 2003 Residue Study with Penconazole (CGA 71818) in or on Tomatoes in France (South), Syngenta Crop Protection AG, Basel, Switzerland, GLP, not published, Syngenta File No CGA71818/4463
02-2142 Wolf, S. 2003 Residue Study with Penconazole (CGA 71818) in or on Cucumbers in France (South), Syngenta Crop Protection AG, Basel, Switzerland, GLP, not published, Syngenta File No CGA71818/4478
02-2143 Wolf, S. 2003 Residue Study with Penconazole (CGA 71818) in or on Cucumbers in France (South), Syngenta Crop Protection AG, Basel, Switzerland, GLP, not published, Syngenta File No CGA71818/4479
02-2144 Wolf, S. 2003 Residue Study with Penconazole (CGA 71818) in or on Grapes in Italy, Syngenta Crop Protection AG, Basel, Switzerland, GLP, not published, Syngenta File No CGA71818/4468
02-2145 Wolf, S. 2003 Residue Study with Penconazole (CGA 71818) in or on Grapes in Italy, Syngenta - Jealott’s Hill, Bracknell, United Kingdom, GLP, not published, Syngenta File No CGA71818/4503
02-2146 Wolf, S. 2003 Residue Study with Penconazole (CGA 71818) in or on Grapes in France (South), Syngenta-Jealott’s Hill, Bracknell, United Kingdom, GLP, not published, Syngenta File No CGA71818/4512
02-2147 Wolf, S. 2003 Residue Study with Penconazole (CGA 71818) in or on Grapes in France (South), Syngenta-Jealott’s Hill, Bracknell, United Kingdom, GLP, not published, Syngenta File No CGA71818/4511
02-2148 Wolf, S.
2003 Processing Study with Grapes from France (South) containing Penconazole (CGA 71818), Syngenta-Jealott’s Hill, Bracknell, United Kingdom, GLP, not published, Syngenta File No CGA71818/4510
02-2148 Wolf, S. 2003 Processing Study with Grapes from France (South) containing Penconazole (CGA 71818), Syngenta - Jealott’s Hill, Bracknell, United Kingdom, GLP, not published Syngenta File No CGA71818/4510
02-2153 Wolf, S. 2003 Processing Study with Grapes from France (North) containing Penconazole (CGA 71818), Syngenta - Jealott’s Hill, Bracknell, United Kingdom, GLP, not published, Syngenta File No CGA71818/4509