The Firs - Thermal Interim Report
16
SPAB Building Performance Survey - Interim Report - C. Rye & D. Hubbard - July 2011 The Firs, Riddlecombe, Devon. 2011 Description: Two storey, semi-detached, nineteenth century cob cottage with early twentieth century single storey addition in cob to right side and more recent extensions to rear. Mainly new timber double glazed units. Occupancy: Family of 5. Floor Area: 86m 2
-
Upload
jonathan-barattini -
Category
Documents
-
view
218 -
download
1
description
Extract from SPAB Building Performance Survey 2011 Interim Report by Dr. Caroline Rye and Diane Hubbard
Transcript of The Firs - Thermal Interim Report
SPAB Building Performance Survey - Interim Report - C. Rye & D. Hubbard - July 2011
The Firs, Riddlecombe, Devon.
2011
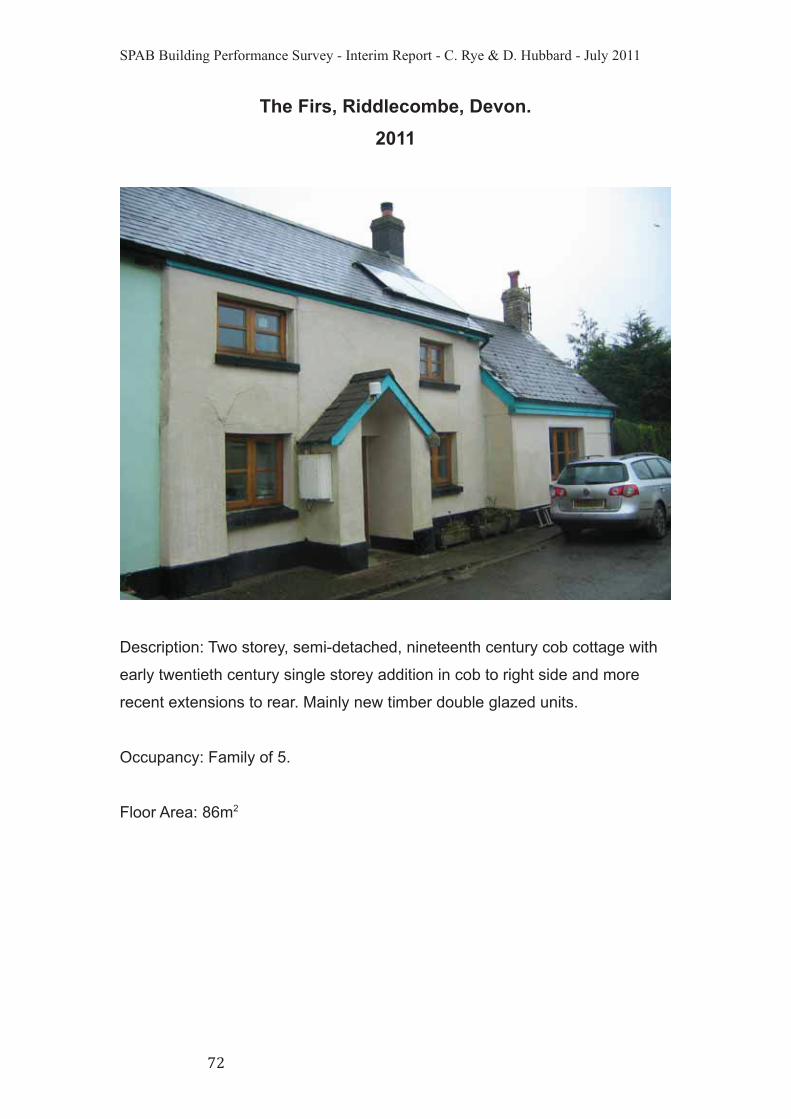
Description: Two storey, semi-detached, nineteenth century cob cottage with
early twentieth century single storey addition in cob to right side and more
recent extensions to rear. Mainly new timber double glazed units.
Occupancy: Family of 5.
Floor Area: 86m2
!
SPAB Building Performance Survey - Interim Report - C. Rye & D. Hubbard - July 2011
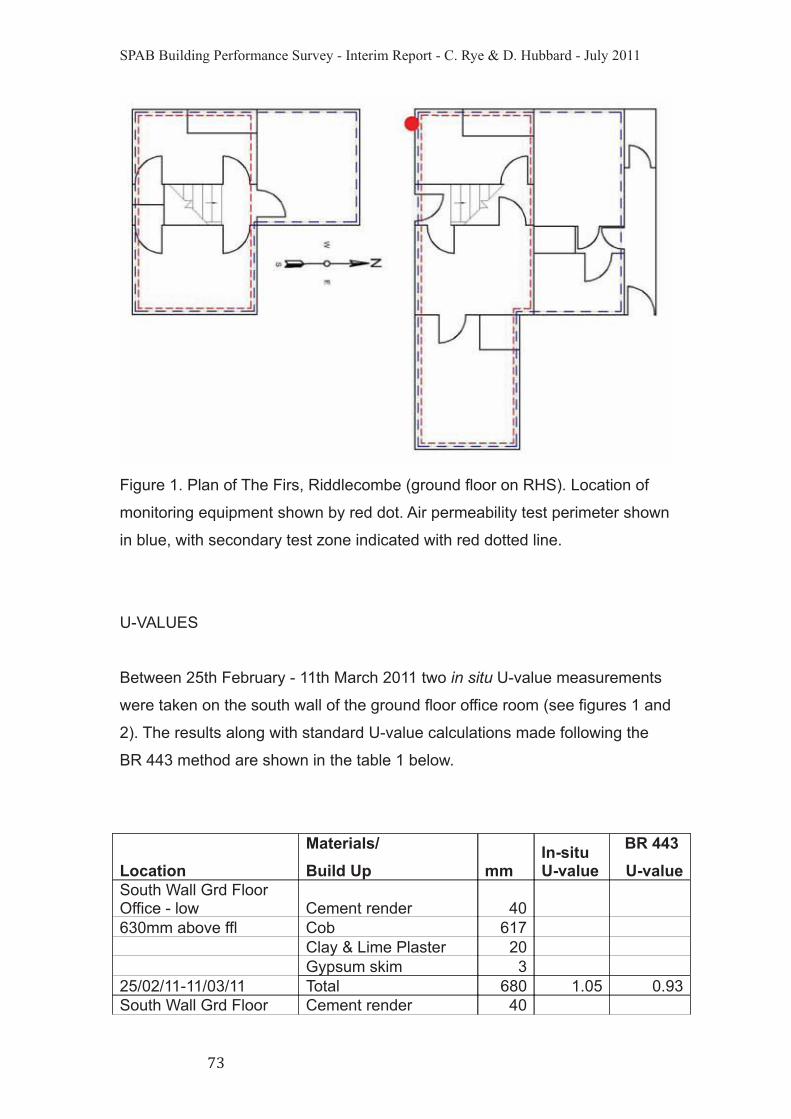
Figure 1. Plan of The Firs, Riddlecombe (ground floor on RHS). Location of
monitoring equipment shown by red dot. Air permeability test perimeter shown
in blue, with secondary test zone indicated with red dotted line.
U-VALUES
Between 25th February - 11th March 2011 two in situ U-value measurements
were taken on the south wall of the ground floor office room (see figures 1 and
2). The results along with standard U-value calculations made following the
BR 443 method are shown in the table 1 below.
Location
Materials/
Build Up mmIn-situU-value
BR 443
U-valueSouth Wall Grd FloorOffice - low Cement render 40
630mm above ffl Cob 617
Clay & Lime Plaster 20
Gypsum skim 3
25/02/11-11/03/11 Total 680 1.05 0.93
South Wall Grd Floor Cement render 40
"

SPAB Building Performance Survey - Interim Report - C. Rye & D. Hubbard - July 2011
Office - high
1790mm above ffl Cob 617
Lime Plaster 20
Gypsum skim 3
25/02/11-11/03/11 Total 680 0.76 0.93
Table 1. In situ and calculated U-value results for The Firs, Riddlecombe
March 2011.
Figure 2. Positions of in situ monitoring equipment at The Firs Riddlecombe
2011.
The two in situ U-values measured for this wall are significantly different, the
difference between them being outside of the ± 10% error margin attributed to
the in situ U-value method. The U-value measured at the lower part of the wall
(at 630mm above finished floor level) shows greater thermal transmissivity,
1.05 W/m2K than that measured higher up, 0.76 W/m2K (at 1790mm from ffl).
The reason for this is likely to be due to the high concentrations of moisture
found towards the base of this cob wall which increases the conductivity of the
wall as a whole (see later section on moisture).
#
SPAB Building Performance Survey - Interim Report - C. Rye & D. Hubbard - July 2011
The U-value that was calculated for this wall using the BR 443 standard sits
between the two in situ U-values that were found. A calculated U-value relies
on knowledge of the individual thermal conductivity values (sometimes called
K values or lambda values) for the materials that make up a wall, in this
instance cob. Cob is not detailed on the standard material databases found
within the calculating software therefore it is necessary to search elsewhere
for this information. The thermal conductivity value used in this calculation,
0.73 W/mK, is from a paper written on behalf of the Devon Earth Building
Association by Tony Ley and Mervyn Widgery$ and is the value given for cob
at the lower end of its density range 1700 kg/m3. The fact that one of the in
situ U-values recorded on the drier section of cob wall, 0.76 W/m2K is of lower
number value than the calculated U-value 0.93 W/m2K suggests that the cob
in this wall is at even lower density (and thus is less thermally conductive)
than the range given in this research. The improved in situ figure is also likely
to be a reflection of the ability of an in situ U-value measurement, unlike a
standard calculation, to take into account the beneficial effect of thermal
mass, as well as other external factors such as solar radiation (it was a south
facing wall) within the overall description of the wall's thermal transmissivity.%
$%&'()%*+),%-+./)(%0123+.),%4566 7%89+/'(%:;.<=%>?1@21(3%ABB'C1;<1'(D%C'E%;(2
<=+%>?1@21(3%F+3?@;<1'(B8,%G<.?C<?.;@%G?./+),%H'@I%5$%JBBD%5,%KKI#!%L%#6
$
SPAB Building Performance Survey - Interim Report - C. Rye & D. Hubbard - July 2011
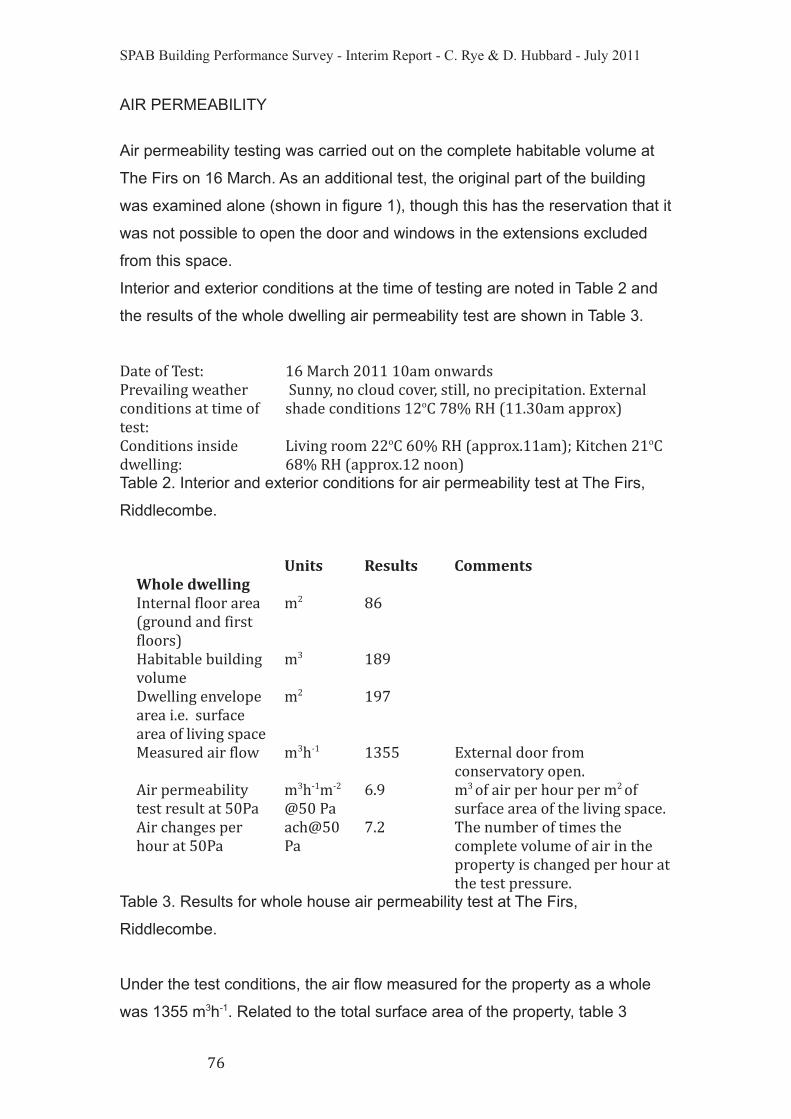
AIR PERMEABILITY
Air permeability testing was carried out on the complete habitable volume at
The Firs on 16 March. As an additional test, the original part of the building
was examined alone (shown in figure 1), though this has the reservation that it
was not possible to open the door and windows in the extensions excluded
from this space.
Interior and exterior conditions at the time of testing are noted in Table 2 and
the results of the whole dwelling air permeability test are shown in Table 3.
9;<+%'M%&+B<D 5N%-;.C=%!O55%5O;P%'(Q;.2B
R.+/;1@1(3%Q+;<=+.
C'(21<1'(B%;<%<1P+%'M
<+B<D
%G?((),%('%C@'?2%C'/+.,%B<1@@,%('%K.+C1K1<;<1'(I%:S<+.(;@
B=;2+%C'(21<1'(B%5!'T% UV%FW%455I"O;P%;KK.'S7
T'(21<1'(B%1(B12+
2Q+@@1(3D
*1/1(3%.''P%!!'T%NOV%FW%4;KK.'SI55;P7X%Y1<C=+(%!5'T
NUV%FW%4;KK.'SI5!%(''(7
Table 2. Interior and exterior conditions for air permeability test at The Firs,
Riddlecombe.
Units Results Comments
Whole dwelling
J(<+.(;@%M@''.%;.+;
43.'?(2%;(2%M1.B<
M@''.B7
P! UN
W;E1<;E@+%E?1@21(3
/'@?P+
P" 5U6
9Q+@@1(3%+(/+@'K+
;.+;%1I+I%%B?.M;C+
;.+;%'M%@1/1(3%BK;C+
P! 56
-+;B?.+2%;1.%M@'Q P"=L5 5"$$ :S<+.(;@%2''.%M.'P
C'(B+./;<'.)%'K+(I
A1.%K+.P+;E1@1<)
<+B<%.+B?@<%;<%$OR;
P"=L5PL!
Z$O%R;
NI6 P"%'M%;1.%K+.%='?.%K+.%P!%'M
B?.M;C+%;.+;%'M%<=+%@1/1(3%BK;C+I
A1.%C=;(3+B%K+.
='?.%;<%$OR;
;C=Z$O
R;
I! &=+%(?PE+.%'M%<1P+B%<=+
C'PK@+<+%/'@?P+%'M%;1.%1(%<=+
K.'K+.<)%1B%C=;(3+2%K+.%='?.%;<
<=+%<+B<%K.+BB?.+I%
Table 3. Results for whole house air permeability test at The Firs,
Riddlecombe.
Under the test conditions, the air flow measured for the property as a whole
was 1355 m3h-1. Related to the total surface area of the property, table 3
N
SPAB Building Performance Survey - Interim Report - C. Rye & D. Hubbard - July 2011
shows this equates to an air permeability of 6.9 m3h-1m-2 @50 Pa. This
performance is well below the limit applied to new buildings under Approved
Document L1A 2006, but above the threshold for the 2010 regulations of 10
m3h-1m-2 @50 Pa.
Relating the dwelling volume to the measured air flow, the air change rate at
50Pa is 7.2 ach, representing the number of times per hour the total volume of
air in the building will change at this pressure difference. From Sherman, this
would represent an air change rate just under 0.4, which is lower than
orthodoxy.
It was noted the householder reported condensation problems in bedrooms
overnight and this is likely to be related to the low infiltration rates measured.
In order to consider the cob dwelling (both 19th and 20th Century parts)
separately from the extensions to the rear of the building, a stage test was
also carried out (shown in fig. 1). This test does not truly reflect the air
permeability figure because the outer doors were closed rather than
Units Results
Older part of building (including sitting room)
J(<+.(;@%M@''.%;.+;
43.'?(2%;(2%M1.B<
M@''.B7
P! $#
W;E1<;E@+%E?1@21(3
/'@?P+
P" 5!#
9Q+@@1(3%+(/+@'K+%;.+;
1I+I%%B?.M;C+%;.+;%'M
@1/1(3%BK;C+
P! 5NO
-+;B?.+2%;1.%M@'Q P"=L5 6!
A1.%K+.P+;E1@1<)%<+B<
.+B?@<%;<%$OR;
P"=L5PL!
Z$O%R;
$IU
A1.%C=;(3+B%K+.%='?.%;<
$OR;
;C=Z$O
R;
I$
Table 4. Air permeability results for cob components of The Firs,
Riddlecombe.
everything open to the outdoors (which has the effect of making the older part
of the building look tighter than it is), but they do help to put the different parts
SPAB Building Performance Survey - Interim Report - C. Rye & D. Hubbard - July 2011
of building into context. The results of this test are detailed in Table 4 and
indicate the cob part of the dwelling has a lower test result (5.8 m3h-1m-2 @50
Pa) than the result for the building as a whole (6.9 m3h-1m-2 @50 Pa).
Flue Test
Under the standard test procedure, chimneys and flues in the dwelling are
excluded from the results. However, the air flows under depressurisation for
the two flues at The Firs were measured:
Additional m3h!1
@50Pa
Sitting room (20C extension) – wood
burning stove fitted
32
Living room stove– wood burning
stove fitted
22
Table 5. The Firs, Riddlecombe – additional air flows relating to flues under air
permeability test conditions.
Though they will not directly relate to the air flows through chimneys when in
use / not in use, the air flows (shown in table 5) from both these flues is low
compared to other dwellings tested within the study.
THERMOGRAPHIC SURVEY
Thermal imaging was carried out inside The Firs whist the air permeability test
was carried out on 16 March. The key area of note were as follows:
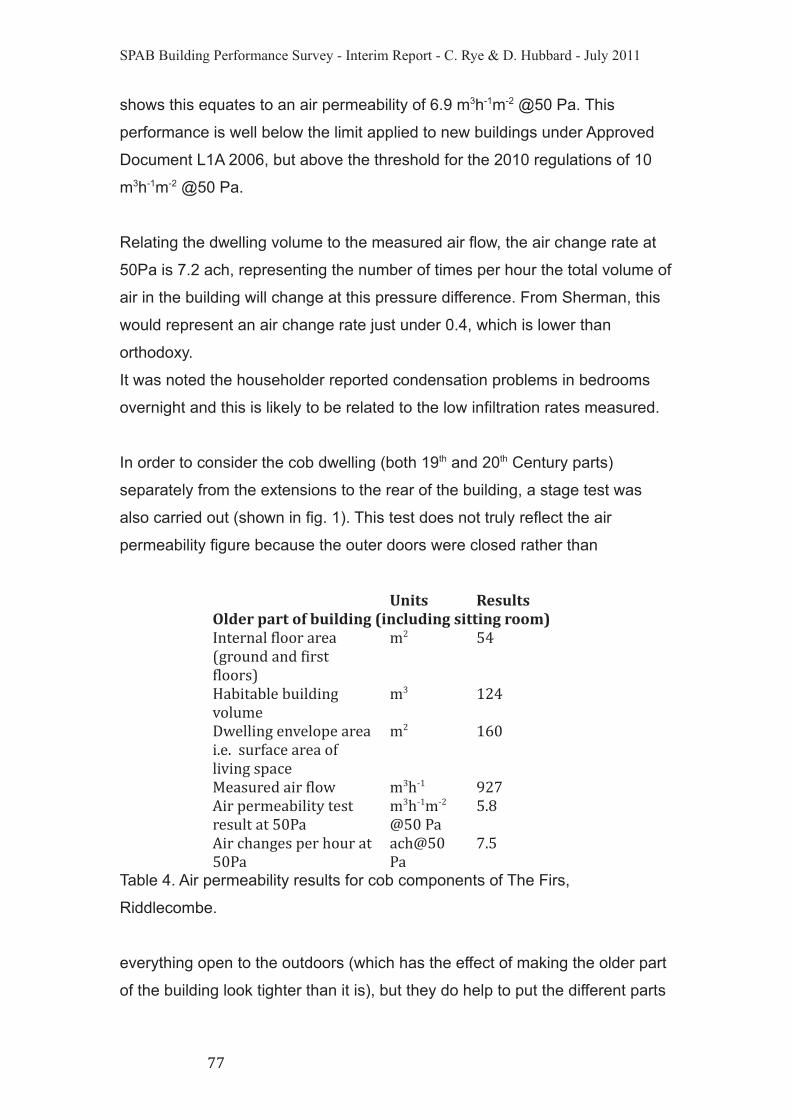
Ingress through the rear external door (fig. 3)
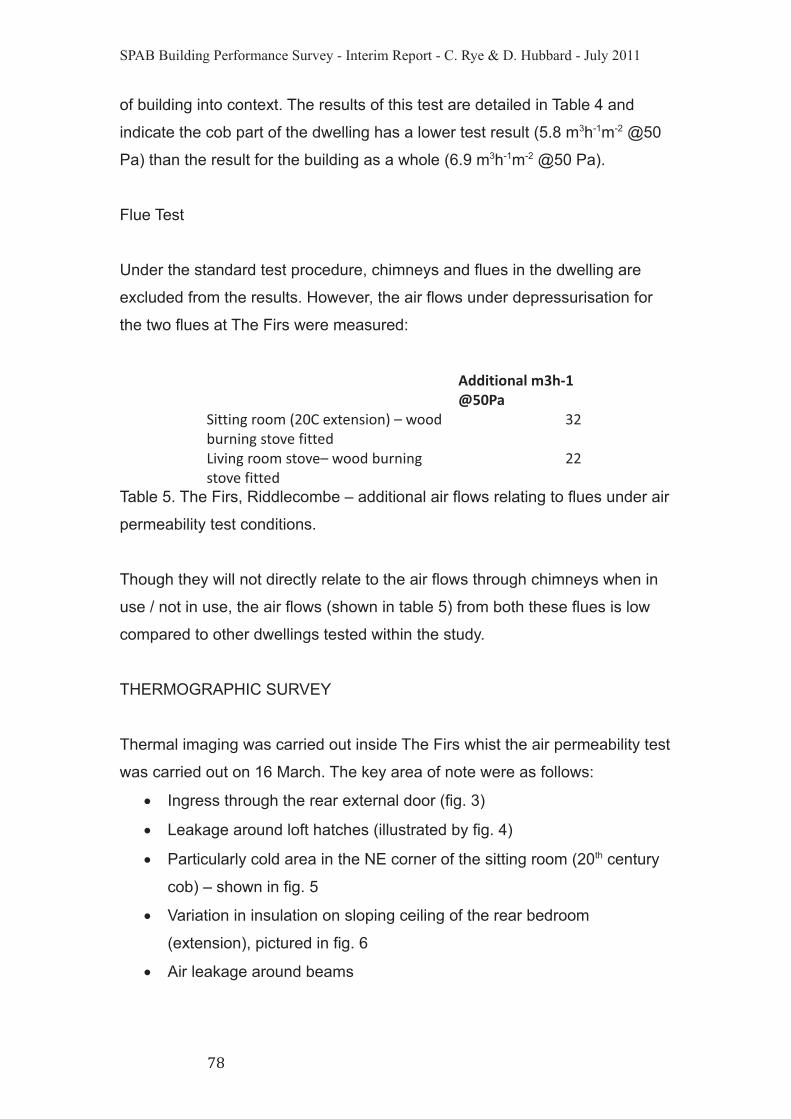
Leakage around loft hatches (illustrated by fig. 4)
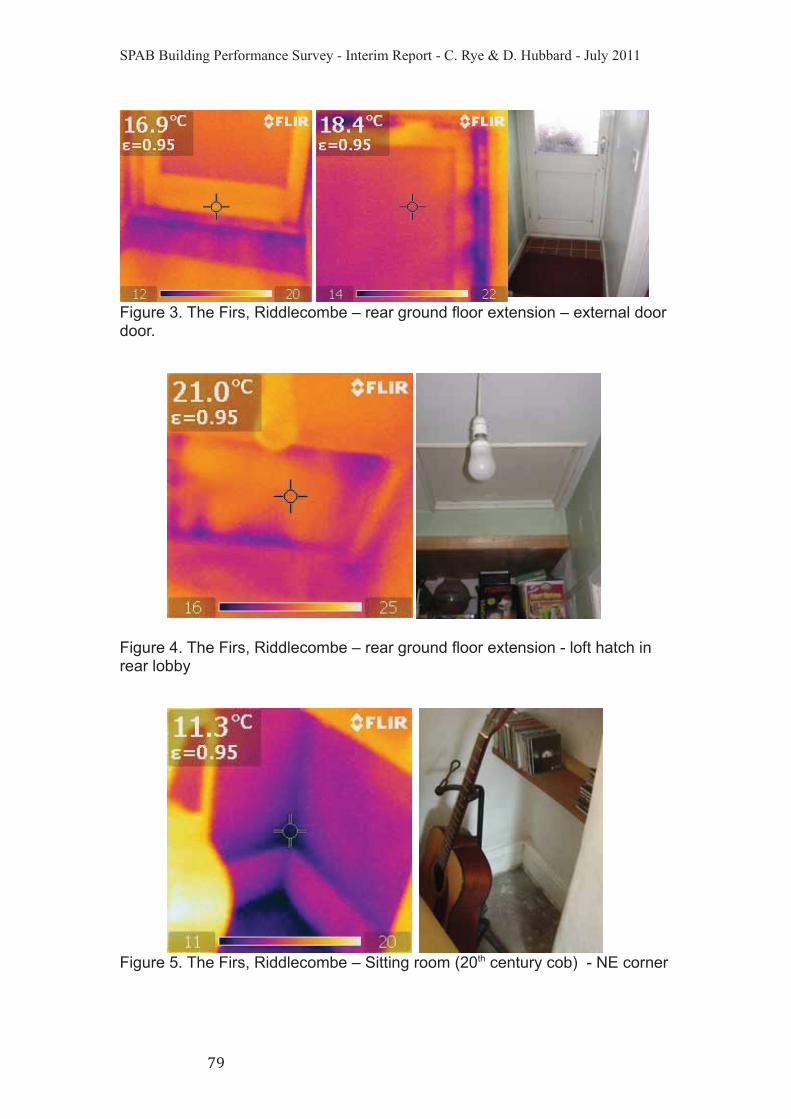
Particularly cold area in the NE corner of the sitting room (20th century
cob) – shown in fig. 5
Variation in insulation on sloping ceiling of the rear bedroom
(extension), pictured in fig. 6
Air leakage around beams
U
SPAB Building Performance Survey - Interim Report - C. Rye & D. Hubbard - July 2011
%
Figure 3. The Firs, Riddlecombe – rear ground floor extension – external doordoor.
%
Figure 4. The Firs, Riddlecombe – rear ground floor extension - loft hatch inrear lobby
%%
Figure 5. The Firs, Riddlecombe – Sitting room (20th century cob) - NE corner
6
SPAB Building Performance Survey - Interim Report - C. Rye & D. Hubbard - July 2011
%
Figure 6. The Firs, Riddlecombe – First floor extension: Bedroom 2 – variationin insulation on sloping ceiling.
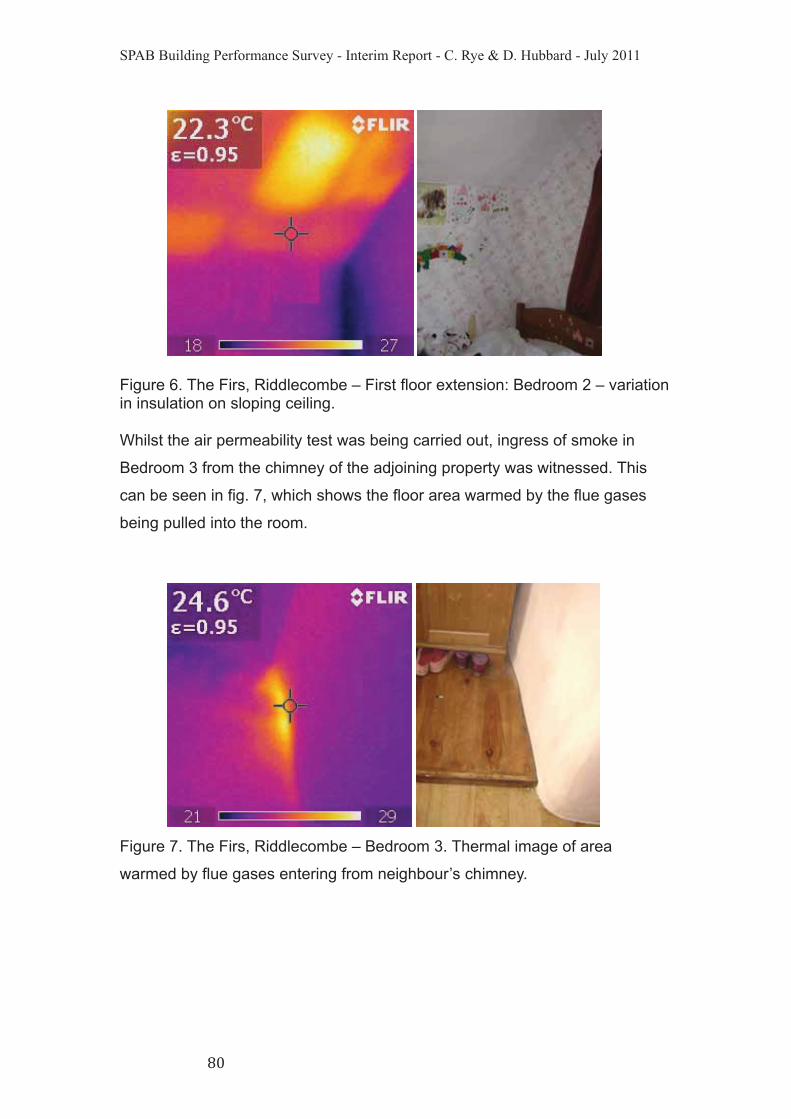
Whilst the air permeability test was being carried out, ingress of smoke in
Bedroom 3 from the chimney of the adjoining property was witnessed. This
can be seen in fig. 7, which shows the floor area warmed by the flue gases
being pulled into the room.
Figure 7. The Firs, Riddlecombe – Bedroom 3. Thermal image of area
warmed by flue gases entering from neighbour’s chimney.
UO
SPAB Building Performance Survey - Interim Report - C. Rye & D. Hubbard - July 2011
MOISTURE
Interstitial Moisture
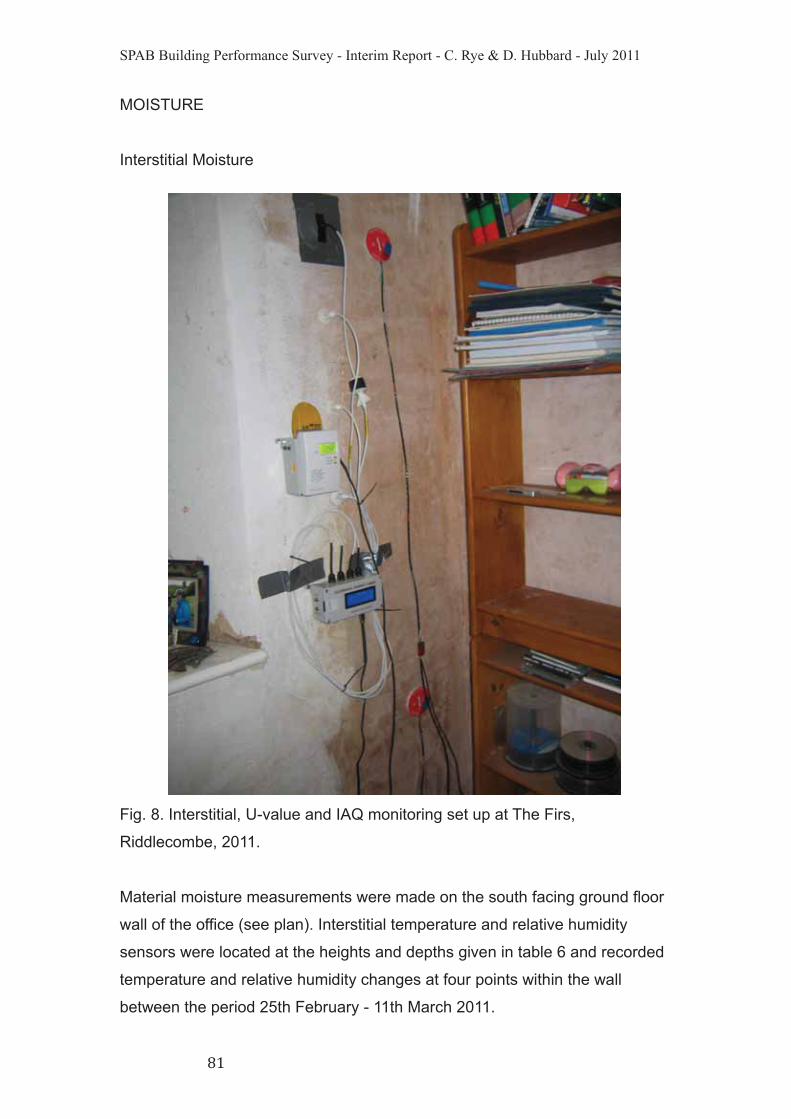
Fig. 8. Interstitial, U-value and IAQ monitoring set up at The Firs,
Riddlecombe, 2011.
Material moisture measurements were made on the south facing ground floor
wall of the office (see plan). Interstitial temperature and relative humidity
sensors were located at the heights and depths given in table 6 and recorded
temperature and relative humidity changes at four points within the wall
between the period 25th February - 11th March 2011.
U5
SPAB Building Performance Survey - Interim Report - C. Rye & D. Hubbard - July 2011
>[J*9%[R%+S<+.(;@%L
1(<+.(;@
G:\G]F W:J^W&%M.'P%MM@ 9:R&W%M.'P%1(<%B?.
M1(1B=
T+P+(<%F+(2+.%L%#OPP G+(B'.%5 5UOOPP $OPP
T'E%L%N5 PP G+(B'.%! 5NOOPP !!$PP
*1P+%R@;B<+.%L%!OPP G+(B'.%" 5#OOPP #OOPP
^)KB?P%B_1P%L%"PP G+(B'.%# 5!OOPP $UOPP
]H:FA**%`%NUOPP
Table 6. Interstitial gradient sensor record for The Firs, Riddlecombe, 2011.
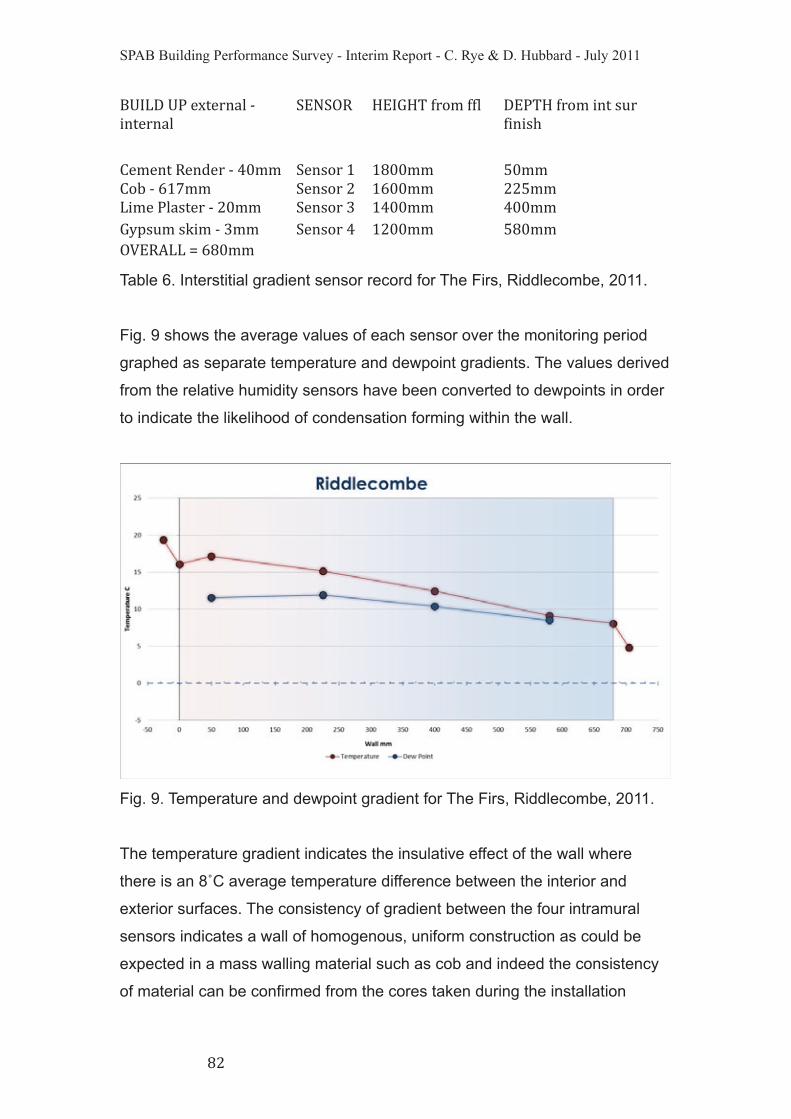
Fig. 9 shows the average values of each sensor over the monitoring period
graphed as separate temperature and dewpoint gradients. The values derived
from the relative humidity sensors have been converted to dewpoints in order
to indicate the likelihood of condensation forming within the wall.
Fig. 9. Temperature and dewpoint gradient for The Firs, Riddlecombe, 2011.
The temperature gradient indicates the insulative effect of the wall where
there is an 8˚C average temperature difference between the interior and
exterior surfaces. The consistency of gradient between the four intramural
sensors indicates a wall of homogenous, uniform construction as could be
expected in a mass walling material such as cob and indeed the consistency
of material can be confirmed from the cores taken during the installation
U!
SPAB Building Performance Survey - Interim Report - C. Rye & D. Hubbard - July 2011
process, when only very occasionally was the cob interspersed with lumps of
aggregate, 4-5mm in diameter.
An examination of the dewpoint gradient for this wall shows a position of near
convergence with the temperature gradient at a depth of 580mm within the
wall (sensor 4). Indeed the margin between temperature and dewpoint at this
point is only 2.86˚C suggesting that indeed condensation maybe forming
beyond this point towards the extremities of the colder external wall. The
narrow dewpoint margin found at Riddlecombe maybe explained by the
likelihood of high moisture content within the body of the wall structure,
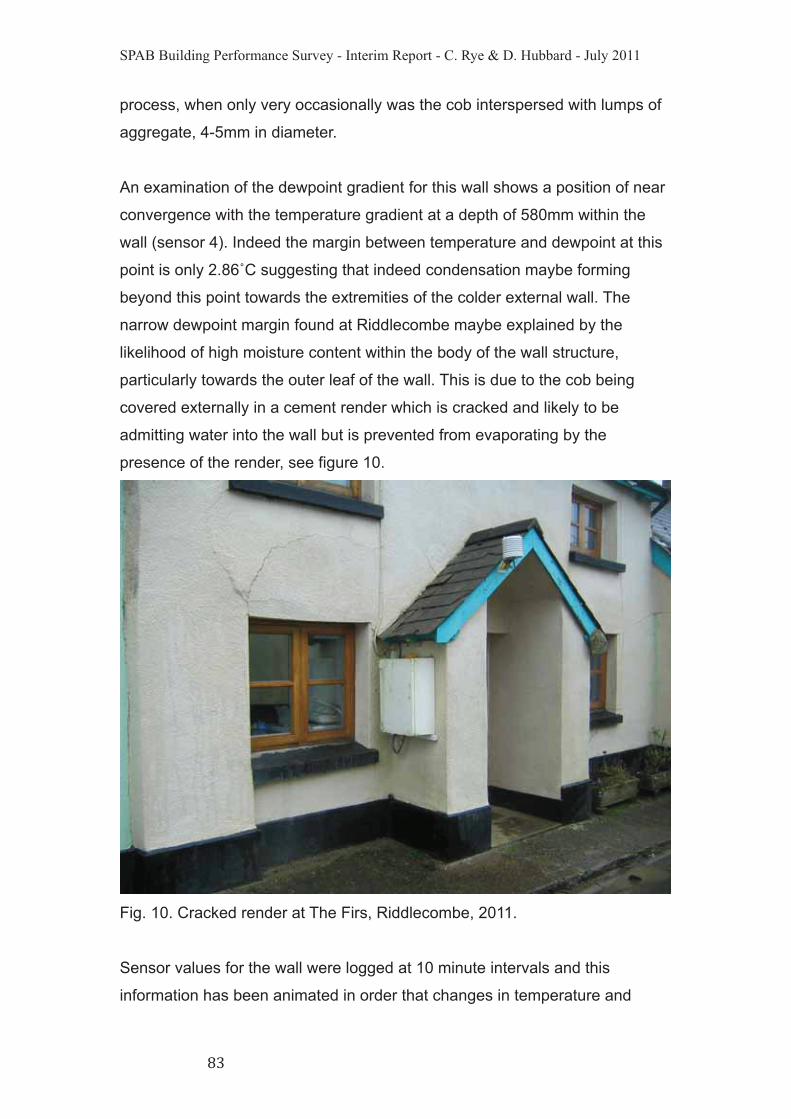
particularly towards the outer leaf of the wall. This is due to the cob being
covered externally in a cement render which is cracked and likely to be
admitting water into the wall but is prevented from evaporating by the
presence of the render, see figure 10.
Fig. 10. Cracked render at The Firs, Riddlecombe, 2011.
Sensor values for the wall were logged at 10 minute intervals and this
information has been animated in order that changes in temperature and
U"
SPAB Building Performance Survey - Interim Report - C. Rye & D. Hubbard - July 2011
dewpoint maybe analysed over time. Overall fluctuations from the intramural
sensors remain fairly static, particularly those temperatures recorded at
sensors 1-3 located within the centre and inner leaf of the wall. The effects of
solar radiation gain to the south facing wall can be observed on some
occasions during the monitoring period, when peaks in external air and
surface temperature transfer someway into the body of the wall and cause
greater fluctuations to temperatures recorded at sensor position 4 (580mm
back from internal surface). Interestingly these peaks do not obviously result
in any significant rise in temperature transferring through the entire wall
structure and temperatures from the other sensors remain relatively static in
relation to the internal air/surface temperatures. This probably illustrates a
productive relationship between thermal mass and thermal resistivity within
this wall construction, in that the majority of the mass of the wall is protected
from the extremes of external temperature change and thus, given sufficient
heat input, is able to retain a consistently comfortable internal temperature.
Surface Moisture
On 25th February 2011 two measurements were take of moisture conditions
of the interior wall surface, a resistive measurement of the surface itself and a
capacitance reading to a depth of approximately 40mm. Figure 11 plots the
two measurements in relation to one another to a height of 2000mm above
finished floor level along a nominal moisture scale.
U#
SPAB Building Performance Survey - Interim Report - C. Rye & D. Hubbard - July 2011
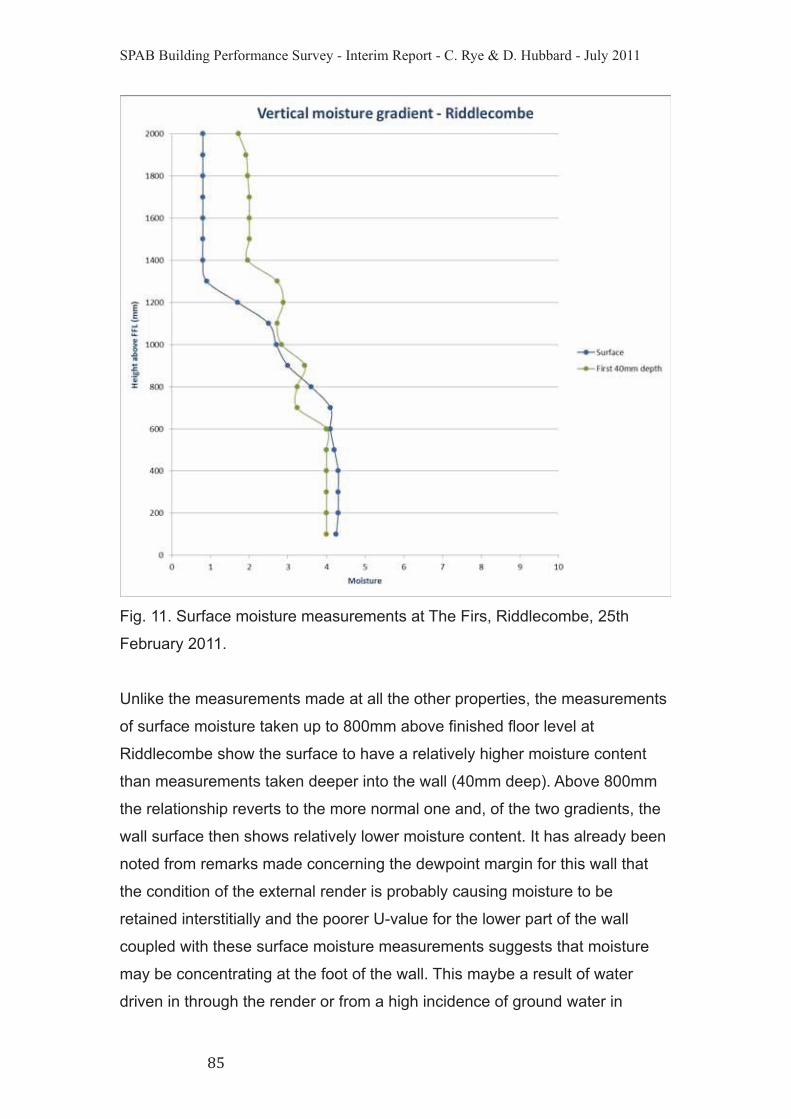
Fig. 11. Surface moisture measurements at The Firs, Riddlecombe, 25th
February 2011.
Unlike the measurements made at all the other properties, the measurements
of surface moisture taken up to 800mm above finished floor level at
Riddlecombe show the surface to have a relatively higher moisture content
than measurements taken deeper into the wall (40mm deep). Above 800mm
the relationship reverts to the more normal one and, of the two gradients, the
wall surface then shows relatively lower moisture content. It has already been
noted from remarks made concerning the dewpoint margin for this wall that
the condition of the external render is probably causing moisture to be
retained interstitially and the poorer U-value for the lower part of the wall
coupled with these surface moisture measurements suggests that moisture
may be concentrating at the foot of the wall. This maybe a result of water
driven in through the render or from a high incidence of ground water in
U$
SPAB Building Performance Survey - Interim Report - C. Rye & D. Hubbard - July 2011
proximity to the foot of the wall as the ground in front of the front elevation is
paved with concrete, or both. It is also interesting to note that both moisture
content measurements diminish above the 1200mm rising damp level
suggesting that capillary action and thus ground water is a major factor in the
moisture content of the wall below this level.
INDOOR AIR QUALITY & COMFORT/FABRIC RISK
PROPERTY CO2 (ppm) Temp (˚C) RH (%)
Riddlecombe 1097.5 19.5 60.4Table 7 provides a summary of the indoor conditions surveyed within the
office on the ground floor at The Firs, Riddlecombe (see fig.1). The figures
represent average values recorded over the monitoring period 25th February -
11th March 2011.
Table 7. Indoor Conditions at The Firs, Riddlecombe 25th February - 11th
March 2011.
Parameters surveyed were CO2, air temperature, and relative humidity levels.
The individual indoor temperature and relative humidity readings were also
plotted against an index of human comfort and fabric risk. The results for The
Firs can be seen in figure 12.
UN
SPAB Building Performance Survey - Interim Report - C. Rye & D. Hubbard - July 2011
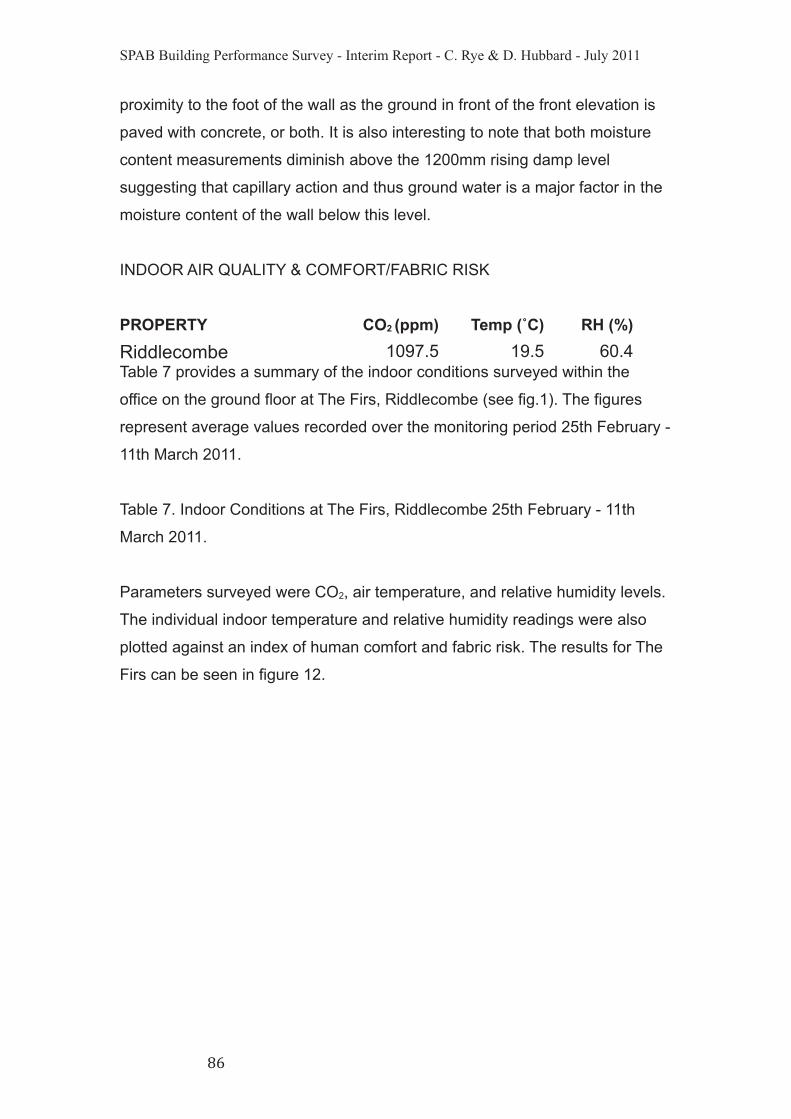
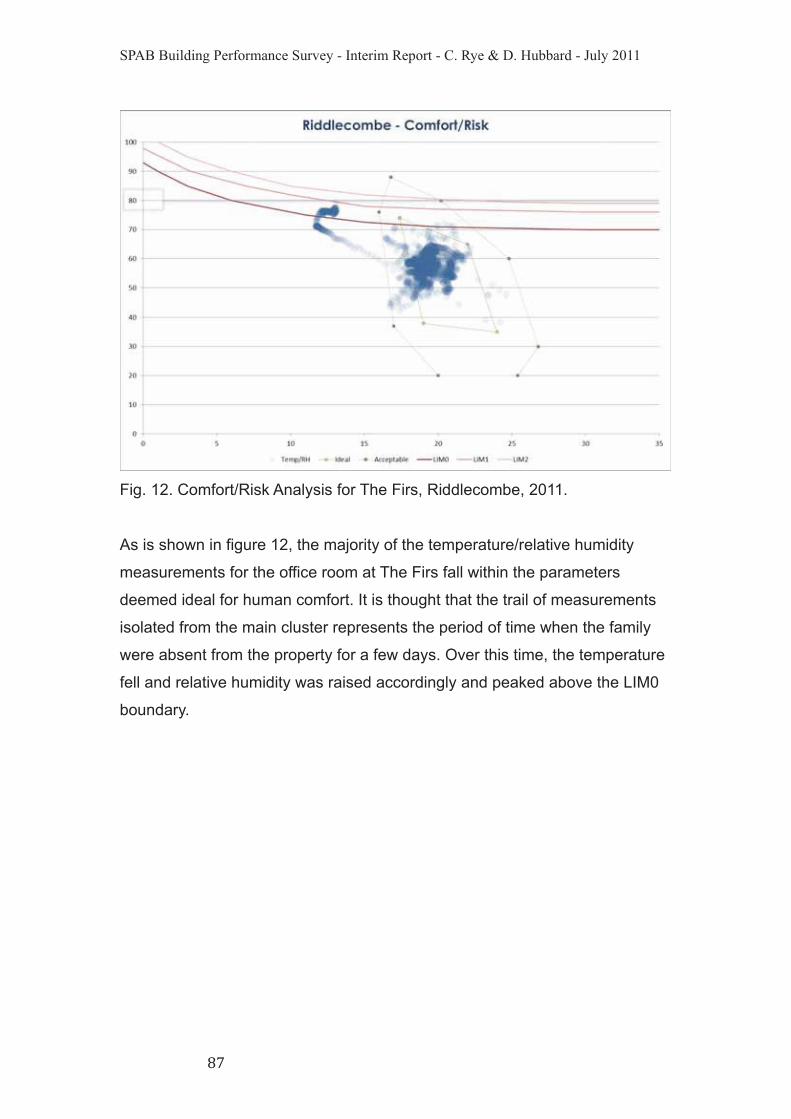
Fig. 12. Comfort/Risk Analysis for The Firs, Riddlecombe, 2011.
As is shown in figure 12, the majority of the temperature/relative humidity
measurements for the office room at The Firs fall within the parameters
deemed ideal for human comfort. It is thought that the trail of measurements
isolated from the main cluster represents the period of time when the family
were absent from the property for a few days. Over this time, the temperature
fell and relative humidity was raised accordingly and peaked above the LIM0
boundary.
U