The findings and conclusions in this presentation are those of the author and do not necessarily...
56
The findings and conclusions in this presentation are those of the author and do not necessarily represent the views of the CDC. Epidemiology and Prevention of Type 2 Diabetes Edward Gregg, PhD Epidemiology and Statistics Branch Division of Diabetes Translation Centers for Disease Control and Prevention Atlanta, GA
-
Upload
irma-marybeth-byrd -
Category
Documents
-
view
216 -
download
0
Transcript of The findings and conclusions in this presentation are those of the author and do not necessarily...

The findings and conclusions in this presentation are those of the author and do not necessarily represent the views of the CDC.
Epidemiology and Prevention
of Type 2 Diabetes
Epidemiology and Prevention
of Type 2 Diabetes
Edward Gregg, PhDEpidemiology and Statistics Branch
Division of Diabetes TranslationCenters for Disease Control and Prevention
Atlanta, GA
Edward Gregg, PhDEpidemiology and Statistics Branch
Division of Diabetes TranslationCenters for Disease Control and Prevention
Atlanta, GA


Prevalence of Total Diabetes (Diagnosed Diabetes and Undiagnosed Diabetes) in the U.S. Adult Population, Age ≥ 20, 2005-2006
According to Alternative Definitions of Undiagnosed Diabetes
Prevalence of Total Diabetes (Diagnosed Diabetes and Undiagnosed Diabetes) in the U.S. Adult Population, Age ≥ 20, 2005-2006
According to Alternative Definitions of Undiagnosed Diabetes
0
2
4
6
8
10
12
14
16
FPG A1c FPG or A1c FPG or 2-hr
Diagnosed Undiagnosed
0
2
4
6
8
10
12
14
16
FPG A1c FPG or A1c FPG or 2-hr
Diagnosed Undiagnosed
21.5 million
27.0 million
19.7 million
22.4 million
(> 126 mg/dl) (> 6.5%) (>126 mg/dl OR > 6.5%)
(>126 mg/dl OR 2hPG > 200)
Sources: Cowie et al., Diab Care, 2009; unpublished analyses, Bullard et al.; NIDDK, CDC

0
10
20
30
40
50
60
Men Women
Per
cen
t
Total Non-Hispanic WhiteNon-Hispanic Black Hispanic
0
10
20
30
40
50
60
Men Women
Per
cen
t
Total Non-Hispanic WhiteNon-Hispanic Black Hispanic
Narayan et al, JAMA, 2003
Estimated lifetime risk of developing diabetes for individuals born in the United States in 2000
Estimated lifetime risk of developing diabetes for individuals born in the United States in 2000


Projected Total Number of Adults with Diabetes (Diagnosed or Undiagnosed) Under Scenarios of No
further Increase Continued Increased Incidence Rate
Projected Total Number of Adults with Diabetes (Diagnosed or Undiagnosed) Under Scenarios of No
further Increase Continued Increased Incidence Rate
20
40
60
80
100
120
2007 2010 2015 2020 2025 2030 2035 2040 2045 2050
Year
Mill
ion
s o
f A
du
lts
Current Trends No Further Increase
20
40
60
80
100
120
2007 2010 2015 2020 2025 2030 2035 2040 2045 2050
Year
Mill
ion
s o
f A
du
lts
Current Trends No Further Increase
Boyle et al., Pop Health Metrics, 2010

Projected Prevalence of Diabetes (Diagnosed or Undiagnosed) Under Scenarios of No further
Increase Continued Increased Incidence Rate
Projected Prevalence of Diabetes (Diagnosed or Undiagnosed) Under Scenarios of No further
Increase Continued Increased Incidence Rate
0
10
20
30
40
2007 2010 2015 2020 2025 2030 2035 2040 2045 2050
Year
Pre
va
len
ce
(%
)
Current Trends No Further Increase
0
10
20
30
40
2007 2010 2015 2020 2025 2030 2035 2040 2045 2050
Year
Pre
va
len
ce
(%
)
Current Trends No Further Increase
Boyle et al., Pop Health Metrics, 2010

Factors Influencing Future Incidence and Prevalence Estimates
Factors Influencing Future Incidence and Prevalence Estimates
Prevalence in year 2010 (number and proportion of adults with diagnosed and undiagnosed diabetes, pre-diabetes).
Incidence (Rate of new cases into the future).
Mortality rates
Age distribution of the population.
Census projection of population growth.
Migration
Prevalence in year 2010 (number and proportion of adults with diagnosed and undiagnosed diabetes, pre-diabetes).
Incidence (Rate of new cases into the future).
Mortality rates
Age distribution of the population.
Census projection of population growth.
Migration

Risk Factors for Type 2 DiabetesRisk Factors for Type 2 Diabetes

Factors Causally Associated withFactors Causally Associated withIncreased Diabetes Incidence in IndividualsIncreased Diabetes Incidence in Individuals
ModifiableModifiable and and PrimPrime e Targets for Individual-Level Targets for Individual-Level InterventionsInterventions
Factors ExplainingFactors ExplainingPopulation Trends Population Trends in the Diseasein the Disease
Types of Risk Factors

Prevalence of Total Diabetes (Diagnosed Diabetes and Undiagnosed Diabetes)
in the U.S. Adult Population, Age ≥ 20, 2003-2006
Prevalence of Total Diabetes (Diagnosed Diabetes and Undiagnosed Diabetes)
in the U.S. Adult Population, Age ≥ 20, 2003-2006
Sources: Cowie et al., Diab Care, 2010; NIDDK, CDC
0
5
10
15
20
25
Total 20-39 yrs 40-59 yrs 60-74 yrs 75+ yrs
Prevalence (%)
Ag
e G
rou
p
Undiagnosed
Diagnosed
0
5
10
15
20
25
Total 20-39 yrs 40-59 yrs 60-74 yrs 75+ yrs
Prevalence (%)
Ag
e G
rou
p
Undiagnosed
Diagnosed

0 5 10 15 20
Non-Hispanic whites
Asian Americans
Hispanic/Latino Americans
Non-Hispanic blacks
American Indians/Alaska Natives
Percent
Estimated Age-Adjusted* Prevalence of Diagnosed Diabetes
in People Aged 20 Years or Older, by Race/Ethnicity,United States, 2007
Estimated Age-Adjusted* Prevalence of Diagnosed Diabetes
in People Aged 20 Years or Older, by Race/Ethnicity,United States, 2007
*Based on the 2000 US standard population
CDC, National Diabetes Fact Sheet, 2007


Migration Studies: Association Between Westernization and Diabetes Prevalence in Susceptible Populations
Migration Studies: Association Between Westernization and Diabetes Prevalence in Susceptible Populations
0
10
20
30
40
%
0
10
20
30
40
%
King, Diabetes Care, 1993; 1998; Diamond J, Nature, 2003
IndianAustralian Aborigines
ChineseNauru New
Guinea

BMI
<22
22-<23
23-<24
24-<25
25-<27
27-<29
29-<31
31-<33
33-<35
35+
1-y Risk (%)
0. 224
0. 255
0. 428
0. 539
0. 553
0. 899
1.074
1.480
1.892
2.461
RR
1
1.18
2.44
2.97
3.04
5.07
5.70
8.21
10.89
14.64
%- PointAbsolute Increase
0
0.031
0.204
0.315
0.329
0.675
0.850
1.256
1.668
2.237
Increase per100,000
0
31
204
315
329
675
850
1,256
1,668
2,237
Body Mass Index and 1-year Risk of Diabetes (Ford ES et al. AJE 1997;146:214-22)
CumulativeIncrease
550
1,554
7,565
0

Relative risk of incident diabetes per standard deviation of BMI and Waist circumference from a meta-analysis of 32 studies
Vasquez, Epidemiol Rev, 2007

1.57 1.28
1.5 2.5
1.05
2.260.56
1.42
0.4
1.37
0
2
4
6
8
10
1976-1980 1999-2004
Year
1.57 1.28
1.5 2.5
1.05
2.260.56
1.42
0.4
1.37
0
2
4
6
8
10
1976-1980 1999-2004
Year
Diabetes Prevalence among U.S. Adults Aged 20 - 74
BMI Category
Obese III (> 40)
Obese II (35-40)
Obese I (30 -35)
Overweight (25 -30)
Normal / underweight (<25)
Total
5.03%
8.83%
Age and sex adjustedGregg et al., Prev Med, 2007

Luckovich, Atlanta Journal Constitution
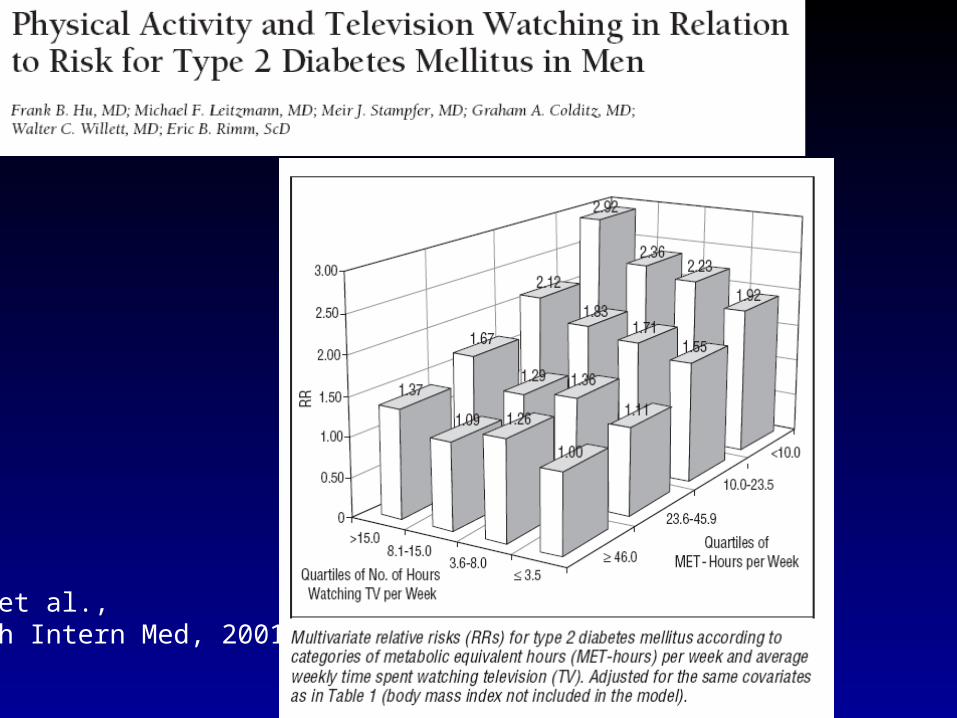
Hu et al.,Arch Intern Med, 2001

Dietary factors as independent diabetes risk factors
Dietary factors as independent diabetes risk factors
Characteristics of fat intake Whole grain / cereal fibers Dairy Glycemic load “Western diet” Fast food intake Soda intake Alcohol intake Coffee consumption
Characteristics of fat intake Whole grain / cereal fibers Dairy Glycemic load “Western diet” Fast food intake Soda intake Alcohol intake Coffee consumption

Trends in the proportion of total intake devoted to macronuetriends (left x-axis) and mean total Energy Intake (right x-axis) among U.S.
adults age 20-74, 1971 to 2000
Trends in the proportion of total intake devoted to macronuetriends (left x-axis) and mean total Energy Intake (right x-axis) among U.S.
adults age 20-74, 1971 to 2000
0
10
20
30
40
50
60
1971-1974 1976-1980 1988-1994 1999-20001000
1200
1400
1600
1800
2000
2200
2400
2600
2800
% Carbs
% fats
% saturated fats
% protein
Total Energy
0
10
20
30
40
50
60
1971-1974 1976-1980 1988-1994 1999-20001000
1200
1400
1600
1800
2000
2200
2400
2600
2800
% Carbs
% fats
% saturated fats
% protein
Total Energy
Total Intake (kcals)
MMWR, 2004

Percentage of total carbohydrates obtained from whole grains (smaller circles) and corn syrup (larger circles) in the United States
Gross et al., Am J Clin Nutr, 2004

Trends in % of Meals Eaten at Home and Trends in Total Kcal Intake in Meals and Snacks in the U.S., 1977-1996.
Trends in % of Meals Eaten at Home and Trends in Total Kcal Intake in Meals and Snacks in the U.S., 1977-1996.
50
55
60
65
70
75
80
1977-
78
1989-
91
1994-
96
% M
ea
ls e
ate
n a
t h
om
e
50
55
60
65
70
75
80
1977-
78
1989-
91
1994-
96
% M
ea
ls e
ate
n a
t h
om
e
1500
1650
1800
1950
1977-
78
1989-
91
1994-
96
kc
als
/da
y
Snacks Meals
Nielsen and Popkin, JAMA, 2003


Portion Sizes for Selected Key Foot Items for Americans Aged 2 and Older, 1977-1996.
Portion Sizes for Selected Key Foot Items for Americans Aged 2 and Older, 1977-1996.
0
5
10
15
20
25
Food
inta
ke p
er o
ccas
ion,
oz
1977-78
1989-91
1994-98
0
5
10
15
20
25
Food
inta
ke p
er o
ccas
ion,
oz
1977-78
1989-91
1994-98
Nielsen and Popkin, JAMA, 2003

Promising Targets for Population-Wide Food Policies to Influence Diabetes
Promising Targets for Population-Wide Food Policies to Influence Diabetes

Diabetes OR per 1kgBirth weight=0.78

Serum Concentration
ND <25% 25-50% 50-75% 75-90% 90-100%
Cases/n 2/643 34/505 53/527 65/275 63 / 246
Prevalence -- 0.4 6.7 10.1 23.6 25.6
Adjusted OR
-- Referent 14.9 (3. 0 – 65.0)
14.7 (3.4 – 63.9)
38.2 (8.0 – 183.1)
37.7 (7.8 – 182.0)
Adjusted OR
--- 0.07 (0.02 – 0.33)
Ref 1.1 (0.6 – 1.7)
2.7 (1.5 – 4.9)
2.7 (1.5 – 4.8)
Lee et al., Diab Care, 2007


Brownell et al.,

Gestational Diabetes and the Incidence of Type 2 Diabetes: A systematic review (Kim et al., Diabetes Care, 2002)

Systematic Review of the Incidence of Diabetes Associated with Various Categories of GlycemiaSystematic Review of the Incidence of Diabetes Associated with Various Categories of Glycemia
Number of studies
Regress to normal (median %)
Progress to Diabetes (median %)
Relative Risk of Diabetes
Impaired Glucose Tolerance
26 8% 7% 6.4 (4.9 – 7.8)
IGT Isolated 3 n/a 6% 5.5 (3.1 – 7.9)
IFG 6 13 – 29% 5-20%* 4.7 (2.5 – 6.9)
IFG Isolated 3 n/a 7% 7.5 (4.6 – 10.5)
IGT and IFG 3 n/a 10-15% 12.1 (4.3 – 20)
Gerstein et al., Diab Res Clin Pract, 2007*extremely variable; 1-7% in European pops; 23-34% in Asian pops.

Summary: Risk Factors for Type 2 DiabetesSummary: Risk Factors for Type 2 Diabetes
Age ↑ Family History / genetics ↑ Gestational Diabetes ↑ Obesity / fat distribution ↑ Physical Activity / fitness ↓ Smoking ↑ Very low birth weight ↑ Depression ↑ Antipsychotic medications ↑ Anti-Retrovial therapy ↑
Age ↑ Family History / genetics ↑ Gestational Diabetes ↑ Obesity / fat distribution ↑ Physical Activity / fitness ↓ Smoking ↑ Very low birth weight ↑ Depression ↑ Antipsychotic medications ↑ Anti-Retrovial therapy ↑
Dietary Factors• Carbohydratess ↓• Fats ↑↓• Glycemic load ↑• Cereal fiber / whole grain ↓• Dairy products ↓• High fructose corn syrup ↑• Sugar-sweetened bevarages ↑• Alcohol ↓• Coffee ↓
Dietary Factors• Carbohydratess ↓• Fats ↑↓• Glycemic load ↑• Cereal fiber / whole grain ↓• Dairy products ↓• High fructose corn syrup ↑• Sugar-sweetened bevarages ↑• Alcohol ↓• Coffee ↓

Successes and Failures in the Public Health Response to Type 2 DiabetesSuccesses and Failures in the Public Health Response to Type 2 Diabetes

Diabetes Pyramid of Prevention?Diabetes Pyramid of Prevention?
Diabetes
Undiagnosed DM
Adult Prevalence Goal / Intervention Tier
7.6%
2.6%
Prevent MorbidityDetect Early

Classic Levers in the Public HealthResponse to Diabetes
Classic Levers in the Public HealthResponse to Diabetes
Clinical Services
Promotion of Behaviors
Population-TargetedPolicies
Glycemic control BP control Lipid testing and management
Annual eye examinationsFoot care for high risk persons Kidney disease testing Flu immunization Preconception care Diabetes education Case Management Targeted Screening
Education and awareness for:• Physical activity• Reduced Tobacco• Healthy diet• Regular doctor visits• Self monitoring• Self mgt education
• Health care access legislation• Drug and supply reimbursement policies• Population registry and feedback systems

Prevalence of CVD risk factors among U.S. adults with diabetes aged 20-74, according to income group, 1971 to 2006
(* red=low income; green=middle income; yellow=high income)
Prevalence of CVD risk factors among U.S. adults with diabetes aged 20-74, according to income group, 1971 to 2006
(* red=low income; green=middle income; yellow=high income)
High Blood Pressure High Cholesterol
High A1c LevelSmoking
80
70
60
50
40
30
20
4.0
3.0
2.0
Eve
nts
Per
10,
000
Amputation
End Stage Renal Disease
Hyperglycemic Death
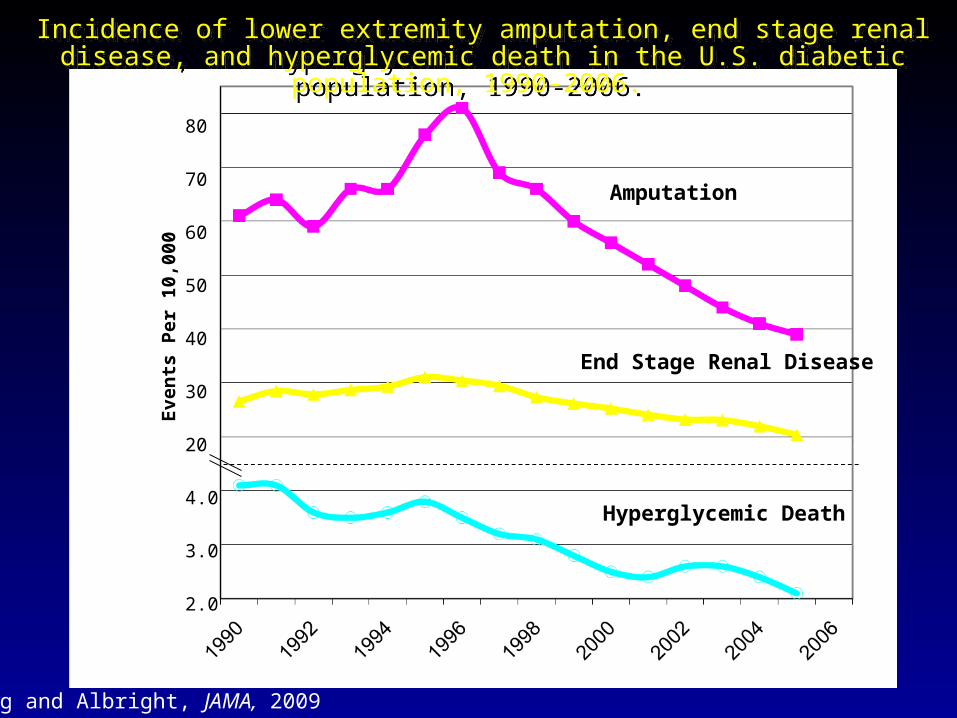
Incidence of lower extremity amputation, end stage renal disease, and hyperglycemic death in the U.S. diabetic population, 1990-2006.
Incidence of lower extremity amputation, end stage renal disease, and hyperglycemic death in the U.S. diabetic population, 1990-2006.
Gregg and Albright, JAMA, 2009

The findings and conclusions in this presentation are those of the author and do not necessarily represent the views of the CDC.
Women
Men
Gregg et al., Ann Intern Med, 2007

What has worked in secondary prevention?What has worked in secondary prevention?
Health Services:Health Services:• Acute care and major medical interventionsAcute care and major medical interventions• Diffusion of new science of risk factor management Diffusion of new science of risk factor management • Emphasis on quality of careEmphasis on quality of care• Health system adaptation and CQIHealth system adaptation and CQI
Health Promotion and Health ProtectionHealth Promotion and Health Protection• Improved education/awareness of diabetes control.Improved education/awareness of diabetes control.• Improved CVD risk factor education and awareness. Improved CVD risk factor education and awareness. • Reduced Tobacco / tobacco legislation• Less directly atherogenic food supplyLess directly atherogenic food supply

Failures in the Public Health Response to Diabetes
Failures in the Public Health Response to Diabetes
Levels of care and preventive health behaviors are still suboptimal. Improvements in blood pressure may have stalled. Disparities remain in renal disease, amputation, acute complications,
and costs. Major differences in morbidity remain between people with and
without diabetes. Diabetes is economically disabling for people and their families. While the average person with diagnosed diabetes has better control
and lower risk of complications, the risk of diabetes or a diabetes complication for the average person in the total population has increased.

Incidence of lower extremity amputation, end stage renal disease, and hyperglycemic death in the U.S. population, 1990-2006.
Incidence of lower extremity amputation, end stage renal disease, and hyperglycemic death in the U.S. population, 1990-2006.

1990 1995 2000 2005 2010
Excess Risk of Complications in the Diabetic Population
1990 1995 2000 2005 2010
Excess Risk of Diabetes in the General Population

Proportion of Participants Developing Diabetes During the Finnish and U.S. Diabetes Prevention Studies
Proportion of Participants Developing Diabetes During the Finnish and U.S. Diabetes Prevention Studies
Tuomilehto, N Engl J Med, 2001; DPP Research Group, N Engl J Med, 2002
0
10
20
30
40
50
0 0.5 1 1.5 2 2.5 3 3.5 4
Study Year
%
Control
Lifestyle
Metformin
0
10
20
30
40
50
0 1 2 3 4 5 6
Study Year
%
Control
Lifestyle
Finland United States

Longer-term Impact? Magnitude of Incidence Reduction in Long-term Diabetes Prevention Legacy Studies
Longer-term Impact? Magnitude of Incidence Reduction in Long-term Diabetes Prevention Legacy Studies
Primary Outcome(RR Reduction)
Extended Outcome
Finnish DPS (Lifestyle) 58% at 3 yr 43% at 7 years
Da Qing Study (Lifestyle) 51% at 6 yr 43% at 20 years
DPP- OS (Lifestyle) 58% at 2 yr 24% at 10 years
DPP-OS (Metformin) 31% at 2 yr 18% at 10 years
Lindstrom, et al. 2006; Li et al. 2008; DPPOS; 2009

Drug Duration(yrs)
Dose / day RR Reduction
Side Effects
DPP, 2002 Metformin 2 1700 mg 31% GI
Stop NIDDM Acarbose 3 300 mg 25% GI
IDPP, 2006 Metformin 2.5 500 mg 26% GI; Hypo
DREAM Rosiglitazone 3 8 mg 60% CHF; wt gain;
NAVIGATOR Nateglinide 5 90mg NS hypo
CANOE Rosi + Metformin
4 4mg;1000mg
69% Diarrhea 16% vs 6%
Chiasson 2002; Ramachandran 2006; Knowler, 2002; Navigator, 2010; Zinman, 2010; Gerstein, 2006

Characteristics of Successful Lifestyle Interventions
Characteristics of Successful Lifestyle Interventions
Intensive: small group, or 1:1; For 6 –12 months Extended: > 2 years Multi-component
• Reduced total intake, reduced fat intake• Exercise• Increased fiber intake• Strongly integrated behavioral principles
Moderate weight loss: • 5-7% weight loss, • 3-4% long-term weight loss maintenance
Intensive: small group, or 1:1; For 6 –12 months Extended: > 2 years Multi-component
• Reduced total intake, reduced fat intake• Exercise• Increased fiber intake• Strongly integrated behavioral principles
Moderate weight loss: • 5-7% weight loss, • 3-4% long-term weight loss maintenance

Current Dilemmas in Diabetes Prevention PolicyCurrent Dilemmas in Diabetes Prevention PolicyCurrent Dilemmas in Diabetes Prevention PolicyCurrent Dilemmas in Diabetes Prevention Policy
High risk vs population approachHigh risk vs population approach Whom to Target?Whom to Target?
• Imminent risk based on glycemia vs broad risk factors vs Imminent risk based on glycemia vs broad risk factors vs everyone?everyone?
Is “screening” for pre-diabetes good policy?Is “screening” for pre-diabetes good policy?• And if so, how should we screen? And if so, how should we screen?
What interventions to apply? What interventions to apply? • Structured and tied to clinical services?Structured and tied to clinical services?
• Broad health promotion?Broad health promotion?
• Population-targeted policies?Population-targeted policies?

Diabetes Pyramid of PreventionDiabetes Pyramid of PreventionDiabetes Pyramid of PreventionDiabetes Pyramid of Prevention
Diabetes
Very High Risk(A1c > 5.7%; IGT; GDM)
Undiagnosed DM
Moderate Risk
Low Risk
Adult Prevalence Goal / Intervention Tier
7.6%
2.6%
~12-15%
~15-20%
~57%
Prevent Morbidity
Detect Early
High Risk (FPG > 100);Central Obesity; HTN, age
What type of intervention for what level of risk?

Summary and Recommendations:Summary and Recommendations:Related to Screening and IdentificationRelated to Screening and Identification
Summary and Recommendations:Summary and Recommendations:Related to Screening and IdentificationRelated to Screening and Identification
• Encourage identification of pre-diabetes and undiagnosed diabetes in adults in clinical settings and established clinical/community partnerships.
o Risk scores most appropriate first stage screening.o More efficient in “integrated” manner, connected to lipid, BP.o Ideal thresholds for referral ultimately depend upon resources.Ideal thresholds for referral ultimately depend upon resources.
• Discourage :o Population-wide blood screening in the absence of risk factor
assessment or in low-risk populations.o Screening in community settings (health fairs, retail stores, etc.)
that lack a direct connections to health care provider.o Screening of youth and adolescents .

Potential Barriers to Effective Clinical-System Based Lifestyle Intervention Programs
Potential Barriers to Effective Clinical-System Based Lifestyle Intervention Programs
Clinical health systems lack structure and expertise to change lifestyle.
Too expensive and not “scalable”. Previous models of clinical based / lifestyle change
have not achieved sustainable reimbursement. Waiting until people have elevated glucose is too late. Diabetes is a common-source epidemic rooted in
culture and society.

Macro-Level Determinants Obesity and Diabetes: Current Debates Over Policy
Strategies
Macro-Level Determinants Obesity and Diabetes: Current Debates Over Policy
Strategies
Physical environment
Food environment Social environment Economy and
poverty
Physical environment
Food environment Social environment Economy and
poverty

Policy Options to Influence Diabetes RiskPolicy Options to Influence Diabetes Risk
Taxation Food and Menu labeling Engage Private Industry Crop subsidy policies Incentives/promotion for community availability and
affordability of foods. Incentives/promotion for community support for
physical activity. Regulation of foods in public areas. School food and physical education policies.

Summary:Summary:
Diverse public health efforts have led to a reduction in several diabetes-related complications for the average person with diabetes but these successes have not kept pace with the increased risk of diabetes incidence.
Diabetes prevention requires a multi-tiered public health response, that includes • Efficient identification and referral of high
risk people to structured lifestyle programs using clinical-community partnerships.

Summary:Summary:
Diverse public health efforts have led to a reduction in several diabetes-related complications for the average person with diabetes but these successes have not kept pace with the increased risk of diabetes incidence.
Diabetes prevention requires a multi-tiered public health response, that includes • Efficient identification and referral of high risk
people to structured lifestyle programs using clinical-community partnerships.
• Broad population –targeted approaches aimed at food, social, and economic environment to ultimately change trends in the epidemic.

Thank youThank you
http://www.cdc.gov http://www.cdc.gov/diabetes/statistics/index.htm http://www.cdc.gov/diabetes/statistics/didit/index.htm
Edward Gregg, PhD: [email protected]
http://www.cdc.gov http://www.cdc.gov/diabetes/statistics/index.htm http://www.cdc.gov/diabetes/statistics/didit/index.htm
Edward Gregg, PhD: [email protected]