The Financing of Academic Health Centers: A …/media/Files/Publications...THE FINANCING OF ACADEMIC...
40
THE FINANCING OF ACADEMIC HEALTH CENTERS: A CHART BOOK James A. Reuter Institute for Health Care Research and Policy Georgetown University August 1997 Support for this research was provided by The Commonwealth Fund. The views presented here are those of the authors and should not be attributed to the Fund or its directors, officers, or staff.
Transcript of The Financing of Academic Health Centers: A …/media/Files/Publications...THE FINANCING OF ACADEMIC...

THE FINANCING OF ACADEMIC HEALTH CENTERS:
A CHART BOOK
James A. Reuter
Institute for Health Care Research and Policy
Georgetown University
August 1997
Support for this research was provided by The Commonwealth Fund. The views presented
here are those of the authors and should not be attributed to the Fund or its directors,
officers, or staff.

ii

iii
TABLE OF CONTENTS
Page PREFACE: WHAT ARE ACADEMIC HEALTH CENTERS? v PART 1: ACADEMIC HEALTH CENTERS AND THEIR FINANCING: AN OVERVIEW 1
Funds Within AHCs Flow Between Three Basic Entities 2 PART 2: ACADEMIC HEALTH CENTER HOSPITALS 3
AHC Ownership and Relationships to Affiliated Medical Schools Vary 5
The Vast Majority of AHC Revenues Are Patient-Related 6
AHCs Depend on Medicare and Medicaid for Almost Half Their Revenues 7
Public AHC Hospitals Depend More on Medicare and Medicaid Revenues 8
Increased Medicaid Payments Have Boosted AHC Revenues 9
AHC Expenses Have Climbed, Inpatient Days Have Decreased 10
AHC Occupancy Rates Top Those of Other Urban Hospitals 11
AHCs’ Costs of Care Are Much Higher than in Non-Teaching Hospitals 12
Despite a Competitive Marketplace, AHCs’ Costs Continue to Grow 13
AHCs Are Losing HMO Patients to Competitors 14
AHCs Are Major Sources of Care for Poor and Uninsured People 15
AHCs Try to Compete with HMOs by Restraining Costs 16
AHCs’ Average Total Margins Are Comparable to Other Hospitals’ 17
The Majority of AHC Medicare Revenues Come from Diagnosis-Related Group Payments 18
AHCs Receive a Large Share of Total Medicare Subsidies 19
PART 3: MEDICAL SCHOOLS AND THEIR FINANCING 21

iv
U.S. Medical School Revenues Have Climbed Rapidly 22
Clinical Services Comprise Nearly Half of Medical School Revenues 23
Gifts and Faculty Practice Plans Are the Fastest-Growing Sources of Medical School Revenues 24
The Majority of Medical School Expenses Come from Teaching, Clinical Services, and Research 25
Spending for Medical School Scholarships and Fellowships Has Grown Fastest 26
Growth in Faculty Members Far Outweighs Growth in Students 27 PART 4: FACULTY PRACTICE PLANS 29
FPP Organizational Structure and Relationship to Parent University and Medical Schools Vary 30
FPPs Operate Under an Array of Legal Arrangements 31
Patient Care Services Account for the Majority of FPP Revenues 32
Charity Care Is a Higher Percentage of Public Hospital FPP Profits 33
The Majority of FPP Expenses Are Human Resource-Related 34

v
PREFACE: WHAT ARE ACADEMIC HEALTH CENTERS? Academic health centers (AHCs)—the preeminent institutions in the American health care system—are interrelated entities comprising a medical school, its affiliated hospitals and outpatient centers, and a faculty practice plan (FPP). Their unique missions are to provide undergraduate and graduate medical education and training, conduct basic science and clinical research on new medical practices and technologies, furnish state-of-the-art medical care for patients with complex illnesses, and care for the poor and medically indigent. Traditionally, AHCs have been leaders in their communities and the health care delivery system.
Historically, AHCs have funded a significant portion of their missions through cross-subsidies from patient care revenues; that is, the affiliated hospitals and FPPs help support these activities through income from patient care. In some cases, support is explicit, in the form of payments for salaries and fringe benefits of residents and faculty. In other instances, support is not monetary, but takes forms such as providing space for teaching or for research laboratories.
Recent changes in the market for health care services may threaten the ability of AHCs to continue financing their missions using these traditional cross-subsidies. Insurers, both public and private, are reducing the rate of growth in payments for services. Doctors and hospitals that fail to respond to these pressures are losing patients as insurers begin to direct their enrollees to lower-cost institutions.
As a consequence, AHC hospitals—whose costs are generally higher than those of other providers—are beginning to lose market share. Faced with a slowdown in the growth of patient care revenues, AHCs are curbing their costs. Although current data do not allow linking reductions in costs directly to cutbacks in mission-related activities, these reductions may take a toll.
This chart book provides information about various aspects of AHC financing. Section 1 gives an overview of AHCs, focusing on general patterns of transfers among their components—AHC hospitals, the medical school, and FPPs. Sections 2 through 4 present financial and other data related to these three major components. Although these data reflect the latest available information, they cannot be used for an exact accounting of the cross-subsidies and transfers among entities. Thus, there may be some duplication in the amounts reported by the various components of an AHC. Efforts are under way to gather more information so that transfers and cross-subsidies can be studied more closely.


1
1. ACADEMIC HEALTH CENTERS AND THEIR FINANCING: AN OVERVIEW AHCs vary widely in organizational structure and in relationships among their affiliated institutions. They are also some of the nation’s largest health care facilities. Overall, they include 125 medical schools with 67,000 undergraduate medical students; 16 schools of osteopathy; and 127 major hospitals closely affiliated with these medical schools.
• AHC hospitals account for roughly 7 percent of all hospital beds, or about 600 beds
each, on average, for a total of some 70,000 beds. • AHC hospitals train about 30 percent of all residents. • The medical schools and their affiliated hospitals employ more than 70,000
physicians. Of the entire physician work force, nearly 10 percent are full-time clinical faculty.
• The total budgets of AHCs were an estimated $62 billion in 1994, with an average annual budget of about $500 million.

2
Funds Within AHCs Flow Between Three Basic Entities
Differences in organizational structures and components make it difficult to generalize about AHCs and their operations. Nonetheless, the three basic entities making up these institutions and the flow of funds among them can be described.
• The faculty practice plan and the affiliated hospitals receive revenues for patient care services. Medicare’s payments to the hospital include subsidies for the program’s share of the direct and indirect costs of graduate medical education. (These are called GME and IME payments, respectively.)
• Both the FPP and the affiliated hospitals provide the medical school with financial support from their clinical revenues. These subsidies may go toward faculty salaries. In the case of the FPP, support may also come from the so-called dean’s tax, which is a direct assessment on the plan’s clinical revenues. The hospital’s payments to the medical school usually are for services provided by the faculty, such as overseeing the hospital’s radiology department.
• Some hospitals and medical schools, principally those that are public institutions, receive tax appropriations from federal, state, and local governments. In some cases, these funds are earmarked for specific purposes such as indigent care or undergraduate medical education. In others, they are for general operating support.
• The medical school also gets revenues from tuition, research grants and contracts, gifts, and endowments. Schools affiliated with a larger university may also receive some support from their parent institution.
Model of Academic Health Center Financing
Medical School
Faculty Practice Plan
Hospitals & OtherPatient Care Sites
Patient CareRevenues
MedicareGME & IME
State & LocalGovernments
Research GrantsEndowments / Gifts
Tuition
Source: Georgetown University Institute for Health Care Research and Policy.

3
2. ACADEMIC HEALTH CENTER HOSPITALS About 125 general urban hospitals are AHC hospitals.1 In addition, nearly all Veterans Administration (VA) hospitals and numerous children’s and other specialty hospitals are closely affiliated with medical schools. Each of these institutions makes significant contributions to the overall financing of an AHC. In some instances, funds are transferred among the institutions. In others, each facility provides separate support for some portion of faculty and resident salaries and fringe benefits. In all cases, these hospitals are sites for clinical training.
The figures in this section compare the performance of AHC hospitals and other types of facilities. The data are based on the universe of hospitals situated in the same 76 metropolitan statistical areas (MSAs) as the 125 urban hospitals classified as AHCs by Georgetown University.2 This approach permits some control over wage variation and is a better measure of the position AHC hospitals have within their own markets.
• Revenues from Medicaid and self-paying patients are the fastest-growing sources of income for AHC public and private hospitals.
• Total AHC hospital expenses have climbed, while admissions have stayed stable and
inpatient days have fallen. • AHC hospitals generally are more expensive than other institutions largely because of
their urban location, the types of specialized services they provide, and their involvement in teaching and research.
1 At this time, there is no generally accepted list of AHC hospitals. In this section, two somewhat
different, but substantially overlapping, sets of hospitals are used. The first definition, developed by the American Association of Medical Colleges (AAMC), counts a hospital as an academic medical center hospital if a majority of the clinical chiefs of services are also department chairs in the affiliated medical school. Using this definition, there are 118 AHC hospitals. The second definition was developed by Georgetown University in consultation with the AAMC and the Association of Academic Health Centers. This list includes 127 hospitals, two of which are located in rural areas: West Virginia University Hospitals, Inc., in Morgantown, and Mary Hitchcock Memorial Hospital in Lebanon, New Hampshire.
2 Sources of data for this section are the American Hospital Association’s 1989 and 1994 Annual Survey of Hospitals, information provided by the AAMC is from its annual survey of hospitals that are members of the Council of Teaching Hospitals, and analysis of the Medicare Cost Reports. Except where otherwise noted, the financial data are based on the universe of 1,708 hospitals that were located in metropolitan statistical areas with at least one AHC in 1989. These hospitals include 125 AHCs, 151 other hospitals that are members of the Council of Teaching Hospitals, and 1,432 other hospitals. Due to mergers and changes in the status of some hospitals, the financial data for 1994 are based on 1,703 reporting institutions.

4
• AHC hospitals and other major teaching hospitals are 80 percent costlier than non-teaching community hospitals. There is a growing gap in spending per case between AHC hospitals and their competitors.
• AHC hospitals are losing market share for health maintenance organization (HMO)
patients to their competitors. • AHC hospitals are the major source of care for the poor and uninsured in their
communities. • While AHC hospitals constitute only a small share of all hospitals, they get a
relatively large proportion of the total subsidies Medicare pays for teaching and treating a disproportionate share of poor patients. Payments related to the direct and indirect costs of teaching represent a nearly a third of Medicare’s payments to AHC hospitals.

5
AHC Ownership and Relationships to Affiliated Medical Schools Vary
Of the 118 hospitals classified as AHCs using AAMC definitions, 23 (19.5 percent) are private and owned by a medical school. A total of 39 hospitals (33.0 percent) are public and share ownership with a public medical school. There are 36 freestanding private AHC hospitals (30.5 percent) and 20 AHC public hospitals (17.0 percent), neither of which have common ownership with a medical school. Of the public AHC hospitals, 71 percent are state-owned, while 29 percent are owned by municipal or county governments.
AHC Hospital Ownership, 1994
Source: Association of American Medical Colleges, 1994.
PublicCommon Ownershipwith Medical School
33.0%
PrivateCommon Ownershipwith Medical School
19.5%
PrivateFree-standing
Hospital30.5%
PublicFree-standing
Hospital17.0%

6
The Vast Majority of AHC Revenues Are Patient-Related
In 1994, the 125 urban AHC hospitals had total revenues of $38.2 billion. These revenues accounted for 22.8 percent of total hospital revenues in the 76 MSAs that had at least one AHC hospital.
• The majority (90.4 percent) of AHC hospital revenues came from Medicaid, Medicare, privately insured, and self-paying patients. Other operating revenues (such as dollars from parking facilities or from state and local governments for graduate medical education) provided 6.4 percent of revenues. Non-operating revenues (such as donations and investment income) comprised only 3.2 percent.
• Managed care plans account for 14.2 percent of AHC hospital patient revenues. • Approximately half of all AHC hospitals receive funds from state and local
governments. These funds—provided primarily to public AHC hospitals—help support indigent care programs, specific services, general operating expenses, medical education, and other activities.
• In 1994, 64 AHC hospitals reported receiving $2.1 billion in support from state and
local governments. Hospitals vary somewhat in how they report these revenues, however. Some include part, or all, of these amounts in net patient care revenues; others report them either as other operating or as non-operating revenues, depending on their intended use.
AHC Hospital Revenues, 1994
Source: Georgetown University Institute for Health Care Research and Policy calculations basedon the Annual Survey of Hospitals, American Hospital Association, 1994.
Patient-Related Revenues90.4%
Other Operating Revenues6.4%
Non-Operating Revenues3.2%

7
AHCs Depend on Medicare and Medicaid for Almost Half Their Revenues
Medicare funds represented 28.9 percent of net patient care revenues in AHC hospitals in 1994. Medicare is also one of the last payers that explicitly pays its share of the costs of AHC hospitals’ training mission. Not only does the program make special payments for the direct and indirect costs of graduate medical education, it also adjusts payments to hospitals that treat a disproportionate share of low income patients. Overall, these payments are a small portion of total Medicare expenditures for hospital services.
• AHC hospitals, other major teaching facilities that are members of the AAMC’s Council of Teaching Hospitals (COTH), and other urban hospitals depend on Medicare and Medicaid for roughly 50 percent of their total net patient revenues.
• AHC hospitals depend more on Medicaid and less on private third-party payers for
patient revenues. That is largely because so many are public hospitals.
22%
3%
8%
7%
29%
31%
M edicare M edicaidOther Govt Private Third Party InsuranceSelf Pay Other
1%
5%
7%
18%
37%
32% 12%
1%
6%
6%
38%
37%
Hospital Revenues by Type of Hospital andSource of Payer, 1994
AHC Hospitals Other Teaching Hospitals Other Urban Hospitals
Source: Georgetown University Institute for Health Care Research and Policy calculations basedon the Annual Survey of Hospitals, American Hospital Association, 1994.

8
Public AHC Hospitals Depend More on Medicare and Medicaid Revenues
These two public insurance programs accounted for nearly 56 percent of total revenues for public AHC hospitals in 1994, but only 48 percent of revenues for private hospitals.
• Private AHC hospitals have higher shares of revenue from privately insured patients (37.1 percent) and from Medicare patients (33.9 percent) than do public hospitals (25.7 percent and 21.6 percent, respectively).
• As for payer mix, private AHC hospitals are more similar to other COTH member
hospitals than to public AHC hospitals. • Public AHC hospitals receive a much higher share of revenues from Medicaid (34.0
percent) and from self-paying patients (11.1 percent) than do private hospitals (13.7 percent and 5.1 percent, respectively).
37.1%
5.1%
13.7% 33.9%
10.2%
M edicare M edicaid Self-Pay Private Health Insurance Other
21.6%34.0%
25.7%
11.1%
7.6%
Source: Georgetown University Institute for Health Care Research and Policy calculations basedon the Annual Survey of Hospitals, American Hospital Association, 1994.
Patient Revenue for AHC Hospitals,by Source of Payment, 1994
Private Public

9
Increased Medicaid Payments Have Boosted AHC Revenues
The establishment of new state policies for distributing Medicaid revenues, especially an increase in disproportionate share (DSH) payments, contributed to a high average annual revenue growth from 1989 to 1994. In 1989, Medicaid accounted for 20.3 percent and 10.7 percent of revenues for public and private AHC hospitals, respectively. By 1994, these shares had grown to 34.0 percent and 13.7 percent.
• While the number of Medicaid admissions and patient days in private AHCs remained relatively constant, Medicaid revenues increased at an annual rate of nearly 14 percent for private AHCs and 25 percent for public AHCs.
• In addition to the higher payments related to DSH policies, public AHC hospitals also
saw a 5 percent annual growth in Medicaid admissions.
13.7%
8.8%
6.1%9.0%
6.1%7.5%6.6%
25.0%
4.2%
21.6%
7.4%5.8%
M ed icare M ed icaid Other G ovt. Self-Pay Th ird Party Other
Private Pub lic
Average Annual Growth in AHC Revenues,by Ownership and Source of Payer, 1989-94
Source: Georgetown University Institute for Health Care Research and Policy calculations basedon the Annual Survey of Hospitals, American Hospital Association, 1989 and 1994.

10
AHC Expenses Have Climbed, Inpatient Days Have Decreased
In 1994, the 125 urban AHC hospitals had total expenses of $36 billion.
• Over the five-year period from 1989 to 94, total expenses in AHC hospitals grew at an average annual rate of 8.1 percent. Adjusted admissions—a measure that reflects a hospital’s inpatient and outpatient activities—grew at an average annual rate of 0.5 percent.
• This growth in expenses occurred during a period when the total number of
admissions remained relatively stable, and the total number of inpatient days declined.
• From 1989 to 1994, inpatient admissions to AHC hospitals declined by 2.6 percent,
or an average annual rate of 0.5 percent. The falloff in inpatient days was somewhat faster, at 2.5 percent per year.
8 .1 %
0 .5 %
-0 .5 %
-2 .5 %
Average Annual Growth in AHC Hospital Expenses, Admissions,Adjusted Admissions, and Inpatient Days, 1989-94
Source: Georgetown University Institute for Health Care Research and Policy calculations basedon the Annual Survey of Hospitals, American Hospital Association, 1989 and 1994.
Admissions Inpatient Days
Expenses AdjustedAdmissions
11
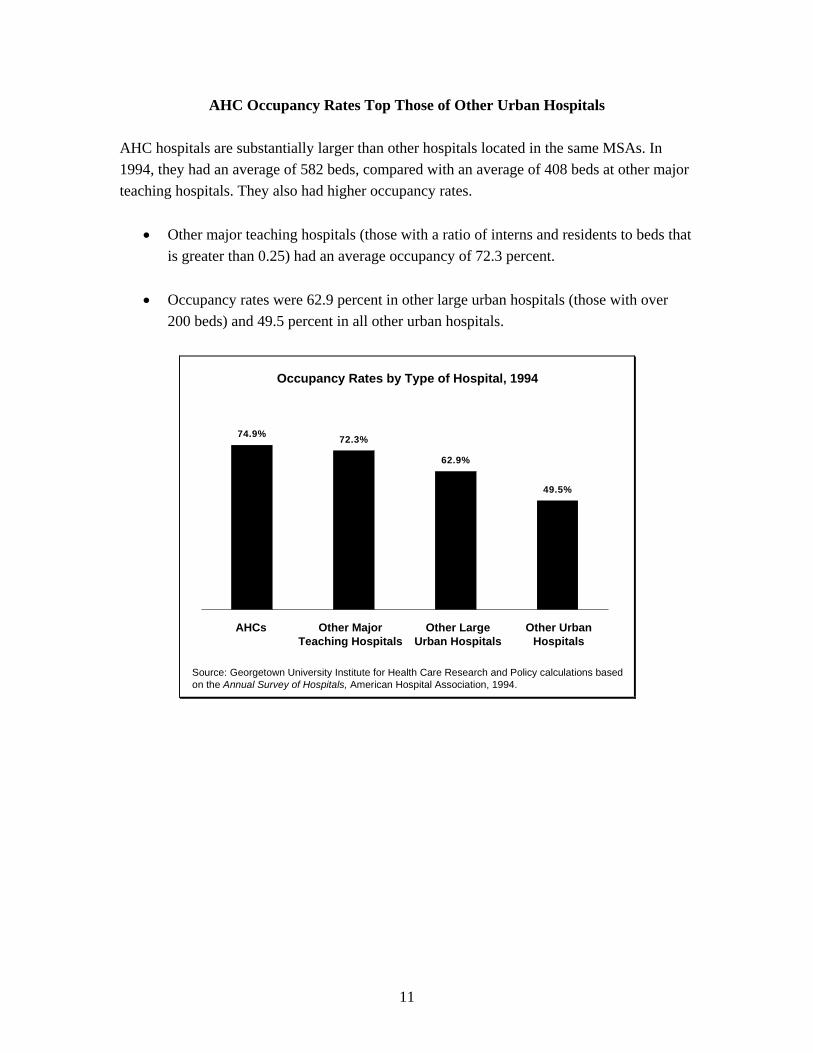
AHC Occupancy Rates Top Those of Other Urban Hospitals
AHC hospitals are substantially larger than other hospitals located in the same MSAs. In 1994, they had an average of 582 beds, compared with an average of 408 beds at other major teaching hospitals. They also had higher occupancy rates.
• Other major teaching hospitals (those with a ratio of interns and residents to beds that is greater than 0.25) had an average occupancy of 72.3 percent.
• Occupancy rates were 62.9 percent in other large urban hospitals (those with over
200 beds) and 49.5 percent in all other urban hospitals.
49.5%
62.9%
72.3%74.9%
Other MajorTeaching Hospitals
Other LargeUrban Hospitals
Other UrbanHospitals
Occupancy Rates by Type of Hospital, 1994
Source: Georgetown University Institute for Health Care Research and Policy calculations basedon the Annual Survey of Hospitals, American Hospital Association, 1994.
AHCs

12
AHCs’ Costs of Care Are Much Higher than in Non-Teaching Hospitals
Higher expenses are partially due to the fact that these institutions serve patients who are sicker or have more complex needs. Other contributing factors are the direct costs of medical education and research, the inefficiencies in patient care that result from the presence of medical students and residents, and the concentration of AHC hospitals in relatively high-cost urban areas.
• Overall, major teaching hospitals are 80 percent costlier than non-teaching community hospitals.3
• Compared with the costs of care in large urban non-teaching hospitals, the indirect costs of teaching add, on average, $2,681 per case (27.7 percent of total costs) for AHCs, and $706 per case (10.6 percent of total costs) for all other teaching hospitals.
• Differences in the cost per case related to case mix and wages account for $1,979 per case (20.4 percent of total costs) for AHC hospitals; $1,129 per case (17.0 percent) for all other teaching hospitals; and $676 per case (12.5 percent) for all other large non-teaching hospitals.
Costs of Care per Case, by Type of Hospital, 1993
$ 4 ,7 1 6$ 4 ,8 1 9$ 5 ,0 2 2
$ 6 7 6$ 1 ,1 2 9$ 1 ,9 7 9 $ 7 0 6
$ 2 ,6 8 1
$ 0
$ 2 ,0 0 0
$ 4 ,0 0 0
$ 6 ,0 0 0
$ 8 ,0 0 0
$ 1 0 ,0 0 0 E d u c a t io n a n d O t h e r M is s io n - R e la t e d A c t iv it ie s
W a g e s a n d C a s e M ix
B a s e
Costs per Case
Note: Sample excludes hospitals with fewer than 100 beds and all rural hospitals.
Sources: The Hospital Cost Report Information System, Health Care Financing Administration,1993; and the Annual Survey of Hospitals, American Hospital Association, 1993.
Other UrbanCommunity Hospitals
Other TeachingHospitals
Academic HealthCenter Hospitals
$9,682
$6,654
$5,392
3 Unpublished analysis by the Lewin Group, 1996, based on the HCFA Hospital Cost Report System,
1993, and the American Hospital Association Annual Survey of Hospitals, 1993. The sample excludes rural hospitals and urban hospitals with fewer than 100 beds. The regression analysis shows the effects of the direct and indirect costs of GME, case mix, and wages on the costs per case of large urban hospitals (more than 100 beds), AHCs, and other teaching hospitals.

13
Despite a Competitive Marketplace, AHCs’ Costs Continue to Grow
Regardless of whether the variations in costs per case can be attributed to mission-related activities or any other factor, these differences are significant in the context of a competitive market for health care services. One way that HMOs and other managed care organizations try to control their costs is by purchasing services for their members at the best possible price. Thus, tend to contract with the lower-cost hospitals that offer the same or similar services to AHCs.
From 1989 to 1994, expenses per adjusted admission in AHC hospitals grew by 7.55 percent per year while those in other hospitals located in the same MSAs grew by only 5.36 percent.
7.55%6.92%
5.36%
AHC Hospitals Other Teaching Hospitals Other Urban Hospitals
Average Annual Rates of Growth in Expensesper Adjusted Admission, by Type of Hospital, 1989-94
Source: Georgetown University Institute for Health Care Research and Policy calculations basedon the Annual Survey of Hospitals, American Hospital Association, 1989 and 1994.

14
AHCs Are Losing HMO Patients to Competitors
The figure below shows the relative risk of HMO patients being treated in different types of hospitals. (Relative risk connotes the share of HMO patients in different types of hospitals relative to the share with other types of private insurance who are treated in the same type of hospital.)
To illustrate, say the relative risk for a certain type of hospital is 1.0. That means the hospital is treating the same share of HMO patients as other privately insured patients in its community. A relative risk of less than 1.0 indicates that the hospital has a lower share of the HMO market than of the private market. The relative risks shown below are based on all discharges in 1994 within each of 24 MSAs in nine states.4
• The relative risk of an HMO patient being treated in an AHC hospital was only 0.8 in 1994. In other words, compared with their share of the non-HMO privately insured market, AHCs were losing nearly 20 percent of the HMO market to other hospitals.
• Large non-teaching hospitals (more than 200 beds) clearly are attracting a
relatively large share of the market for HMO patients. The relative risk of treating HMO patients was 1.1 for this class of hospitals.
Relative Share of HMO Discharges Compared to Other PrivatelyInsured Discharges, by Type of Hospital, 1994
Source: Georgetown University Institute for Health Care Research and Policy calculations basedon 1994 state hospital discharge data (nine states).
AcademicHealth
Centers
OtherTeachingHospitals
SmallNon-
TeachingHospitals
LargeNon-
TeachingHospitals
1.0
0.8
1.0
1.1
1.0
4 The nine states are California, Florida, Illinois, Massachusetts, New Jersey, New York, Pennsylvania,
Washington, and Wisconsin.

15
AHCs Are Major Sources of Care for Poor and Uninsured People
Uncompensated care in AHC hospitals represents 10.7 percent of gross patient revenues. While AHC hospitals have only 16 percent of total beds in their communities, they account for 37.0 percent of the total amount of uncompensated care and 31.2 percent of total payments to hospitals by Medicaid. The high proportion of uncompensated care provided in AHC hospitals is largely because so many (44 percent) are public institutions.
• With respect to the amount of uncompensated care provided, public AHC hospitals look more like the other public hospitals than their private AHC counterparts. Private AHCs hospitals look more like other private hospitals.
• However, within the groups of public and private hospitals, hospitals that are part of
an AHC have the highest levels of uncompensated care.
11.7
20.2
5.85.6
19.3
4.4
10.7
4.55.0
Total Public Private
AHC Other COTH Other
Uncompensated Care as a Percent of Gross Patient Revenues,by Type of Hospital and Ownership Status, 1994
Source: Georgetown University Institute for Health Care Research and Policy calculations basedon the Annual Survey of Hospitals, American Hospital Association, 1994.

16
AHCs Try to Compete with HMOs by Restraining Costs
While the costs for GME, training, and faculty represent only a small percentage of total expenditures, they are growing much more slowly in areas where HMO penetration is high.
• From 1990 to 1993, AHC hospitals’ total costs for graduate medical education rose by 6.6 percent annually in markets with high levels of HMO penetration. By contrast, GME costs went up 10.7 percent a year where HMO penetration was low.
• During this same period, costs for trainees (salaries and fringe benefits) increased, on
average, by 5.6 percent annually in high HMO penetration areas. In markets where HMO penetration was low, these costs climbed 13.0 percent per year.
• AHC hospitals’ spending for faculty grew at an average annual rate of only 3.2
percent in high HMO penetration areas, compared with 4.7 percent in areas having fewer HMOs.
5.6%
3.2%
6.6%
13.0%
4.7%
10.7%
Trainee Faculty Total GM E
High HM O Penetration Low HM O Penetration
Annual Percent Change in Trainee, Faculty, and Total GME Costsfor AHC Hospitals, by HMO Penetration Area, 1990-93
Source: Georgetown University Institute for Health Care Research and Policy calculations basedon the Council of Teaching Hospitals Survey of Hospitals’ Financial and General Operating Data,Association of American Medical Colleges, 1990 and 1993.

17
AHCs’ Average Total Margins Are Comparable to Other Hospitals’
With total revenues of $38.2 billion and net income of $1.4 billion, the 125 urban AHC hospitals had an average total margin (net revenues over expenses) of 3.7 percent in 1994. This average was comparable to that of other hospitals in their communities. Other COTH member hospitals had an average total margin of 3.4 percent; for all other hospitals in these communities, it was 3.9 percent.
Despite the comparability of these averages, 20 of the 108 AHC hospitals providing detailed financial data to AAMC (18.5 percent) reported negative margins for their most recently completed fiscal year. Eight have reported negative margins for two consecutive years.
• In 1994, private AHC hospitals had an average total margin of 4.0 percent; for public hospitals, it was 3.2 percent.
• From 1988 to 1994, total revenues rose 0.5 percent faster than expenses per adjusted
admission in public AHCs and 0.3 percent more rapidly in private AHCs. Consequently, average total margins climbed from 1.1 percent to 3.2 percent in public AHC hospitals and from 2.6 percent to 4.0 percent in private ones.
• Other urban hospitals also were able to increase their margins. For the other 1,583
hospitals in the same MSAs as the AHC hospitals, the average margin increased from 3.0 percent to 3.9 percent.
1.1
2.6
3.2
3.9
3.0
4.0
Public AHCs Private AHCs Other Urban Hospitals
1989 1994
Average Total Margins by Hospital Ownership, 1989 and 1994
Source: Georgetown University Institute for Health Care Research and Policy calculations basedon the Annual Survey of Hospitals, American Hospital Association, 1989 and 1994.

18
The Majority of AHC Medicare Revenues Come from Diagnosis-Related Group Payments
Regular diagnosis-related group (DRG) and outlier payments (for extremely costly patients or for those with long hospital stays) constituted 93.4 percent of total Medicare operating payments to AHC hospitals in 1994. However, because training and indigent care were concentrated in certain institutions, related payments accounted for 56.8 percent of Medicare’s reimbursement to AHC hospitals.
• Payments related to the direct and indirect costs (IME) of teaching represented 31.1 percent of total Medicare payments to AHC hospitals. IME payments accounted for 21 percent and payments for the direct costs of graduate medical education for 10.1 percent.
• Disproportionate share payments made up 12.1 percent of Medicare payments to
AHC hospitals. • Other major teaching hospitals (not shown here), whose ratio of interns and residents
to beds exceeds 0.25, also received a significant share of their total Medicare revenues from the payments for direct medical education (9.3 percent), IME ( 16.0 percent), and DSH adjustments (12.3 percent).
Regular DRGPayments
52.9%
Outliers3.9%
Indirect MedicalEducation Payments
21.0%
DisproportionateShare Payments
12.1%
Direct MedicalEducation Payments
10.1%
Medicare Payments to AHC Hospitals, 1994
Source: Georgetown University Institute for Health Care Research and Policy calculations basedon the Medicare Cost Reports, 1994; and the HCFA Impact File, Health Care FinancingAdministration, 1994.

19
AHCs Receive a Large Share of Total Medicare Subsidies
Medicare makes special payment adjustments to hospitals for teaching and for treating a large share of low income patients. These activities are highly concentrated in AHC hospitals. As a result, while AHC hospitals represent only a small fraction of all hospitals, they receive relatively large shares of the total amount of the special payments Medicare makes. Consequently, AHC hospitals are especially vulnerable to budget proposals that would reduce these payment adjustments.
• Of the $3.9 billion in total indirect medical education payments made by Medicare in 1994, an estimated 42.0 percent went to AHC hospitals.
• Of the $3.8 billion in Medicare’s disproportionate share payments, an estimated 19.3
percent went to AHC hospitals. • Of the $1.8 billion in Medicare payments for the direct costs of graduate medical
education, an estimated 38.5 percent went to AHC hospitals.
42.0%19.3%
38.5%
AHC Share of IM E AHC Share of DM E AHC Share of DSH
AHC Hospitals’ Shares of Total Medicare Payment Adjustments, 1994
Source: Georgetown University Institute for Health Care Research and Policy calculations basedon the Medicare Cost Reports, 1994; and the HCFA Impact File, Health Care FinancingAdministration, 1994.


21
3. MEDICAL SCHOOLS AND THEIR FINANCING In 1996, there were 125 allopathic and 16 osteopathic medical schools, including one federal medical school.5 The number of four-year medical schools has stayed basically the same for the past 15 years. Of the 124 non-federal schools, 73 (59 percent) are publicly sponsored, generally by the state in which they are located. The 51 others (41 percent) are private.6
• Clinical services account for nearly half of medical school revenues. • Public medical schools depend far more heavily on federal, state, and local support
compared with private ones. • Total medical school revenues went up markedly from 1985-86 to 1993-94, partly
because of a substantial increase in the number of clinical faculty. • Teaching, clinical services, and research each were about a quarter of total expenses. • Spending for scholarships and fellowships, for house staff stipends and benefits, and
for program support has grown the fastest.
5 In addition, "feeder schools" provide education comparable to that occurring during the initial years
at a regular four-year medical school. An example of these schools is the University of Minnesota at Duluth.
6 Except as noted, data for this section come from various editions of the AAMC Data Book: Statistical Information Related to Medical Education, and from Krakower, J.K., J.L. Ganem, and P. Jolly, “Review of U.S. Medical School Finances, 1994-1995,” Journal of the American Medical Association 276(9):720-24, September 4, 1996. The data do not reflect information on osteopathic schools.

22
U.S. Medical School Revenues Have Climbed Rapidly
Total medical school revenues (including transfers) reached $29.4 billion in the 1994-95 academic year, up from $6.5 billion in 1980-81. The average annual rate of revenue growth has been rapid, at 9.4 percent over the past five years alone and at 11.4 percent annually since 1980-81.
Over time, medical schools have become more dependent on contributions from their hospitals and faculty practice plans. From 1980-81 to 1994-95, revenues from medical services climbed from over a quarter (29.5 percent) to nearly half (46.8 percent) of total revenues, including transfers from FPPs, reimbursement from hospitals, and grants and contracts for medical care. In 1980-81, federal research and state and local government appropriations each provided nearly as much revenue as clinical services.
• In 1994-95, nearly a fifth (18.7 percent) of medical schools’ revenues came from federally sponsored research, down from 23.2 percent in 1980-81.
• Tuition and fees dropped from 5.4 percent to 4.1 percent of revenues during that
period. • The share of state and local tax appropriations also plummeted, from 21.8 percent to
9.6 percent of total revenues.
14.9%
29.5% 23.2%
5.4%
5.2%
21.8%
Federal Research Tuition and FeesFederal Appropriations Other IncomeState and Local Tax Approp. Medical Service
18.7%
9.6%
46.8%
20.4%
4.1%0.4%
Source: Georgetown University Institute for Health Care Research and Policy calculations basedon 1994 data in the AAMC Data Book, Association of American Medical Colleges, January 1994;and Krakower, J.K., J.L. Ganem, and P. Jolly, “Review of U.S. Medical School Finances, 1994-1995,” Journal of the American Medical Association 276(9):720-24, September 4, 1996.
Revenues of U.S. Medical Schools by Source,1980-81 and 1994-95 Academic Years
1980-81$6.5 billion
1994-95$29.4 billion

23
Clinical Services Comprise Nearly Half of Medical School Revenues
Patterns of revenue sources for medical schools vary by ownership status. In 1994-95, clinical services accounted for 44.9 percent of revenues for public medical schools (33.2 percent from FPPs and 11.7 percent from hospital services). In private medical schools, 48.8 percent of revenues came from clinical services (33.4 percent from FPPs and 15.4 percent from hospital services).
• Compared with private medical schools, public institutions (including the one federal facility) receive far more funding from federal appropriations and state and local government tax appropriations. In public schools, 18.3 percent of revenues came from government sources, while in private schools, the share was only 1.1 percent.
• Public schools are much less dependent on tuition as a source of revenue. Tuition
accounted for 5.5 percent of revenues for private medical schools but only 2.8 percent for public ones.
• Public schools usually receive tuition support from their state and local governments
as part of their tax appropriations. Consequently, they can charge in-state students much less tuition. In public schools, the average tuition in 1993-94 was $8,161 for an in-state student, compared with $17,459 for an out-of-state student. Average tuition in private medical schools was $22,272.
11.7%33.2%
18.3%
26.6%
2.8%
7.4%
Tuition & Fees All OtherHospitals Practice PlansGovernment Appropriations Grants & Contracts
5.5%
9.8%
15.4%33.4%
1.1%
34.8%
Revenues of Public and Private Medical Schools,1994-95 Academic Year
Source: Georgetown University Institute for Health Care Research and Policy calculationsbased on Krakower, J.K., J.L. Ganem, and P. Jolly, “Review of U.S. Medical School Finances,1994-1995,” Journal of the American Medical Association 276(9):720-24, September 4, 1996.
Public Private

24
Gifts and Faculty Practice Plans Are the Fastest-Growing Sources of Medical School Revenues
From 1985-86 to 1993-94, medical school revenues from nearly all sources rose significantly in constant (inflation-adjusted) dollars.7 The primary exceptions were support from parent universities, which declined by 3.3 percent annually, and support from government appropriations, which stayed relatively the same.
• The two fastest-growing sources of revenues were gifts and faculty practice plans, which went up, on average, by 22.5 percent and 14.2 percent annually.
• The rapid escalation in revenues from FPPs was due partly to faculty expansion.
During this period, the number of full-time clinical faculty increased, on average, by 5.7 percent per year.
• After adjusting for inflation and growth in the number of faculty, practice plan
revenues per full-time clinical faculty member grew by 8.1 percent per year. Revenues from hospital programs per full-time clinical faculty member increased by 5.5 percent annually, while those from research per full-time faculty member basically were unchanged. These data are consistent with anecdotal evidence suggesting that medical schools increasingly are emphasizing the clinical revenues generated by FPPs.
Average Rate of Growth in Medical School Revenues,1985-86 to 1993-94 Academic Years, in Constant Dollars
Source: Reuter, J., “Background Report on The Financing of Academic Health Centers,”Georgetown University Institute for Health Care Research and Policy, IWP #96-112, April 1996.
0.2%
14.2%
3.7%
9.0%
22.5%
11.5%
8.8%
5.7%
-3.3%
Govt.Approp.
FacultyPractice
Plans
Tuition& Fees
Endowment Gifts
Parent University
Support
HospitalPrograms
Misc. Grants&
Contracts
7 Constant dollars were calculated using the consumer price index for all urban consumers (CPI-U), all
items.
25
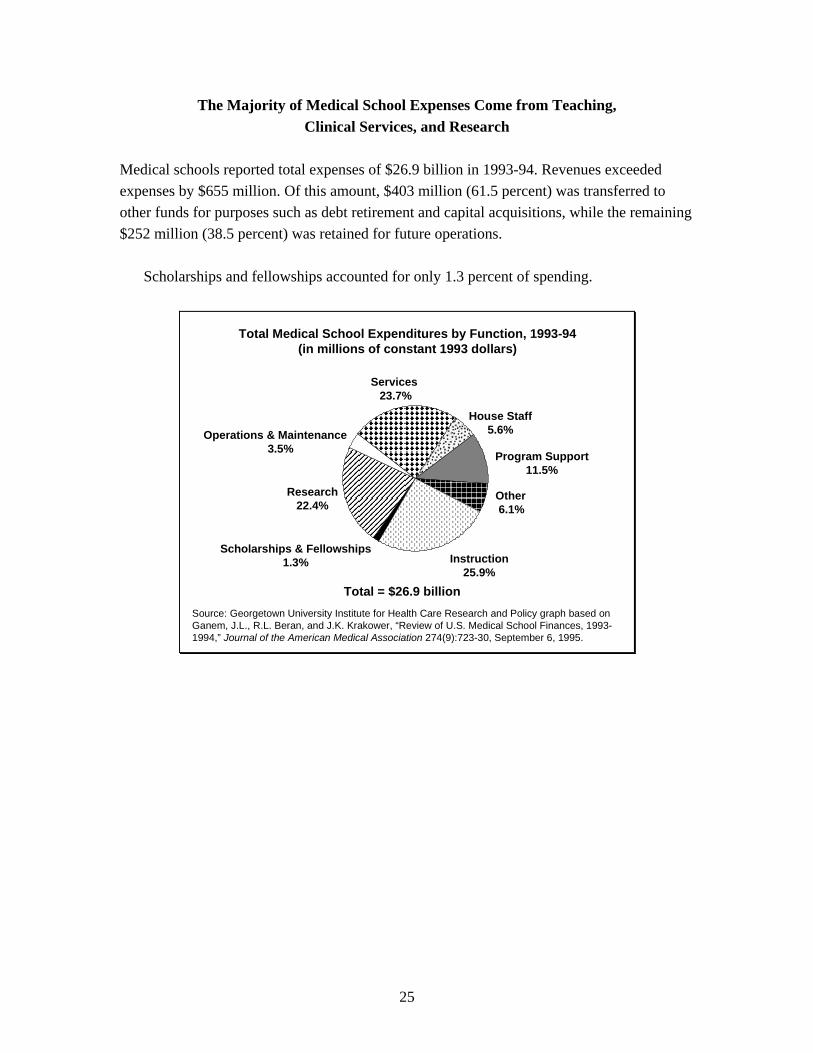
The Majority of Medical School Expenses Come from Teaching, Clinical Services, and Research
Medical schools reported total expenses of $26.9 billion in 1993-94. Revenues exceeded expenses by $655 million. Of this amount, $403 million (61.5 percent) was transferred to other funds for purposes such as debt retirement and capital acquisitions, while the remaining $252 million (38.5 percent) was retained for future operations.
Scholarships and fellowships accounted for only 1.3 percent of spending.
Total Medical School Expenditures by Function, 1993-94(in millions of constant 1993 dollars)
Source: Georgetown University Institute for Health Care Research and Policy graph based onGanem, J.L., R.L. Beran, and J.K. Krakower, “Review of U.S. Medical School Finances, 1993-1994,” Journal of the American Medical Association 274(9):723-30, September 6, 1995.
Services 23.7%
Research22.4%
Program Support11.5%
Scholarships & Fellowships1.3%
House Staff5.6%Operations & Maintenance
3.5%
Other 6.1%
Instruction25.9%
Total = $26.9 billion

26
Spending for Medical School Scholarships and Fellowships Has Grown Fastest
From 1991-92 to 1993-94, the average growth in spending totaled 8.05 percent in constant (inflation-adjusted) dollars.8
• Though actual expenses for instruction rose, on average, by 2.15 percent annually, this rate was much slower than the rate for total expenditures. As a result, instructional expenses fell from 28.0 percent to 26.0 percent of total spending.
• Spending for services accelerated by more than 9 percent annually during this period. • Spending increased the most for scholarships and fellowships and for house staff
stipends and benefits. Growth in the number of residents (7.4 percent) partly explains this trend.
8.05%
2.15%
5.10%
9.06% 9.27%
12.90%
10.50%
4.19%
8.05%
Source: Georgetown University Institute for Health Care Research and Policy graph based onGanem, J.L., R.L. Beran, and J.K. Krakower, “Review of U.S. Medical School Finances, 1993-1994,” Journal of the American Medical Association 274(9):723-30, September 6, 1995.
Average Annual Growth in Medical School Expenditures in Constant Dollars, 1991-92 and 1993-94 Academic Years
Total Instruction Research Services ProgramSupport
Scholarships&
Fellowships
House StaffStipends &
Benefits
Operations&
Management
Other
8 Constant dollars were calculated using the CPI-U, all items.

27
Growth in Faculty Members Far Outweighs Growth in Students
There were 50,532 faculty in 1980-81, and 90,017 by 1994-95. By contrast, the student population rose from 65,189 in 1980-81 to only 66,970 by 1995-96.
Despite a flat growth rate in number of students, the demographics of the student body have changed dramatically. The proportion of first-year students who were white, for instance, dropped from 83.0 percent in 1980-81 to 63.9 percent in 1995-96. The share who were Asian rose from 3.3 percent to 17.9 percent, while that for blacks went up from 5.7 percent to 8.0 percent. The share of females among first-year students jumped from 28.7 percent to 42.7 percent.
In looking at faculty numbers, it is important to discern between preclinical and clinical categories. Preclinical science faculty provide much of the basic sciences education during the first two years of medical school. Generally, these faculty members have Ph.D.s in areas like anatomy, biochemistry, and microbiology. Clinical faculty members generally are M.D.s who teach in traditional medical specialty departments. They provide clinical training by, for example, supervising rotations during students’ last two years of medical school and their residencies. Both clinical and preclinical categories have full-time, part-time, and volunteer (unpaid) faculty.
• The number of full-time preclinical faculty increased by 29.5 percent from 1980-81 to 1994-95; the number of full-time clinical faculty nearly doubled during that period, rising by 94.7 percent.
• The growth in the number of clinical faculty has contributed to the rapid acceleration in
clinical revenues that medical schools receive from faculty practice plans.
16,59812,816
73,419
37,716
0
10
20
30
40
50
60
70
80
1980 -81
1982-83
1984-85
1986-87
1988-89
1990 -91
1992-93
1994-95
Number of Full-Time Faculty in U.S. Medical Schools,1980-81 to 1994-95 Academic Years
Source: Georgetown University Institute for Health Care Research and Policy graph based ondata in the AAMC Data Book, Association of American Medical Colleges, January 1996.
Clinical
Preclinical
Thousands


29
4. FACULTY PRACTICE PLANS The faculty of virtually every medical school participates in some form of a faculty practice plan. These plans provide management and administrative support related to billing for patient care services furnished by a school’s faculty. The FPP’s revenues are used to pay faculty salaries and fringe benefits, and to finance malpractice insurance for participating faculty. In addition, FPPs also may contribute some funds directly to their affiliated medical schools. Of an estimated 125 plans nationwide, data are available for only 56.
• The organizational structure and relationship to the parent institution vary among faculty practice plans.
• Faculty practice plans operate under a variety of legal arrangements. • Patient care services account for well over three-quarters of total plan revenues. • Charity care is a higher share of gross charges in public hospital FPPs than in private
ones, and is provided less often in areas where managed care is widespread.

30
FFP Organizational Structure and Relationship to Parent University and Medical Schools Vary
• Multispecialty FPPs (35 percent) are highly integrated, have common governance and
management systems, and pool their income across departments. Nearly half (46 percent) of all plans affiliated with public schools use this model, compared with only 11 percent of plans associated with private schools.
• Departmental FPPs (7 percent) are the least integrated, have no common governance
structure, and do not pool income across departments. They may share some common management systems.
• Federated FPPs (58 percent) are the most common type. They fall between these two
extremes, with some pooling of income and some common governance and administrative systems. More than three-quarters of the plans associated with private schools use this model.
58%
35%7%
Multispecialty Departmental Federated
48%
6%46%
78%
11%
11%
All Plans Public Plans Private Plans
Source: Georgetown University Institute for Health Care Research and Policy calculationsbased on the 1995 Financial Survey of Faculty Practice Plans, Association of American MedicalColleges, 1996.
Faculty Practice Plan Organizational Structure, 1994

31
FPPs Operate Under an Array of Legal Arrangements
Some FPPs are owned by their parent schools or universities and some exist as separate corporations.
• A majority (56 percent) of FPPs are legally part of their parent university or medical school. Fully 89 percent of private schools used this model. Only 41 percent of the plans associated with public schools reported being legally a part of their university or school of medicine.
• Of all 56 reporting FPPs, 22 percent are organized as separate, not-for-profit
corporations. Except for one, all are affiliated with a public school. This organizational structure may be widely used partly because of the desire to remove the plan’s governance from limits that might be imposed if the plan were under the control of a public university.
56%
4% 5% 13%
22%
Part of Parent Univ ersity or Medical School Separate Not-For-ProfitFoundation Professional CorporationCom bination
16%5%
8%
41%30%
5%6%
89%
All Plans Public Plans Private Plans
Source: Georgetown University Institute for Health Care Research and Policy calculationsbased on the 1995 Financial Survey of Faculty Practice Plans, Association of American MedicalColleges, 1996.
Faculty Practice Plan Legal Structure, 1994

32
Patient Care Services Account for the Majority of FPP Revenues
Average annual revenues for 46 of the FPPs totaled $83 million in 1994.
• The vast majority (84 percent) of total FPP revenues came from patient care services. The remaining revenues (16 percent) came from the university or affiliated hospitals for management or administrative activities, from VA hospitals’ contributions to faculty salaries, and from endowments and gifts.
• Services reimbursed on a fee-for-service basis accounted for 81 percent of net patient
care revenue. Services to managed care enrollees under discounted fee-for-service systems, including most services provided to Medicare and Medicaid managed care enrollees, accounted for 16 percent. The remaining 2 percent was from services paid on the basis of capitation or prepayment.
Faculty Practice Plan Net Patient Revenues, 1994
Source: Georgetown University Institute for Health Care Research and Policy calculationsbased on the 1995 Financial Survey of Faculty Practice Plans, Association of American MedicalColleges, 1996.
Average Total Revenues Source of PatientCare Revenues
OtherRevenues
16%
PatientCare
Revenues84%
Capitatedand Prepaid
3%
Fee-for-Service81%
DiscountedFee-for-Service
16%
33
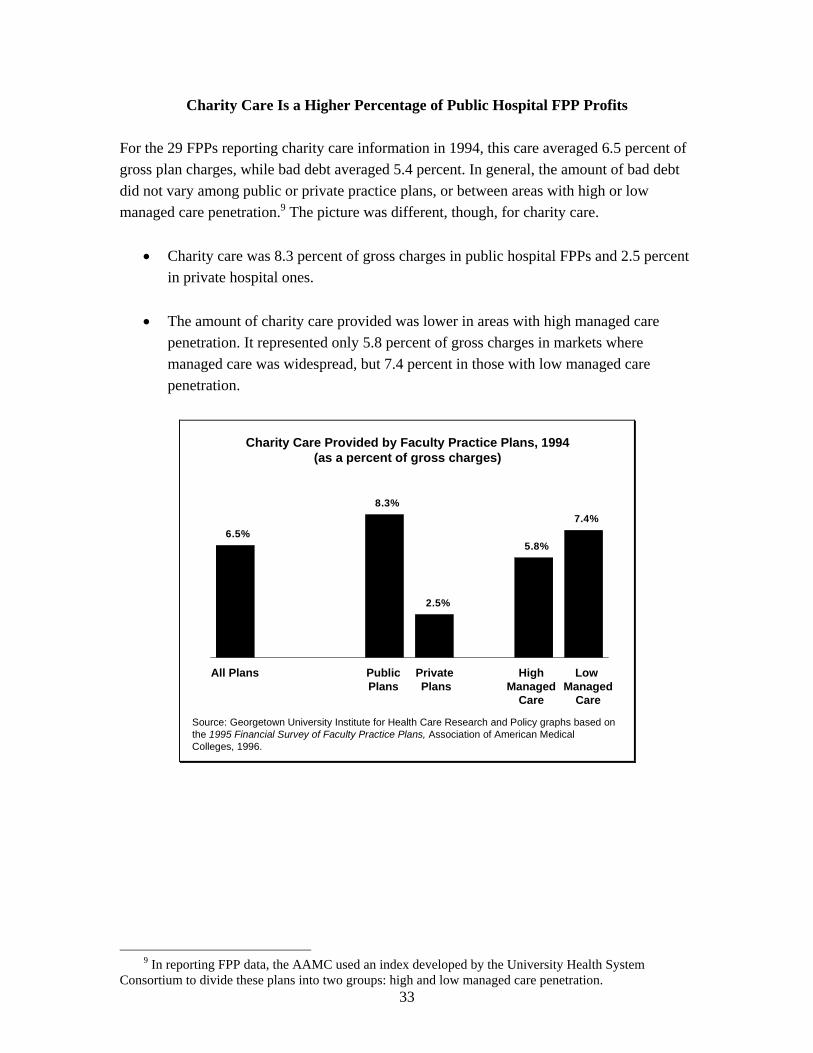
Charity Care Is a Higher Percentage of Public Hospital FPP Profits
For the 29 FPPs reporting charity care information in 1994, this care averaged 6.5 percent of gross plan charges, while bad debt averaged 5.4 percent. In general, the amount of bad debt did not vary among public or private practice plans, or between areas with high or low managed care penetration.9 The picture was different, though, for charity care.
• Charity care was 8.3 percent of gross charges in public hospital FPPs and 2.5 percent in private hospital ones.
• The amount of charity care provided was lower in areas with high managed care
penetration. It represented only 5.8 percent of gross charges in markets where managed care was widespread, but 7.4 percent in those with low managed care penetration.
7.4%
5.8%
2.5%
8.3%
6.5%
Charity Care Provided by Faculty Practice Plans, 1994(as a percent of gross charges)
Source: Georgetown University Institute for Health Care Research and Policy graphs based onthe 1995 Financial Survey of Faculty Practice Plans, Association of American MedicalColleges, 1996.
All Plans PublicPlans
Private Plans
HighManaged
Care
Low Managed
Care
9 In reporting FPP data, the AAMC used an index developed by the University Health System
Consortium to divide these plans into two groups: high and low managed care penetration.

34
The Majority of FPP Expenses Are Human Resource-Related
Faculty practice plans pay for several types of expenses out of their revenues. Among these expenditures are amounts transferred either to the medical school or to an affiliated hospital. FPPs generally pay their own administrative and overhead expenses, although some of these costs may be covered by the medical school or the affiliated hospital. These expenses include billing and collections, clinic operations, capital-related outlays, data processing, and malpractice insurance.
• Administrative and overhead costs averaged about 22.4 percent of plan expenses in 1994.
• Transfers to the medical school of unrestricted funds, as in the case of the dean’s tax, averaged 7.2 percent of expenses, or $5.7 million. An additional 6.9 percent of expenses, or $5.5 million on average, was transferred to the parent university, affiliated hospital, or school of medicine.
• The rest (63.5 percent) was used to fund the plan’s human resource costs, including wages and fringe benefits for faculty, house staff, and other personnel. Faculty compensation accounted for nearly three-quarters (73.7 percent) of human resource expenses.
• FPP compensation to faculty accounted for slightly more than half (54 percent) of total faculty salaries; the university paid the other 46 percent. The FPP bore a slightly smaller share (47 percent) of the costs of faculty benefits, with the university paying the rest.
Average Practice Plan Expenses, by Type of Expense, 1994
Source: Georgetown University Institute for Health Care Research and Policy chart based oncalculations from FY 1994 data from the Association of American Medical Colleges.
Human Resources Costs63.5%
Payments to Medical School University & Affiliated Hospitals
7.2%
Administrative and Overhead Costs
22.4%
Deans’ Tax6.9%
Average Total = $79.8 million