THE FIGHTING POVERTY AND FIGHTING POVERTY AND … · EXECUTIVE SUMMARY 3 EXECUTIVE SUMMARY In the...
152
FIGHTING POVERTY AND FINANCING AFRICA’S FUTURE THE 2014 DATA REPORT THE 2014 DATA REPORT FIGHTING POVERTY AND FINANCING AFRICA’S FUTURE
Transcript of THE FIGHTING POVERTY AND FIGHTING POVERTY AND … · EXECUTIVE SUMMARY 3 EXECUTIVE SUMMARY In the...

FIGHTINGPOVERTY ANDFINANCINGAFRICA’S FUTURE
THE 2014DATA REPORT
THE 2014DATA REPORT
FIGHTINGPOVERTY ANDFINANCINGAFRICA’S FUTURE

The Waterside Market of Monrovia, Liberia.Photo: Mark Fischerhttp://creativecommons.org/licenses/by-sa/4.0/legalcode

1THE 2014 DATA REPORT
02 a Acknowledgements
03 a Executive Summary
15 a Introduction
Section 1
19 a Trends in Development Assistance
Section 2
29 a Reforming ODA: the Composition and Targeting of Aid
Section 3
49 a Profiles of Country Progress 50 Australia 54 Canada 58 European Union 64 France 68 Germany 72 Italy 76 Japan 80 United Kingdom 84 United States 88 Key Impacts of Donor Assistance
Section 4
91 a Trends in African Government Spending 110 a Liberia 112 a Nigeria
115 a Conclusion and Calls to Action
121 a Methodology
129 a Reference Tables
136 a Endnotes
CONTENTS
3
4
2
1 1
2
3
4

2 ACKNOWLEDGEMENTS
ACKNOWLEDGEMENTSThe ONE Campaign would like to thank its board members and trusted advisors: Bono, Joshua Bolten, Howard G. Buffett, Susie A. Buffett, Joe Cerrell, John Doerr, Jamie Drummond, Michael Elliott, Tom Freston, Helene D. Gayle, Morton H. Halperin, Mo Ibrahim, Ngozi Okonjo-Iweala, Ronald O. Perelman, Condoleezza Rice, Sheryl Sandberg, Kevin Sheekey, Bobby Shriver, Mark Suzman and Lawrence Summers, as well as ONE’s Africa Policy Advisory Board members: Melvin Ayogu, Amadou Mahtar Ba, Owen Barder, David Barnard, Erik Charas, Romy Chevallier, Paul Collier, Nic Dawes, Zohra Dawood, Eleni Z. Gabre-Madhin, Neville Gabriel, John Githongo, Angélique Kidjo, Acha Leke, Xiaoyun Li, Jon Lomøy, Bunmi Makinwa, Susan Mashibe, Richard Mkandawire, Archbishop Njongonkulu Ndugane, Arunma Oteh, Rakesh R. Rajani, Mandla Sibeko, John Ulanga and Russell Wildeman. ONE is grateful to its friend and advisor Bob Geldof and its distinguished International Patron, Archbishop Desmond Tutu, for their support and guidance.
Catherine Blampied was lead writer and editor, and managed the report’s production alongside Emily Cabon and Caitlyn Mitchell. Sara Harcourt was a contributing writer and editor, and Isabelle de Lichtervelde was a contributing writer and analyst. The statisticians at the OECD Development Cooperation Directorate provided the data which made this report possible. The team at Development Initiatives, led by Ian Townsend, Rob Tew, Tim Strawson, Guto Ifan and Jordan Beecher provided much of the data analysis.
The following ONE staff and consultants contributed significantly to the production of this report: Daisy Daeschler, Anupama Dathan, Michael Fazzino, Tamira Gunzburg, Tom Hart, Jay Heimbach, Erin Hohlfelder, David Hong, Andreas Huebers, Joseph Kraus, Adrian Lovett, Sipho Moyo, Elisa Narminio, Nachilala Nkombo, Lauren Pfeifer, Philip Reed, Friederike Röder, Kerezhi Sebany, Johanna Stratmann, Eloise Todd and Beate Wedekind.
We are fortunate to have received comments and feedback on drafts of this report from governments, individuals and partner organisations, among them Shreya Basu and Catalina Reyes (Publish What You Fund), Richard Manning (former Chair of the OECD Development Assistance Committee), Elena Mondo and Vivek Ramkumar (International Budget Partnership), David Roodman (independent consultant) and Jean Touchette (OECD Development Cooperation Directorate). We are grateful to be able to draw on a strong group of partners, friends and colleagues around the world who advise ONE in all that we do.
Thanks go to our faithful copy-editor, David Wilson. The report’s design and art direction were guided by the talents of Barney Haward of The Alpine Room, Niko Mayer of Prinz Mayer Designbüro and ONE’s designer Elizabeth Brady.
To the millions of people who work and campaign tirelessly for the end of extreme poverty, thank you. Your perseverance and commitment are truly inspiring.
ERRORS AND OMISSIONSThis report went to print on 28 August 2014. The information in this report was, to the best of our knowledge, current up until this date. We acknowledge that events that occurred after this point may mean that some of the information in this report is out of date.

3EXECUTIVE SUMMARY
EXECUTIVE SUMMARYIn the long journey to end the injustice of extreme poverty and help ensure opportunity and dignity for all, we have arrived at a crossroads. The Millennium Development Goals (MDGs), which are due in one year’s time, have helped to focus international attention and resources towards ambitious goals.1 Tremendous progress has been made in many areas, including tackling global health challenges, child mortality and access to clean water. At the same time, the proportion of people living in extreme poverty has been halved globally and is now on the decline in Africa.2 But in other areas there has been far less improvement, and future progress is under threat from growing challenges such as mass youth unemployment, rising inequality and the impact of climate change.
In the next 12 months, the world will be asked to agree ambitious and inspiring new development goals for the coming 15 years, along with a strategy for their implementation. It is critical that the goals be focused and measurable, and that they build on the momentum of the MDGs while embracing important emerging issues, with a global push to end extreme poverty by 2030.
The political will and financial investment required to achieve this agenda is unprecedented – but at the same time, there is greater wealth in the world than ever before. The question is how best to harness more of this wealth for a positive impact on people’s lives.
Governments of every country – together with citizens, the private sector and others – must now agree a robust plan of action for financing the new Sustainable Development Goals (SDGs). In July 2015, the Third International Conference on Financing for Development will be held in Addis Ababa.3 This will be a critical opportunity to advance discussions on a strategic framework for development finance as we move towards the SDGs. Preparations for this conference are already well under way. At the same time, discussions are progressing in the OECD Development Assistance Committee (DAC) – the membership body for traditional aid donors, which monitors and reports on official development assistance (ODA) – to reform the definition, scope and targeting of ODA, and to agree a new system to measure development finance. This improved measurement system will need to fit with a global financial landscape that is changing rapidly, while ensuring that the poorest and most vulnerable countries continue to receive enough grant aid.
The future of development assistance is changing, but aid investments will continue to play a critical role in many countries. Global patterns of poverty are shifting. Currently, sub-Saharan Africa is home to around a third of the world’s extreme poor, but by 2030 it is expected that the majority – perhaps the vast majority – will live in the region.4 Over half of sub-Saharan African countries are currently ‘least developed countries’ (LDCs), and per capita public expenditures across most of the region are still
extremely low – less than $500 per year.5 LDCs remain highly dependent on aid, which accounts for over 70% of their external flows.6 Moreover, although all financial resources will be important, ODA is the only external flow explicitly aimed at promoting economic development and improving welfare, and it is also much less volatile than other kinds of financing, such as foreign direct investment (FDI).
At the same time, there is enormous potential in African countries for governments to generate more of their own resources for development, and eventually to move beyond dependence on aid. This includes both raising a greater amount of tax revenues and spending that money effectively, transparently and accountably to fight poverty. In the near term, aid can play a valuable role in this process by helping countries to reform their tax systems and budgeting practices.
ONE recognises that many financial flows beyond aid are crucial for developing countries, including private investment, remittances, trade and climate finance. Governments have a responsibility to promote these other flows and, as far as possible, to enhance their impact on poverty - including through coherent public policies. While tracking these myriad flows is beyond the scope of this report, ONE urges governments and other partners to spur a data revolution, including to improve the availability of robust, comparable data on all kinds of financial flows that can impact on development.

4 THE 2014 DATA REPORT
Against this backdrop, ONE’s 2014 DATA Report: Fighting Poverty and Financing Africa's Future seeks to meet three objectives.
First, it continues its longstanding tradition of holding leaders to account and monitoring commitments on development finance. Using the latest official data, the report analyses trends in global and sub-Saharan African ODA, and tracks the European Union’s commitment to achieve 0.7% ODA/gross national income (GNI) by 2015 and to provide half of all increases to Africa. The report includes profiles of the G7 countries and of Australia, holder of the G20 Presidency this year.
Secondly, in recognition of the DAC’s process to refine and update the definition of ODA, the report includes detailed analysis of the composition and targeting of aid, and studies the implications for updating the current, outdated system that determines how concessional loans are counted as ODA.
Finally, the report follows on from last year’s analysis of domestic resources, providing the latest assessment of progress by sub-Saharan African governments against spending commitments in health, agriculture and education.
Through strong community health networks, mass media education and support from the GAVI Alliance and other partners, Rwanda has achieved routine vaccine coverage of about 97 % for diphtheria, tetanus and pertussis, also known as whooping cough. In 2009, it became one of the first African countries to introduce the pneumococcal conjugate vaccine into its routine immunisation programme; pneumococcal disease kills an estimated 800,000 children under five annually, most in the developing world. Photo: Riccardo Gangale/GAVI
2015 poses a historic opportunity. The decisions made next year will test our resolve to confront the economic, social and environmental challenges facing all of us. The recommendations in this report are not exhaustive, but by following them governments around the globe can demonstrate their determination to provide the financial resources required to end extreme poverty and create a fairer, more equal and more prosperous world.

5
US
D b
illio
ns
140
% o
f GN
I
120
100
80
60
40
20
02004 2005 2006 2007 2008 2009 2010 2011 2012 2013
Global ODA SSA ODA Global ODA / GNI SSA ODA / GNI
Source: OECD DAC Table 1, 2a and Preliminary Data (April 2014)
EXECUTIVE SUMMARY
KEY FINDINGS1. Official development assistance rebounded in
2013, but most donors have not made good on their aid commitments and are not channelling a high enough proportion of aid to the poorest countries.
ODA increased to $131.2 billion in 2013 after a two-year decline, but donors’ total aid last year represented only 0.29% of their collective GNI – a lower ratio than in 2009 and 2010, and far below the UN target of 0.7% ODA/GNI. Progress is very uneven across donors. Some countries, including the UK, Japan, Germany and Norway, increased their ODA significantly in 2013. The UK achieved 0.7% ODA/GNI
for the first time, and joined Norway, Sweden, Luxembourg and Denmark as the only DAC donors meeting that promise. On the other hand, some former development champions are slashing their aid budgets, including France, Canada, Australia and the Netherlands. Total EU aid bounced back by 3.3% to $73.8 billion; however, the EU is still $51.9 billion short of meeting its commitment of 0.7% (and based on current projections, its contribution will rise by only $8.5 billion in 2015).
After a decline and then a freeze in aid to sub-Saharan Africa in 2011 and 2012, flows to the region increased in 2013 by an estimated 6.9%
to $42.7 billion. However, findings from the DAC’s 2014 survey on forward spending plans suggest that aid to LDCs, the large majority of which are in sub-Saharan Africa, is likely to decrease in the coming years.
As a whole, DAC donors spent just 0.09% of their collective GNI on aid to LDCs in 2012, well below the UN target of 0.15–0.20%. Only eight donor countries met the target. LDCs remain highly dependent on aid, which accounts for over 70% of their external flows and is equivalent, on average, to half of their tax revenues.7 Liberia demonstrates the continued need for donor support. Its economy is growing at 10% a
Figure 1: Global and Sub-Saharan African ODA (total net, excluding debt relief), 2004 – 13
0.00 %
0.05 %
0.10 %
0.15 %
0.20 %
0.25 %
0.30 %
0.35 %

6 THE 2014 DATA REPORT
year, investment is booming and it achieved an impressive tax-to-GDP ratio of almost 29% in 2012, yet tax revenues at even this level amounted to just $132 per capita. If all DAC donors had spent 0.20% of GNI on LDCs, this would have raised an additional $50 billion in 2012 for the world’s poorest and most vulnerable countries.
The UN target of 0.15– 0.20% of GNI, however, is very dependent on a donor’s overall ODA/GNI ratio and
does not necessarily represent a significant proportion of aid going to LDCs. A new target of 50% of all aid to be allocated to LDCs is now being called for, including by LDCs themselves in the Cotonou Agenda adopted in July 2014. Only one donor country (Ireland) allocated half of its total aid to LDCs in 2012, and nine donors allocated less than a quarter. If all DAC donor countries had allocated half of their aid to LDCs in 2012, this would have raised an additional $22 billion for those countries. Given that DAC donors
allocated only 0.28% of their GNI to ODA in 2012, the 50% volume target to LDCs would have amounted to only 0.14% of their GNI. Therefore it would have been less ambitious than the existing 0.15 – 0.20% ODA/GNI target. However, in the long run, as donors progress towards meeting the 0.7% ODA/GNI target, the 50% volume target would mean significantly more ODA for LDCs than the existing GNI target, as it would imply 0.35% of GNI.
Figure 2: ODA to LDCs, as % of ODA and % of GNI, 2012
% o
f OD
A
60 %
50 %
40 %
30 %
20 %
10 %
0 %
0.00 % 0.05 % 0.10 % 0.15 % 0.20 % 0.25 % 0.30 % 0.35 % 0.40 %
% of GNI
Source: OECD DAC Table 2a
Note: The size of the bubble represents the absolute volume of ODA to LDCs in 2012. ODA is total net, excluding debt relief. ONE does not count an estimated portion of regional and global unallocated ODA to LDCs.

7
RECOMMENDATIONS FOR POST-2015 FINANCING
• In the spirit of renewed global partnership for 2015, every donor government must explicitly recommit to the longstanding international commitment to deliver ODA at a level of at least 0.7% of GNI, and set out a concrete timetable to increase their aid budgets towards this goal as soon as possible.
Those countries that have met the 0.7% target should continue to lead by example, and encourage others to do so.
• Donors should better target their development assistance to the poorest and most vulnerable
countries by committing to channel at least half of their development assistance to these countries, in line with what LDCs themselves are calling for. The existing UN 0.15 –0.20% ODA/GNI benchmark could be used as an interim target by some donors that are already close to meeting it.
2. The existing architecture for measuring development finance is not fit for purpose. Decisions made by countries over the coming months will have a real impact on the future of aid quality and credibility beyond 2015.
ODA includes a mix of different financial flows that are spent on development activities, within both developing (recipient) countries and donor countries. Between 2000 and 2012, 17% of total aid never left donor countries, amounting to $250 billion that was attributed to debt relief and in-donor expenditures (such as refugee costs, student costs and unallocated administrative costs). While it can be argued that some of this in-donor spending benefits developing countries, it is not clear how much does, and there is a lack of transparency and consistency among donors
in reporting these costs. Reporting of debt relief is also problematic. Donors agreed in Monterrey in 2002 to provide debt relief without detracting from aid. However, in practice, they can report as aid the full value of the loan (including interest) at the point of debt forgiveness, leading to an ‘artificial’ boost to ODA. Donors should get credit for the allocations they make for bilateral debt cancellation in their annual budgets (for example, this could be included in the new proposed measure of 'total official support for development' (TOSD). But exactly how much should be counted is currently unclear, due to lack of transparency by donors in terms of budget provisions for debt cancellation.
ODA includes a mixture of grants and loans. Bilateral ODA loans from DAC countries increased by 34%
between 2006 and 2012, from $10.6 billion to $14.2 billion. A few major donors – France, Germany, Japan and the EU institutions – are driving these growth trends. Future projections suggest a continued increase in loans to middle-income countries, while core aid to LDCs is likely to continue to decrease. Since public spending is very low in LDCs, their ability to sustain debt is limited and other external flows are very volatile, grants remain the most appropriate instruments for these countries. In addition, analysis has revealed that a significant volume of loans is being extended to countries suffering from, or at high or moderate risk of, debt distress. The DAC should introduce a debt sustainability criterion for loans to count as ODA, which takes into account the recipient country’s level of indebtedness and risk of distress, its income level and the purpose of the funding.
EXECUTIVE SUMMARY

8 THE 2014 DATA REPORT
Existing rate: 10%
Alternative rate 1: 5%
Alternative rate 2: Differentiated Discount Rates (DDRs)
Source: OECD DAC CRS database and OECD repository of DDRs
Note: Data in USD billions (2013 prices). In consistence with the DAC grant element calculations that are based on the commitment value of loans, the values are gross loan commitments. Some of these loans will have been disbursed in 2012, but some may be disbursed in a subsequent year. Loans from Belgium and Australia do not equal zero but are too small to be distinguished on the graph. However, the effect of using alternative rates for measuring these loans is negligible.U
SD
bill
ions
9
8
7
6
5
4
3
2
1
0EU
InstitutionsJapan France Germany Korea Portugal Italy Belgium Australia
Figure 3: Value of ODA Loan Commitments Passing the 25% Grant Element Test under 10%, 5% and DDR-Based Reference Rates, 2012

9EXECUTIVE SUMMARY
The DAC is also reviewing its rules to determine whether and how much of a loan can count as ODA. The current rules only count loans as aid if they are made on sufficiently concessional, or generous, terms. The ‘discount rate’8 used to determine whether or not a loan meets these terms is outdated. It allows more loans to count as aid, which effectively inflates the total value of aid. Currently, it is even possible for donors to report loans that they do not subsidise – and on which they even make a profit – as ODA. More
realistic discount rates have been proposed.9 If these rates had been in effect, the total value of loan commitments counting as aid in 2012 could have been between $14.9 and $19.1 billion less.
A second problem with the current system is that as long as its ‘grant element’ (the portion of the loan that the developing country does not have to pay back) meets a certain threshold, the full value of the loan qualifies as aid, whereas a loan whose grant element
falls even slightly below this threshold does not count at all. Dropping this arbitrary threshold, and counting only the grant component as ODA, would overcome this problem and would give some level of credit for all development loans. Nevertheless, all loans should have to fulfil a debt sustainability criterion (see above) to count as ODA.
RECOMMENDATIONS FOR POST-2015 FINANCING
• DAC member states should agree upon a redefined concept of ODA that (i) excludes debt relief; (ii) excludes the majority of in-donor costs; and (iii) includes only the grant component of concessional lending (calculated at a realistic discount rate).
• Concessionality rules should be amended to meet today’s market realities and to prevent the practice among some donors of providing unsubsidised loans as
ODA, through adopting more realistic discount rate(s) to calculate the concessionality level of loans.
• To guide the choice of grant or loan, an adequate debt sustainability assessment should be made, which takes into account the recipient country’s level of indebtedness and risk of distress, among other factors. The DAC should adopt a debt sustainability criterion, whereby loans must pass
this assessment in order to count as ODA. To avoid imposing a debt burden on LDCs, donors must publicly commit to the OECD DAC recommendation of providing at least 90% of their aid to LDCs in the form of grants. In addition, the international community should establish a fair, impartial and transparent international debt arbitration mechanism to ensure efficient restructuring of debts when a debt crisis arises.

10 THE 2014 DATA REPORT
3. Overall financial resources – including domestic government spending – in Africa are growing rapidly, but they vary widely between countries. Furthermore, data suggests that most African governments are not meeting their own commitments to allocate sufficient spending to key development sectors such as health, agriculture and education.
Total government expenditures across sub-Saharan Africa have almost tripled since 2004, to $376 billion. However, this headline figure masks significant differences between countries. South Africa, Nigeria and Angola alone account for 63% of this total. Most countries still have a shockingly low level of per capita spending, owing to a limited tax base and the loss of potential government revenue through corruption and illicit financial flows. Four countries spent less than $200 (Purchasing Power Parity (PPP)) per person in 2012 (less than the UN’s minimum threshold to provide a basic package of public services), and a further 22 spent less than $500 PPP. This compares with average spending by
OECD countries of more than $15,000 per capita. These low levels of government spending demonstrate the continued need for external development assistance to help provide the most basic services. Even these figures can be misleading, since in many countries it is very unlikely that the poorest citizens actually receive this amount, given the inequitable distribution of public resources (for example, as in Equatorial Guinea).
Furthermore, most African governments are not meeting their own commitments to allocate a specific proportion of their budgets to sectors that drive development outcomes for all citizens. It should also be noted that rigorous and comparable analysis on these commitments is hindered by poor budget data in most sub-Saharan African countries and a lack of agreement as to precisely which expenditures should count towards which sectoral targets.
Health: On average in 2010–12, only six of 43 countries in sub-Saharan Africa met the Abuja commitment to allocate 15% of their national budgets to health. Over these three years, an additional $54.8 billion would have been mobilised for health had all countries met their promises. Thirteen countries achieved the minimum absolute per capita spending level on health (as estimated by the World Health Organization) of $54, but 26 countries did not even meet half of this level.
Agriculture: On average in 2008–10, only eight of 41 countries in sub-Saharan Africa met the Maputo commitment to allocate 10% of their national budgets to agriculture. Over these three years, an additional $18.5 billion would have been mobilised for agriculture had all countries met their promises.
Education: Between 2010 and 2013, only one of 33 countries in sub-Saharan Africa met the Dakar commit ment to allocate 9% of GDP to education. Only 10 countries met the UNESCO target of allocating 20% of their national budgets to education.

11
Equatorial Guinea 11,896 ASeychelles 9,374 ABotswana 5,600 A
Gabon 5,041 ASouth Africa 3,593 A
Mauritius 3,592 ANamibia 2,649 A* Angola 2,484 A
Swaziland 1,952 ARepublic of Congo 1,670 A
Cape Verde 1,401 A* Lesotho 1,287 A
Ghana 1,034 A* São Tomé and Príncipe $ 5
00
– $ 9
99
Nigeria* Chad
* The Gambia* Senegal
KenyaCameroon
$ 200
– $ 49
9
* Zambia* Tanzania
Côte d’Ivoire* South Sudan
* Rwanda* Burkina Faso
* Malawi* Mozambique
* Benin* Comoros
* Guinea* Togo
* Sierra Leone* Uganda
* Guinea-BissauZimbabwe
* Eritrea* Burundi* Ethiopia
* Mali* Liberia
* Niger Below
$20
0
* Central African Republic* Madagascar
* DR Congo
0 100 200 300 400 500 600 700 800 900 1,000
Figure 4: Annual Government Spending Per Capita, 2012
Source: IMF World Economic Outlook (April 2014)
Note: Data is adjusted for international purchasing power parity (PPP) to provide a more relevant comparison between countries in terms of what these spending levels could achieve. Government expenditures per capita (PPP) are calculated using IMF data on GDP per capita (PPP) and expenditure as a percentage of GDP. The following countries are omitted from this analysis due to lack of data: Somalia and Sudan.
* Least Developed Countries

12 THE 2014 DATA REPORT
RECOMMENDATIONS FOR POST-2015 FINANCING
• African governments should broaden their tax base by designing progressive fiscal policies and strengthening public financial management and tax administration. They should reduce corruption, stem the tide of illicit financial flows that deprive citizens of valuable public resources and improve the governance of natural resources, including implementation of the Extractive Industries Transparency Initiative (EITI) standard to ensure the full public disclosure of payments to governments by oil, gas and mining companies.
• Donors should play their part by boosting the amount of development assistance dedicated to strengthening public financial management (which currently stands at around 1% of total ODA) and particularly domestic
resource mobilisation (which is estimated at just 0.07% of total ODA). They should also lead by example in improving the transparency and predictability of their aid flows, and ensuring that as much as possible can be recorded on-budget in recipient countries.
• Donor countries also have significant opportunities to address their role in maintaining tax havens, attracting illicit financial flows and enabling tax evasion and corruption. This should be done through swiftly implementing legislation requiring oil, gas and mining firms to disclose payments to governments on a country-by-country and project-by-project basis, by pursuing international agreements on the automatic exchange of tax
information between countries and by implementing public registers of the ownership of companies.
• African governments must meet their own commitments to prioritise spending on programmes and in sectors that make the largest contributions to poverty reduction, including health, agriculture and education. They should use 2015 as an opportunity to listen to the demands of their citizens, especially the extreme poor, and to make new and specific commitments – backed up by adequate budgetary resources – to address these needs. Budgeting should be participatory, outcome-based and aligned with national development and poverty reduction strategies.

13EXECUTIVE SUMMARY
4. Data availability and transparency is one of the biggest constraints facing the new development agenda. If the new SDGs are to succeed, it will take a ‘data revolution’ to improve the availability, transparency and quality of statistics on development financing, including domestic government spending, and the outcomes achieved by these resources.
The state of budget information across most of sub-Saharan Africa is extremely poor. Only two African countries (South Africa and Uganda) are rated well on the 2012 Open Budget Index. Even where governments do publish data on their spending, it is often outdated, difficult to access
or use, unreliable, insufficiently (or overwhelmingly) detailed, and insufficiently standardised to enable comparison between countries. We urgently need a much clearer picture of domestic government spending and how it is impacting people’s lives.
Donors have improved the transparency of their aid by publishing information online, but progress has been uneven, and almost all donors are currently off track to meet their commitments to fully implement the International Aid Transparency Initiative (IATI) standard by 2015. Among emerging donors, some have committed to making more data available on their development assistance, but currently there is little standardised, comparable information available.
Citizens, and their representatives in parliaments and civil society organisations, require access to accurate, comprehensive and timely data so that they can follow the money and hold governments to account. Taxpayers in donor countries have a right to know how their money is being used and the results it is achieving. In developing countries, it is crucial for governments to track how much money is flowing into and out of public accounts, and for people to know what resources are supposed to be flowing into their local hospitals, clinics and schools. Furthermore, data on financial inputs should also be linked to performance data so that governments themselves, and the citizens they serve, can track resources to results.
RECOMMENDATIONS FOR POST-2015 FINANCING
• Donors should meet their commitment and fully publish to the IATI standard by 2015. Emerging donors should also improve the transparency of their development cooperation by publishing detailed, comprehensive and timely data on their development assistance. In line with their
responsibility as major providers of development assistance, they should also considering publishing to IATI.
• African governments should systematically publish – in accessible, useful and machine-readable formats
– accurate, timely and (as far as possible) standardised and comparable revenue and expenditure data, including – at a minimum – both approved/enacted budgets and year-end reports. Governments should also link financial data to performance data so that citizens can track resources to results.

14 INTRODUCTION
ALTHOUGH GLOBAL DEVELOPMENT ASSISTANCE HAS BOUNCED BACK, NOT ALL GOVERNMENTS HAVE PRIORITISED AID, OR WORSE, HAVE DISPROPORTIONATELY FOCUSED THEIR SPENDING CUTS ON THEIR AID BUDGETS. 1
NEARLY ALL LEAST DEVELOPED COUNTRIES REMAIN STRONGLY DEPENDENT ON AID. HOWEVER, MOST DONORS ARE FAILING TO TARGET ENOUGH OF THEIR ASSISTANCE TO THE POOREST AND MOST VULNERABLE COUNTRIES. 2
WHILE IN THE MAJORITY OF DEVELOPING COUNTRIES THE PRIMARY MEANS AVAILABLE TO END EXTREME POVERTY ARE THE NATIONAL GOVERNMENT’S OWN RESOURCES, A SHOCKINGLY LOW LEVEL OF ANNUAL PER CAPITA SPENDING REMAINS THE STARK REALITY IN MOST SUB-SAHARAN AFRICAN COUNTRIES. 4

15INTRODUCTION
INTRODUCTIONAlmost 15 years ago, world leaders signed on to the Millennium Declaration, a global compact with a set of eight ambitious goals to halve poverty and hunger, achieve universal primary education, reduce child mortality, halt the spread of HIV/AIDS and fulfil many other human development outcomes.1 In the ensuing years, the Millennium Development Goals (MDGs) have helped to focus international attention and resources on those targets. In 2002, the first International Conference on Financing for Development was held in Monterrey, Mexico. It led to major commitments to mobilise domestic and international resources, to promote international trade as an engine for development, to increase international cooperation, to ensure sustainable management of external debt, as well as debt relief efforts, and to enhance the coherence and consistency of the international monetary, financial and trading systems.2 Major campaigns such as Make Poverty History mobilised millions of people and helped push world leaders to make financing commitments to achieve the MDGs. Notably, the 2005 G8 Summit in Gleneagles resulted in a promise by the world’s largest economies to double their aid to Africa by 2010 and to cancel multilateral debt for the poorest countries.
Today, however, the global landscape is very different. While international development assistance has increased to unprecedented volumes, the global economic crisis has dampened the momentum on aid
among many traditional donors. At the same time, many middle-income economies that were ‘emerging’ back in 2000 are now prominent powers on the world stage, many with their own development cooperation programmes, changing the rules and expectations of the traditional North–South relationship. Much of the developing world has experienced rapid economic growth, particularly across sub-Saharan Africa, where regional GDP growth has averaged 4.9% since 2000.3 Patterns of poverty are also changing: remarkably, the proportion of people living in extreme poverty globally has halved since 1990, but the locus of poverty is shifting increasingly to sub-Saharan Africa and to fragile states.4 By 2030, the majority – and potentially, the vast majority – of the world’s extreme poor are predicted to be living in sub-Saharan Africa.5
Against this backdrop, we are now approaching another monumental year. Over the next year, the world will agree on a set of new, ambitious and inspiring Sustainable Development Goals (SDGs) and a financing strategy for the 15 years to come. The world has seen tremendous improvements in many areas covered by the MDGs, but progress has stagnated, or even gone into reverse, in others. Additional threats such as rising inequality, high youth unemployment and stalled action on climate change are more prominent and alarming than ever before.
We are now approaching a crossroads in the fight against extreme poverty. In September 2015, governments around the globe will sign onto a new development agenda. In the same year, there is a confluence of other important international events that could shore up awareness of and support for this new development agenda. In global health, the GAVI replenishment will take place in Berlin in January with the aim of raising $7.5 billion from donors in order to save an estimated five million children’s lives over the next five years. Germany is also the host of the 2015 G7 summit, to take place in Bavaria in June, where leaders will place special attention on ending extreme poverty and promoting the new SDGs. The formal 20th anniversary of the UN’s Conference on Women in Beijing will also take place next year, at which the UN will assess progress on implementing the Beijing Platform for Action. A high-level commitment meeting is expected in September 2015. In addition, the African Union is raising awareness of gender equality by declaring 2015 the AU ‘Year of Women’s Empowerment and Development towards Africa’s Agenda 2063’. The UN’s 21st session of the Conference of the Parties on Climate Change (COP21) will take place in Paris in December, with the intention of signing a global agreement to cut greenhouse gas emissions.

16 INTRODUCTION
Finally, a series of general elections across the world (including in the United Kingdom, Canada, Tanzania, Nigeria and Ethiopia) will install world leaders whose responsibility it will be to take forward and enact the post-2015 agenda.
Next year poses both a challenge and a momentous opportunity for humanity. The decisions made will test our resolve to confront the economic, social and environmental challenges facing the world, but if we choose to act wisely, we will be charting a course towards a fairer, more equal and more prosperous world.
Undoubtedly, the scale of political will, financial investment, and ingenuity and innovation required to solve these challenges is unprecedented. Estimates of the financial resources needed to achieve sustainable development, including plugging infrastructure gaps and reaching international climate targets, are easily in the range of trillions of dollars per year. In the past, experts have costed the elimination of extreme poverty in the range of hundreds of billions of dollars per year.6 Given that global savings are in the range of $18 trillion annually, and global assets are well over $200 trillion, the quantity of overall resources potentially available is not in question.7 The question, then, is how best to incentivise and harness a greater quantity and quality of diverse financial resources to meet development needs. The Third Conference on Financing for Development will be held in Addis Ababa, Ethiopia
in July 2015: this will be a critical opportunity to link the UN process on deciding the new SDGs with discussions to agree a robust and strategic framework for how they will be implemented. It will bring together a full range of stakeholders from all over the world, and will reflect changes in the international development system since the last conferences in 2008 (Doha) and 2002 (Monterrey).
Boosting the quantity and quality of all financial resources that can contribute to dvevelopment, including private flows such as investment (FDI) and remittances, as well as domestic and international public spending, will be crucial for finishing the job on the current MDGs and accomplishing ambitious future goals. In light of this, ONE presents the 2014 DATA Report: Fighting Poverty and Financing Africa's Future. Each year, ONE’s DATA Report holds governments to account; in this year’s report we focus primarily on public finance (both international and domestic) in the new development agenda.
In the poorest countries, where government resources to spend on each citizen and other international flows tend to be extremely limited, aid continues to represent a vital resource for poverty reduction. This year’s DATA Report continues to track the most recent trends in official development assistance (ODA) in Section 1, using the latest OECD Development Assistance Committee (DAC) preliminary data for 2013.
The concept and definition of ODA itself is under debate in the OECD DAC this year, presenting a real opportunity to reform and strengthen the international system of tracking development finance. Section 2 looks in depth at the composition and targeting of ODA, including aid to least developed countries (LDCs), in-donor expenditures and debt relief, and the concessionality of ODA loans.
Section 3 profiles the progress of major donors in terms of the quantity and quality of their aid as well as their efforts to enhance financial transparency. As in past years, the DATA Report highlights the G7 and European Union, and this year also examines Australia, in recognition of its importance as the 2014 G20 President and host of the G20 summit in November.
Continuing its focus on sub-Saharan Africa, the 2014 DATA Report also looks at domestic resources in the region. Africa has experienced record economic growth over the past decade, and many countries are seeing huge increases in the volume of resources available to them. However, per capita public expenditures are still very low in most African countries, and in many cases are not being sufficiently channelled towards pro-poor development. Section 4 presents a snapshot of overall flows to the region and focuses on tracking country progress against domestic spending commitments on health, agriculture and education. It includes two case studies, highlighting the diversity of development
17INTRODUCTION
finance across the region by examining two West African countries – Nigeria and Liberia – both of which are fragile states with very high rates of extreme poverty, but which possess different resources and are facing extremely different challenges. Finally, Section 4 highlights the
need for a data revolution in development, including better data on domestic budgets, aid and other forms of financing – which can be directly linked to development outcomes – to enable citizens (and, indeed, governments themselves) to follow the money, track resources to results and hold their leaders to account.
The report ends with 11 calls to action to the world’s leaders to provide the resources required to achieve the SDGs and to eradicate extreme poverty from the face of the earth in the next 15 years.
AID LOANS ARE AN IMPORTANT SOURCE OF DEVELOPMENT FINANCE, BUT THE RULES TO ASSESS THEIR CONCESSIONALITY MUST BE REFORMED. LOANS SHOULD BE PROVIDED ONLY IN THE RIGHT CIRCUMSTANCES AND ONLY TO THOSE DEVELOPING COUNTRIES THAT CAN SUSTAIN THE DEBT. 2
WE URGENTLY NEED A MUCH CLEARER PICTURE OF DOMESTIC GOVERNMENT SPENDING AND HOW IT IS IMPACTING PEOPLE’S LIVES. CITIZENS, AND THEIR REPRESENTATIVES IN PARLIAMENTS AND CIVIL SOCIETY ORGANISATIONS, REQUIRE ACCESS TO ACCURATE, COMPREHENSIVE AND TIMELY DATA SO THAT THEY CAN FOLLOW THE MONEY AND HOLD GOVERNMENTS TO ACCOUNT. 4

18 THE 2014 DATA REPORT

19
Section 1
TRENDS IN DEVELOPMENT ASSISTANCE
The Rwesero Health Clinic in Northern Province in Rwanda. Photo: Riccardo Gangale/GAVI
1
TRENDS IN DEVELOPMENT ASSISTANCE

20 THE 2014 DATA REPORT
Since 2006, ONE’s annual DATA Report has held leaders accountable on their commitments to development assistance. Up to 2011, it tracked the G8’s momentous Gleneagles commitment to double aid to Africa, which expired in 2010. Since 2012, it has assessed the efforts of OECD donors in providing development assistance, especially in sub-Saharan Africa, the region that is home to a third of the world’s extreme poor. This includes monitoring progress by European Union (EU) member states against their commitment to achieve 0.7% official development assistance (ODA)/gross
national income (GNI) by 2015, and to allocate half of all aid increases to Africa.
From 2004 to 2010, global aid was on the rise, fuelling progress on the MDGs and saving millions of lives. While the G8 did not meet their Gleneagles commitments to sub-Saharan Africa, they did increase aid to the region by $13.9 billion in real terms, meeting 60% of total pledges.1 However, in 2011 and 2012 ODA declined significantly, as the effects of the global financial crisis began to catch up with government budgets. Although
the EU still has commitments in place to increase aid to 0.7% ODA/GNI, 2012 saw a 7% decline in overall ODA by the EU15,2 with disproportionate cuts of 10% to sub-Saharan Africa.3
This section draws on data from the OECD DAC’s preliminary estimates of 2013 ODA levels, analysing the most recent trends in development assistance. It looks at global aid levels, as well as at aid to sub-Saharan Africa, using ONE’s methodology, and judges the EU’s performance against its 2015 targets.
MEASURING DEVELOPMENT ASSISTANCE Official development assistance (ODA) is the concept that defines what OECD Development Assistance Committee (DAC) donors can count as aid. This definition is agreed upon by all 24 members of the DAC (including the EU) and allows for comparison of donors while providing an assurance that their investments are being used for development purposes.
The 2014 DATA Report monitors ODA in constant 2013 prices, allowing us to assess the real value of development assistance flows over time. The figures
(unless otherwise stated) exclude bilateral debt relief. While debt relief is immensely important in freeing up domestic government expenditures that would otherwise go to service debt payments, the rules for counting bilateral debt cancellation as ODA (which are set by donors themselves) overstate its value to both donor and recipient. As pointed out in previous reports, debt relief has provided an artificial boost to ODA in some years.
There is a significant time lag in the OECD DAC’s publication of ODA data: preliminary data for 2013 only became available in April 2014, and final data will not be
published until December 2014. However, we recognise that the national budgets that will determine spending in 2014 and even 2015 have been agreed or are in the process of being agreed now. Where possible, our profiles take account of other more recent sources of information in our qualitative assessment of progress and the outlook for aid in each country, but in order to maintain consistency and accuracy, we use only DAC data in most of our quantitative analysis. ONE uses GDP growth projections published in the OECD’s Annual Economic Outlook to estimate future gross national income (GNI) and hence the target volume of ODA in 2014/15.

21
GLOBAL ODA REBOUNDED IN 2013After two consecutive years of worrying decline, total aid flows were on the rise in 2013, increasing to their highest ever level. Global development assistance from DAC donors reached $131.2 billion, a 5.3% increase from the year before. As a percentage of GNI, however, aid was only 0.29% collectively across DAC donors. This was below the high of 0.31% in 2009 and 2010, and far below the UN target of 0.7% ODA/GNI. Although global development assistance has bounced back, not all governments have prioritised aid, or worse, have disproportionately focused their spending cuts on the aid budget.
EUROPEAN UNION COMMITMENTS
In 2005, following on from the 2002 UN Conference on Financing for Development, the European Council committed to reach a target of 0.7% ODA/GNI by 2015, and also set the same interim targets for member states. For member states that joined the EU after 2002, individual 2015 targets of 0.33% were set. Three EU countries have their own targets that
exceed 0.7% ODA/GNI: Denmark, Luxembourg and Sweden, which have committed to 1.0%.
At the same time, the EU committed to provide half of all ODA increases (compared with 2004 baseline levels) to Africa. While the EU considers the Africa target to be collective, ONE assumes a ‘fair share’ division and applies the target of 50% of increases to those individual EU member states that are analysed in the donor profile
section. When monitoring collective EU progress towards the Africa target, we assess the 19 EU member states that are also DAC members, and for which we have data on Africa ODA flows in 2013. In this analysis we apply a collective 0.7% ODA/GNI target, and assume that half the volume increases towards this 2015 total should be allocated to Africa. Member states also agreed to increase their aid to sub-Saharan Africa, but without a specific target.
TRENDS IN DEVELOPMENT ASSISTANCE
US
D b
illio
ns
140
% o
f GN
I
120
100
80
60
40
20
0
2004 2005 2006 2007 2008 2009 2010 2011 2012 2013
0.35 %
Figure 1: DAC Donors’ Global ODA (total net, excluding debt relief), 2004 – 13
0 %
0.20 %
0.10 %
0.15 %
0.30%
0.25 %
0.05 %
91.5100.8 100.3 103.2
116.8 125.7 130.9 128.3 124.6 131.2
ODA ODA / GNI
Sources: OECD DAC Table 1 and Preliminary Release (April 2014)
Note: ODA in 2013 constant prices. Net ODA excludes bilateral debt relief, and includes both bilateral and multilateral flows.
1

22 THE 2014 DATA REPORT
2012 2013Volume change
Percentage change
ODA as % of GNI 2013
Australia 5,073.2 4,846.1 -227.1 -4.5% 0.34%
Austria 1,052.3 1,126.7 74.4 7.1% 0.27%
Belgium 2,143.5 2,268.7 125.2 5.8% 0.45%
Canada 5,348.0 4,911.1 -436.9 -8.2% 0.27%
Czech Republic 222.8 212.3 -10.5 -4.7% 0.11%
Denmark 2,820.1 2,927.9 107.8 3.8% 0.85%
Finland 1,386.2 1,435.4 49.2 3.6% 0.55%
France 11,061.6 10,694.6 -367.0 -3.3% 0.38%
Germany 13,075.2 13,937.3 862.1 6.6% 0.37%
Greece 330.6 305.0 -25.6 -7.7% 0.13%
Iceland 27.7 35.2 7.6 27.4% 0.26%
Ireland 837.7 822.0 -15.8 -1.9% 0.45%
Italy 2,866.4 3,248.8 382.4 13.3% 0.16%
Japan 8,627.7 9,604.5 976.8 11.3% 0.19%
Korea 1,664.1 1,743.6 79.6 4.8% 0.13%
Luxembourg 425.5 430.7 5.2 1.2% 1.00%
Netherlands 5,667.3 5,373.8 -293.5 -5.2% 0.66%
New Zealand 466.1 461.3 -4.7 -1.0% 0.26%
Norway 4,772.2 5,556.7 784.5 16.4% 1.07%
Poland 436.8 474.3 37.6 8.6% 0.10%
Portugal 608.1 484.1 -124.0 -20.4% 0.23%
Slovak Republic 83.4 85.4 2.0 2.4% 0.09%
Slovenia 60.6 60.2 -0.4 -0.7% 0.13%
Spain 2,041.9 1,955.5 -86.4 -4.2% 0.14%
Sweden 5,487.1 5,831.2 344.1 6.3% 1.02%
Switzerland 3,076.0 3,197.9 121.8 4.0% 0.47%
United Kingdom 13,877.2 17,825.9 3,948.7 28.5% 0.72%
United States 31,088.7 31,357.7 269.0 0.9% 0.19%
EU institutions 18,320.1 15,924.1 -2,396.1 -13.1% n/a
DAC total 124,628.0 131,213.9 6,585.9 5.3% 0.29%
DAC EU19 total 64,484.4 69,499.7 5,015.3 7.8% 0.41%
G7 85,944.8 91,579.9 5,635.0 6.6% 0.26%
Table 1: DAC Donors’ Global ODA, 2012 and 2013 (USD millions)
Sources: OECD DAC Table 1 and Preliminary Release (April 2014)
Note: ODA in 2013 constant prices. Net ODA excludes bilateral debt relief, and includes both bilateral and multilateral flows. The EU institutions line is not additional and is not included in the totals; the majority is imputed to member states and thus is already accounted for under the EU donor amounts above.

23TRENDS IN DEVELOPMENT ASSISTANCE
Figure 2: EU Global Progress to 2015 Target
Actual ODA Projected ODA Path to Target
Sources: OECD DAC Table 1 and Preliminary Release (April 2014); European Commission, Council Conclusions on EU Development Aid Targets (May 2014); OECD Economic Outlook (November 2013); IMF World Economic Outlook (April 2014)
Note: This figure includes ODA from the 28 EU member states, as well as ODA loans from the European Investment Bank (EIB) that are not imputed back to member states. Under the agreement established in April 2013, the DAC does not report EIB loans for the period 2008–10 in its ODA statistics, and so the data includes an artificial ‘jump’ between 2010 and 2011 (for more details, see the Methodology section). Target ODA for 2014–15 is calculated using a smoothed 2004 baseline (whereby multilateral contributions in 2004–05 are averaged) and GNI projections for 2015 (based on 2014–15 GDP growth projections by the OECD, where available, and the IMF for remaining countries). Net ODA is in 2013 constant prices, excludes bilateral debt relief, and includes both bilateral and multilateral flows. Debt relief data is not available for the nine non-DAC EU donors and is thus not included; however, these amounts are negligible. Projected ODA does not exclude debt relief.
US
D b
illio
ns
140
120
100
80
60
60
40
20
02004 2005 2006 2007 2008 2009 2010 2011 2012 2013 2014 2015
$51.9 billion increase would be needed between 2013 and 2015 to meet collective 0.7% target
In 2013, the majority of DAC donors (17 out of 28) increased their development assistance. The UK contributed 60% of the total DAC increase, dedicating an additional $3.95 billion in aid in order to achieve its longstanding commitment of 0.7% ODA/GNI – making it the first G7 country to do so. Other donors that significantly boosted their aid in 2013 include Japan (up by $976.8 million), Germany (up by $862.1 million) and Norway (up by $784.5 million). Five countries now meet the 0.7% benchmark: Norway, Sweden, Luxembourg, Denmark and the UK. The Netherlands had achieved 0.7% every year since the mid-1970s, but officially dropped off that list for the first time in 2013, due to a $293.5 million cut to its aid budget.4
In addition to the Netherlands, several other donors also made notable cuts to their development assistance budgets in 2013. The biggest proportional decrease came from Portugal, which slashed its ODA levels by 20% ($124 million). Those donors that saw the largest volume reductions were Canada (down by $436.9 million), France (down by $367 million) and Australia (down by $227.1 million). These decreases are particularly concerning given that all of these three countries have in the past been strong aid champions. We provide further detail on these and other donors’ performances in the in-depth donor profiles later in the report.
In 2013, the EU (including the 28 member states and ODA loans from the European Investment Bank (EIB),
which are not imputed to member states) saw its total aid bounce back to $73.8 billion, a 3.3% increase from 2012, although not reaching its 2011 peak. ODA from the 28 EU member states alone increased by 7.7%. Despite this recent turnaround, the EU remains far off track on meeting its 2015 commitment to collectively spend 0.7% ODA/GNI. Over the next two years, the EU as a whole would need to collectively increase aid by $51.9 billion to meet its 2015 target (see Figure 2). According to the European Council’s latest report on EU aid targets, the EU is projected to reach a collective ODA figure of $82.3 billion by 2015 (including EIB loans), representing a collective ODA/GNI of only 0.45% (though up from 0.42% in 2013).5
125.7
82.373.8
1

24 THE 2014 DATA REPORT
ODA TO SUB-SAHARAN AFRICA HAS INCREASED, BUT NOT ALL DONORSARE PRIORITISING THE REGION
Amid overall aid growth in 2013, flows to Africa, including to the sub-Saharan region, also increased to their highest ever levels. This is particularly welcome after the decline and then the freeze in aid to the region in 2011 and 2012. Total DAC ODA to Africa rose by an estimated 4.8% (slightly less than the global increase) to $47.5 billion. Development assistance to sub-Saharan Africa rose by an estimated 6.9% (proportionally more than the global increase) to $42.7 billion. While these figures are based on preliminary estimates and will not
be confirmed and updated until December 2014, the estimated sub-Saharan African increase represents an additional $2.8 billion compared with 2012.
The share of overall aid flows allocated to sub-Saharan Africa has remained fairly constant (between 31% and 33%) for the past eight years, having risen slightly from 2004 and 2005. However, individual donors have seen marked changes. Over the period 2004 – 13, most donors made tremendous increases in development
assistance to the region. For example, Canada and the US almost doubled their aid over this period, the UK and Japan more than doubled it, and Australia more than tripled it. South Korea saw an exceptional six-fold increase (although starting from much lower levels than the others). However, four countries – Denmark, Greece, the Netherlands and Spain – actually gave less assistance to the region in 2013 than they did in 2004, showing that not all DAC donors are prioritising the world’s poorest region.
ODA ODA / GNI
Sources: OECD DAC Tables 1 and 2a and Preliminary Release (April 2014)
Note: ODA in 2013 constant prices. Net ODA excludes bilateral debt relief, and includes both bilateral and imputed multilateral flows. SSA imputed multilateral flows in 2013 are estimated by ONE.
Figure 3: DAC Donors’ ODA to Sub-Saharan Africa (total net, excluding debt relief), 2004 – 13
US
D b
illio
ns
45
% o
f GN
I
40
35
30
25
20
15
10
5
02004 2005 2006 2007 2008 2009 2010 2011 2012 2013
27.4
0.07%0.07%
0.08% 0.08%
0.09%0.09% 0.09%0.10%
0.10%0.10%
28.833.2 33.0
38.139.2
41.3 39.9 40.042.7
0.00%
0.02 %
0.04%
0.06 %
0.08 %
0.10 %
0.12 %

25TRENDS IN DEVELOPMENT ASSISTANCE
Figure 4: Change in DAC Donors’ ODA to Sub-Saharan Africa, 2004 – 13
Sources: OECD DAC Tables 1 and 2a and Preliminary Release (April 2014)
Note: The vertical axis represents percentage change in ODA to sub-Saharan Africa between 2004 and 2013; thus negative values indicate that the donor provided less ODA to the region in 2013 than in 2004 (in real terms). The size of each bubble represents absolute volume change in ODA to the region over the same period. For countries with negative percentage change (in purple), the size of the bubble represents negative volume change. South Korea is outside the bounds of the chart, having increased aid to sub-Saharan Africa by 548% between 2004 and 2013. Slovenia is not shown since its aid to sub-Saharan Africa in 2004 was zero. Countries are arranged alphabetically from left to right.
Rea
l ter
ms
% c
hang
e
300
250
200
150
100
50
0
– 50
1

26 THE 2014 DATA REPORT
In the past year, 17 donors boosted their aid flows to sub-Saharan Africa, while 11 reduced their allocations to the region. Over half of the DAC’s collective increase was accounted for by the UK’s increase of almost $1.5 billion, in line with its overall rise to meet 0.7%. Other donors with notable volume increases include France, which cut its overall aid but increased assistance to sub-Saharan Africa by $565.8 million (16.6%), Japan ($663 million – a 25.1% increase) and Belgium ($345.5 million – a 41.3% increase). Among those countries that cut aid to
sub-Saharan Africa was Canada, with an estimated decline of more than 8% ($191 million), while preliminary estimates suggest that Germany reduced aid to the region by more than 17% ($630.8 million).
While ONE’s primary focus is on sub-Saharan Africa, each year we also track progress against the EU’s commitment to the continent as a whole, i.e. including North Africa. In 2005, when the EU agreed to reach 0.7% ODA/GNI by 2015, it also committed to
provide half of its aid increases (compared with a 2004 baseline) to the continent. However, data on 2013 ODA flows to Africa is available only for the 19 EU countries that are also DAC members. Data for the nine non-DAC EU member states, or for the EIB, is not available. While EU19 aid to Africa increased by 6.2% in 2013, it remains very far off the goal. As Figure 5 shows, the EU19 would need to collectively increase their aid to the continent by $31.3 billion over the next two years in order to meet the 2015 target for Africa increases.
Figure 5: EU19 Progress to Africa Target Increase
Actual Increase Path to Target Increase
Sources: OECD DAC Table 1 and Preliminary Release (April 2014); OECD Economic Outlook (November 2013)
Note: This figure includes ODA from the 19 EU member states for which data is available, on the basis of a collective 0.7% target and allocating half of total increases to Africa. Target ODA for 2014–15 is calculated using a smoothed 2004 baseline (whereby multilateral contributions in 2004–05 are averaged) and GNI projections for 2015 (based on 2014–15 GDP growth projections by the OECD, where available, and the IMF for remaining countries). Net ODA is in 2013 constant prices. Net ODA excludes bilateral debt relief, and includes both bilateral and multilateral flows.
US
D b
illio
ns
40
35
30
25
20
15
10
5
02004 2005 2006 2007 2008 2009 2010 2011 2012 2013 2014 2015
$31.3 billion increase would be needed between 2013 and 2015 to meet Africa target increase
37.6
6.4

27TRENDS IN DEVELOPMENT ASSISTANCE
CONCLUSIONAfter two consecutive years of decline, the turnaround in global aid flows in 2013 is a positive sign that many donors are getting back on track towards their commitments to development. However, this momentum must be maintained over the next two years and beyond, to help ensure the best possible progress by the end of 2015 and to lay solid foundations for an ambitious post-2015 agenda. The UK on its own accounted for the bulk of the 2013 ODA increase among DAC donors; now other countries will need to step up their support. Aid to Africa as a whole and sub-Saharan Africa was also on the rise
in 2013, giving hope after the recent stagnation. Yet development assistance to Africa has not seen the surge that leaders envisioned when they made their commitments almost a decade ago. The share of total aid allocated to sub-Saharan Africa has remained more or less flat over the past decade, and findings from the DAC’s 2014 survey on forward spending plans suggest that ‘country programmable aid’ (core aid actually flowing to developing countries) is likely to decrease to least developed countries LDCs in the next few years, particularly those in Africa. These decreases in grant aid
to LDCs are likely to be matched by estimated increases in loans to middle-income countries.6
Section 2 explores the composition and targeting of aid flows in more detail, providing donor breakdowns of (i) how much aid actually reaches recipient countries (as opposed to ‘in-donor costs’ and debt relief); (ii) the share of ODA allocated to LDCs; and (iii) the split between grants and loans, together with analysis of the concessionality of DAC donors’ ODA loans.
1

28 THE 2014 DATA REPORT

2929REFORMING ODA: THE COMPOSITION AND TARGETING OF AID
2
Section 2
REFORMING ODA: THE COMPOSITION AND TARGETING OF AID
A nurse at Merawi health centre in northern Ethiopia prepares a measles vaccine for delivery. Photo: Pete Lewis / DFID

30 THE 2014 DATA REPORT
For more than 60 years, development aid has been used as a tool to provide support for countries and people in need. From the Marshall Plan of post-war Europe to the MDGs of today, ODA has changed in both quantity and composition over the years, driven by recipients’ needs but also by donors’ political and economic situations and the changing international context. Yet the standard definition of what counts as ODA has not changed since 1971 (see Box 1).
In today’s economic environment and diverse development financing landscape, the concept of ODA is increasingly being challenged by both critics and champions of aid as to whether it is fit for purpose. Debates around the definition of ODA generally run along four lines:
• Is ODA reaching those who need it most? In the majority of developing countries, the relative size of ODA has shrunk compared with other external flows and, furthermore, in more than two-thirds of developing countries, governments’ own resources surpass total external flows.2 These trends are likely to continue. However, ODA continues to be a crucial source of financing for the poorest and most vulnerable countries. Nearly all least developed countries (LDCs), which have a more limited capacity to mobilise domestic revenues or attract other external flows, remain strongly dependent on aid.3 Thus it is important to ensure that ODA is targeted to the countries where it is most needed.
• Does ODA include too little? ODA does not capture the total portfolio of all development-related finance (such as climate finance, security assistance, risk-mitigating mechanisms or a diverse range of innovative finance mechanisms), and thus it has been argued that a narrow definition of ODA could be acting as a disincentive to these other instruments.4 For instance, guarantees or export credits are not recorded as aid, despite generating significant resources for developing countries.
• Does ODA include too much? Conversely, there is a strong argument for excluding certain kinds of contributions from ODA, including a proportion of the administrative costs of operating aid programmes, debt relief and spending in donor countries on students and refugees from developing countries, and development awareness activities. Furthermore, it is notable that the reporting of these kinds of expenditure, in particular refugee costs, is lacking in transparency and consistency among DAC donors.5
• How can loan concessionality best be measured? ODA includes grants and concessional loans to developing countries. In order for a loan to count as ODA, the DAC uses the ‘grant element test’: the whole loan must include a grant element of at least 25%, evaluated at a discount rate of 10%.6 This 10% rate was set in the 1970s when global interest rates were much higher than today, meaning that there was quite a close correspondence between 10% (seen as a measure of the opportunity cost of governments raising the money) and market interest rates. However, in today’s environment of lower interest rates the use of the 10% discount rate effectively overvalues the grant element of loans, making it possible for donor countries to report unsubsidised – and even potentially profitable – loans as ODA.7
These debates highlight the need to refresh the current development finance measurement system to better capture both ‘donor effort’ (i.e. identify all development-relevant budgetary expenditures) and ‘recipient benefit’ (i.e. identify actual transfers to developing countries).
BOX 1: WHAT IS ODA?
Since its adoption 45 years ago by the OECD Development Assistance Committee (DAC), ‘official development assistance’ (ODA) has been the dominant measure of the financial resources provided as aid in support of international development.
The DAC defines ODA as flows to countries and territories on the DAC List of ODA Recipients and to multilateral institutions which are:— provided by official agencies; — administered with the promotion of the
economic development and welfare of developing countries as its main objective;
— concessional in character and convey a grant element of at least 25%.1

3131REFORMING ODA: THE COMPOSITION AND TARGETING OF AID
2
AN OPPORTUNITY FOR REFORM
As UN negotiations intensify on a new development agenda to follow on from the MDGs, discussions about the future of development finance are also taking place. Alongside the efforts of the Open Working Group on Sustainable Development Goals, which was mandated to develop a set of post-2015 goals, the UN Intergovernmental Committee of Experts on Sustainable Development Financing was created in June 2013 to map out all available financial resources for development and to propose options on an effective strategy to facilitate their mobilisation and use in achieving sustainable development objectives. These processes concluded during the summer of 2014, with published reports that will feed into intergovernmental negotiations on the post-2015 global development agenda.
In December 2013, the UN General Assembly also decided to convene a Third International Conference on Financing for Development.8 This will be held in Addis Ababa, Ethiopia on 15–16 July 2015 and will follow on from the first and second financing conferences in Monterrey (2002) and Doha (2008). The Monterrey Consensus and the Doha Declaration took a holistic approach to development finance, including reference to domestic resource mobilisation, FDI and other private flows, increasing trade, debt sustainability and addressing systemic issues of global governance. In Monterrey, donors made (or reaffirmed) a number of aid commitments, including spending 0.7% of GNI on ODA. Countries also reached agreements on some other key
issues, including the additionality of debt relief to aid commitments.9 The third financing conference in Ethiopia next year will assess progress in implementing the Monterrey Consensus and the Doha Declaration, and will consider future steps to ensure the effective use of development financing from all sources. The outcome of the conference will feed into the UN summit that is due to take place in September 2015 for the adoption of the new development agenda and financing framework.
In parallel, as the main monitoring and reporting agency for ODA, the OECD DAC, at its High Level Meeting (HLM) in December 2012, introduced a mandate to reform the reporting and measurement of ODA (and broader development finance flows) by December 2014, to better capture development finance beyond 2015. These reforms include reviewing the definition, scope and targeting of ODA; exploring ways of representing both the donor effort and the recipient benefit of development finance; and introducing a new concept of ‘total official support for development’ (TOSD) that would include broader resources.10 DAC members agreed that the new measurement framework would meet a number of criteria, including the need to withstand critical assessment from the public, to avoid causing significant fluctuations in aid levels and to be generally consistent with the way concessionality is defined in multilateral development finance.11
A number of alternative ODA concepts have already been proposed.12 In a series of reports monitoring aid composition and quality, ActionAid assessed how
much aid is ‘real’, excluding categories such as most in-donor costs, debt relief and tied aid, among others. The latest report concluded that only 55% of flows reported as ODA in 2009 should be considered ‘real aid’.13 CONCORD’s annual ‘AidWatch’ report provides an assessment of ‘genuine’ versus ‘inflated’ aid from EU member states, excluding the majority of in-donor costs, debt relief, tied aid and interest paid on ODA loans. The 2013 ‘AidWatch’ report found that 11% of EU ODA in 2012 was ‘inflated’.14 In its 2013 ‘Investments to End Poverty’ report, Development Initiatives unpacked the ‘aid bundle’ and recommended a number of changes, including new rules to count ODA loans.15 The European Network on Debt and Development (Eurodad) has also proposed a number of reforms to improve the system to measure ODA loans.16 Finally, the independent researcher David Roodman has suggested a number of revisions to what should count as ODA, as well as new rules to assess the concessionality of loans.17
In the context of these international deliberations, this section provides further analysis of the composition and targeting of DAC donor aid, in particular comparing donors on their: ( i ) allocations towards LDCs; ( ii ) in-donor expenditures and debt relief; and ( iii ) the concessionality of loans reported as ODA. The DAC’s preliminary 2013 figures do not include detailed disaggregation, and thus the following analysis covers the period to 2012. Finally, this section proposes a set of eight core principles to ensure that the official development finance system remains relevant and credible in the post-2015 era.

32 THE 2014 DATA REPORT
BOX 2: AID TRANSPARENCY
Citizen accountability must be at the heart of the post-2015 development agenda, including for financial resources to achieve the new goals. Development assistance will continue to make up a critical component of development financing beyond 2015, and improving the transparency of aid is of paramount importance in ensuring effectiveness and accountability. A lack of full transparency and coordination among donors can lead to inefficiencies and is in direct conflict with the principle of country ownership, since developing country governments may not have the information required to build up a complete picture of all donor projects within their own country. In Busan in 2011 – at the fourth in a series of High Level Forums on Aid Effectiveness (starting in Rome in 2003, and continued in Paris in 2005 and Accra in 2008) – donors committed to fully implement the International Aid Transparency Initiative (IATI) by 2015. They also established the
Global Partnership for Effective Development Cooperation (GPEDC) to lead on aid and development effectiveness. The GPEDC held its first High-Level Meeting in Mexico City in April 2014, and the outcome document included a renewal of the Busan IATI promise by 2015. Notably, providers of South–South cooperation, such as Brazil, also committed to sharing more information about their development cooperation activities (although not to IATI).18 Furthermore, a growing number of donors (including newer EU member states and other emerging donors such as Turkey and the United Arab Emirates) are either joining the OECD DAC or reporting their ODA to it.
However, Publish What You Fund’s annual Aid Transparency Index has shown that, while a number of donors have significantly improved the transparency of their development assistance, most still do not publish aid information in a comprehensive, standardised or timely manner. Overall progress has been modest
and uneven, and many donors are currently off track to meet the Busan commitment to fully implement the IATI standard by 2015.19 Some G7 countries such as Canada and Germany and the EU have progressed much faster than countries such as France, Italy and Japan. In countries that have multiple agencies providing ODA, performance can vary widely. The US and the UK (the world’s two largest bilateral donors) are illustrative of this. The US Millennium Challenge Corporation performs very well, but it disburses a relatively small amount of assistance compared with USAID, which has made far less progress. Similarly, the UK’s Department for International Development (DFID) ranks much higher than the Foreign and Commonwealth Office and the Ministry of Defence.
Moreover, the focus is also shifting towards improving the quality and usability of the data that does exist to ensure real progress in transparency and accountability.

3333REFORMING ODA: THE COMPOSITION AND TARGETING OF AID
2
TARGETING ODA WHERE IT IS MOST NEEDED Despite increases in the volume of other external finance flowing into developing countries, recent analysis has demonstrated that nearly all LDCs remain strongly dependent on aid. For these countries, ODA still accounts for over 70% of all external flows and is equivalent, on average, to half of their tax revenues. For example, Liberia, profiled on page 110, remains highly dependent on external flows, including aid. Yet, worryingly, the share of ODA for the poorest countries has been declining since 2010, while ODA allocations to upper-middle-income countries (UMICs) have been rising.20 In 2012, LDCs received only 31.9% of all ODA, down from 33.4% in 2010. ODA to LDCs rose by 57% between 2004 and 2010, but it decreased by 9% between 2010 and 2012. Aid to other countries increased by 37% between 2004 and 2010 but decreased by only 3% between 2010 and 2012 – just a third of the proportional decrease to LDCs. Projections point to a continuation of this trend, with LDCs set to receive a decreasing share of ODA.21 In these countries, recent declines in aid inflows have, by and large, not been mitigated by an increase in other flows.22 One of the main reasons behind this declining share of aid to LDCs has been the growing use of ODA loans that mainly target middle-income countries (MICs). According to the DAC’s preliminary figures for 2013, a large part of the rise in aid levels was due to the growing use of ODA loans, with non-grant disbursements increasing by about 33% on the previous year and total grants by only 3.5%. These loans were mostly directed towards MICs.23
In its review of ODA, the DAC is considering two solutions to ensure that aid is focused on the countries most in need: a new graduation system for recipient countries, which would lower the income threshold for ODA
eligibility,24 or significantly improving ODA targeting towards the poorest countries. Thus far, discussions have tended towards the second option.
As part of the discussions on the post-2015 agenda, a new target of 50% of all aid to be directed towards LDCs has been called for at the highest levels. At their ministerial meeting in Benin in July 2014, ministers and representatives of the LDCs called on donors to channel half of all their aid to LDCs.25 Prior to this meeting, the UN Under-Secretary-General and High Representative for Least Developed Countries, Landlocked Developing Countries and Small Island Developing States had expressed his support for such a target.26 In April 2014, the DAC Secretariat published a paper suggesting that 50% of total aid should be allocated to LDCs.27 Finally, the UN Intergovernmental Committee of Experts on Sustainable Development Finance has also considered this target as a way of targeting development finance at the poorest and most vulnerable countries.
Recognising the unique needs of LDCs, the UN has already adopted (in 2001) and renewed (in 2011) an aid target of 0.15–0.20% of GNI directed to LDCs.28 Donors committed to putting their best efforts into achieving this target. Those who have already met 0.15% committed to expedite reaching 0.20%, and those who already provide more than 0.20% pledged to maintain and further increase their level of ODA/GNI to LDCs. At their July 2014 meeting in Benin, in addition to calling for 50% of ODA to be directed to LDCs, LDC leaders also urged donors to meet their existing 0.15–0.20% ODA/GNI commitment as soon as possible.29 In current DAC discussions, some donors have favoured
a recommitment to this UN GNI target, rather than the adoption of a new volume target to LDCs. However, the 13-year-old target has received very little attention from donors or the DAC Secretariat, which focuses on the overall 0.7% ODA/GNI target in its monitoring of progress, rather than the specific target for LDCs.30
As shown in Figure 1, a large majority of DAC donors failed to meet the UN 0.15–0.20% ODA/GNI to LDCs target in 2012. Five countries allocated more than 0.20% of their GNI to LDCs that year (Denmark, Ireland, Luxembourg, Norway and Sweden) and a further three allocated at least 0.15% (the UK, Finland and the Netherlands), while the remaining 20 donors fell short. The most off-track donors were the Czech Republic, Greece, Italy, South Korea, Poland, the Slovak Republic, Slovenia and Spain. As a whole, DAC donors spent just 0.09% of their collective GNI on aid to LDCs in 2012 (down from 0.10% in 2010).
The fact that a number of donors are falling short on meeting the UN LDC target does not imply that they all deliberately allocate less aid to LDCs. Because the current target is a percentage of GNI, and not a percentage of total ODA, donors may fall short of the target if they provide less ODA/GNI in general. As Figure 1 shows, some donors may allocate a reasonably large share of their total ODA to LDCs while this represents a relatively small share of their GNI. For this particular reason, a 50% volume target appears to be a helpful measure to capture donors’ commitment towards LDCs.
In 2012, only Ireland surpassed the proposed 50% volume target to LDCs, directing 52% of its total ODA to these countries, though two others were close – Iceland

34 THE 2014 DATA REPORT
% o
f OD
A
60 %
50 %
40 %
30 %
20 %
10 %
0 %
0.00 % 0.05 % 0.10 % 0.15 % 0.20 % 0.25 % 0.30 % 0.35 % 0.40 %
% of GNI
(45%) and Japan (44%). Nine DAC countries (Austria, France, Greece, the Netherlands, Poland, the Slovak Republic, Slovenia, Spain and Switzerland), plus the EU institutions, allocated less than 25%, thus not meeting even half of the proposed target. As a whole, DAC donors allocated 31.9% of their total ODA to LDCs: a slight increase compared with 2011 (30.7%), but still a decline compared with 2010 (33.4%).
Five donors perform reasonably well against both benchmarks – Ireland (which surpassed both), Denmark,
Finland, Luxembourg and the UK. However, most performed poorly against both. If all donor countries had met the target of spending 0.20% of their GNI on aid to LDCs in 2012, it would have meant $50 billion of additional aid to these countries. If all donor countries had allocated at least 50% of their aid to LDCs in 2012, it would have meant $22 billion of additional money.
In the short term, for many donors a 50% volume target could be seen as a tool to get closer to the UN’s 0.15 – 0.20% GNI target. Given that DAC donors allocated
only 0.28% of their collective GNI to ODA in 2012, reaching the 50% volume target to LDCs (collectively) would actually result in them also (almost) reaching the 0.15% target (collectively). However, in the long run, if donors make significant strides towards meeting the 0.7% ODA/GNI target, the 50% volume target would be significantly more ambitious than the existing GNI target, as it would imply 0.35% of GNI to LDCs.31 Those donors already close to meeting the existing UN target could use it as a stepping stone towards the more ambitious 50% volume target.
Figure 1: ODA to LDCs, as % of ODA and a % of GNI, 2012
Source: OECD DAC Table 2a
Note: The size of the bubble represents the absolute volume of ODA to LDCs in 2012. ODA is total net, excluding debt relief. ONE does not count an estimated portion of regional and global unallocated ODA to LDCs.

3535REFORMING ODA: THE COMPOSITION AND TARGETING OF AID
2
COMPOSITION OF AID: IN-DONOR EXPENDITURES AND DEBT RELIEFNot all contributions recorded in aid statistics are actually transferred to developing countries. This results in a misleading picture for citizens and governments in recipient countries, as well as taxpayers in donor countries, of how much money is actually sent to and directly benefits developing countries. A portion of ODA goes on in-donor expenditures and debt cancellation. In-donor expenditures include imputed student costs, scholarship and training costs, costs of assisting refugees during their first year in donor countries, development awareness activities and administrative costs not included elsewhere.32 While administrative spending is important to ensure the effective management of aid, donors should not be allowed to report excessive administrative costs as ODA.
In its measure of ‘real aid’, for example, ActionAid caps administrative costs at 8% of total aid (the same threshold used by some donors for their funding partners).33 Reporting of in-donor expenditures, particularly refugee costs, also suffers from a lack of transparency and consistency.34 In the current discussions, there is little appetite among DAC donors for excluding in-donor expenditures from ODA, since this makes up a significant amount of aid for some donors. Instead, they are focused on how to standardise reporting.35
Reporting of debt relief is also problematic. In the 2002 Monterrey Consensus, adopted at the first International Conference on Financing for Development, donors
agreed to provide debt relief without detracting from other ODA resources.36 However, in practice, they can report as ODA not only the principal and interest but also arrears and penalties corresponding to the full life of the loan at the point of debt forgiveness. This amount does not reflect either the value to the developing country or the cost to the donor country of cancelling the debt; thus debt relief can provide an ‘artificial’ boost to ODA. Donors should get credit for the allocations they make for bilateral debt cancellation in their annual budgets (for example, this could be included in the new proposed measure of ‘TOSD’). But exactly how much should be counted is unclear, due to lack of transparency by donors in terms of budget provisions for debt cancellation.
Figure 2: In-Donor Expenditures and Debt Relief, DAC Donors, 2000– 12
ODA excluding in-donor costs and debt relief In-donor costs Debt relief
Source: OECD DAC Table 1
Note: Data in USD billions (2013 prices). In-donor ODA analysed here includes imputed student costs, refugee costs, administrative costs not included elsewhere, development awareness and debt relief. It does not include scholarship and training costs, because of a lack of comparable historical data in the DAC database.
US
D b
illio
ns
160
140
120
100
80
60
40
20
02000 2001 2002 2003 2004 2005 2006 2007 2008 2009 2010 2011 2012

36 THE 2014 DATA REPORT
Figure 3: In-Donor Expenditures and Debt Relief as Share of Total ODA, 2008– 12
ODA excluding debt relief and in-donor costs In-donor costs Debt relief
Source: OECD DAC Table 1
Note: In-donor ODA analysed here includes imputed student costs, refugee costs, administrative costs, development awareness activities and debt relief. It does not include scholarship and training costs, because of a lack of comparable historical data in the DAC database.
AUSTRIA SWITZERLAND FRANCE GREECE BELGIUM CANADA
GERMANY ITALY SWEDEN NETHERLANDS NORWAY NEW ZEALAND
DENMARK SPAIN JAPAN FINLAND CZECH REP. US
AUSTRALIA PORTUGAL EU LUXEMBOURG UK IRELAND
KOREA ICELAND SLOVENIA SLOVAK REP. POLAND
Richard Manning, former Chair of the OECD DAC, has argued that this problem becomes particularly acute when loan-issuing donors use forecast debt forgiveness to reduce other forms of ODA (knowing that these cuts will be compensated for by their debt relief operations). A few DAC members have gone so far as to deliberately stretch out debt relief reporting over a number of years instead of making the usual full write-off in one year, enabling them to counterbalance a shrinking aid budget over time. The inclusion of debt relief in ODA is inconsistent with the December 2012 HLM mandate to avoid creating major fluctuations in aid levels, as it can create major spikes in ODA in the year in which the debt is written off. Furthermore, it is unlikely that any African countries will be benefiting from significant bilateral debt relief by 2015. The Heavily Indebted Poor Countries (HIPC) Initiative – the major debt relief scheme led by the World Bank and the IMF – has almost come to an end and there are only three eligible countries remaining that have not yet entered the scheme.37
12.5
0.5
90.4
9.20.4

3737REFORMING ODA: THE COMPOSITION AND TARGETING OF AID
2
US
D b
illio
ns
40
35
30
25
20
15
10
5
0
2000 2001 2002 2003 2004 2005 2006 2007 2008 2009 2010 2011 2012
On average between 2000 and 2012, 17% of the DAC’s ODA was allocated to in-donor activities and debt cancellation. In-donor costs amounted to 9% ($114 billion) and debt relief to 8% ($135 billion) of the total – almost $250 billion in total over this period.
In the last five years on average (2008–12), 10% of total ODA ($61.4 billion) went on in-donor expenditures and 3% ($21.5 billion) on debt relief, implying that donors transferred $82.9 billion less to developing countries than would appear at first glance. For LDCs, the proportion was almost 11% in total. However, practices vary widely among individual donors. In this same period,
more than 20% of ODA from Austria, Switzerland, France and Greece never reached developing countries. In Switzerland, refugee costs accounted for the largest share of non-transferred ODA (62%); in Greece, imputed student costs were the most significant (61%); whereas in France and Austria debt relief (42% and 54%), along with imputed student costs (30% and 24%), accounted for the highest proportion of non-transferred aid. However, some donors report very limited in-donor expenditures. Notably, Poland, the Slovak Republic, Slovenia, Iceland, Korea and Ireland all transferred 95% or more of total ODA to developing countries, on average, during 2008– 12.
Among DAC donors as a whole, the three largest types of in-donor expenditures are (1) administrative costs ($6.7 billion in 2012, or 5% of total ODA); (2) refugee costs ($4.3 billion in 2012, or 3% of total ODA); and (3) imputed student costs ($2.2 billion, or 2% of total ODA). While most in-donor costs have remained relatively constant over time, debt relief creates major fluctuations in ODA. For example, as Figure 4 demonstrates, in 2005 and 2006, overall ODA levels surged due to significant debt cancellation (for Iraq and Nigeria).
Figure 4: Fluctuations in In-Donor Costs and Debt Relief, 2000– 12
Total in-donor ODA Administrative costs not included elsewhere Refugees in donor countries Debt relief Imputed student costs Development awareness
Source: OECD DAC Table 1
Note: ODA in USD billions (2013 prices). In-donor ODA analysed here includes imputed student costs, refugee costs, administrative costs, development awareness activities and debt relief. It does not include scholarship and training costs, because of a lack of comparable historical data in the DAC database.
16,594
6,690
4,344
2,229
321
3,010
Exceptional debt relief to Nigeria and Iraq

38 THE 2014 DATA REPORT
BOX 3: CALCULATING THE GRANT ELEMENT AND EQUIVALENT OF A LOAN
The grant equivalent of a loan is the nominal amount that will not be repaid to the creditor. It is calculated by dividing the amounts of total future repayments by a factor that discounts them (the reference rate or discount rate) to arrive at the discounted present value of future repayments. The difference between
the sum of the present value of future repayments and the face value of the loan is the grant equivalent. The grant element is calculated by dividing the grant equivalent by the face value of the loan. It is expressed as a percentage of the face value of the loan. Generally, longer maturity periods, or the number of years over which the loan should be repaid, bring down the present value of future repayments and thus increase the grant element.46
CONCESSIONALITY OF ODA LOANSODA consists both of grants and of loans made on concessional terms, and indeed, loans represent a growing portion of overall development assistance. To determine whether a loan is concessional, the DAC uses the ‘grant element test’, which stipulates that the loan must have a grant element of at least 25%, calculated at a discount rate of 10%, in order to be reported as ODA (see Box 3).
ODA loans are an important source of development finance, particularly in MICs and for large, productive investments such as infrastructure. ODA provided in the form of loans also has the advantage that repayments can be reinvested, providing donors with more money to spend on poor countries and potentially contributing to the sustainability of aid programmes.38 However, the DAC recommends that the average share of grants in
total ODA commitments should be at least 86%.39 It is crucial that the choice of grant or loan is guided by an effective, independent debt sustainability assessment, as well as the income level of the recipient and the purpose of the funding (for example, whether for productive or social sectors). Loans should be provided only to those developing countries that can realistically sustain debt. The IMF and the World Bank have developed a framework for conducting debt sustainability analyses and better preventing debt crises.40 Applying it to ODA flows reveals that a significant volume of loans is being extended to countries suffering from, or at high or moderate risk of, debt distress.41 Furthermore, some groups have questioned the effectiveness of this framework in preventing debt crises.42
Since public spending in LDCs is very low, other external flows are highly volatile and these countries have a limited ability to sustain debt, grants remain the most appropriate instruments for the very poorest countries. Civil society organisations (CSOs) in LDCs have called for aid to their countries to be provided in the form of grants, not loans.43 The DAC also recommends that donors provide an average grant element of either 86% to each LDC (on average, over three years) or 90% to LDCs as a group (annually).44 Although DAC members have generally performed well on providing 90% of their aid to the poorest countries in the form of grants, this is only a recommendation, not a requirement, and it does not apply to all aid providers.45 In fact, some LDCs are receiving a significant share of their total ODA as loans, as shown in the example of Tanzania in Box 4.
A farmer shows off her crop of paprika peppers in Mang’alali village, Tanzania. USAID is helping farmers to improve their yields and get better prices for their crops.Photo: USAID

3939REFORMING ODA: THE COMPOSITION AND TARGETING OF AID
2
BOX 4: LENDING TO GHANA AND TANZANIA
GHANA
Ghana is a middle-income country that has experienced strong economic growth in recent years. It is one of the few sub-Saharan African countries on track to reach the MDG of halving poverty by 2015. 47 After qualifying for The Heavily Indebted Poor Countries (HIPC) Initiative and Multilateral Debt Relief Initiative (MDRI) in the 2000s, Ghana’s foreign debt fell from $6 billion in 2005 (over 60% of GDP) to $2 billion in 2006 (10% of GDP), helping to improve macroeconomic conditions and improving the lives of millions of citizens.48 For example, the country was able to use its debt relief to abolish primary school fees, which helped increase primary enrolment from 61% in 2004 to 88% in 2013.49
Ghana’s economy has matured significantly in past years, and the country has experienced a boom in international lending, including the issue of its first sovereign bond in 2007. In recent years, however, public debt has spiked worryingly, and Ghana is now considered by the IMF and the World Bank to be at moderate risk, and approaching high risk, of debt distress. Its public debt is close to 60% of GDP and debt servicing accounts for 40 – 50% of government revenues.50 Since Ghana has graduated to middle-income status, it is no longer eligible for debt relief (should there be political will for future schemes).
Despite the fact that its debt appears to be growing fast, Ghana receives a high share of its gross ODA in the form of loans (41% on average in 2011 – 12). The majority is provided by multilateral agencies, with the World Bank’s International Development Agency (IDA) providing more than 40% of the total ODA loans to the country on average during 2011 – 12. The IMF (24%) and the African Development Fund (AfDF) (17%) are Ghana’s second and third largest concessional lenders. Germany was Ghana’s largest bilateral aid lender, on average, in 2011 – 12 (accounting for 5.1% of its total ODA loans), followed by France (4.9%).51
Given that there is already a boom in lending to Ghana, the fact that well over a third of its development assistance is delivered in the form of loans is concerning. Donors must ensure that concessional lending does not contribute to unsustainable debt accumulation and should provide ODA loans only to countries that do not face risk of default.
TANZANIA
Tanzania has made significant progress over the past two decades to achieve and maintain macroeconomic stability. During the 2000s, it received $6.8 billion in debt relief from HIPC and MDRI combined, reducing its annual debt servicing by more than two-thirds between 2001 and 2007.52 Debt cancellation helped to more than triple government spending on poverty reduction in the same period (from $595 million in
2001 to $2.1 billion in 2007).53 The government abolished school fees in the same year it benefited from debt relief, and primary school enrolment rates reached 98% in 2008.54
Despite this progress, Tanzania remains an LDC, and over two-thirds of its people live in extreme poverty.55
In 2012, GDP per capita was only $609, with per capita public spending barely reaching above $150 (in PPP terms).56 As a result, Tanzania is highly dependent on aid, which was more than half (53%) the value of total domestic government revenues in 2012.57 Although the country is currently judged to be at low risk of debt distress, external public debt has crept steadily upwards in recent years, amounting to around 29% of GDP in 2013.58 Despite this, a quarter of Tanzania’s gross ODA on average in 2011– 12 was delivered in the form of loans, mostly by multilateral agencies such as IDA (which accounted for 59% of the country’s total ODA loans) and the AfDF (21%). Tanzania’s largest bilateral loan providers on average during 2011–12 were Korea and Japan, both accounting for 4% of total aid lending.59
Tanzania is one of the poorest countries in the world, is highly dependent on aid and its debt burden is rapidly increasing. Grant aid remains the most appropriate development financing instrument for countries such as Tanzania, and donors should ensure that they minimise ODA lending to LDCs to less than 10% of total ODA.

40 THE 2014 DATA REPORT
Bilateral ODA loans from DAC countries increased by 42% between 2006 and 2010, from $10.6 billion in 2006 (10% total bilateral ODA) to $15 billion in 2010 (14% of total bilateral ODA). In 2012, bilateral ODA loans decreased slightly to $14.2 billion, but their share in total ODA remained constant at 14%. Eleven DAC members currently provide concessional loans, and growth trends have been driven by a few major providers – France, Germany, Japan and the EU institutions.60 The current DAC system to assess the concessionality of ODA loans is highly problematic and does not create the right incentives for donors to use loans where they have a real added value.61
• The current system is either all in or all out. It counts equally and fully as ODA all loans with a grant element of at least 25% – whether it is 26% or 99% – while loans that fall just short of the 25% threshold are completely excluded, even though they represent a financial effort for donors and benefit recipient countries.62 In current DAC discussions to review ODA, two options are being considered: introducing a ‘grant equivalent approach’ (counting only the grant equivalent of loans as ODA) or maintaining the current system (counting the full value of loans that meet a threshold). DAC members have generally expressed support for counting only the grant equivalent of loans as aid, as it would end this ‘hard cut-off’ system and would give credit for all development loans.63 This approach would count all concessional equivalents of loans (however small) as aid, but not the full value of the loan – the full value would, however, be taken into account in the wider measure of ‘total official support for development’ (TOSD).
• Interest repayments are not taken into account. Current net ODA figures in the DAC statistical system give an inaccurate picture of net flows to recipient countries since they do not take into account interest repayments. Repayments of principal are deducted from gross ODA figures, but payments of interest are not. This effectively inflates net ODA flows to poor countries by approximately $5 billion per year.64
• The current 10% reference rate could allow donors to report unsubsidised and potentially profitable loans as aid. In the current financial environment, donors can raise money at relatively low interest rates on the market, lend to developing countries at harder terms, and report such profitable loans as ‘concessional’. This has allowed – as noted by the December 2012 HLM Mandate – multiple views on the interpretation of ‘concessional in character’ and inconsistencies in donors’ reporting practices.65 The majority of DAC donors providing ODA loans choose to interpret concessionality from the ‘donor perspective’ and report only subsidised loans as ODA. A few other members, particularly France, Germany and the EU institutions, see concessionality from the ‘recipient perspective’ and can report unsubsidised, market-raised loans as aid, arguing that loans lent at softer terms than developing countries could obtain on the financial markets should be recorded as concessional, even if the donor is making profit. The EU Institutions claim that any income received from extending these loans is not a profit, but merely covers the expenses and risks of extending
the loan. Furthermore, they claim that the borrower’s risk of default should be taken into account when assessing the concessionality of loans.66 Several alternatives to the current 10% reference rate have been explored by the DAC Secretariat. One promising alternative is to replace the fixed 10% rate with the variable and more realistic Differentiated Discount rates (DDRs).67 The DDRs are already used as the reference rates to estimate the concessionality level of loans under the OECD Arrangement on Officially Supported Export Credits.68 The DDRs are currency-specific and subject to annual change; they therefore change with fluctuations in interest rates. They also depend on the term of the loan (DDRs being slightly higher with longer-term loans).69 As a result, the DDRs have the benefit of being based on current market conditions, and would thus better reflect donors’ true costs. This aspect, however, would lead to otherwise identical loans being measured differently in ODA statistics, depending on donors and points in time.
A second alternative is the IMF and World Bank’s 5% benchmark for External Debt Analysis in LICs. The IMF and the World Bank apply a concessionality test, which uses a fixed 5% reference rate (thus closer to current market realities than the 10% rate) and a grant element of 35% (thus higher than the DAC’s 25%) for assessing the concessionality of loans to LICs.70 The DAC is exploring two options that use this 5% benchmark. One would be to switch wholesale to match the IMF/World Bank test – and maintain the current system of counting the entire loan as ODA if it passes the test of having a grant element of at least 35%. The alternative would be to align with the IMF/World Bank 5% rate,

4141REFORMING ODA: THE COMPOSITION AND TARGETING OF AID
2
but count only the grant equivalent of the loan as ODA, i.e. taking the ‘grant equivalent’ approach, but in combination with the lower 5% reference rate. A fixed discount rate that is harmonised with these international finance institutions would ensure a certain level of simplicity in reporting and consistency between different donors: any concessional loan under the same terms would always have the same grant element, regardless of the donor’s interest rate, the recipient’s creditworthiness or the point in time. This would help meet the December 2012 HLM mandate requirement of being generally consistent with the way that concessionality is defined in multilateral development finance. Furthermore, an analysis recently undertaken by the OECD DAC found that the IMF / World Bank concessionality test seems to be one of the prevailing measurements used in developing countries when assessing what loans
to accept.71 However, it would not be as responsive to changing financial conditions, and would require regular reassessment to maintain relevance.72
Recent DAC discussions have explored in more detail the idea of using a risk-adjusted rate.73 This entails using a discount rate that reflects both the donor’s cost of funding the loan and the borrower’s risk of not being able to pay it back in full. It is considered as possibly the best way to provide an accurate assessment of the donor’s likely final costs in extending the loan, and takes into account arguments made by donors, such as France and Germany, that unsubsidised loans could be considered concessional once the borrower’s risk of default is factored in. The DAC is considering different options to construct risk-adjusted rates, including using the DDRs or the IMF/World Bank 5% rate with the addition of a ‘risk premium’. There is currently no agreed methodology for determining such risk premiums; the
DAC has been considering different ways to formulate default risk, but members have not yet agreed on any of the different alternatives.74 On the one hand, a risk-adjusted discount rate appears to be an interesting option. As the default risk would be factored into the ODA loan reporting, debt relief should logically not be recorded as ODA any more; thus spikes in aid flows caused by fluctuations in debt relief would also end. On the other hand, however, it could also have the perverse effect of incentivising loans to countries under higher risk of debt distress, because the higher the risk of default, the higher the ODA grant equivalent.75 The DAC has pointed out that safeguards should be adopted to ensure debt sustainability in recipient countries. One option being explored by the DAC is to link ODA loans to the poorest countries with the IMF / World Bank recommendation on a minimum level of concessionality (a grant element of at least 35%) to LICs.76 David
BOX 5: CALCULATING THE GRANT ELEMENT UNDER DIFFERENT DISCOUNT RATES
Consider the following example: two donors (Donor A and Donor B) provide a loan of $100 million, without any grace period. The maturity of both loans is 25 years and repayments are made annually. Donor A charges interest at 1%, while Donor B charges it at 3%. What are the grant elements of these loans?
Donor A: Using the current DAC 10% discount rate, the grant element of the 1% interest loan amounts to 55%. This loan therefore meets the 25% grant element test and its full face value counts as gross ODA. Using the IMF/World Bank 5% reference rate, the grant element of the loan would fall to 34%, and using a 4% discount rate, a typical recent value of DDRs, the grant element would further decline to 27%. Under these two discount rates that better reflect market realities, Donor A’s loan would still count as aid since its grant element remains above 25%. However, its grant element would decrease considerably.
Donor B: Using the current DAC 10% rate, the grant element of the 3% interest loan amounts to 43%, and thus this loan counts as ODA. However, using the IMF/World Bank 5% reference rate, the grant element of this loan would fall to 17%. Using a 4% discount rate, the grant element would decrease even further to 9%. Under these two more realistic discount rates, the loan extended by Donor B would no longer meet the 25% grant element benchmark and thus would no longer qualify as ODA – even though this loan still represents a financial effort for Donor B and benefits the recipient.

42 THE 2014 DATA REPORT
Roodman argues against incorporating default risk in concessionality calculations in most cases and suggests using a risk-adjusted discount rate only for loans that “eschew stiff penalties for default and contain automatic risk sharing mechanisms such as reduced payments after economic shocks”.77 Nevertheless, even if safeguards are put in place, this problem of perverse incentivisation could remain a concern.
DAC discussions have so far inclined towards risk-adjusted, differentiated rates and a grant equivalent approach. However, all alternatives (counting full loan value vs. grant equivalent approach; risk-free vs. risk-adjusted rate; fixed vs. differentiated rate(s)) remain on
the table. The DAC has encouraged members to express their preference in order to come to a consensus.78
In order to bring to light the potential effect that the DDR-based reference rates and the flat 5% benchmark would have on current donors’ loan concessionality, ONE has analysed DAC donors’ bilateral ODA loans from 2004 to 2012. Figure 5 reveals the gradually decreasing level of concessionality of bilateral ODA loans over time. It shows the average grant element of all ODA loans from DAC donors using both the existing 10% rate and the 5% rate employed by the IMF/World Bank. The 10% rate allows more loans to meet the 25% aid threshold and thus inflates total reported ODA.
Between 2004 and 2012, the average grant element of DAC bilateral lending was 67% under the existing 10% reference rate. Under the 5% reference rate, the average grant element would have been substantially lower at just 43%. In 2012, the average grant element across DAC donors was 64%, but this falls to below 40% if measured using the 5% reference rate. Given that the 5% rate better reflects market realities, it appears that lending by DAC donors was significantly less concessional than suggested in DAC statistics.
Figure 6 compares the estimated grant equivalent of ODA loans from those DAC donors that provided concessional lending in 2012, using the existing 10%
75
Gra
nt
elem
ent
% o
f ave
rag
e lo
an
50
25
02004 2005 2006 2007 2008 2009 2010 2011 2012
Figure 5: Average Grant Element of Bilateral ODA Loans under 10% and 5% Reference Rates, DAC Donors, 2004 – 12
DAC 10% reference rate IMF/ World Bank 5% reference rate
Source: OECD DAC Table 22
Note: This figure does not include European Investment Bank (EIB) loans due to lack of full data. Following lengthy discussions in the DAC, it was decided in April 2013 that for the period 2008–10 the data on concessional flows shown for the EU institutions would relate to grants only and all EIB loans would be recorded as non-concessional.

4343REFORMING ODA: THE COMPOSITION AND TARGETING OF AID
2
Figure 6: Grant Equivalent of ODA Loans under 10%, 5% and DDR-Based Reference Rates, 2012
US
D b
illio
ns
6
5
4
3
2
1
0Japan EU
InstitutionsFrance Germany Korea Italy Portugal Belgium Australia
10% reference rate 5% reference rate DDR
Sources: OECD DAC CRS database and OECD repository of DDRs
Note: Data in USD billions (2013 prices). Loans from Belgium and Australia do not equal zero but are too small to be distinguished on the graph. However, the effect of using alternative rates for measuring these loans is negligible.
rate, the IMF/World Bank 5% rate and a DDR-based reference rates. The impact of the different rates is immediately evident. Firstly, in today’s environment of low interest rates, the use of 10% effectively overvalues the grant element of loans, making it much easier for loans to meet the 25% grant element test. Secondly, the impact of using more realistic discount rates is much more significant for the largest lenders (Japan, the EU, France and Germany) than smaller lenders (Korea, Italy, Portugal, Belgium and Australia). ODA loans from France, Germany, Japan and the EU
institutions would have had a significantly lower grant equivalent if applying the IMF/World Bank 5% rate, and this falls further still when using the currency-specific DDRs. The grant equivalent of Japanese loans would have dropped from $6.4 billion to $4.3 billion (using 5%), or to $2.6 billion (using DDRs). The grant equivalent of EIB loans would have fallen from $3.7 billion to $1.6 billion (using 5%), or to $1.3 billion (using DDRs). France’s grant equivalent of loans would have gone down from $2.8 billion to $1.2 billion (using 5%), or to $949 million (using DDRs). Germany’s grant equivalent
of ODA loans would have dropped from $1.6 billion to $744 million (using 5%), or to $464 million (using DDRs). This reveals that the largest lenders have extended loans at much less concessional terms than smaller donors.
In Figure 7, we show how the estimated total value of historical ODA loan commitments – loans passing the 25% grant element test – for each lender would have changed according to the three rates, 10%, 5% and DDRs. France, Germany and the EU institutions all

44 THE 2014 DATA REPORT
Existing rate: 10%
Alternative rate 1: 5%
Alternative rate 2: Differentiated Discount Rates (DDRs)
Sources: OECD DAC CRS database and OECD repository of DDRs
Note: Data in USD billions (2013 prices). In consistence with the DAC grant element calculations that are based on the commitment value of loans, the values are gross loan commitments. Some of these loan commitments will have been disbursed in 2012, but some may be disbursed in a subsequent year. Loans from Belgium and Australia do not equal zero but are too small to be distinguished on the graph. However, the effect of using alternative rates for measuring these loans is negligible.
US
D b
illio
ns
9
8
7
6
5
4
3
2
1
0EU
InstitutionsJapan France Germany Korea Portugal Italy Belgium Australia
Figure 7: Value of ODA Loan Commitments Passing the 25% Grant Element Test under 10%, 5% and DDR-based Reference Rates, 2012
include in their aid reporting substantial volumes of loans at much harder terms (in terms of interest rates, grace periods and maturities) than other DAC donors. The large majority of French, German and EU loans do not pass the test under a 5% rate. Japanese loans were extended at more preferential terms, all passing the 5% test; nevertheless, a third of them fail to pass the test under the DDR-based rates. Since a significantly smaller volume of official lending would have met the 25% grant element test under the 5% and DDR-based reference rates, the total value of ODA loan commitments is greatly reduced compared with the current rules. The number of ODA loan commitments from France meeting the grant element
test in 2012 would drop from 72, or a total value of $5.92 billion, to just 28 or $1.54 billion (using 5%) and to 27 or $1.5 billion (using the DDRs). The number of German loan commitments would fall from 96, or a total value of $3.48 billion, to 33 or $434 million (using 5%) and to 21 or $259 million (using the DDRs). In 2012, 90 Japanese loan commitments totalling $8.38 billion passed the 25% grant element test using the 10% and 5% rates, but this would fall to 63 or $4.14 billion under the DDRs. Sixty-six loan commitments from the EU institutions (via the EIB) totalling $8.49 billion met the grant element test in 2012, but only eight, amounting to $1.35 billion, would have been eligible under the 5% and DDR-based reference rates.
If the DAC had a 5% reference rate, the total value of concessional loan commitments passing the 25% grant element test in 2012 would have been $13.41 billion compared with the $28.03 billion reported. If the DAC had used the DDRs, the total value of these loan commitments would have amounted to just $8.95 billion.

4545REFORMING ODA: THE COMPOSITION AND TARGETING OF AID
2
EIGHT CORE PRINCIPLES TO ENSURE THE QUALITY OF AID BEYOND 2015As negotiations on the post-2015 development agenda intensify, discussions about the future of development finance are advancing within the UN, as well as in the DAC. In addition to having an impact on reported donor aid volumes, the DAC’s revision of ODA will have important implications in terms of the quality and credibility of aid. There is a real opportunity to refresh the ODA concept and to ensure its continued – and enhanced – relevance beyond 2015, as well as to improve the architecture that measures broader development finance. In light of this, ONE proposes the following eight core principles: 1 ODA should be focused on countries with the
greatest need and with the least access to other sources of finance. Financial resources from all sources will be critical to ending poverty. However, ODA is the only flow for which economic development and improved welfare are key objectives, it is relatively predictable and less volatile than other kinds of investment (such as FDI), and it will continue to be a vital source of financing for the world’s poorest countries. ODA should be focused on reducing extreme poverty, particularly in those countries that are not able to attract high volumes of other types of external finance or mobilise sufficient domestic resources. The majority of DAC donors still fall short of the longstanding UN target of 0.15–0.20% of GNI to LDCs, and few meet or come close to meeting the potential new target of 50% of total aid. In line with calls by LDCs, donor countries should firmly commit
and act to give 50% of their aid to the poorest and most vulnerable countries. The existing 0.15 – 0.20% ODA/GNI benchmark could be a useful interim target for some donors that are already close to meeting it. Donors should set out concrete timetables to meet this 50% target as soon as possible after 2015. The DAC Secretariat should increase the attention given to ODA for LDCs by better tracking donors’ performance.
2 Grant aid to the poorest countries and most vulnerable countries should be incentivised. Since overall public spending in these countries is generally very low, other external flows can be highly volatile, and they have a limited ability to sustain debt, grants remain the most appropriate instrument and should be incentivised. A risk-adjusted discount rate to assess loan concessionality should be avoided unless it can be designed and rigorously monitored in such a way as to not incentivise ODA lending to the poorest countries that are unable to sustain the debt. Furthermore, the DAC should make sure that its recommendation on the overall grant share of aid to LDCs (90% annually) continues to be upheld and is calculated on a much improved basis, as set out in principle 7 below. Donors should publicly commit to this target, and continue to implement it in their aid programming.79
3 The majority of in-donor costs should not count as ODA. Current aid statistics include a large volume
of money that never actually reaches developing countries. Furthermore, in-donor ‘aid’ spending undermines the overall credibility of development assistance. In its revision to the definition of ODA, the DAC should reduce administrative costs to a reasonable threshold and exclude other in-donor expenditures from aid, but should include them in the new measure of ‘total official support for development’ (TOSD).
4 Debt relief should not count as ODA. While debt relief is immensely valuable and frees up domestic government expenditures that would otherwise go to service debt payments, the rules for counting bilateral debt cancellation as ODA overstate the value of debt relief from both the recipient and donor perspectives, and debt relief effectively artificially boosts ODA in some years. This creates perverse incentives for donors to use forecast debt cancellations to reduce other forms ODA in these years. In addition, it is unlikely that any African countries will be significantly benefiting from bilateral debt cancellation by 2015. Donor countries should be credited for the budget allocations they make for bilateral debt relief (e.g. in TOSD reporting). But they need to make budgetary provisions to achieve their ODA targets without relying on ODA inflated by bilateral debt cancellation figures. Not counting debt relief as aid would help meet the December 2012 HLM Mandate requirement to avoid major fluctuations in overall ODA levels.

46 THE 2014 DATA REPORT
5 Concessional loans should be provided only to countries that can sustain debt. Concessional loans are an important source of financing, particularly in MICs and for productive investments. In addition, ODA loans have the benefit that reflows from loans are recycled, providing donors with more to spend on aid and potentially increasing the sustainability of their aid programmes. However, donors must ensure such loans do not escalate debt vulnerabilities in developing countries. ODA loans must be provided only to those developing countries that can realistically sustain debt. An effective, independent debt sustainability assessment should be developed to guide lending to developing countries, and a debt sustainability criterion should be established for loans to count as aid. Such a criterion should take into account the country’s level of indebtedness and risk of distress. The choice of grant or loan should be guided by this debt sustainability assessment as well as by the income level of the recipient, and the purpose of the funding. In addition, a fair, impartial and transparent international debt arbitration mechanism should be established to ensure efficient restructuring of debts when a debt crisis arises.
6 Only the grant equivalent of concessional loans should be recorded as ODA and interest repayments should be recorded in net loan figures. Recording only the concessional component would more accurately capture donors’ budgetary efforts and would enable all concessional portions of lending (however small) to count as aid. Highly concessional lending would be incentivised and would record a higher level of ODA in aid statistics. But donors would also get credit for less concessional loans (extended under the right circumstances) with their grant component also being captured in aid statistics. Both capital and interest repayments should be captured in the broader measure of ‘total official support for development’ to give a true picture of flows in and out of developing countries.
7 Concessionality rules should reflect today’s market conditions. As the DAC Secretariat has pointed out, the current grant element test has become “largely ineffective”.80 The 10% discount rate is too high in comparison with the interest rates at which donors can borrow capital today, thus overvaluing the concessionality of loans and allowing
unsubsidised (and even profitable) loans to meet ODA requirements. While such loans can be a valuable resource in the right circumstances and should be effectively tracked, they should not count as ODA. A more realistic discount rate, such as the flat 5% rate currently used by the IMF/World Bank in their own concessionality test, or the DDRs, appear to be the most promising options for overcoming the impasse over concessionality and offering a proper and effective measurement of the concessionality of lending to developing countries.
8 Donors must meet their commitments to aid transparency. In order to ensure that ODA remains effective and credible in the next era of development, any measurement system needs to include clear and transparent reporting by donors. In line with the Busan commitment, donors must urgently strengthen the transparency, quality, comparability and timeliness of their aid data, and seek to publish to the IATI common standard by 2015.

4747REFORMING ODA: THE COMPOSITION AND TARGETING OF AID
2
The third international conference on financing for development taking place in July 2015 in Addis Ababa presents a golden opportunity to bring together, in preparation for the UN post-2015 summit in September 2015, all of the processes and discussions currently under way, with the aim of developing a universally agreed and robust financing framework to serve the world’s new development goals. All stakeholders – including both DAC donors and non-traditional providers of development cooperation, governments and civil society representatives from developing countries, the private sector, NGOs and policy experts – should develop concrete proposals and engage in a constructive international dialogue on how to improve the quantity and quality of ODA and all key flows for development.
In Tanzania, USAID’s Empowerment through Literacy Education Access Project (E-LEAP) helps Maasai women learn basic literacy skills. Photo: Megan Johnson/USAID

48 THE 2014 DATA REPORT

4949
3
Section 3
PROFILES OF COUNTRY PROGRESS
The UK government is committed to getting two million more girls into school in Pakistan by 2015. Each girl receives 200 rupees (about $2.50) a month and a set of free textbooks each year to help her get an education. Photo: Vicki Francis/DFID
PROFILES OF COUNTRY PROGRESS

50 THE 2014 DATA REPORT
In 2013, Australia’s ODA declined for the first time since 2001, falling by 4.5% to $4.8 billion (AUD 5.0 billion). Between 2004 and 2012, Australia had doubled its total aid flows, reaching a peak of $5.0 billion (AUD 5.3 billion) and bringing its ODA / GNI ratio up from 0.24% (2004) to 0.36% (2012). Those increases reflected the Howard government’s1 plans to double the country’s aid programme by 2010, and then the Rudd/Gillard governments’ original commitment to chart a course towards ODA/GNI of 0.5% by 20152 – a commitment first made by the Labor Party in 2007, which gained cross-party support.3 Until 2013, the Labor government had
maintained a firm deadline for reaching the 0.5% commitment, although it was delayed several times, eventually to 2018, entailing reductions in projected spending in the interim period.4
Australia’s aid to Africa is also estimated to have declined in 2013, by 7.4% to $645 million (AUD 669 million), and ODA to the sub-Saharan Africa region is estimated to have decreased by 5.1% to $631 million (AUD 654 million). Despite this recent dip, current aid levels to Africa are significantly higher than they were in 2004 (see Figure 1), which is indicative of
AUSTRALIA2013 ODA, NET OF DEBT RELIEF
GLOBAL
$4.85 billion AUD 5.02 billion2012 – 13 CHANGE:
- 4.5%AFRICA
$645 million AUD 669 million2012 – 13 CHANGE:
- 7.4% SUB-SAHARAN AFRICA
$631 million AUD 654 million2012 – 13 CHANGE:
- 5.1% 2013 ODA/GNI
0.34%
Figure 1: Global and SSA ODA (total net, excluding debt relief), 2004 – 13
6A
UD
bill
ions
% o
f GN
I
5
4
3
2
1
02004 2005 2006 2007 2008 2009 2010 2011 2012 2013
Global SSA Global ODA / GNI SSA ODA / GNI
Sources: OECD DAC Tables 1 and 2a and Preliminary Release (April 2014)
Note: ODA in 2013 constant prices. Net ODA excludes bilateral debt relief, and includes both bilateral and multilateral flows (SSA imputed multilateral flows in 2013 are estimated by ONE). Converted from USD to AUD using the OECD annualised exchange rate for 2013.
0.00 %
0.05 %
0.10 %
0.15 %
0.20 %
0.25 %
0.30 %
0.40 %
0.35 %

5151
3
Australia’s efforts during this period to ramp up its development assistance in countries outside of Asia and the Pacific. Nevertheless, its ODA to Africa still makes up only a small fraction (around 13%) of its total aid flows, and only 7% of its bilateral aid. This share is set to decline further, as the current government has clearly set out its intention to focus on Asia and the Pacific (see below).
In September 2013, just prior to the election, then Shadow Treasurer Joe Hockey announced that, if elected, the Coalition government would cut all projected growth in foreign aid and would make a cumulative AUD 4.5 billion reduction over the three-year forward estimates, beginning with AUD 656 million in FY2013/14. In January 2014, Minister for Foreign Affairs Julie Bishop confirmed that total ODA in FY2013/14 would be AUD 5.042 billion, a cut of AUD 650 million to the projected aid budget, and AUD 107 million less than actual spending in FY2012/13.
Aid policy: When newly elected Prime Minister Tony Abbott took office in September 2013, one of his first announcements was the merger of AusAID – the country’s autonomous aid agency, which had managed around 84% of its ODA – into the Department of Foreign Affairs and Trade (DFAT). He stated that this would enable ‘the aid and diplomatic arms of Australia’s international policy agenda to be more closely aligned’.5
However, the change was unexpected and was announced with minimal information relating to operational and resourcing implications.6
The vast majority of Australian aid is split fairly evenly between the Pacific island states and East Asia (including Southeast Asia), with smaller programmes in South and West Asia and in Africa and the Middle East. In the FY2014/15 budget, only 14 countries are set to individually receive more than AUD 50 million.7 The new policy and performance framework announced by Foreign Affairs Minister Bishop in June 2014 sets out a sharper geographic focus for Australian aid and mandates that at least 90% of country programme funding will be directed to the Indo-Pacific region, at the cost of significantly scaling back engagement in sub-Saharan Africa and elsewhere.8 For FY2014/15, aid to sub-Saharan Africa is budgeted at AUD 106 million (representing just 3% of DFAT’s total country and regional programmes).9 This would be a 20% cut compared with actual allocations in FY2013/14, which had already seen a 40% reduction from their previously budgeted levels.
In launching the new aid policy and performance framework, Bishop announced that Australia’s aid was being ‘reshaped’ around the aim of promoting Australia’s national interests by contributing to sustainable economic growth and poverty reduction, raising questions over the conceptual clarity of the new policy, and whether it does enough to unequivocally position poverty reduction as the ultimate test of success.10 As well as the heavy emphasis on economic growth (through trade, infrastructure and private sector engagement), the other most significant change is the increased attention to gender equality.11 However, the framework also carries forward traditional priorities,
including health, education, agriculture, governance and institutions, and humanitarian assistance.12 Given the government’s continued focus on global health, its commitment of just $174 million (AUD 180 million) for the 2014–16 replenishment of the Global Fund to Fight AIDS, Tuberculosis and Malaria – significantly less than the AUD 375 million that Australian health NGOs and others had campaigned for – is disappointing. Australia’s total contributions to the GAVI Alliance up to 2013 amount to $196 million (AUD 203 million), of which $11.7 million (AUD 12.2 million) is for the International Facility for Immunisation (IFFIm).
In-donor costs and debt relief: In 2012, $758 million (14%) of Australian ODA was not transferred to developing countries, consisting mostly of administrative costs, scholarships/training costs and refugee costs. Using the aid budget to pay the costs of processing asylum seekers has been a bone of contention in recent years. Late in 2012, outside of the regular budget process, and to a large outcry, the Labor government confirmed that it had decided to use AUD 375 million from the overseas aid budget to pay for on-shore asylum costs.13 In August 2013, it announced that AUD 879 million would be redirected from the aid budget towards asylum processing centres in Papua New Guinea.14 However, the Coalition has taken the laudable stance of excluding these costs from its ODA budget, a policy which should be maintained.
Aid transparency: Australia is an original signatory to the International Aid Transparency Initiative (IATI), but there is a clear need for improvement in the quality of its
PROFILES OF COUNTRY PROGRESS: AUSTRALIA

52 THE 2014 DATA REPORT
IATI publication. Its schedule for implementing IATI is still unambitious, and it lacks plans for publishing detailed financial and performance data and location information. In Publish What You Fund’s 2013 Aid Transparency Index, AusAID (which has since been merged into DFAT) scored only just above the threshold of the ‘fair’ category.15 Foreign Affairs Minister Bishop has repeatedly highlighted the virtues of more transparent and open aid, and the government has made clear its emphasis on aid effectiveness and value for money, which suggests that there are now opportunities for Australia to regain its momentum on aid transparency.16 In the recently launched aid framework, the government recommitted to IATI, although it did not provide further details (such as its intended timeline for IATI publication), and it also missed an opportunity to institute transparency measures among its new aid benchmarks.17
Australia joined the Open Government Partnership in 2013, and is currently in the process of developing its first National Action Plan, which should help to clarify the government’s intentions on improving aid transparency, amongst other areas.18
Financial transparency: The Tax Justice Network’s Financial Secrecy Index gives Australia a secrecy score of 47 points out of 100, placing it in the ‘moderate’ range and suggesting that there is progress to be made in ensuring financial transparency that deters corruption and illicit financial flows, including greater transparency on tax information, company ownership and extractive sector payments.19 A 2013 consultation paper issued by the Australian government concluded that the country’s anti-money laundering regulations suffer from serious deficiencies, including insufficient transparency of beneficial ownership for companies
and trusts, and suggested that the government may consider taking steps to strengthen those rules.20 Australia has signed Tax Information Exchange Agreements (TIEA) with 36 countries in an effort to crack down on tax evasion, and its Project Wickenby cross-agency taskforce to combat tax evasion, avoidance and crime (established in 2006) had yielded 44 convictions and nearly $2 billion in tax liabilities raised as of February 2014.21 Australia recently completed a small pilot of the Extractive Industries Transparency Initiative (EITI), with eight participating companies reporting the payments they made to governments, but has not indicated whether it will join the EITI or support mandatory reporting rules for the extractive industries. CSOs in the region have accused the Australian government of doing little to question suspicious transfers made into Australia from Papua New Guinea’s politicians and public officials.22
LOOKING AHEAD TO 2015Since the Coalition took office in September 2013, Australia’s aid programme has undergone substantial change. The merging of AusAID into DFAT, followed by the increased emphasis in government discourse on “promoting Australia’s national interests” and the strong thematic prioritisation of aid-for-trade and private sector development, has raised concerns that development assistance objectives centred on poverty reduction and welfare could become secondary to Australia’s diplomatic and commercial goals.23
Many NGOs have seen the government’s large cuts to aid as signalling a regression in Australia’s commitment to global development.24 In the new administration’s first budget, it cut total projected ODA (from FY2013 / 14 to FY2017 / 18) by AUD 7.6 billion, with the aid budget frozen in nominal terms at just over AUD 5 billion in FY2014 / 15 and FY2015 / 16, thus entailing a 10% cut in real terms compared with FY2012 / 13.25 Although the aid programme comprises less than 1.5 % of total government spending, the cuts to development assistance account
for 20% of the total projected cuts across the whole budget. The overall AUD 7.6 billion reduction incorporates AUD 4.5 billion already announced in December 2013’s Mid-Year Outlook, as well as additional cuts to the amount ‘set aside’ for aid in FY2017 / 18 and savings from a two-year delay in pegging the aid budget to inflation.26 Prior to the budget release, Foreign Affairs Minister Bishop and others publicly stated that aid would grow in line with the Consumer Price Index (CPI – i.e. inflation) from FY2014 / 15, but this will now not happen until FY2016 / 17. 27

5353
3
The outlook for Australia’s aid to sub-Saharan Africa is more austere still: in FY2014/15 funding will be reduced to AUD 106 million (3% of total country/regional spending) – 20% lower than in the previous year, which in turn was 40% lower than previously planned.28
While Prime Minister Abbott has said that his government remains committed to the “aspiration” of the 0.5% ODA/GNI target, there is no concrete timeline for achieving this, and it seems unlikely that Australia will reach this level of aid within at least the next decade.29
Indeed, in the current aid budget, Australia’s ODA/GNI is actually set to fall to just 0.29% by FY2017/18 – a direct contravention of the recent recommendation by the Australian Senate Foreign Affairs Committee that ODA/GNI should not be allowed to fall below 0.33%.30
3
RECOMMENDATIONS• Australia’s government should immediately reverse
the AUD 7.6 billion reduction to projected aid spending between FY2013/14 and FY2017/18. In line with the government’s “aspiration” and cross-party agreement to achieve 0.5% ODA/GNI, it should act swiftly to maintain ODA/GNI levels above 0.33% and set out a concrete and time-bound path to reach 0.5% by increasing aid in real terms beyond CPI inflation, starting next year.
• While rightly maintaining its comparative advantage in the Asia-Pacific region, Australia should reconsider the dramatic scale of cuts to its programmes in sub-Saharan Africa and reinstate the funding levels achieved in 2012.
• The publication, in June 2014, of a new aid framework is a welcome step, but the government should now publish more detailed information on key components, such as its strategy for increased private sector engagement and the design and implementation of new ‘Aid Investment Plans’.
It should also set out overall target results against which it can be held accountable in annual reporting, and make it very clear that poverty reduction is the ultimate test of success for Australian aid.
• Australia should not let its strong stance of recent years on aid transparency slip away.31 It should accelerate efforts to improve its IATI publication schedule so that by the end of 2015 it is publishing detailed and comprehensive aid data on a monthly basis.32 Transparency measures should also be incorporated into the government’s aid benchmarks.
• In its new development policy, Australia’s government recognises that in today’s world it is imperative to harness all kinds of financial resources for development, including private flows and domestic revenues. As such, the government should require oil, gas and mining companies to publish what they pay to governments for the commercial development of natural resources, on a project- and country-level basis with no exemptions, and should
champion this issue at the G20, particularly in 2014 when Australia holds the G20 presidency.
• The government should also take concrete steps to stem illicit financial flows from developing countries, including by implementing a public register of the individuals who own or control companies, trusts and similar legal instruments. Australia should champion this position at the G20. The government could further enhance developing countries’ prospects for domestic resource mobilisation by ensuring that they gain access to information via automatic exchange of tax information agreements, and work to provide developing countries with technical assistance to increase the capacity of tax authorities.
• Australia should endorse the Open Data Charter to make government and businesses more accountable, responsive, and effective and to spur economic growth, and should press other G20 member states to do the same.
PROFILES OF COUNTRY PROGRESS: AUSTRALIA

54 THE 2014 DATA REPORT
Canada has a long history of engagement in global development and leadership on critical issues such as nutrition and child health. Despite this, in 2013 it cut its international aid flows by 8.2%, to $4.91 billion (CAD 5.06 billion) – reducing them to their lowest level in four years. These actions led many observers of Canadian development policy to believe that further aid cuts would be inevitable; however, the international assistance envelope in the FY2013/14 federal budget remained flat.1
Amongst developing regions, sub-Saharan Africa continued to receive the largest single share (43%) of Canadian aid in 2013; this was a marked and welcome increase compared with 2004, when Canada provided only 29% of its total aid to the world’s poorest region. African countries accounted for 13 of the top 20 recipients of Canadian international assistance in FY2011/12.2 However, in line with the overall aid cuts, development assistance to sub-Saharan Africa is estimated to have been cut by 8.3% in 2013, to $2.11 billion (CAD 2.17 billion).
CANADA 2013 ODA, NET OF DEBT RELIEF
GLOBAL
$4.91 billion CAD 5.06 billion2012 – 13 CHANGE:
- 8.2% AFRICA
$2.27 billion CAD 2.34 billion 2012 – 13 CHANGE:
- 8.0%SUB-SAHARAN AFRICA
$2.11 billion CAD 2.17 billion2012 – 13 CHANGE:
- 8.3%2013 ODA/GNI
0.27%
Figure 1: Global and SSA ODA (total net, excluding debt relief), 2004 – 13
6
CA
D b
illio
ns
% o
f GN
I
5
4
3
2
1
02004 2005 2006 2007 2008 2009 2010 2011 2012 2013
Global SSA Global ODA / GNI SSA ODA / GNI
Sources: OECD DAC Tables 1 and 2a and Preliminary Release (April 2014)
Note: ODA in 2013 constant prices. Net ODA excludes bilateral debt relief, and includes both bilateral and multilateral flows (SSA imputed multilateral flows in 2013 are estimated by ONE). Converted from USD to CAD using the OECD annualised exchange rate.
0.00 %
0.05 %
0.10 %
0.15 %
0.20 %
0.25 %
0.30 %
0.35 %

5555
3
Aid policy: In 2007, Canada began to take steps to ensure that its aid was better targeted and more accountable.3 As a component of this, in 2009 it declared that 80% of its bilateral aid would be directed to a select group of ‘focus countries’.4 In June 2014 the Minister for International Development, Christian Paradis, announced that this share would increase to 90% and that the list of focus countries would increase from 20 to 25.5 Of these 25, nine are in sub-Saharan Africa: Burkina Faso, Benin, Democratic Republic of the Congo, Ethiopia, Ghana, Mali, Mozambique, Senegal and South Sudan.6
Canada has also set three main thematic priorities for its aid investments: food security, children and youth, and sustainable economic growth.7 Following the launch of the Muskoka Initiative (a global effort to address maternal mortality and improve mother and child health) at the 2010 Canadian G8 Summit, Canada has made maternal, newborn and child health (MNCH) its flagship development priority. In May 2014 it hosted an MNCH summit, at which Prime Minister Stephen Harper announced a commitment of $3.4 billion (CAD 3.5 billion) for these issues during the period 2015–20.8 He did not specify details, but did state that effective immunisation programmes and strengthening of health systems would be priorities. The government also announced a $35 million (CAD 36 million) initiative focused on research in nine sub-Saharan African countries to determine how to better meet primary health-care needs in MNCH.
Prime Minister Harper has made the Muskoka commitment a key component of his foreign policy record and has demonstrated a resolve to meet it.
Canada is one of the original country donors to the Global Agriculture and Food Security Program (GAFSP) (see below) and continues to be a global leader on nutrition. At the pre-G8 Nutrition for Growth event in 2013, it reiterated its strong support for this sector, announcing a new $137 million (CAD 141 million) pledge to scale up evidence-based nutrition interventions and signing the Nutrition for Growth compact.9
In June 2013, Canada merged its International Development Agency (CIDA) into the Department of Foreign Affairs and International Trade, renaming it the Department of Foreign Affairs, Trade and Development (DFATD). Announcing the decision in the 2013 budget, the government cited “policy coherence” as the reason for the merger.10 There has been considerable debate in the development sector about the merger, with some welcoming it and others questioning whether Canada’s development agenda will be used to serve its own economic interests, particularly as the government is placing an increased emphasis on private sector engagement.11
In-donor costs and debt relief: In 2012, $908 million (CAD 935 million), or 16%, of Canadian ODA was not transferred to developing countries. Most of this figure was made up of administrative costs
($277 million/CAD 285 million) and in-donor refugee costs ($261 million/CAD 269 million). This proportion is above the collective share of non-transferred aid in total DAC ODA in the same year (13%). Over the period 2000–12, Canada’s average in-donor costs and debt relief were even higher, at 19.7% of total ODA, peaking at 30% in 2002 and 25% in 2005, due to exceptional levels of debt relief.
Least developed countries: Canada fell short of the UN’s 0.15–0.20% ODA/GNI to LDCs target in 2012, allocating just 0.11% of GNI. This represented 34.5% of its total aid that year, which is significantly down from its peak share of 43.9% in 2010, but up from 30.1% in 2004.
Aid transparency: Canada has been a global leader in aid transparency. In Publish What You Fund’s 2013 Aid Transparency Index (which was compiled before the merger of CIDA and the Department of Foreign Affairs and International Trade), CIDA was ranked in the ‘good’ category. Canada is a member of a working group of donors piloting the IATI ‘budget identifier’, the last big piece of the IATI standard, which will bridge the gaps between IATI data and the budget classifications used by recipient governments.12 The government’s open data portal ( data.gc.ca ) includes DFATD’s IATI data. Canada has also endorsed the Open Aid Partnership.13
It is a member of the Open Government Partnership (OGP), and has made commitments on aid transparency, access to information, open data and citizen participation.14
3
PROFILES OF COUNTRY PROGRESS: CANADA

56 THE 2014 DATA REPORT
Financial transparency: The Tax Justice Network placed Canada in 17th position on its 2013 Financial Secrecy Index, indicating its disproportionate role in enabling illicit financial flows, particularly through the maintenance of a lax regulatory regime that allows the formation of anonymous shell companies.15 President Harper’s June 2013 commitment for Canada to establish new mandatory reporting on payments made by extractives companies to governments places the country on track to be a
global leader on transparency in the oil, gas and mining sectors. The government has committed to enact legislation – either at the provincial or federal level – by April 2015.16 As part of its G8 commitments following the Lough Erne Summit in June 2013, the government has committed to taking steps to improve its anti-money laundering rules and, along with other G8 members, has endorsed the Open Data Charter.17 From late 2013 to early 2014 the government held a public consultation on whether the Canada
Business Corporations Act should be amended to, among other things, allow improved access to nformation on beneficial shareholder ownership by competent authorities, including possibly through establishing a central repository of corporations.18 In February 2014, new rules came into effect to strengthen customer due diligence obligations for reporting entities.19 Canada has not expressed support for making beneficial ownership information publicly available, however.
LOOKING AHEAD TO 2015Canada’s next national election is widely expected to take place in October 2015. The Conservative party of incumbent Prime Minister Harper will likely focus on domestic policies, especially economic stewardship, with a ‘compare-and-contrast’ approach to the other party leaders. The government’s current budget projections show a surplus for 2015–16, which will undoubtedly be a feature of the coming campaign.
It is difficult to predict the political outlook for the overall aid budget. Many NGOs believed that aid would be cut in the 2014 budget, but it remained flat. As discussed above, Prime Minister Harper has embraced MNCH as a key policy priority and, if re-elected, he would likely continue to champion this set of issues. However, the long-term implications of folding CIDA into DFATD are unclear. On transparency issues, the current government
remains committed to implementing Harper’s G8 promise to enact mandatory disclosure rules for the extractive industries by June 2015. Domestic challenges, however, may test the government’s ability to deliver on this ambitious timeline.

5757
3 3
RECOMMENDATIONS • Canada should maintain robust funding for aid,
and should increase the aid budget at the next opportunity.
• Canada should maintain its leadership on global nutrition and food security with a generous pledge to GAFSP in 2014. It should continue to fulfil its Nutrition for Growth commitment and uphold the Rome Principles for Sustainable Global Food Security.
• Canada should maintain its commitment to MNCH and pledge CAD 500 million over five years during the next GAVI replenishment.
• Now that the CIDA merger has been completed, DFATD should continue to improve on CIDA’s publication to IATI and extend it to cover the whole department’s development activities.
• To ensure that ODA is accompanied by greater domestic resources available for poverty reduction in developing countries, Canada should continue to make swift progress towards implementation of mandatory disclosure regulations for the extractive industries.
• Furthermore, Canada should end its legacy of enabling illicit financial flows by supporting a public register that makes information available about who owns and controls companies, trusts and similar legal instruments.
• Canada should use its leadership on transparency to press other G20 member states to endorse mandatory disclosure rules for the extractive industries, to strengthen anti-money laundering regulations (including beneficial ownership transparency), to support open data and to make sure that developing countries are able to benefit from automatic exchange of tax information agreements.
PROFILES OF COUNTRY PROGRESS: CANADA

58 THE 2014 DATA REPORT
2013 ODA, NET OF DEBT RELIEF 1
GLOBAL – EU
$ 73.81 billion € 55.59 billion2012 – 13 CHANGE:
3.3%GLOBAL – EU28
$ 70.00 billion € 52.72 billion2012 – 13 CHANGE:
7.7%GLOBAL – EU19
$ 26.40 billion € 19.89 billion2012 – 13 CHANGE:
6.2%SUB-SAHARAN AFRICA – EU19
$ 22.65 billion € 17.06 billion2012 – 13 CHANGE:
10.7%2013 ODA/GNI – EU
0.42%
EU INSTITUTIONS
GLOBAL
$ 15.92 billion € 11.99 billion2012 – 13 change:
- 13.1%AFRICA
$ 6.06 billion € 4.57 billion2012 – 13 change:
- 19.9%SUB-SAHARAN AFRICA
$4.59 billion € 3.46 billion2012 – 13 change:
- 11.0%
EU refers to the European Union as a whole (its institutions and its member states). In tracking aid, this refers to ODA provided by the 28 EU member states plus the EU institutions’ own resources for ODA (i.e. via loans extended by the European Investment Bank (EIB), which are not imputed to member states).
EU28 refers to the 28 EU member states.
EU19 refers to the 19 EU member states that are members of the OECD Development Assistance Committee (DAC). At the time of writing, data on 2013 flows to Africa and sub-Saharan Africa is available only for this group (not the remaining nine member states or EIB loans).
EU15 refers to the 15 EU member states that joined the Union before 2002, and have committed individually to reach 0.7% ODA/GNI by 2015.2
EU13 refers to the 13 EU member states that joined the Union in 2004, 2007 and 2013, and have committed individually to reach 0.33% ODA/GNI by 2015.
EU institutions refers to the institutions that govern the EU. ‘EU institutions’ aid’ refers to the ODA that is managed by the EU institutions on behalf of the EU. This includes the European Commission and the European External Action Service, which manage ODA under the EU budget, the European Development Fund and the EIB.
EUROPEAN UNION

5959
3
60
EU
R b
illio
ns
% o
f GN
I
50
40
30
20
10
0
2004 2005 2006 2007 2008 2009 2010 2011 2012 2013
In 2013, the European Union was responsible for more than half – 54% – of the world’s official development assistance (ODA). 3 After a significant reduction in 2012, the EU as a whole provided $73.8 billion (€55.6 billion) in 2013, an increase of 3.3%. Of this amount, $70.0 billion (€52.7 billion) was provided by the 28 EU member states, representing an increase of $5.0 billion (€3.8 billion), or
7.7% compared with the previous year. The EU institutions managed an ODA budget of $15.9 billion (€12.0 billion) in 2013, down by 13.1% from 2012. This decrease was largely driven by a drop in ODA-eligible loan disbursements by the EU institutions (which fell by $2.65 billion/€2.00 billion). According to the European Commission, this large decrease in EU
institutions’ aid is partially explained by a spike in ODA loan repayments from developing countries (which reduces the net volumes of aid). However, the EU institutions’ gross aid flows also decreased by 9.5%, according to preliminary data. The reasons for the overall drop are difficult to fully explain until details emerge in the final data in December.
Figure 1: EU28 and EU Institutions’ Global ODA (total net, excluding debt relief), 2004–13
3
0.00 %
0.05 %
0.10 %
0.15 %
0.20 %
0.25 %
0.30 %
0.45 %
0.40 %
0.35 %
EU28 EU Institutions EU28 ODA / GNI
Sources: OECD DAC Tables 1 and 2a and Preliminary Release (April 2014); European Commission Memo (April 2014) ‘Publication of Preliminary Data on Official Development Assistance’
Note: ODA in 2013 constant prices (using DAC country deflators where available; otherwise the euro-specific deflator). Net ODA excludes bilateral debt relief where this data is available (for the 19 EU member states that are members of the DAC), and includes both bilateral and multilateral flows. Converted from USD to EUR using the OECD annualised exchange rate for 2013. EU institutions’ ODA is mostly imputed back to the 28 member states (and hence is not additional to the EU28 volumes shown here), although a portion – made up of ODA loans provided by the EIB’s own resources – is not imputed to member states, and is thus additional.
EU MEMBER STATESGLOBAL ODA
Taking a closer look at member states, we see that 15 donors boosted their ODA in 2013, with the UK accounting for two-thirds of the overall increase, and
Germany, Italy and Sweden making up most of the rest (see Table 1). Thirteen member states decreased their development assistance in 2013, with just three – France, the Netherlands and Portugal – responsible for over 80% of the combined total cuts. In relative terms,
Croatia – the newest EU member state – increased its ODA by the most (103%), followed by the UK (28%), Estonia (19%), Bulgaria (14%) and Italy (13%).
PROFILES OF COUNTRY PROGRESS: EUROPEAN UNION

60 THE 2014 DATA REPORT
2013 ODA € millions
2012–13 change€ millions
2012–13 change%
2013 ODA / GNI
Austria 849 56 7.1% 0.27%
Belgium 1,709 94 5.8% 0.45%
Bulgaria 37 4 13.8% 0.10%
Croatia 32 16 103.4% 0.07%
Cyprus 19 – 2 – 9.4% 0.11%
Czech Republic 160 – 8 – 4.7% 0.11%
Denmark 2,205 81 3.8% 0.85%
Estonia 23 4 18.8% 0.13%
Finland 1,081 37 3.5% 0.55%
France 8,055 – 276 – 3.3% 0.38%
Germany 10,498 649 6.6% 0.37%
Greece 230 – 19 – 7.7% 0.13%
Hungary 91 – 5 – 4.8% 0.10%
Ireland 619 – 12 – 1.9% 0.45%
Italy 2,447 288 13.3% 0.16%
Latvia 18 2 12.4% 0.08%
Lithuania 39 – 3 – 7.0% 0.12%
Luxembourg 324 4 1.2% 1.00%
Malta 14 – 1 – 4.6% 0.20%
Netherlands 4,048 – 221 – 5.2% 0.66%
Poland 357 28 8.6% 0.10%
Portugal 365 – 93 – 20.4% 0.23%
Romania 101 – 15 – 13.2% 0.07%
Slovak Republic 64 1 2.4% 0.09%
Slovenia 45 0 – 0.7% 0.13%
Spain 1,473 – 65 – 4.2% 0.14%
Sweden 4,392 259 6.3% 1.02%
UK 13,426 2,974 28.5% 0.72%
EU28 52,721 3,778 7.7% 0.40%
Total EU 55,594 1,779 3.3% 0.42%
EU institutions 11,994 – 1,805 – 13.1% n/a
Sources: OECD DAC Tables 1 and 2a and Preliminary Release (April 2014); European Commission Memo (April 2014) ‘Publication of Preliminary Data on Official Development Assistance’
Note: ODA in 2013 constant prices (using DAC country deflators where available; otherwise the euro-specific deflator). Net ODA excludes bilateral debt relief where this data is available (for the 19 EU member states that are members of the DAC), and includes both bilateral and multilateral flows. EU member states that are not members of the DAC are shown in italics. Converted from USD to EUR using the OECD annualised exchange rate for 2013. EU institutions’ ODA is mostly imputed back to the 28 member states (and hence is not additional to the EU28 volumes shown here), although a portion – made up of ODA loans provided by the EIB’s own resources – is not imputed to member states, and is thus additional.
Table 1: EU Global ODA (total net, excluding debt relief)

6161
3
In 2005, the EU pledged to meet a collective ODA/GNI ratio of 0.7% by 2015. In 2013, the EU as a whole (including ODA from EIB loans) achieved an ODA/GNI of 0.42%, barely up from 0.41% in 2012, and lower than the 2011 peak of 0.43%. Looking purely at the efforts of member states (excluding EIB loans), the EU28 reached an ODA/GNI of 0.40%, up from 0.37% in 2012, and following two consecutive years of decline. This suggests that, as a collective, the EU is slowly getting back on track towards its aid commitments, although at nowhere near the pace needed to achieve them by 2015. As shown in Section 1, to achieve 0.7%, the EU would collectively need to raise its ODA by $51.9 billion (€39.1 billion) over the next two years.
The collective 0.7% target was accompanied by individual targets for member states. The EU15 promised to maintain their ODA/GNI ratio if it was at or above 0.7%, or otherwise to raise it to 0.7% by 2015. In 2013 only four EU countries – Sweden, Luxembourg, Denmark and (for the first time) the UK – surpassed 0.7% ODA/GNI.4 Sweden and Luxembourg continued to meet their voluntary 1.0% targets; Denmark achieved ODA/GNI of 0.85%, but has yet to reach its voluntary target of 1.0%.5 The Netherlands, which had met 0.7% every year since 1975 (although, excluding debt relief, fell just short in 2012), dropped out of the 0.7% group completely in 2013. Italy (0.16%), Spain (0.14%) and Greece (0.13%) were the clear laggards among the EU15 and the furthest away from their 2015 ODA/GNI target. Countries that joined
the EU after 2002 (‘the EU13’) committed to individual ODA/GNI targets of 0.33%, but none of them had yet reached their target by 2013. The most generous donors among the EU13 were Malta (at 0.20%, now a bigger donor by this measure than Italy, Spain or Greece), Estonia (0.13%) and new DAC member Slovenia (0.13%). Meanwhile the Slovak Republic, Latvia, Croatia and Romania failed to achieve ODA/GNI levels of even 0.1%.
THE EU’S AFRICA COMMITMENT
As well as meeting 0.7% by 2015, the EU also committed to allocating half of its total increases in ODA to Africa. As shown in Section 1, in order to meet this target increase, the EU19 would need to increase their aid to the
Sources: OECD DAC Preliminary Release (April 2014); European Commission Memo (April 2014) ‘Publication of Preliminary Data on Official Development Assistance’
Note: Net ODA excludes bilateral debt relief where this data is available (i.e. for the 19 EU member states that are members of the DAC), and includes both bilateral and multilateral flows.
% o
f GN
I
1.20 %
1.00 %
0.80 %
0.60 %
0.40 %
0.20 %
0.00 %
Sw
eden
Luxe
mb
ourg
Den
mar
k
UK
The
Net
herl
ands
Fin
land
Irel
and
Bel
gium
Fran
ce
Ger
man
y
Aus
tria
Por
tuga
l
Ital
y
Sp
ain
Gre
ece
Mal
ta
Est
onia
Slo
veni
a
Lith
uani
a
Cze
ch R
epub
lic
Cyp
rus
Bul
gari
a
Hun
gary
Pol
and
Slo
vak
Rep
ublic
Latv
ia
Cro
atia
Rom
ania
3
Figure 2: EU28 ODA/GNI (%) Against Targets, 2013
PROFILES OF COUNTRY PROGRESS: EUROPEAN UNION

62 THE 2014 DATA REPORT
continent by an additional $31.3 billion (€23.6 billion) by 2015. However, not only has the EU failed to stay on track to meet this target, it has also failed to allocate half of its actual aid increases to Africa. Between 2004 6 and 2013, the EU19 increased their total aid by $23.1 billion (€17.4 billion), yet their aid to Africa rose by only $6.4 billion (€4.8 billion), only slightly more than a quarter of this amount. The good news is that, following disproportionate cuts in 2012, ODA to Africa was on the rise again in 2013, with an estimated increase of $1.47 billion (€1.11 billion), or 6.0%. Nevertheless, the EU is still a long way from meeting its promise to the continent.
AID TO SUB-SAHARAN AFRICA
As part of their 2005 ODA commitments, the EU countries also made a pledge to increase ODA to sub-Saharan Africa, though without specifying an amount or a target date. Between 2004 and 2010, the EU19’s ODA to the region increased steadily, but took hard hits during the period of overall aid cuts in 2011 and 2012. However, in 2013 EU19 aid to sub-Saharan Africa regained its upwards course, growing by $2.2 billion (€1.7 billion), or 10.7%, to a total of $22.6 billion (€17.1 billion). This boost is largely attributable to the
UK’s increased efforts, which accounted for $1.5 billion (€1.1 billion), or 68%, of the total EU19 increase in aid to the region. In fact, examining donors’ performances individually, eight of the EU19 donors are estimated to have decreased their aid to the region in 2013.
Three EU19 donors allocated more than half of their total aid to sub-Saharan Africa in 2013: Portugal (61%), Ireland (53%) and Belgium (52%). Notably, the Netherlands (28%) has the sixth lowest share among the EU19, in spite of the fact that two-thirds of its partner countries are located in the region.
EU INSTITUTIONSAs mentioned at the outset, the EU institutions also manage an ODA budget, most of which comes directly from member states’ contributions. After a period of increasing ODA flows, total development assistance managed by the EU institutions decreased significantly by $2.4 billion (€1.8 billion), or 13.3%, in 2013. This decline was partly due to a lower level of concessional loans than in 2012, and to a spike in repayments of earlier loans. 7 These reductions also affected aid to Africa and sub-Saharan Africa: after a major increase of 26% in ODA to Africa in 2012, the EU institutions gave the continent 20% less assistance in 2013. EU institutions’ ODA to sub-Saharan Africa fell in 2013 by 11% to $4.6 billion (€3.4 billion).
In December 2013, the EU institutions adopted the bloc’s Multiannual Financial Framework (MFF) for 2014 – 20. 8 In a historic reduction of the overall seven-year budget
against the backdrop of the European economic and financial crisis, EU leaders protected development assistance to the poorest countries from cuts, and de facto froze it at 2007 – 13 levels. 9 Under the new MFF, overall aid spending (including ODA to all recipients and humanitarian assistance) will actually increase by 3.3%.
Aid policy: The EU institutions’ development assistance is guided by the 2012 EU development policy ‘An Agenda for Change’, which prioritises human rights, democracy and good governance on the one hand and inclusive growth for development (including sustainable agriculture and energy, human development and private sector engagement) on the other. 10 Countries neighbouring Europe and sub-Saharan Africa have been identified as clear priority regions, with an emphasis on support to fragile, crisis and post-crisis states. Consequently the EU
institutions are expected to phase out 16 bilateral programmes in middle-income countries in Asia and Latin America over the coming years. 11 In recent years, Commissioner for Development Andris Piebalgs has made several specific commitments and has launched a number of initiatives to drive the EU towards delivering on the objectives outlined in the Agenda for Change. For example, last year the EU pledged up to €410 million for nutrition-specific interventions and €3.1 billion for nutrition-sensitive programmes between 2014 and 2020.
In-donor costs and debt relief: Between 2000 and 2012, the vast majority of ODA from EU institutions was transferred to developing countries, and in-donor costs were kept well below 10% every year. However, over the same period, the total in-donor costs and debt relief of the EU19 averaged 20.4%.

6363
3
Least developed countries: EU member states recommitted in 2011 to collectively allocate a share of 0.15–0.20% ODA/GNI to LDCs. 12 However, in 2012 the EU19 collectively allocated just 0.11% of their GNI to LDCs.
Aid transparency: The European Commission is an original signatory to the International Aid Transparency Initiative (IATI). Publish What You Fund’s 2013 Aid
Transparency Index ranked four departments of the Commission that manage ODA in the ‘fair’ category of the index. 13
Financial transparency: In recent years, the EU has championed mandatory transparency measures for the private sector, which will help to stem illicit financial flows that undermine the efforts of developing country
governments to generate domestic revenues. In June 2013, reporting requirements were passed for oil, gas and mining companies, and in March 2014 the European Parliament called for public disclosure of who owns European companies and trusts in the revised Anti-Money Laundering Directive. 14 If passed, this legislation would crack down on anonymous shell companies that are often involved in facilitating these illicit financial flows.
LOOKING AHEAD TO 2015 In June 2014, European leaders endorsed the reaffirmation of their collective and individual ODA commitments for 2015. 15 However, the EU will collectively need to mobilise an additional $51.9 billion
(€39.1 billion) over 2014 and 2015, if it is to meet its 0.7% ODA/GNI target. Of this amount, $31.3 billion (€23.6 billion) would need to be allocated to Africa in order to meet the target of channelling half of all ODA
increases (compared with 2004) to the continent. However, current projections by the European Commission estimate that, while total EU ODA is set to increase, it will reach only 0.45% of GNI by 2015.16
3
RECOMMENDATIONS• EU member states must accelerate progress towards
the 2015 0.7% ODA/GNI target by significantly increasing their development assistance over the coming two years. To honour their commitments to the world’s poor, the EU28 must increase their aid to Africa, with a special focus on the sub-Saharan region and LDCs.
• The new EU leadership should mobilise the support of member states to meet their 2015 ODA commitments, and should renew the political will among European
leaders and policy makers to lead global commitments for a world free of extreme poverty by 2030.
• The new European Parliament must continue to support Europe’s efforts to scale up ODA resources, invest further in Africa’s agriculture and health sectors and clamp down on corruption. In finalising the Anti-Money Laundering Directive, the Parliament and EU member states should ensure that beneficial ownership information is made public, and should eliminate the ‘phantom firms’ that enable criminals
and corrupt businesses to hide money, evade tax and cheat citizens in poor countries of public resources.
• The EU institutions must address the disproportionate reductions in ODA to Africa resulting from fluctuations in concessional loans. In the implementation of the 2014 – 20 EU budget, they should focus their aid efforts on the world’s poorest countries and on catalytic sectors such as health and agriculture, including through global initiatives such as GAVI and the Global Fund.
PROFILES OF COUNTRY PROGRESS: EUROPEAN UNION
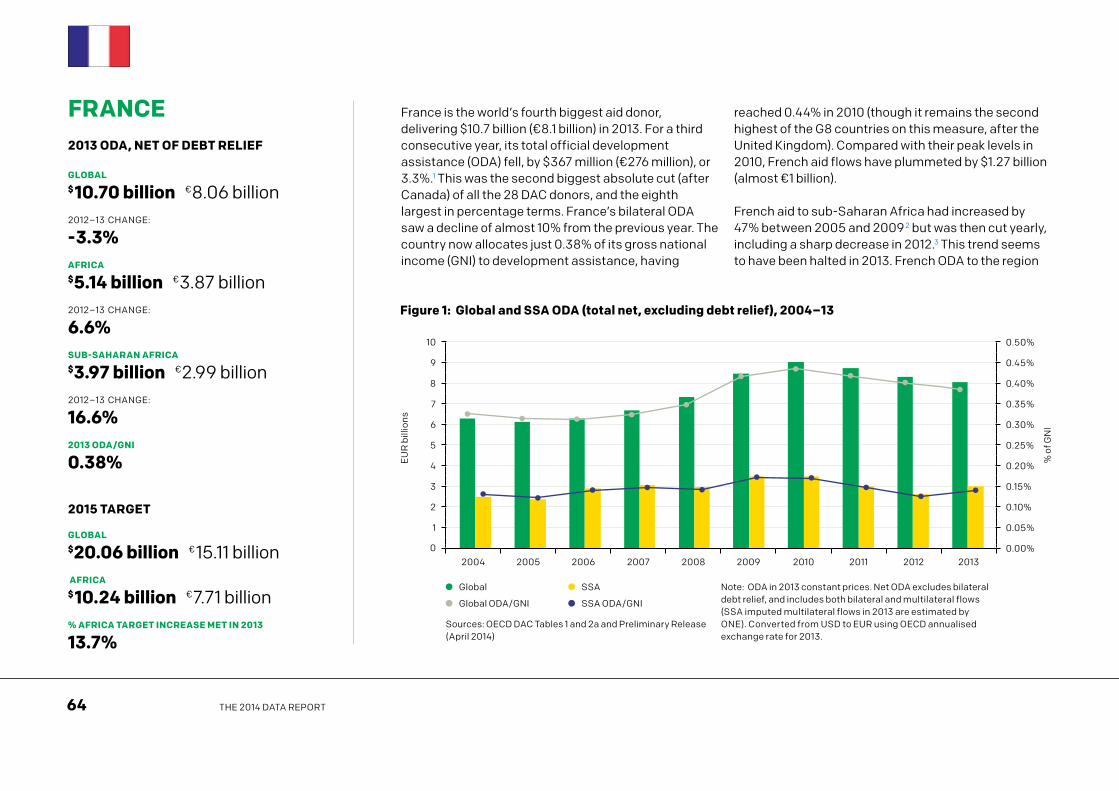
64 THE 2014 DATA REPORT
France is the world’s fourth biggest aid donor, delivering $10.7 billion (€8.1 billion) in 2013. For a third consecutive year, its total official development assistance (ODA) fell, by $367 million (€276 million), or 3.3%.1 This was the second biggest absolute cut (after Canada) of all the 28 DAC donors, and the eighth largest in percentage terms. France’s bilateral ODA saw a decline of almost 10% from the previous year. The country now allocates just 0.38% of its gross national income (GNI) to development assistance, having
reached 0.44% in 2010 (though it remains the second highest of the G8 countries on this measure, after the United Kingdom). Compared with their peak levels in 2010, French aid flows have plummeted by $1.27 billion (almost €1 billion).
French aid to sub-Saharan Africa had increased by 47% between 2005 and 2009 2 but was then cut yearly, including a sharp decrease in 2012.3 This trend seems to have been halted in 2013. French ODA to the region
FRANCE 2013 ODA, NET OF DEBT RELIEF
GLOBAL
$ 10.70 billion €8.06 billion2012 – 13 CHANGE:
- 3.3%AFRICA
$5.14 billion €3.87 billion2012 – 13 CHANGE:
6.6%SUB-SAHARAN AFRICA
$3.97 billion €2.99 billion2012 – 13 CHANGE:
16.6%2013 ODA/GNI
0.38%
2015 TARGET
GLOBAL
$20.06 billion € 15.11 billion AFRICA
$ 10.24 billion € 7.71 billion% AFRICA TARGET INCREASE MET IN 2013
13.7%
Figure 1: Global and SSA ODA (total net, excluding debt relief), 2004 – 13
0.00 %
0.05 %
0.10 %
0.15 %
0.20 %
0.25 %
0.30 %
0.35 %
0.40 %
0.45 %
0.50 %
EU
R b
illio
ns
10
% o
f GN
I
9
8
7
6
5
4
3
2
1
02004 2005 2006 2007 2008 2009 2010 2011 2012 2013
Global SSA
Global ODA / GNI SSA ODA / GNI
Sources: OECD DAC Tables 1 and 2a and Preliminary Release (April 2014)
Note: ODA in 2013 constant prices. Net ODA excludes bilateral debt relief, and includes both bilateral and multilateral flows (SSA imputed multilateral flows in 2013 are estimated by ONE). Converted from USD to EUR using OECD annualised exchange rate for 2013.

6565
3
has increased by some 17% to almost $4 billion (almost €3 billion).4 Nevertheless, this restores French support for the region only to the level achieved in 2008. As a proportion of national income, French aid to sub-Saharan Africa in 2013 was 0.14%.
A further cause for concern is that, according to French government documents, the level of project-specific grants5 – the type of funding that most benefits the poorest countries, particularly in sub-Saharan Africa – fell by 2.8% in 2013 (for more on loans, see below). Under France’s EU commitment, half of its aid increases should be allocated to Africa. However, it is estimated that only 13.7% of promised increases to the continent will actually have been made by 2015.
Aid policy: France has a list of 16 priority poor countries,6 all of which are in sub-Saharan Africa, which its aid policy specifies should receive at least 50% of total bilateral grants.7 However, this provision is insufficient, as a declining amount of the country’s overall ODA is spent in this grant form.8 In its new programme law, France has established four priority areas for its aid.9 However, in the current allocation of the aid budget, three sectors clearly stand out: infrastructure (increasingly in the energy sector), health (mostly via multilateral channels) and agriculture (mostly via bilateral channels). In 2013, 44% of the French Development Agency (Agence Française de Développement, or AFD)’s assistance of €7.5 billion went towards infrastructure and urban development
(including a substantial sum for the energy sector), and 4.5% was dedicated to agriculture and food security.
In-donor costs and debt relief: In 2012 some $3.6 billion, or 28%, of French ODA was not transferred to developing countries. Most of this figure was made up of debt relief ($1.5 billion) and imputed student costs ($976 million). This proportion was more than double the share of in-donor costs and non-transferred aid in total DAC ODA in the same year (13%). Over the period 2000–12, France’s average in-donor costs were even higher, amounting to 34% of total ODA, and even reaching more than 50% in some years (2003, 2005 and 2006) – again, mostly due to debt relief and imputed student costs.
Figure 2: Africa ODA and Path to 2015 Africa Target
Africa bilateral ODA (excluding debt relief) Africa multilateral ODA Africa bilateral debt relief Africa target ODA
Sources: OECD DAC Table 2a, Preliminary Release (April 2014), and OECD Economic Outlook Annex Table 1
Note: Net ODA in 2013 constant prices. Imputed multilateral flows in 2013 are estimated by ONE. Target ODA for 2014–15 is calculated using a smoothed 2004 baseline, unlike the rest of this report. The targets also rely on GNI projections for 2014–15 (based on the OECD’s GDP growth projections), with the EU aid commitments to reach 0.7% ODA/GNI by 2015 and to allocate half of the increases to Africa. Converted from USD to EUR using OECD annualised exchange rate for 2013.
EU
R m
illio
ns
10,000
9,000
8,000
7,000
6,000
5,000
4,000
3,000
2,000
1,000
02004 2005 2006 2007 2008 2009 2010 2011 2012 2013 2014 2015
1,881
1,373
1,605
2,183
1,572
2,404
2,235
1,503
593
1,958
1,609
521
1,989
2,218
1,108
2,138
1,999
1,161
2,513
1,529
926
2,096
1,537
1,163
2,230
1,641
77
5,831
7,713
1,716
1,384
2,547
3
PROFILES OF COUNTRY PROGRESS: FRANCE

66 THE 2014 DATA REPORT
Least developed countries: France fell short of the UN’s 0.15% ODA/GNI to LDCs target in 2012, allocating only 0.09% of GNI, in line with the DAC average.10 This represented less than a quarter (23.5%) of its total aid that year, compared with a DAC average of 31.9%.
ODA loans: France includes substantial volumes of loans in its ODA. Furthermore, its loans tend to be extended on much harder terms than those of most other DAC donors (in terms of interest rates, grace periods and maturities). In 2012, the average grant element of French ODA loans was less than 50%.11 Furthermore, France is one of a number of DAC donors that have been providing unsubsidised loans raised on financial markets as ‘concessional’ aid (a practice enabled by the DAC’s out-of-date 10% reference rate,12 which is currently under review; see Section 2). If more realistic reference rates were applied, only 28 of France’s 72 concessional loans in 2012 would have qualified as ODA.13
Aid transparency: Having performed poorly in Publish What You Fund’s 2013 Aid Transparency Index, France has made good progress on aid transparency over the past year. Its first development law, which was adopted by Parliament in June 2014, is a historic step that will enable markedly greater democratic control of policy, with a monitoring report to be adopted by Parliament every two years.14 It does, however have a major weakness: it does not enable financial programming
(i.e. it does not set financial objectives or the ODA trajectory for the next few years). At the 2013 G8 summit in Lough Erne, France made a commitment to implement the International Aid Transparency Initiative (IATI) common standard in its publishing of aid data.15 It began by publishing details of its aid to Mali in the IATI format on a website created for the purpose, launched in January 2014, which enables citizens to notify the government about any suspected corruption.16 In June 2014, France updated its schedule for implementing IATI, and the Ministry of Foreign Affairs and International Development also published information on aid to Burkina Faso, Niger and Mauritania, as well as humanitarian assistance, in IATI format. However, there is clear room to improve the comprehensiveness, quality and frequency of published information. Budgetary documents do contain more information than was previously the case, in particular concerning ODA loans. The government has also decided to join the Open Government Partnership (OGP), and intends to present an action plan in order to formalise its membership.17
Innovative finance: France has been a leader in innovative finance for development for years. It was one of the initiators of the air passenger solidarity tax18 and is the first country in the world to have a financial transaction tax (FTT), from which 15% of revenues are allocated towards development.19 It is also the second biggest contributor to the
International Fund for Immunisation (IFFIm).20 Most of the innovative finance mechanisms have been used to finance global health (such as through UNITAID, GAVI, the Global Fund and bilateral initiatives). France also uses debt swaps21 and a voluntary water levy that allows local authorities and water agencies in France to allocate up to 1% of their profits to aid water projects in developing countries.22
Financial transparency: The Tax Justice Network’s Financial Secrecy Index gives France a secrecy score of 43 points out of 100, placing it in the ‘moderate’ range and suggesting that there is progress to be made in ensuring financial transparency to deter corruption and illicit flows.23 In 2013, France adopted two laws to enhance financial transparency. One concerns the regulation and separation of banking activities and is the first ever legislative text anywhere in the world to introduce country-by-country reporting for banks, making it compulsory for them to make information available on their subsidiaries and turnover, with the aim of tackling tax fraud. The second law, which aims to combat tax evasion and illicit financial activities, creates a compulsory public register of trusts, including French beneficial owners of foreign trusts, and increases sanctions for non-compliance.

6767
3
LOOKING AHEAD TO 2015The French Parliament recently adopted the country’s first ever development law. The challenge for the rest of 2014 will be to secure an adequate budget to finance the new policy. However, the outlook is bleak. Payment appropriations for ODA have already been revised downwards in 2014.24 In the context of its triennial budget for 2015–17, the government is looking to save €50 billion, and ODA spending has not been ring-
fenced. In addition, the trend of increasing ODA loans to boost overall aid flows is not sustainable and in 2014, for the first time since 2008, it is likely that the amount of new French ODA loans will start to decrease.25
However, there is still time for the government to agree on a “credible and ascending path”, as stated by President François Hollande, to meet its international
commitment of 0.7% GNI/ODA.26 To meet its 0.7% pledge, France would have to increase its ODA by €7 billion by 2015.27 Any rise in aid should include an increase to sub-Saharan Africa and to LDCs. The triennial budget is a prime opportunity to prevent what could be seen as France’s withdrawal from international solidarity and to get the country back on track in advance of the next presidential election in 2017.
3
RECOMMENDATIONS• The French government should immediately boost
aid spending in the triennial budget, and reinstate a clear and ambitious path towards meeting its international 0.7% commitment.
• France should urgently allocate a higher proportion of its aid to the LDCs, particularly in sub-Saharan Africa.
• France should publish all its ODA data in the IATI format, not only data relating to its 16 priority countries.
• France should use upcoming international opportunities to demonstrate renewed leadership on global development and earn credibility to successfully host the next major set of climate negotiations at the end of 2015: – This includes ensuring that a significant portion
of revenues generated by the European FTT is allocated to development and is additional to existing aid levels.
– France should remain a leader on global health, including by providing strong support to GAVI during its current replenishment for 2016– 20.
• As a member of the EU, France should continue to help ensure that EU-wide legislation introduces an obligation to put information about who owns and controls companies, trusts and similar legal instruments in the public domain, thereby helping to ensure that ODA is accompanied by greater domestic public resources in developing countries.
• It should also ensure that developing countries are included in the new automatic exchange of tax information and continue to help strengthen the capacities of their tax authorities, for example via the initiative Tax Inspectors without Borders (TIWB).
PROFILES OF COUNTRY PROGRESS: FRANCE

68 THE 2014 DATA REPORT
After an alarming decrease in 2012, German aid levels substantially recovered in 2013. Germany remains the third biggest bilateral aid donor, providing total official development assistance (ODA) of $13.9 billion (€10.5 billion) in 2013, up by $862 million (€649 million), or 6.6%, from 2012. This was the third biggest absolute increase of all DAC donors and the eighth biggest in percentage terms. Nevertheless, relative to its economic strength, at 0.37% Germany contributes less than the collective ODA/gross national income (GNI) of the EU15 (0.43%).1
Furthermore, German aid to Africa is estimated to have fallen in 2013, by $633 million (€477.2 million), or 13.9%, to $3.9 billion (€2.9 billion). Aid to sub-Saharan Africa is estimated to have fallen even more significantly, by 17.4%, to $3.0 billion (€2.3 billion). As in some previous years, these decreases both for the continent as a whole and for the sub-Saharan region may turn out to be smaller in the final figures to be published by the Development Assistance Committee (DAC) in December; one of the reasons being that only one of the government departments
GERMANY2013 ODA, NET OF DEBT RELIEF
GLOBAL
$ 13.94 billion € 10.50 billion2012 – 13 CHANGE:
6.6%AFRICA
$3.91 billion €2.95 billion2012 – 13 CHANGE:
- 13.9%SUB-SAHARAN AFRICA
$3.00 billion €2.26 billion2012 – 13 CHANGE:
- 17.4%2013 ODA/GNI
0.37%
2015 TARGET
GLOBAL
$27.02 billion €20.35 billionAFRICA
$ 12.68 billion €9.55 billion% AFRICA TARGET INCREASE MET IN 2013
9.2%
Figure 1: Global and SSA ODA (total net, excluding debt relief), 2004 – 13
12
EU
R b
illio
ns
% o
f GN
I
10
8
6
4
2
02004 2005 2006 2007 2008 2009 2010 2011 2012 2013
Global SSA
Global ODA / GNI SSA ODA / GNI
Source: OECD DAC Tables 1 and 2a and Preliminary Release (April 2014)
Note: ODA in 2013 constant prices. Net ODA excludes bilateral debt relief, and includes both bilateral and multilateral flows (SSA imputed multilateral flows in 2013 are estimated by ONE). Converted from USD to EUR using OECD annualised exchange rate for 2013.
0.00 %
0.05 %
0.10 %
0.15 %
0.20 %
0.25 %
0.30 %
0.35 %
0.40 %
0.45 %

6969
3
contributing to Germany’s total ODA – the Federal Ministry for Economic Cooperation and Development (BMZ) – provides a regional breakdown in this preliminary release.2 However, the size of the decrease according to the preliminary information remains a huge concern. Based on its 2005 commitments to reach 0.7% ODA/GNI and to provide half of total ODA increases to Africa, Germany’s Africa target for 2015 is $12.7 billion (€9.6 billion). However, by 2013 it had met only 9.2% of the target increase. Germany has consistently provided less ODA to sub-Saharan Africa, relative to its GNI, than other major donors.
Aid policy: In 2012, four sub-Saharan African countries were among the top 10 recipients of German bilateral aid: the Democratic Republic of the Congo (DRC), Kenya, Ethiopia and Tanzania (although DRC and Kenya figure only due to debt relief), and the number of G20 recipients declined to just three (China, India and Brazil).3 However, given the large estimated decrease in German aid to sub-Saharan Africa in 2013, a greater focus on the poorest countries is still necessary. Budget documents for FY2014 show that the percentage of bilateral funds for Africa from the BMZ will increase slightly from 47.4% to 49.1% and annual
commitment authorisations will increase from €1.2 billion to €1.3 billion – an important first step.4
Following the 2013 federal election, Gerd Müller became the new Minister for Economic Cooperation and Development. He has presented three special initiatives addressing food security, refugees and the stabilisation of North Africa and the Middle East.5 The first of these will focus particularly on sub-Saharan Africa. Accordingly, the BMZ has announced that it will increase annual allocations for rural development and food security from €700 million to at least €1 billion.6
Figure 2: Africa ODA and Path to 2015 Africa Target
EU
R m
illio
ns
10,000
9,000
8,000
7,000
6,000
5,000
4,000
3,000
2,000
1,000
0
2004 2005 2006 2007 2008 2009 2010 2011 2012 2013 2014 2015
Africa bilateral ODA (excluding debt relief) Africa multilateral ODA Africa bilateral debt relief Africa target ODA
Sources: OECD DAC Table 2a, Preliminary Release (April 2014); and OECD Economic Outlook Annex Table 1
Note: Net ODA in 2013 constant prices. Imputed multilateral flows in 2013 are estimated by ONE. Target ODA for 2014–15 is calculated using a smoothed 2004 baseline, whereby multilateral contributions in 2004–05 are averaged; however, the 2004 and 2005 volumes shown here are the actual (unsmoothed) values. The targets also rely on GNI projections for 2014–15 (based on the OECD’s GDP growth projections), with the EU aid commitments to reach 0.7% ODA/GNI by 2015 and to allocate half of the increases to Africa. Converted from USD to EUR using the OECD annualised exchange rate for 2013.
3
PROFILES OF COUNTRY PROGRESS: GERMANY
1,002
1,507
247
1,100
1,570
1,930
1,312
1,649
595
1,452
1,755
558
1,522
1,718
64
1,453
1,785
89
1,733
1,720
186
1,794
1,629
417
1,235
1,711
304
6,401
9,552
1,089
1,038
1,267

70 THE 2014 DATA REPORT
Germany thus remains the only G8 country to maintain (and, indeed, considerably increase) beyond the original pledge period the level of funding pledged during the L’Aquila G8 Summit. Germany has also maintained its longstanding focus on access to improved water and sanitation, disbursing more to this sector than any other donor between 2007 and 2012.
In-donor costs and debt relief: In 2012, $2.2 billion, or 16%, of total German ODA was not transferred to developing countries, mostly due to imputed student costs of $936 million, administrative costs ($519 million) and debt relief ($575 million). Over the period 2000–12, Germany’s average share of non-transferred ODA was even higher (24%), peaking at more than 40% in 2005 (due to debt relief).
Least developed countries: Germany fell short of the UN’s 0.15–0.20% ODA/GNI to least developed countries (LDCs) target in 2012, allocating only 0.09% of its GNI (the same as the DAC collective share). However, this represented only 25.8% of its total aid in that year.
ODA loans: Germany includes substantial volumes of loans in its ODA. Furthermore, its loans tend to be extended on much harder terms than those of most other DAC donors (in terms of interest rates, grace periods and maturities). In 2012, the average grant element of German ODA loans was less than 50%.7 Furthermore, Germany is one of several DAC donors
that have been providing unsubsidised loans raised on financial markets as ‘concessional’ aid (a practice enabled by the DAC’s out-of-date 10% reference rate, which is currently under review; see Section 2). If more realistic reference rates were applied, only between 21 and 33 of the 96 concessional loans made in 2012 would have qualified as ODA.
Aid transparency: Publish What You Fund’s 2013 Aid Transparency Index showed mixed results for Germany’s aid transparency. BMZ began publishing to the International Aid Transparency Initiative (IATI) in March 2013, and is the government agency responsible for publishing the activities of its implementing agencies. Because of this arrangement, the 2013 Index assessed Germany’s two principal bilateral aid agencies, the Deutsche Gesellschaft für Internationale Zusammenarbeit (GIZ) and the KfW Entwicklungsbank, alongside the BMZ – both were ranked in the ‘fair’ category. The Federal Foreign Office (the Auswärtiges Amt) was also included for the first time in the 2013 Index; its performance was deemed ‘very poor’.8 In March 2014, BMZ started to include information about the government funds channelled through German NGOs in its IATI publication. A new transparency portal for GIZ projects was launched in April 2014, and BMZ is planning to launch its own portal in July this year. Germany is not a member of the Open Government Partnership; however, the coalition treaty of the current grand coalition includes an intention to join it.9
Innovative finance: The German government is actively engaged at the EU level in introducing a Financial Transaction Tax (FTT). The tax is based on a Franco-German agreement, and the Economic and Financial Affairs Council (ECOFIN) has agreed that it will be introduced on 1 January 2016. The Social Democratic Party has called for its proceeds to be used for development,10 and Minister Müller has recently expressed the same preference.11 In the past, Germany has also supported innovative mechanisms such as Debt2Health.12 However, despite budgetary provisions allowing for debt swaps, this instrument was not used in 2013 due to a lack of political attention from the previous government.
Financial transparency: Thanks in large part to Frankfurt’s role as the largest financial centre in continental Europe, Germany scored 59% on the Tax Justice Network’s 2013 Financial Secrecy Index, which (when globally weighted) makes it the eighth most financially secretive country in the world, indicating that it needs to make substantial progress to impede and deter illicit financial flows.13 The pending introduction of EU-wide legislation that would make information about the owners of companies, trusts and similar legal instruments publicly available offers a good opportunity for Germany to actively support progress in this area.

7171
3
LOOKING AHEAD TO 2015Next year will be a historic moment in the fight against poverty, and – as the largest economy in Europe and one of the most important aid donors in the world – Germany will play an extraordinarily important role. In 2015, the world’s attention will focus on the country as holder of the G7 / G8 presidency in this historic year. By the time of the G7 / G8 summit, the international community will be close to agreeing the post-2015 global development agenda. The German presidency should ensure that the G7 / G8 are in a position to lend decisive support for an ambitious and accountable new agenda.
In the coalition treaty, the current government has agreed to increase annual ODA by a cumulative total of €2 billion between 2014 and 2017. 14 Thus, the threat of cuts to aid – which has loomed large in recent years – has been assuaged. However, this decision would mean year-on-year increases of only €200 million.15 In order to keep pace with inflation and the growth of Germany’s national income, annual increases of more than €250 million would be necessary to maintain (let alone increase) its current ODA/GNI ratio of 0.37%.
The medium-term financial plan is particularly disappointing in two respects. Firstly, it shows that a quarter of the ODA increases promised in the coalition treaty are reversals of cuts planned under the previous government, rather than new increases. Secondly, the budgetary increase for the BMZ in 2015 is a meagre €1.6 million. If this plan is implemented, Germany will have a serious credibility problem during its G7 / G8 presidency and will struggle to shape an ambitious global agenda to end extreme poverty.
3RECOMMENDATIONS• The German government should mobilise substantial
further ODA from both the core budget and from innovative financing mechanisms such as the FTT, with these extra funds prioritised towards Africa. This would contribute to Germany making steps towards the 2015 target of 0.7% as stipulated in the coalition treaty, and would boost its aid flows to Africa as it has committed to do within the EU. In the immediate term, Germany must avoid a drop in its ODA/GNI ratio.
• Germany should strengthen its commitment to global health by increasing annual contributions to the Global Fund to €400 million, and by doing all it can to make the GAVI Alliance replenishment it is hosting in 2015 a resounding success in helping to drive down child mortality. In particular, Germany should play its part by pledging €100 million per year to GAVI between 2016 and 2020.
• Germany is demonstrating real leadership on African agriculture and should encourage other L’Aquila donors to follow its example and boost their funding for this sector, with its critical potential to reduce poverty. Germany’s increased funds for agricultural and rural development should be used to support country-led agricultural strategies in Africa, particularly via the Global Agriculture and Food Security Program (GAFSP), to which it has not previously contributed. Germany should also continue to fulfil its commitment to Nutrition for Growth and adhere to the Rome Principles for Sustainable Food Security.
• To improve its aid transparency, Germany should report to IATI all aid data from each government agency that provides development cooperation. It should also promote access and use of its IATI information via an open data portal, and should join the Open Government Partnership.16
• As a member of the EU, Germany should actively support revisions to the EU’s Anti-Money Laundering Directive that would make information about who owns and controls companies, trusts and similar legal instruments publicly available, helping to ensure that ODA is accompanied by greater domestic resources available for poverty reduction in developing countries.
• Germany should ensure that developing countries can also secure more resources for development by gaining access to information via automatic exchange of tax information agreements, and should work to provide developing countries with technical assistance to increase the capacity of tax authorities, for example by strengthening the International Tax Compact as well as through the Tax Inspectors Without Borders (TIWB) initiative.
PROFILES OF COUNTRY PROGRESS: GERMANY

72 THE 2014 DATA REPORT
Italy remains committed to eventually reaching the international 0.7% official development assistance (ODA)/gross national income (GNI) target, but has not surpassed 0.19% ODA/GNI in the past decade.1 Its ODA levels have, in fact, fluctuated significantly. After a 25% increase between 2010 and 2011 (mainly due to a sharp increase of in-donor refugee costs) and a subsequent decrease of 21% in 2012, its aid increased again by 13.3% in 2013, to a total of $3.2 billion (€2.4 billion). With this increase, Italy reached 0.16% ODA/GNI.
ODA flows to Africa increased by an estimated 19.6% to $1.3 billion (€944 million) in 2013, representing a share of almost 40% of Italy’s total development assistance. Sub-Saharan Africa is a priority region for Italian ODA, and it received an increase of 24% (reaching a total of $1 billion/€760 million) in 2013. However, the country is still far off track to reach its 2015 EU target to allocate half of all aid increases to Africa, and has in fact drastically decreased its bilateral ODA to the continent, by 72% compared with 2004.
ITALY2013 ODA, NET OF DEBT RELIEF
GLOBAL
$3.25 billion € 2.45 billion2012 – 13 CHANGE:
13.3% AFRICA
$1.25 billion € 944 million2012 – 13 CHANGE:
19.6% SUB-SAHARAN AFRICA
$1.01 billion € 760 million2012 – 13 CHANGE:
24.0%2013 ODA/GNI
0.16%
2015 TARGET
GLOBAL
$ 14.70 billion € 11.07 billionAFRICA
$7.18 billion €5.41 billion% AFRICA TARGET INCREASE MET IN 2013
- 6.2%
Figure 1: Global and SSA ODA (total net, excluding debt relief), 2004 – 13
3.5
EU
R b
illio
ns
% o
f GN
I
3
2.5
2
1.5
1
0.5
0
2004 2005 2006 2007 2008 2009 2010 2011 2012 2013
Global SSA Global ODA / GNI SSA ODA / GNI
Sources: OECD DAC Tables 1 and 2a and Preliminary Release (April 2014)
Note: ODA in 2013 constant prices. Net ODA excludes bilateral debt relief, and includes both bilateral and multilateral flows (SSA imputed multilateral flows in 2013 are estimated by ONE). Converted from USD to EUR using the OECD annualised exchange rate for 2013.
0.00 %
0.05 %
0.10 %
0.15 %
0.20 %
0.25 %
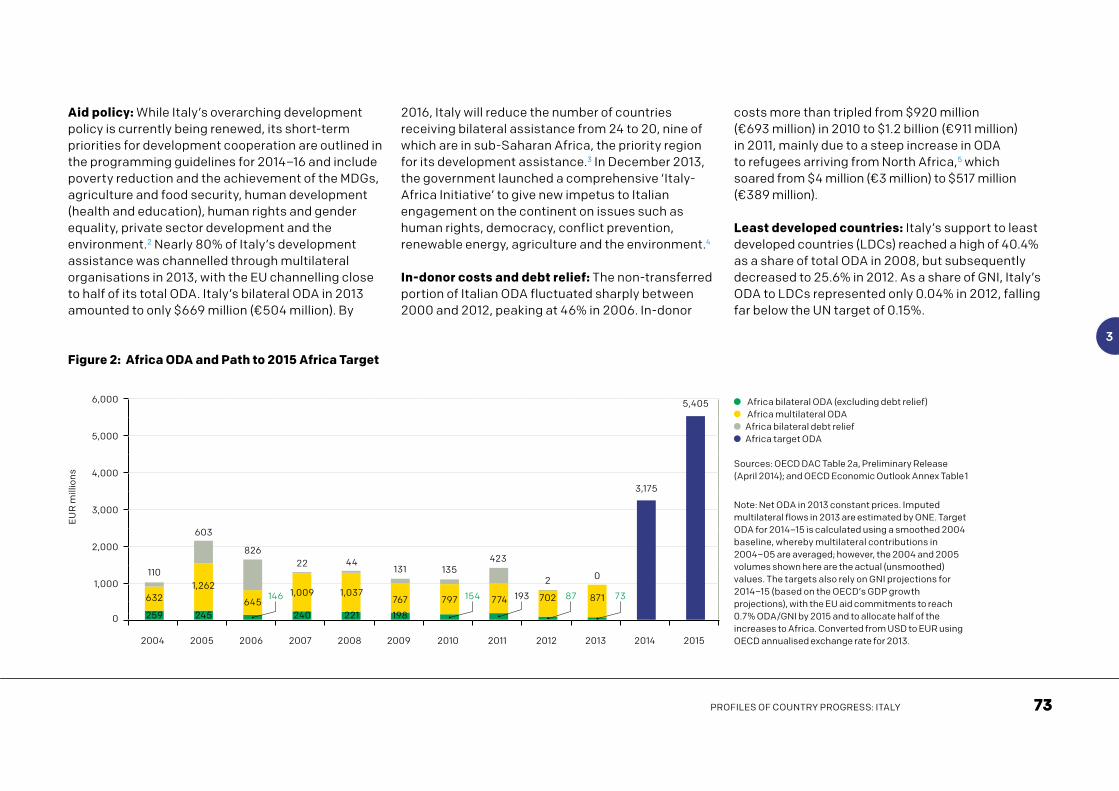
7373
3
Aid policy: While Italy’s overarching development policy is currently being renewed, its short-term priorities for development cooperation are outlined in the programming guidelines for 2014–16 and include poverty reduction and the achievement of the MDGs, agriculture and food security, human development (health and education), human rights and gender equality, private sector development and the environment.2 Nearly 80% of Italy’s development assistance was channelled through multilateral organisations in 2013, with the EU channelling close to half of its total ODA. Italy’s bilateral ODA in 2013 amounted to only $669 million (€504 million). By
2016, Italy will reduce the number of countries receiving bilateral assistance from 24 to 20, nine of which are in sub-Saharan Africa, the priority region for its development assistance.3 In December 2013, the government launched a comprehensive ‘Italy-Africa Initiative’ to give new impetus to Italian engagement on the continent on issues such as human rights, democracy, conflict prevention, renewable energy, agriculture and the environment.4
In-donor costs and debt relief: The non-transferred portion of Italian ODA fluctuated sharply between 2000 and 2012, peaking at 46% in 2006. In-donor
costs more than tripled from $920 million (€693 million) in 2010 to $1.2 billion (€911 million) in 2011, mainly due to a steep increase in ODA to refugees arriving from North Africa,5 which soared from $4 million (€3 million) to $517 million (€389 million).
Least developed countries: Italy’s support to least developed countries (LDCs) reached a high of 40.4% as a share of total ODA in 2008, but subsequently decreased to 25.6% in 2012. As a share of GNI, Italy’s ODA to LDCs represented only 0.04% in 2012, falling far below the UN target of 0.15%.
Figure 2: Africa ODA and Path to 2015 Africa Target
Africa bilateral ODA (excluding debt relief) Africa multilateral ODA Africa bilateral debt relief Africa target ODA
Sources: OECD DAC Table 2a, Preliminary Release (April 2014); and OECD Economic Outlook Annex Table 1
Note: Net ODA in 2013 constant prices. Imputed multilateral flows in 2013 are estimated by ONE. Target ODA for 2014–15 is calculated using a smoothed 2004 baseline, whereby multilateral contributions in 2004–05 are averaged; however, the 2004 and 2005 volumes shown here are the actual (unsmoothed) values. The targets also rely on GNI projections for 2014–15 (based on the OECD’s GDP growth projections), with the EU aid commitments to reach 0.7% ODA/GNI by 2015 and to allocate half of the increases to Africa. Converted from USD to EUR using OECD annualised exchange rate for 2013.
3
PROFILES OF COUNTRY PROGRESS: ITALY
EU
R m
illio
ns
6,000
5,000
4,000
3,000
2,000
1,000
0
2004 2005 2006 2007 2008 2009 2010 2011 2012 2013 2014 2015
259
632
110
245
146
240 221 198
154 193 87 73 645
1,009 1,037 767 797 774 702 871
826 22 44
131 135 423
2 0
3,175
5,405
1,262
603

74 THE 2014 DATA REPORT
Aid transparency: Italy scored in the ‘very poor’ category of Publish What You Fund’s 2013 Aid Transparency Index, with its Ministry of Foreign Affairs performing badly on publishing both overall figures and data at a disaggregated project level. Italy has not joined the International Aid Transparency Initiative (IATI), but as part of the G8 has committed to the Busan common standard, which includes a commitment to fully implement the IATI standard.6 Italy joined the Open Government Partnership (OGP) in 2011 and is currently implementing its first National Action Plan, which includes commitments on access to information, e-government and open data.7 In July 2014, the government launched a new ‘OpenAID Italia’ data portal ( http://openaid.esteri.it/ ), which shows detailed data on
aid spending.8 However, this momentum should now be seized to accelerate progress. Italy is the only G7 country yet to start publishing to IATI.
Innovative finance: Italy is one of 11 EU member states that will gradually implement the European Financial Transaction Tax (FTT) by 2016.9 This could raise up to $46 billion (€35 billion) per year, a proportion of which might be allocated international development efforts.10 As well as contributing to innovative financing mechanisms such as the Advanced Market Commitment and the International Finance Facility for Immunisation (IFFIm), Italy is also a donor to the Public-Private Infrastructure Advisory Facility (PPIAF), providing a total of $1.8 million (€1.4 million) between 2000 and 2013.
Financial transparency: Italy ranked 69th out of 177 countries on Transparency International’s Corruption Perceptions Index in 2013, alongside Kuwait and Romania, indicating that much more needs to be done to improve transparency and combat corruption.11 Italy’s financial transparency scores 39% on the Tax Justice Network’s 2013 Financial Secrecy Index, indicating that it must take concrete actions to impede and deter illicit financial flows.12 In an effort to fight the misuse of offshore tax havens, a law went into effect in December 2013 that requires Italian residents to disclose their overseas assets, held directly or indirectly, including where held in trust.13
LOOKING AHEAD TO 2015The recent impetus to Italian development cooperation – originating with efforts by the 2011 Monti government and including the creation of a dedicated position of Minister of International Cooperation within the Prime Minister’s office – has continued under the current government, whose current leader, Prime Minister Matteo Renzi, took office in February 2014. The development portfolio has been placed under the role of Deputy Foreign Minister Lapo Pistelli, and the government is committed to increasing Italy’s role on the world stage; substantial reforms are under way with the review of the 1987 Law on Development
Cooperation. Among other changes, the revised law is set to introduce a new operational structure, including the creation of a new development agency, aiming to enhance existing skills and expertise and to support greater flexibility and innovation in Italian cooperation.14
According to the 2014 budget law adopted in December 2013, Italy’s annual ODA is set to further increase to $3.5 billion (€2.6 billion).15 The Renzi government has reconfirmed Italy’s commitment to increasing the budget of the Directorate-General for Development Cooperation by at least 10% every year, with the aim of
gradually raising the ODA/GNI ratio to 0.24% by 2015, and to 0.31% by 2017.16 However, despite these encouraging steps, Italy will still fall far short of the 0.7% ODA/GNI target by 2015. In order to achieve this, it would have to mobilise an additional $11.5 billion (€8.6 billion) over the next two years. While Africa is a clear priority region for cooperation, Italy reached only 17% of its 2015 Africa target increases by 2013, and would need to mobilise $5.9 billion (€4.4 billion) over the coming two years in order to achieve the EU commitment of half of total aid increases going to the continent.

7575
3
As one of the first events of Italy’s EU Presidency in 2014, the government hosted a meeting of the 28 EU development ministers in July.17 The country’s global development priorities during
its presidency include human rights and gender equality, agriculture, migration and development, food security and nutrition (also in view of the Expo 2015 event in Milan),18 as well as private sector
development. It is committed to contributing to a strong post-2015 agenda and to promoting a unified EU position during its presidency.19
3
RECOMMENDATIONS• Italy should retain its new-found momentum on aid
and get back on track towards the 0.7% ODA/GNI target, while continuing to prioritise investments in sub-Saharan Africa.
• The review of the 1987 Italian Law on Development Cooperation represents a unique opportunity for the government to create a strong, long-term, results-oriented vision for Italian cooperation and its contribution to the elimination of extreme poverty by 2030. Future ODA investments should continue to prioritise catalytic sectors and global initiatives, such as GAVI and the Global Fund. In particular, Italy should maintain its support of GAVI by making its first direct contribution to the Alliance, while also increasing its IFFIm commitment for the 2016– 20 replenishment period. Italy should continue to
adhere to the Rome Principles of Sustainable Food Security and should consider supporting effective agricultural investments through the Global Agriculture and Food Security Program (GAFSP).
• Italy should actively promote global development issues and investments in key sectors such as agriculture, food security and nutrition during its EU Presidency in 2014. It should pave the way for a strong EU position on the post-2015 agenda, ensuring that the needs of the world’s poorest people are given the highest priority.
• To improve its aid transparency, Italy should build on the progress made by the new ‘OpenAID Italia’ portal, and make reporting fully compliant with IATI standards by the end of 2015.20
• As a member of the EU, Italy should actively support revisions to the EU’s Anti-Money Laundering Directive that would make information publicly available about who owns and controls companies, trusts and similar legal instruments. This would help to ensure that ODA is accompanied by greater domestic resources in developing countries.
• Italy should ensure that developing countries can also secure more domestic resources for development by gaining access to information via automatic exchange of tax information agreements, and should work to provide developing countries with technical assistance to increase the capacity of tax authorities, for example through the Tax Inspectors Without Borders (TIWB) initiative.
PROFILES OF COUNTRY PROGRESS: ITALY

76 THE 2014 DATA REPORT
2013 ODA, NET OF DEBT RELIEF
GLOBAL
$ 9.60 billion ¥ 937.31 billion2012 – 13 CHANGE:
11.3%AFRICA
$ 3.46 billion ¥ 337.41 billion2012 – 13 CHANGE:
26.5%
SUB-SAHARAN AFRICA
$3.31 billion ¥ 323.28 billion2012 – 13 CHANGE:
25.1%2013 ODA/GNI
0.19%
As the world’s third largest economy, Japan has long demonstrated an impressive commitment to global development. However, it no longer has any overarching aid targets in place, not having replaced its 2005 commitment to reach a global aid volume of $10 billion by 2010 or its 2008 commitment to double bilateral aid (excluding debt relief) to sub-Saharan Africa by 2012 – neither of which was achieved in full.1 In 2011 and 2012, Japan reduced its official development assistance (ODA) budget due to the severe financial circumstances resulting from the devastating
earthquake and tsunami of March 2011.2 However, last year its aid more than recovered, rising by 11.3% to reach its highest ever volume ($9.6 billion/ ¥937.3 billion) (see Figure 1). This suggests that Japan is establishing a renewed level of ambition in its development efforts.
Despite this, Japan is still something of a laggard among the G7 and other top Development Assistance Committee (DAC) donors relative to its national wealth. Its ODA/gross national income (GNI) ratio in 2013 was
JAPAN
Figure 1: Global and SSA ODA (total net, excluding debt relief), 2004–13
YE
N b
illio
ns
1,000
% o
f GN
I
900
800
700
600
500
400
300
200
100
0
2004 2005 2006 2007 2008 2009 2010 2011 2012 2013
Global SSA Global ODA / GNI SSA ODA / GNI
Source: OECD DAC Tables 1 and 2a and Preliminary Release (April 2014)
Note: ODA in 2013 constant prices. Net ODA excludes bilateral debt relief, and includes both bilateral and multilateral flows (SSA imputed multilateral flows in 2013 are estimated by ONE). Converted from USD to YEN using the OECD annualised exchange rate for 2013.
0.00 %
0.05 %
0.10 %
0.15 %
0.20 %
0.25 %

7777
3
just 0.19% – the same as the US, but significantly behind France, Germany and Canada, and even further behind countries such as the UK, Norway, Sweden, Denmark and Luxembourg, which have all surpassed the international target of 0.7%.
Japan has firmly established itself as one of sub-Saharan Africa’s key development partners. Its aid to the region is estimated to have jumped by a quarter in 2013, up to record levels of $3.3 billion (¥323.2 billion) (see Figure 1). With this estimated increase, Japan has overtaken Germany to become sub-Saharan Africa’s fourth largest DAC donor (after the US, the UK and France).
Aid policy: During 2013 Akihiko Tanaka, president of the Japan International Cooperation Agency (JICA), visited JICA programmes on the ground in 11 African countries.3 Japanese Prime Minister Shinzo Abe has stated the government’s intention to build a “true partnership with Africa”, with each partner becoming a “co-manager” of development efforts.4 To this end, in 2013 Japan held the fifth Tokyo International Conference on African Development (TICAD V).5 This was the largest international conference ever hosted by Japan, with 4,500 participants, including 39 African heads of state or government.6 During TICAD V, Japan resolved through the Yokohama Action Plan to promote private sector-led growth, accelerate infrastructure and capacity development, empower farmers as mainstream economic actors and consolidate peace, stability and good governance.7
At the opening session of the conference,
Prime Minister Abe announced a five-year (2013 – 17), $32 billion (¥3.2 trillion) “assistance package for Africa” as part of Japan’s commitment to boosting growth on the continent. Around $14 billion (¥1.4 trillion) of this is ODA, which will be combined with a range of other resources in an array of public-private partnerships.8 Around $6.5 billion (¥650 billion) has been committed specifically for infrastructure investment, including transport corridors and power grids. Another priority is the promotion of universal health coverage, drawing on Japan’s experiences in establishing accessible health care for all of its own citizens.9 Education and human resource development are among the core elements of the package. An African Business Education initiative will offer Japanese university education and internships at Japanese firms to thousands of African students, and Japan will dispatch policy advisors on investment promotion missions to 10 countries across the continent.10
More than half of Japan’s ODA to Africa in 2012 was allocated to just 10 countries: Tanzania, Kenya, Ghana, Ethiopia, Sudan, DRC, Senegal, South Sudan, Mozambique and Uganda.11 Unsurprisingly, a large amount of Japanese ODA is also allocated to East and South Asia. Notably, India is the largest recipient of its ODA loans. Japanese assistance to China, however, has been pared down in recent years, following the 2008 Beijing Olympics.12
Japan’s assistance has a particularly strong focus on agriculture and food security, and also on education and human capacity development. In 2008, it
established the Coalition for African Rice Development, with the goal of doubling rice production in Africa to 28 million tonnes by 2018. Results thus far are encouraging: production amongst the first group of 12 African countries has increased by 27% since 2011.13 Japan endorsed the Global Nutrition for Growth Compact in 2013 and committed to a multilateral partnership with Scaling Up Nutrition (SUN), among other actions.14 The Yokohoma Action Plan cited above includes goals for the construction of 500 elementary and secondary schools, training for 100,000 science and mathematics teachers and the expansion of Japan’s “School for All” initiative to provide educational support for 10,000 schools.15
In-donor costs and debt relief: In 2012, $866 million, or 10%, of Japanese ODA was never transferred to developing countries. Most of this figure was made up of administrative costs ($646 million). Japan also has a sizeable scholarships programme, which accounted for $216 million of its ODA that year.16
Despite this, its proportion of non-transferred aid was below the collective DAC share in the same year (13%).
Least developed countries: Japan fell short of the UN’s 0.15–0.20% ODA/GNI to LDCs target in 2012, allocating only 0.08%. However (due to its overall low ODA/GNI ratio), this represented almost 44% of its total ODA that year, which demonstrates a good effort in channelling aid to the poorest countries (and not far off the proposal currently being discussed in the DAC for donors to spend half of their ODA in LDCs).
3
PROFILES OF COUNTRY PROGRESS: JAPAN

78 THE 2014 DATA REPORT
ODA loans: Japan includes substantial volumes of loans in its ODA. The DAC’s out-of-date 10% reference rate, which is currently under review, overstates the grant element of loans and enables donors to report unsubsidised loans as aid (see Section 2). Using this rate, the average grant element of Japan’s ODA loans in 2012 was 76%, which was higher than the DAC average of 64%. When applying a fixed 5% reference rate – which is currently used by the IMF and World Bank to assess the concessionality of their loans to low-income countries – Japan’s average grant element drops to 52%; using this rate, all Japanese loans in 2012 would still have counted as ODA. However, a third of them would fail to count as aid under the more realistic Differentiated Discount Rates, which better reflects capital market conditions as it is currency-specific and subject to annual change in line with fluctuating interest rates (see Section 2).
Aid transparency: Along with all other G8 countries Japan committed at the Lough Erne G8 Summit in 2013 to implementing the Busan common standard on aid transparency. The Ministry of Foreign Affairs (MOFA) scored in the ‘very poor’ category in Publish What You Fund’s 2013 Aid Transparency Index, and JICA was rated in the ‘poor’ category. In June 2014, Japan published to the International Aid Transparency Initiative (IATI) for the first time, with datasets from MOFA and JICA detailing grants, loans and technical assistance in 2012, as well as ODA loans provided by JICA in 2013.17 Japan is not yet a member of the Open Government Partnership; however, this first step may signal that it is now ready to join other major donors in the ‘transparency revolution’.18
Financial transparency: Japan did not perform particularly well on the Tax Justice Network’s Financial Secrecy Index, scoring 61 out of 100 for financial secrecy. Its weak provisions on transparency and information exchange, combined with exemptions from financial regulations, have made it a significant destination for illicit financial flows. It also has a dubious track record on cooperating with foreign governments on investigations into money laundering.19 At the G8 Summit in 2013, Japan endorsed the Open Data Charter and also published an Action Plan to prevent the misuse of companies, in which it committed to improving financial transparency and enhancing global cooperation in combating illicit activities and terrorism.20 However, no discernible action has been taken to date, and Japan has not endorsed any move to make information on beneficial ownership public.
LOOKING AHEAD TO 2015In 2016, Japan will hold elections for its legislative body, the Diet, as well as for Prime Minister. The new Prime Minister will have a great responsibility to maintain the country’s record on global development efforts, particularly in Africa. While the
Yokohama Action Plan has outlined a course, specific targets are still needed to realise Japanese ambitions. Also in 2016, Japan will be the first nation to host the G8 summit following the agreement of the new global development agenda to replace the Millennium
Development Goals. This will be an enormous opportunity for Japan to make a lasting impact on new development commitments, just as it had a crucial role in the creation of the Global Fund in 2000.

7979
3 3
RECOMMENDATIONS• Japan should set specific, measurable and ambitious
goals for its development assistance programme. This should include a serious evaluation of its lapsed commitments to sub-Saharan Africa and strengthening of its support for key global programmes, particularly in global health, agriculture, infrastructure and climate.
• The Japanese government should develop a comprehensive global health strategy that includes an increased commitment to GAVI at the 2015 replenishment, taking it to upwards of $50 million each year between 2016 and 2020, an amount in line with other major donors. Building on its strong record, Japan should also make a robust commitment at the Global Fund’s next replenishment in 2016.
• Japan should sustain its contribution to the field of African agricultural development through strong, continued support of the Global Agriculture and Food Security Program (GAFSP) and by encouraging other international donors to do the same. It should also work to fulfil its commitment at the 2013 Nutrition for Growth Summit and should continue to adhere to the Rome Principles for Sustainable Food Security.
• The Japanese government should urgently improve its aid transparency, including by joining IATI and updating its implementation schedule to include plans to publish to the IATI standard. Japan should also consider joining the Open Government Partnership.
• On financial transparency more broadly, Japan should play its part in helping to stem illicit financial flows and supporting a public register that makes information available about who owns and controls companies, trusts and similar legal instruments, enabling poor countries to mobilise greater domestic resources for development.
• Japan should also commit to implementing mandatory disclosure regulations for oil, gas and mining companies.
PROFILES OF COUNTRY PROGRESS: JAPAN

80 THE 2014 DATA REPORT
12
GB
P b
illio
ns
% o
f GN
I
10
8
6
4
2
02004 2005 2006 2007 2008 2009 2010 2011 2012 2013
Global SSA
Global ODA / GNI SSA ODA / GNI
Sources: OECD DAC Tables 1 and 2a and Preliminary Release (April 2014)
Note: ODA in 2013 constant prices. Net ODA excludes bilateral debt relief, and includes both bilateral and multilateral flows (SSA imputed multilateral flows in 2013 are estimated by ONE). Converted from USD to GBP using the OECD annualised exchange rate for 2013.
2013 ODA, NET OF DEBT RELIEF
GLOBAL
$ 17.83 billion £ 11.40 billion2012 – 13 CHANGE:
28.5%AFRICA
$ 7.08 billion £ 4.53 billion2012 – 13 CHANGE:
25.7%SUB-SAHARAN AFRICA
$ 6.54 billion £ 4.18 billion2012 – 13 CHANGE:
29.7%2013 ODA/GNI
0.72%
2015 TARGET
GLOBAL
$ 18.30 billion £ 11.71 billionAFRICA
$8.43 billion £ 5.39 billion% AFRICA TARGET INCREASE MET IN 2013
75.0%
In 2013, for the first time, the UK met the longstanding international commitment to spend 0.7% of gross national income (GNI) on official development assistance (ODA). This significantly boosted its aid effort, consolidating its position as the second largest DAC donor (after the US). The UK is the only G8 country to have met the 0.7% aid target, and one of only five countries worldwide to do so in 2013.1 After holding its total aid budget more or less steady between 2010 and 2012 at around $13.9 billion (£8.9 billion), the UK’s aid flows rose by 28.5% to $17.8 billion (£11.4 billion) in 2013,
representing 0.72% of GNI. This achievement – officially confirmed in UK aid figures released in April 2014 – was warmly welcomed, after many years of determined campaigning.
After two years of decline, UK aid to Africa also rose, to an estimated $7.0 billion (£4.5 billion) – a 25.7% increase – while its assistance to sub-Saharan Africa increased slightly faster than its overall aid flows, by 29.7%, totalling $6.5 billion (£4.2 billion) (see Figure 1). The UK dedicated 0.26% of its GNI to sub-Saharan
UNITED KINGDOM
Figure 1: Global and SSA ODA (total net, excluding debt relief), 2004–13
0.00 %
0.10 %
0.20 %
0.30 %
0.40 %
0.50 %
0.60 %
0.70 %
0.80 %

8181
3
6,000
GB
P m
illio
ns
5,000
4,000
3,000
2,000
1,000
02004 2005 2006 2007 2008 2009 2010 2011 2012 2013 2014 2015
3
Africa in 2013, a level surpassed by only four of the 28 DAC countries. As a result of this recent boost, the UK has made very good progress towards its target increase of aid to Africa (in line with the EU commitment to allocate half of increases in aid to the continent). In 2013, the UK reached 75% of the 2015 target increase.2
Aid policy: The UK government has placed a strong focus on results and value for money. The Department for International Development (DFID) has concentrated
UK resources within a limited number of the poorest countries. Following DFID’s Bilateral Aid Review in 2011, the UK reduced the number of countries in which it has significant aid programmes from 43 to just 28 in 2013.3 This number is expected to be further reduced to 26 by 2015, since the government is phasing out bilateral aid to India and South Africa.4 Sub-Saharan Africa received the largest amount of UK bilateral ODA in 2012, followed by South and Central Asia.5 The top three sub-Saharan African recipients of UK aid in 2012 were Ethiopia ($425 million/£272 million), Nigeria
($349 million/£224 million) and Tanzania ($253 million/ £162 million). According to DFID preliminary data, Africa received the largest share of the UK’s bilateral aid in 2013, followed by Asia. However, Asia received the biggest increase in 2013 – 55.9%, compared with a 13.5% increase for Africa.6
The largest share of the UK’s bilateral ODA in 2012 ($1.04 billion/£668 million) was devoted to health, making the country the third largest donor in this field. The UK is also one of the most important contributors
Figure 2: Africa ODA and Path to 2015 Africa Target
PROFILES OF COUNTRY PROGRESS: UNITED KINGDOM
1,165
771
491
1,092
786
1,449
1,387
1,307
2,120
1,388
1,163
33
1,594
1,247
10
1,946
1,214
13
2,012
1,691
103
2,112
1,537
94
2,166
1,438
54
2,412
2,119
1
5.392
4.962
Africa bilateral ODA (excluding debt relief)
Africa multilateral ODA
Africa bilateral debt relief
Africa target ODA
Sources: OECD DAC Table 2a, Preliminary Release (April 2014); and OECD Economic Outlook Annex Table 1
Note: Net ODA in 2013 constant prices. Imputed multilateral flows in 2013 are estimated by ONE. Target ODA for 2014–15 is calculated using a smoothed 2004 baseline, whereby multilateral contributions in 2004–05 are averaged; however, the 2004 and 2005 volumes shown here are the actual (unsmoothed) values. The targets also rely on GNI projections for 2014–15 (based on the OECD’s GDP growth projections), with the EU aid commitments to reach 0.7% ODA/GNI by 2015 and to allocate half of the increases to Africa. Converted from USD to GBP using the OECD annualised exchange rate for 2013.

82 THE 2014 DATA REPORT
to key multilateral funding mechanisms in global health, including the Global Fund to Fight AIDS, Tuberculosis and Malaria and the GAVI Alliance. In 2013, the country hosted the historic Nutrition for Growth Summit, which raised more than $4 billion for nutrition. After health, UK bilateral aid is allocated primarily towards education ($1.01 billion / £645 million, making it the world’s third largest donor in this field) and government and civil society ($955 million/£611 million).7
DFID has increasingly focused on private-sector engagement and economic development, publishing an “economic development strategic framework” in early 2014.8 The Secretary of State for International Development, Justine Greening, also announced that the UK would more than double its investment in economic development, to £1.8 billion by 2015/16.9
In-donor costs and debt relief: In 2012, $710 million (£454 million) of UK aid was not transferred to developing countries; this consisted of a combination of in-donor country costs and debt relief. This represented 5% of the UK’s total ODA in that year, well below the DAC’s collective share of non-transferred aid (13%). The largest in-donor expenditure reported by the UK in 2012 was administrative costs, amounting to $532 million (£341 million).
Least developed countries: In 2012, the UK surpassed the UN minimum target of 0.15% ODA/GNI to least developed countries (LDCs), and is close to meeting the upper target of 0.20%. However, only a third of its
total ODA was given to LDCs, down from 36% in 2011 and 46% in 2006 and 2007.
ODA loans: Almost all UK bilateral aid is delivered in the form of grants; in 2012, the country did not extend any bilateral ODA loans. However, discussions have recently taken place about whether it should start providing concessional loans. In February 2014, the Parliamentary International Development Committee published a report recommending that loans become a larger element of the UK’s development assistance and that DFID consider establishing a UK Development Bank.10 The government intends to develop a “development finance strategic framework” setting out how different financing instruments could be used in diverse contexts. It has stated that DFID had no immediate plans to establish a Development Bank butwould take a case-by-case approach, providing lending where it is most appropriate.11
Aid transparency: The UK has long been a champion of development effectiveness and transparency. It was a founding signatory to the International Aid Transparency Initiative (IATI) in 2008, and DFID was the first donor agency to publish to the IATI standard, in January 2011. DFID scored in the ‘very good’ category in Publish What You Fund’s 2013 Aid Transparency Index. However, the two other UK agencies assessed – the Foreign and Commonwealth Office (FCO) and the Ministry of Defence – were rated as ‘poor’ and ‘very poor’, respectively.12 In June 2013, DFID launched a ‘Development Tracker’, an online platform using the IATI
standard to monitor projects funded by the government. On this platform, DFID has used data provided by other UK government departments that spend ODA and plans to incorporate more of them as other bodies publish their data to IATI.13 The Development Tracker also includes data published by some of the DFID’s delivery partners to enhance the traceability of aid from donor to beneficiary.14 The UK is a founding member of the Open Government Partnership (OGP) and is currently implementing its second National Action Plan.15
Financial transparency: The UK was ranked 21st on the Tax Justice Network’s Financial Secrecy Index. The City of London, unsurprisingly, has strong links to British Crown Dependencies and Overseas Territories, where many shell companies and phantom firms are registered.16 In the June 2014 Queen’s Speech, the government announced that it would legislate for an open, publicly available register of beneficial ownership of companies through the Small Business, Enterprise and Employment Bill.17 This will fulfil a key promise made at the 2013 G8 Summit in Lough Erne to tackle the problem of shell companies being used to facilitate illicit financial flows from developing countries, which deprive them of public resources that could be invested in health, agriculture or infrastructure. However, while the UK government’s leadership in public registers of company ownership information is very important, without similar action to tackle secrecy around trusts and other financial vehicles, it will in effect be closing a door to corruption while leaving a window wide open.

8383
3 3
LOOKING AHEAD TO 2015In his March 2014 budget statement, Chancellor George Osborne reconfirmed the government’s ongoing commitment to allocating the equivalent of 0.7% of GNI to ODA, therefore ensuring that the aid budget will continue to be pegged to the growth of national wealth. In order to realise its commitment to allocate half of all aid increases to Africa, the UK would need to increase its ODA flows to the continent by around $860 million
(£550 million) by 2015.
The government missed an opportunity in 2013 to enshrine the 0.7% ODA/GNI target in law, as set out in its Coalition Agreement, blaming a lack of parliamentary time. However, in June 2014, backbench MP Michael Moore announced that he would put forward a Private Member's Bill that with the intention
of legislating before the next UK general election in May 2015. In September 2014, the Bill passed its crucial second reading. All major UK political parties must ensure that they retain the necessary political will around the aid budget so that future governments do not retreat from the historic achievement of reaching the 0.7% target.
RECOMMENDATIONS• The UK should continue to lead by example and
sustain its aid spending at 0.7% of GNI. The International Development Bill should complete its passage in Parliament so that the election promise made in 2010 is delivered before the 2015 general election.
• The UK is one of only a few donors to surpass the UN target of 0.15% ODA/GNI to LDCs. It should commit to reach 0.20% ODA/GNI to LDCs as soon as possible. It should also increase the share of its total ODA investments allocated to the poorest and most vulnerable countries, particularly in sub-Saharan Africa, by committing to allocate 50% of ODA to LDCs.
• As a member of the OECD DAC, the UK should help ensure that the DAC’s current work on the ‘modernisation’ of ODA (see Section 2) promotes the credibility, relevance and effective use of aid in the
post-2015 era by excluding the majority of in-donor costs and debt forgiveness, better targeting ODA to the greatest needs and adopting realistic ODA loan concessionality criteria.
• The UK should continue its leading role in global health and commit to providing £1.2 billion in new resources to GAVI during the upcoming replenishment for 2016–20.
• The UK should also maintain its leadership on global food security and nutrition with a generous pledge to the Global Agriculture and Food Security Program (GAFSP) in 2014. It should continue to fulfil the commitment it made at the Nutrition for Growth conference in 2013, including tripling investment in nutrition-specific programmes between 2013 and 2020.
• DFID has made very good progress in making its development assistance more transparent. All other government departments that spend UK aid should now urgently follow DFID’s example and report their ODA spending in line with IATI. The UK should also require implementing partners to publish to IATI by 2015.
• The UK should help developing countries to mobilise greater domestic public resources by furthering its legacy as a trailblazer in transparency and innovation by extending its position on ending company secrecy to trusts – within the Crown Dependencies and Overseas Territories, within the EU and domestically. This includes using its influential position in the EU to ensure that new EU-wide legislation results in information about who owns and controls companies, trusts and similar legal instruments being made publicly available.
PROFILES OF COUNTRY PROGRESS: UNITED KINGDOM

84 THE 2014 DATA REPORT
2013 ODA, NET OF DEBT RELIEF
GLOBAL
$ 31.36 billion2012 – 13 CHANGE:
0.9%AFRICA
$ 11.64 billion2012 – 13 CHANGE:
- 0.8%SUB-SAHARAN AFRICA
$ 11.19 billion2012 – 13 CHANGE:
- 1.4%2013 ODA/GNI
0.19%
The United States remains the largest bilateral aid donor in the world, providing $31.36 billion in 2013. However, following a clear boost to efforts between 2007 and 2010, its official development assistance (ODA) flows have stagnated in recent years. Furthermore, a decreasing portion of its support has been focused on the countries that need it the most. Last year – for the first time since 2005 – the US is
estimated to have cut its aid flows to Africa (by 0.8%) and sub-Saharan Africa (by 1.4%), to $11.64 billion and $11.19 billion respectively (see Figure 1).
Despite its place at the top of the aid volume tables, the US compares poorly with other G7 countries in terms of aid spending relative to national wealth, with an ODA / GNI ratio of just 0.19%, ahead of only Italy. While this ODA / GNI ratio has been held constant
UNITED STATES
Figure 1: Global and SSA ODA (total net, excluding debt relief), 2004–13
35
US
D b
illio
ns
% o
f GN
I
30
25
20
15
10
5
0
2004 2005 2006 2007 2008 2009 2010 2011 2012 2013
Global SSA Global ODA / GNI SSA ODA / GNI
Source: OECD DAC Tables 1 and 2a
Note: ODA in 2013 constant prices. Net ODA excludes bilateral debt relief, and includes both bilateral and multilateral flows (SSA imputed multilateral flows in 2013 are estimated by ONE).
0.05 %
0.00 %
0.10 %
0.15 %
0.20 %
0.25 %

8585
3 3
from 2012, the last few years have witnessed a downward trend, from a peak of 0.21% in 2010.
Aid policy: Afghanistan continued to be the largest bilateral recipient of US development assistance in 2012, receiving $2.81 billion. Kenya and South Sudan were second and third, receiving $830 million and $785 million respectively. Ethiopia was the next largest recipient, receiving $744 million. Disbursements to Pakistan and Iraq fell by more than 50% between 2011 and 2012, to $634 million and $592 million respectively.1 Although sectoral breakdowns for 2013 are not yet available, 28% of gross bilateral ODA in 2012 was allocated to education, health and population programmes, 22% to other social infrastructure projects and 8% to economic infrastructure.2
As part of its ‘Forward’ initiative (an agency-wide reform package), the US Agency for International Development (USAID) has pledged to channel 30% of its total development assistance through local entities in recipient countries by 2015, to help build the capacity of local systems. USAID increased the amount of funding channelled through country systems from 14.3% in FY2012 to 17.9% in FY2013. In Africa, use of country systems increased from 9.6% in FY2012 to 11.5% in FY2013. While this progress is encouraging, it must be accelerated to meet USAID’s goal of 30% of all assistance by 2015.3
In-donor costs and debt relief: In 2012, $2.8 billion (9%) of US ODA was not transferred to developing countries. Most of this figure was made up of administrative costs ($1.9 billion) and refugee costs ($843 million). This proportion falls below the DAC’s collective share of in-donor costs and debt relief (13%). On average over the five-year period 2008–12, the US had the second lowest share of in-donor costs and debt relief of all G7 donors (just 9%).
Least developed countries: The US fell short of the UN’s 0.15–0.20% ODA/GNI to LDCs target in 2012, allocating just 0.07%. However, this represented 37.3% of its total aid that year, which is the fourth highest (jointly with Denmark) of the 28 DAC donors and well ahead of all other G7 countries except Japan.
Aid transparency: The US began publishing its foreign assistance information in line with the International Aid Transparency Initiative (IATI) in December 2012.4 Publish What You Fund’s 2013 Aid Transparency Index assessed five US agencies, as well as one of its aid programmes. The Millennium Challenge Corporation performed exceptionally well, and the Department of the Treasury and USAID both scored in the ‘fair’ category. However, the Department of Defense and the Department of State were both rated ‘poor’, and the President’s Emergency Plan for AIDS Relief (PEPFAR) ranked ‘very poor’ – worse than all the other US agencies and programmes. Data on disbursements through PEPFAR – the world’s largest international initiative dedicated to a single disease – was absent
from both the IATI database and the US Foreign Assistance Dashboard.5 PEPFAR has since started publishing to IATI, including forward-looking information for 2015.
The US is a member of the Open Government Partnership (OGP), and is currently implementing its second National Action Plan. Its OGP plans complement the President’s Open Government Initiative, which aims to make the US government more transparent and accountable to citizens, and include explicit commitments to increase the transparency of foreign assistance. However, a recent civil society progress report monitoring US implementation of its National Action Plan noted a lack of urgency in actually implementing the foreign assistance transparency commitment.6
Financial transparency: The US scored 58 out of a possible 100 points for financial secrecy in the Tax Justice Network’s Financial Secrecy Index. The country accounts for more than 22% of the global market for offshore financial services and the government has, for the most part, failed to address its role in attracting illicit financial flows and enabling tax evasion. The US is a major tax haven, and holes in anti-money laundering laws allow its financial institutions to handle the proceeds of crimes committed outside its borders.7 Along with other G8 members, the US endorsed the Open Data Charter at the G8 Summit in Lough Erne in June 2013. Following the Summit, it pledged to increase the transparency of company ownership and
PROFILES OF COUNTRY PROGRESS: UNITED STATES

86 THE 2014 DATA REPORT
control.8 As part of its second OGP National Action Plan, the US has committed to enacting a rule requiring financial institutions to identify the beneficial owners of companies that are legal entities; to publicly advocate for legislation requiring disclosure of beneficial ownership information; to join the Global Initiative for Fiscal Transparency; to increase
transparency of foreign assistance; to expand visa sanctions to combat corruption; to make federal spending data more easily available in open and machine-readable formats; and to strengthen and expand whistleblower protections for government personnel.9 In March 2014, the US was accepted as a candidate country to the Extractive Industries
Transparency Initiative (EITI).10 In May 2014, the Securities and Exchange Commission (SEC) announced that it had scheduled a rule-making for Section 1504 of the 2010 Dodd-Frank Act, pertaining to mandatory payment disclosure by oil, gas and mining companies. The SEC pledged to release a proposed rule by March 2015.11
LOOKING AHEAD TO 2015Unlike major donors in the European Union, the US does not have an overall development assistance commitment that extends to 2015. While it remains the largest bilateral aid donor, the overall stagnation of its aid, and especially the recent decreases to sub-Saharan Africa, are worrying. The outcome of the 2016 presidential election is likely to have substantial effects on the amount and focus of development assistance. Before the election, the US should work to institutionalise the USAID Forward reforms and maintain momentum in international transparency processes, such as the Open Government Partnership.
Other ongoing developments in US foreign assistance include reforms to the food aid system. Important changes enacted in 2014, including the passage of the Food for Peace Reform Act 2014, are a first step and will enable USAID to reach 800,000 more people with the same resources, by modernising the antiquated system of shipping American food abroad to alleviate emergency situations.
American leadership will continue to be vital in global health and agriculture. The US’s sustained commitment to the Global Fund, as well as its own
achievements through PEPFAR, continue to send a strong statement that, despite tight economic times, it will continue to work towards an AIDS-free generation. Feed the Future, the US global hunger and food security initiative, is making impressive progress against its aspirational 2017 targets to reduce poverty and hunger.12 In the coming years, it will be important for the US to continue driving progress through flagship development programmes.

8787
3 3
PROFILES OF COUNTRY PROGRESS: UNITED STATES
RECOMMENDATIONS• The US government should maintain its leadership
in development assistance, protecting the overall ODA budget and meeting its commitment to focus assistance on LDCs.
• During the GAVI Alliance’s 2015 replenishment, the US should continue its strong support for multilateral health programmes by pledging $1 billion to the Alliance between 2015 and 2018.
• The US should remain a leader on global food security, including by providing strong support to the Global Agriculture and Food Security Program (GAFSP) during its current replenishment. It should also continue to fulfil its commitment to Nutrition for Growth and adhere to the Rome Principles for Sustainable Food Security.
• To meet USAID’s commitment of channelling 30% of all ODA through country systems by 2015, progress in this area must be accelerated.
• All US agencies that manage ODA should fully implement IATI, including its value-added fields, and publish high-quality, detailed and timely aid data.
• To help developing countries mobilise greater domestic resources, the US should release strong rules to implement section 1504 of the Dodd-Frank Act, to ensure that listed oil, gas and mining companies publicly disclose project-level payment information for all countries in which they operate, without exception.
• The US should also urgently close the holes in its anti-money laundering laws, and support a public register that makes information available about who owns and controls companies, trusts and similar legal instruments, which would make it easier for governments in developing countries to secure public revenues due to them.
• The US should use its leadership on transparency to press other G20 member states to endorse mandatory disclosure rules for the extractive industries, to embrace public registries of beneficial ownership information, to support open data and to make sure that developing countries are able to benefit from automatic exchange of tax information agreements.

88 THE 2014 DATA REPORT
KEY IMPACTS OF DONOR ASSISTANCE In 2012 / 13, Australian aid reached 11.8 million people with life-saving
aid in conflicts and crises, provided 2.3 million people with increased access
to safe water and 1.9 million people with increased access to sanitation,
enabled 700,000 farmers to access new agricultural technologies, and enrolled
over a million boys and girls in school.1
In 2011 / 12, Canadian aid helped to vaccinate 5.2 million children against
measles and polio in Mozambique and Bangladesh and 7.8 million children
against polio in Afghanistan, provided vocational training to 48,000 young
people in Vietnam and the Caribbean region and to 29,000 women in Pakistan
and Bolivia, and supplied medical training and equipment across 8 African countries.2
Between 2004 and 2012, EU aid secured food for 46.5 million people,
connected 70 million people to clean drinking water and 24.5 million people
to proper sanitation facilities, immunised 18 million infants against measles, and
ensured that 7.5 million births were attended by skilled health personnel.3
In 2013, French aid ensured that nearly half a million children could go
to school, 73,000 small businesses received technical or financial assistance,
and 878,000 families were supported to improve their farms.4
In 2012, German aid provided family planning and HIV/AIDS prevention
programmes for 50 million people, vaccinated 38 million children
against polio in partnership with GAVI, and created or secured 164,000 jobs
for small farmers and agricultural workers.5
Between 2008 and 2013, Japanese aid provided safe water to
10.6 million people across Africa, trained 220,000 health workers,
built 1,242 schools, and trained 793,000 maths and science teachers.6
By 2012 / 13,7 UK aid had enabled 30.3 million people – including
14.6 million women – to work their way out of poverty by providing access to
financial services, supported 5.9 million children, including 2.8 million
girls, to go to primary school, improved the land and property rights of 3.8 million
people, and helped 33.4 million people to hold their authorities to account and
have a say in the development of their communities.8
In 2013, US aid reached more than 12.5 million children with nutrition
interventions, helped nearly 7 million farmers to use new technologies and
management practices, directly supported 6.7 million people on antiretroviral
treatment for HIV/AIDS, supported HIV testing and counselling for more than
12.8 million pregnant women, and provided medications to prevent mother-
to-child transmission of HIV for 780,000 women.9
Children in Garowe, the capital of Puntland, Somalia – home to thousands of families displaced by conflict – access clean water using a pump funded by EU aid. Photo: Malini Morzaria / EU / ECHO

89
3
KEY IMPACTS OF DONOR ASSISTANCE

90 THE 2014 DATA REPORT

9191
4
TRENDS IN AFRICAN GOVERNMENT SPENDING
Section 4
TRENDS IN AFRICAN GOVERNMENT SPENDING
Primary school children in class in Harar, Ethiopia. Photo: Eskinder Debebe/United Nations

92 THE 2014 DATA REPORT
The development finance landscape in sub-Saharan Africa comprises myriad types of resources. Official development assistance (ODA) is the only external flow targeted explicitly to support economic development and improve welfare, and, in many of the world’s poorest countries, it supports the provision of vital public services. However, in the large majority of developing countries, the primary means available to end extreme poverty are the national government’s own resources. On top of these major public resources, private flows – such as foreign direct investment (FDI) and remittances
(personal transfers sent from abroad) – make up a critical part of the finance picture in many African countries, a picture that will continue to diversify beyond 2015.
Following on from the 2013 DATA Report, which analysed domestic government spending in the region, this section provides the most recent data available on the scale of government expenditures across sub-Saharan Africa, including in three key sectors – health, agriculture and education. It goes
beyond the aggregate to highlight how realities differ across countries, including analysis of performance against domestic spending commitments and alternative measures of progress. It also discusses some of the main challenges and opportunities around the effective mobilisation and investment of domestic public resources for development – not least, the urgent need for a data revolution to improve the accuracy, reliability, comparability and timeliness of information on African government budgets.
Remittances FDI ODA All other SSA government expenditures SSA LCD government expenditures
Sources: IMF World Economic Outlook (April 2014); OECD DAC Table 2a; World Bank, World Development Indicators
Note: All data in current prices. Government expenditures are calculated using IMF data on GDP (USD) and expenditure as a percentage of GDP. ODA is total net, including both bilateral and imputed multilateral flows from all donors, but excluding debt relief. The volumes of ODA represented here are therefore not comparable with analysis elsewhere in this report (due to the use of current prices, in order to compare against the other types of flows, and all donors, rather than the 28 DAC donor countries only). ODA is not fully additional to government expenditures, since it includes a portion of the latter in most countries (on-budget aid); however, due to insufficient availability of data, it is not possible to calculate precisely the volumes of government expenditures that are financed by ODA. FDI is calculated as net inflows by the balance of payments method, and thus includes negative values for disinvestments. Remittances are personal transfers consisting of all current transfers in cash or in kind received by resident households from non-resident households (including the income of border/short-term workers employed in countries where they are not resident). The following countries are omitted from this analysis due to lack of data: Somalia, South Sudan and Sudan. Additionally, there is mostly incomplete or no data available on remittances for several countries: Angola, Central African Republic, Chad, Comoros, Equatorial Guinea, Eritrea and Madagascar.
Figure 1: Financial Resources across Sub-Saharan Africa, 2000– 12
US
D b
illio
ns
500
450
400
350
300
250
200
150
100
50
02004 2005 2006 2007 2008 2009 2010 2011 2012

9393
4
TRENDS IN AFRICAN GOVERNMENT SPENDING
Figure 1 demonstrates the rapid growth of four major types of financial resource in the region over the past decade: (1) government expenditures (including a breakdown for least developed countries (LDCs)); (2) ODA1 from all donors, as recorded in the OECD DAC database; (3) net inflows of FDI; and (4) remittances. It
shows very clearly that government spending – on aggregate – vastly outweighs other resources. In 2012, sub-Saharan African government expenditures amounted to $376 billion, almost three times the 2004 level of $136 billion. Government expenditures across the 29 LDCs2 amounted to $117 billion in 2012, making
up less than one-third of total government spending, despite these countries accounting for 54% of the region’s population. Nevertheless, this represents impressive four-fold growth from 2004, when public spending in LDCs was a paltry $30 billion.
WIDE VARIATION BETWEEN COUNTRIESThe picture becomes more complicated when delving beneath the aggregate numbers. Of the total volume of government expenditures in 2012, a very sizeable chunk was accounted for by just three countries – Angola, Nigeria and South Africa – which spent a combined $238 billion, or 63% of the total. Among the 29 LDCs for which there is data, $47 billion (40% of the total) was down to Angola alone, which has remained on the list of LDCs since 1994 but is expected to officially ‘graduate’ from this status soon. The rather different picture that emerges from this exercise of excluding just three countries demonstrates the need to take care with regards to the skewing effect of Africa’s largest economies.
Indeed, as shown in Figure 2, a shockingly low level of annual per capita spending remains the stark reality in most sub-Saharan African countries. The UN has estimated that a package of basic public services in health, education, agriculture, infrastructure and public administration in developing countries costs at least $200 per capita per year (of which around $140 is required for investments to meet the MDGs).3 In 2012, four sub-Saharan African countries did not meet even this basic level of spending (in PPP terms). Twenty-two other countries spent less than $500 PPP per person. The median per capita spending among the 45 countries shown in Figure 2 was just $413 PPP. To put this in perspective, among OECD DAC countries
the average public spending per capita is more than $15,000.4 Furthermore,even these figures can be misleading, since in many countries it is very unlikely that the poorest citizens actually receive this amount, given the inequitable distribution of public resources. In Equatorial Guinea – which had by far the highest level of spending per person in 2012 (at almost $12,000), and which derives 89% of its GDP from oil and gas – a high proportion of the population continues to live below the poverty line.5

94
Figure 2: Annual Government Spending Per Capita, 2012
Source: IMF World Economic Outlook (April 2014)
Note: Data is adjusted for international purchasing power parity (PPP) to provide a more relevant comparison between countries in terms of what these spending levels could achieve. Government expenditures per capita (PPP) are calculated using IMF data on GDP per capita (PPP) and expenditure as a percentage of GDP. The following countries are omitted from this analysis due to lack of data: Somalia and Sudan.
* Least Developed Countries
Equatorial Guinea 11,896 ASeychelles 9,374 ABotswana 5,600 A
Gabon 5,041 ASouth Africa 3,593 A
Mauritius 3,592 ANamibia 2,649 A* Angola 2,484 A
Swaziland 1,952 ARepublic of Congo 1,670 A
Cape Verde 1,401 A* Lesotho 1,287 A
Ghana 1,034 A* São Tomé and Príncipe $ 5
00
– $ 9
99
Nigeria* Chad
* The Gambia* Senegal
KenyaCameroon
$ 200
– $ 49
9
* Zambia* Tanzania
Côte d’Ivoire* South Sudan
* Rwanda* Burkina Faso
* Malawi* Mozambique
* Benin* Comoros
* Guinea* Togo
* Sierra Leone* Uganda
* Guinea-BissauZimbabwe
* Eritrea* Burundi* Ethiopia
* Mali* Liberia
* Niger Below
$20
0
* Central African Republic* Madagascar
* DR Congo
0 100 200 300 400 500 600 700 800 900 1,000
international PPP$

9595
4
TRENDS IN AFRICAN GOVERNMENT SPENDING
A BUDGET DATA REVOLUTIONDomestic resources will play the single biggest role in determining the success of the post-2015 development agenda. However, despite the fact that domestic government spending provides by far the largest portion of develoment finance, and despite the huge international attention now focused on the area of domestic resource mobilisation,6 we know remarkably little about exactly how governments are actually spending that money.
In the International Budget Partnership’s 2012 Open Budget Survey, only two sub-Saharan African countries were rated highly: Uganda and South Africa (the latter ranking second in the entire index, outperforming even Norway, Sweden and the UK).7 The majority of African countries were judged to publish ‘minimal’ or ‘scant to no’ information and fell disproportionately towards the lower end of the scale. De Renzio and Simson, in their study of the usefulness of African budgets, found that only seven of 26 countries assessed published the minimum documentation (approved budgets and annual reports) required to make sense of the budget, and that, even in these countries, formatting inconsistencies and a lack of detail made documents difficult to use, especially for those unfamiliar with the idiosyncrasies of country-specific budgeting practices.8
WHAT ARE THE MAIN CHALLENGES?
• Published budget documentation for most African countries is frequently outdated, difficult to locate online (within often disorganised and semi-functional websites), incomplete or even non-existent in some cases, and published in non-machine-readable formats (such as PDFs or Word documents), making it difficult to copy and analyse data.
• Even when documents are accessible, the information they contain is often of limited utility; for example, containing no functional breakdowns beyond government ministry or, conversely, presented in overwhelming detail with very little (or difficult to decipher) categorisation.
• The reliability of the underlying data is often a major concern. Different sets of budget documents may show different figures, and it may be impossible to tell which is correct and whether the discrepancy is due to error, actual changes over time or inconsistent use of terminology.
• Comparability across countries is often extremely problematic, since they do not share a common budget classification system. As discussed further below, and demonstrated starkly in the case of Tanzania’s agriculture budget, the definition and scope of functional expenditures can vary significantly.
WHY DOES A DATA REVOLUTION MATTER?
We urgently need a much clearer picture of domestic government spending and how it is impacting people’s lives. Citizens, and their representatives in parliaments and CSOs, require access to accurate, comprehensive and timely data so that they can follow the money and hold governments to account. African governments have made a number of national spending commitments (see below), and are likely to make new promises over the coming years as the post-2015 framework takes shape. Current budget data is woefully insufficient to track up-to-date performance against such targets across most African countries.9 Furthermore, at the sub-national level, it is crucial for people to know what resources are supposed to be flowing into their local hospitals, clinics and schools, if they are to compare these against reality, substantiate claims of corruption and demand more equitable distribution of spending. Furthermore, data on financial inputs should also be linked to performance data so that governments themselves, and the citizens they serve, can track resources to results.

96 THE 2014 DATA REPORT
In the following pages we examine how sub-Saharan African countries are faring in the allocation of their public resources towards three sectors that are critical for reducing poverty and fostering inclusive growth, and hence can be regarded as a proxy for overall development-related spending: health, agriculture and education. This list is not exhaustive; investments in
rural infrastructure (such as roads and energy), water and sanitation, housing and social protection programmes, among other areas, are also critical for development, but the lack of comparable and reliable data in these other areas hinders further analysis. It should also be noted that the international databases used in ONE’s analysis (WHO, the Regional Strategic
Analysis and Knowledge Support System (ReSAKSS) and UNESCO) are the current best sources of comparable sectoral spending data, but they are far from ideal. Among other shortcomings, a two-year (and, in the case of ReSAKSS, a four-year) time lag in the publication of data means that the analysis below does not account for changes in national budget allocations after 2012.
HEALTHABUJA COMMITMENT
In 2001, African leaders gathered in Abuja, Nigeria, and pledged to allocate 15% of their national budgets to health. However, most governments have fallen far short of this target. Between 2010 and 2012, just six of 43 sub-Saharan African countries (for which there is data available to track performance) spent 15% or more of their budgets on health, on average: Rwanda (23.2%), Malawi (17.8%), Swaziland (17.2%), Liberia
(16.5%), Zambia (16.4%) and Togo (15.4%). A further six countries – Lesotho, Namibia, Madagascar, Burundi, Burkina Faso and Democratic Republic of the Congo – came close, with allocations of more than 13%. However, 10 countries did not spend even half of the Abuja target share.10
Examining the total ‘Abuja deficit’– the cumulative gap between the amount that would have been spent by African countries had they all met their commitment
each year, and the amount they actually spent – brings into sharp focus the scale of resources lost to health. Between 2001 (the year the commitment was made) and 2012, sub-Saharan African countries spent an average of 10.3% of their budgets on health, amounting to a collective $257.4 billion over 12 years. Had each country met its Abuja commitment of 15%, the region could have generated an additional $129.2 billion. Between 2010 and 2012 alone, it could have collectively spent an additional $54.8 billion.11
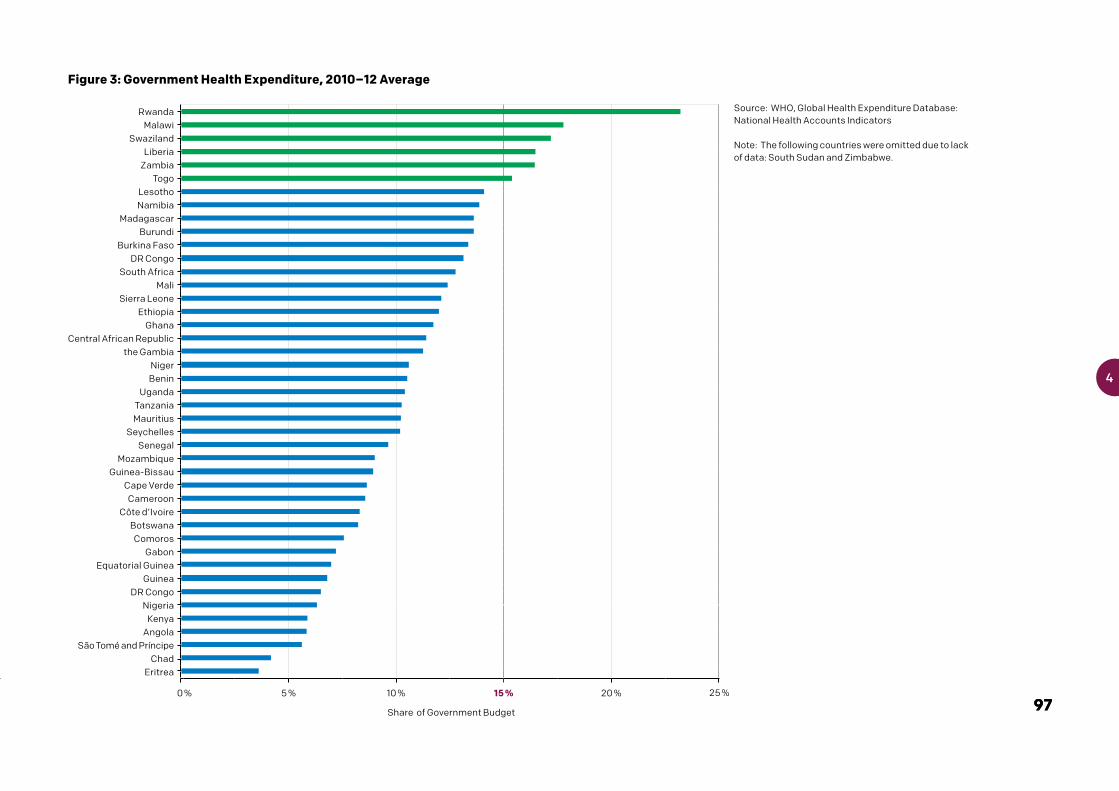
9797
4
RwandaMalawi
SwazilandLiberia
ZambiaTogo
LesothoNamibia
MadagascarBurundi
Burkina FasoDR Congo
South AfricaMali
Sierra LeoneEthiopia
GhanaCentral African Republic
the GambiaNigerBenin
UgandaTanzaniaMauritius
SeychellesSenegal
MozambiqueGuinea-Bissau
Cape VerdeCameroon
Côte d’IvoireBotswanaComoros
GabonEquatorial Guinea
GuineaDR Congo
NigeriaKenya
AngolaSão Tomé and Príncipe
ChadEritrea
0 % 5 % 10 % 15 % 20 %
Share of Government Budget
Figure 3: Government Health Expenditure, 2010– 12 Average
Source: WHO, Global Health Expenditure Database: National Health Accounts Indicators
Note: The following countries were omitted due to lack of data: South Sudan and Zimbabwe.
25 %

98 THE 2014 DATA REPORT
ALTERNATIVE MEASURES OF HEALTH SPENDING
Domestic health financing needs vary greatly between countries. Similar overall levels of health spending can have very different impacts in different countries, due to large variations in population size, disease burden and myriad geographic, economic and institutional factors. While the Abuja target provides a useful benchmark, many global health experts consider per capita spending to be a more pertinent measure, since it reflects a country’s capacity to adequately meet its population’s basic health needs. For instance, in 2012 Botswana allocated 8.1% of its budget to health, which represented $413.8 million. Cameroon allocated a similar proportion and volume: 8.5% and $441.6 million. However, Botswana has a population of two million, whereas Cameroon’s population exceeds 21 million. Per capita, Botswana spent more than $200 per person that year, while Cameroon spent little more than $20 per person.12
There is no universally agreed target for per capita spending levels. In 2001, a WHO-led taskforce found that, at a minimum, countries would have to spend $34 per person (in 2001 prices) to meet the three health-related MDGs. Since then, a plethora of new figures has been released,13 including recent analysis by Chatham House, which estimated that all governments should spend a minimum of $86 per capita to meet basic health needs.14 One of the most widely cited figures formulated by the WHO-endorsed Taskforce on Innovative Financing for Health Systems suggested that governments in low-income countries, on average,
would need to spend $54 per person annually in order to meet the three health-focused MDGs (reducing child mortality, improving maternal health and combating diseases such as HIV/AIDS and malaria).15
As Figure 4 shows, assessing the per capita health expenditures of sub-Saharan African countries paints a very different picture from the analysis of the Abuja commitment above. Thirteen of the 43 countries assessed achieved spending levels of at least $54 on average between 2010 and 2012, and nine of these spent more than double this amount. However, 26 countries did not spend even half of this bare minimum recommended sum.16
Tracking national performance against the Abuja target and levels of per capita health spending provides a valuable sense of the extent to which countries are funding their own health programmes and meeting their own commitments. However, neither should be relied upon exclusively, for several reasons:
• First, the push to achieve a generic level of spending fails to account for the specific context in each country, including its disease burden and the current state of its health system.
• Second, quantity does not necessarily mean quality, and neither of these input benchmarks includes any reference to equitable distribution, cost-effectiveness, quality or results achieved. For example, Lesotho is one of the few sub-Saharan African countries that surpass the recommended per capita health spending level,
providing an average of $103 per person in 2012. However, it was recently revealed that half of its entire health budget funds just one hospital in Maseru.17
• Third, total health financing within a country can comprise funding from various sources beyond national government budgets, including private health insurance and ‘out-of-pocket’ expenditures. The level of government funding of health as a portion of total health expenditures can vary dramatically based on the country’s health system. For instance, some national systems – particularly those with a universal health coverage system – necessitate a far higher share of government expenditure.18
• Lastly, measuring closely related expenditures that are not necessarily coded as ‘health’ is very problematic. There is no universal (or regional) standard covering all budget lines that could significantly impact health outcomes, including investments in health infrastructure, water and sanitation, nutrition and various social protection programmes. Furthermore, in many African countries, published budgets are not sufficiently disaggregated to enable monitoring of spending at this functional level in the first place.19
Therefore, it is important to treat the Abuja commitment and per capita spending targets as useful guidelines, and not as black-and-white thresholds; in many cases, the amount or percentage of funding alone will not be adequate to ensure good health for each country’s citizens.20

9999
4
Figure 4: Government Per Capita Health Expenditure, 2010–12 Average
Equatorial Guinea 565 ASeychelles 410 A
South Africa 305 ANamibia 276 A
Botswana 238 AMauritius 216 A
Gabon 189 ASwaziland 185 A
Cape VerdeAngola
LesothoRepublic of Congo
ZambiaGhana
RwandaSão Tomé and Principe
SenegalNigeria
Côte d’IvoireMalawi
Burkina FasoTogo
CameroonMali
BeninThe Gambia
ComorosLiberia
TanzaniaKenya
MozambiqueSierra Leone
BurundiMadagascar
UgandaChad
Guinea-BissauCentral African Republic
NigerGuinea
EthiopiaDR Congo
Eritrea
0 20 40 60 80 100 120 140 160 180
USD per capita
Source: WHO, Global Health Expenditure Database: National Health Accounts Indicators
Note: The following countries were omitted due to lack of data: South Sudan and Zimbabwe
* $54 is the minimum annual per capita figure as estimated by the Taskforce on Innovative Financing for Health Systems as necessary in low-income contexts to meet the three health-related MDGs
200
DOMESTIC RESOURCES FOR HEALTH BEYOND 2015
As we move beyond the current MDGs and into the post-2015 health agenda, financing needs will grow and gaps will become increasingly apparent. Disease burdens are already shifting as countries become wealthier, and there are new challenges on the horizon, requiring countries to allocate new funding to fight new diseases. In addition, new tools to fight some of the world’s most pressing health issues – such as a malaria vaccine – are already in development, while it is also likely that some tools not anticipated at the moment will also become available. The world will need to develop a plan to ensure that the countries that need these crucial new tools are able to access them. A range of financing options will be called upon, including more conventional forms of assistance, innovative finance and new kinds of partnership. But as many African economies continue to grow and become wealthier, an increasingly large part of the answer will depend on domestic resources.
54 *

100 THE 2014 DATA REPORT
AGRICULTUREMAPUTO AND MALABO COMMITMENTS
In 2003, at the African Union (AU) summit in Maputo, Mozambique, African leaders made a bold commitment to reverse the under-investment that had held back agriculture for so long, pledging to allocate at least 10% of their national budgets to the sector. A decade later, in June 2014 at the AU Summit in Malabo, Equatorial Guinea, these commitments were reaffirmed. However, most African countries are failing to meet this promise. To highlight performance over the recent period, including progress made during the development of their national investment plans for agriculture, the following analysis examines average public expenditure on agriculture by countries in sub-Saharan Africa between 2008 and 2010, using the
latest comparable data available.21 Of 41 countries with available data, only eight met the 10% threshold on average between 2008 and 2010: Malawi (24.8%), Ethiopia (19.2%), Niger (15.2%), Senegal (13.9%), Mali (11.3%), Burkina Faso (11.1%), Zambia (10.7%) and the Republic of Congo (10.4%), while Ghana came close (9.4%).22 Twelve countries failed to allocate even 3% of their budgets towards agriculture: Equatorial Guinea, Guinea-Bissau, Seychelles, Democratic Republic of the Congo, Cameroon, South Sudan, Central African Republic, South Africa, Sierra Leone, Côte d’Ivoire, Angola and Cape Verde.
Over this three-year period, an additional $50 billion would have been mobilised for agriculture had all sub-Saharan African governments allocated 10% of their
budgets to the sector, with $18.5 billion in 2010 alone. If considering the whole period since 2003, governments could have generated a staggering $97 billion more for agriculture by meeting their Maputo commitments.
In fact, the share of total spending devoted to agriculture has actually decreased since 2003. African countries’ public expenditure on agriculture has grown by 7.4% per year on average, a welcome development, but this growth has been outstripped by their total public expenditure, which has increased by an average of 8.5% per year.

101101
4
TRENDS IN AFRICAN GOVERNMENT SPENDING
Figure 5: Government Agriculture Expenditure, 2008–10 Average
MalawiEthiopia
NigerSenegal
MaliBurkina Faso
ZambiaRepublic of Congo
GhanaMadagascar
BurundiTogo
The GambiaTanzania
São Tomé and PrincipeRwanda
MauritaniaChad
MozambiqueNigeria
BeninLiberiaKenya
MauritiusUganda
SwazilandBotswana
NamibiaLesotho
Cape VerdeAngola
Côte d’IvoireSierra LeoneSouth Africa
Central African RepublicSouth Sudan
CameroonDR Congo
SeychellesGuinea-Bissau
Equatorial Guinea
0 % 5 % 10 % 15 % 20 %
Share of Government Budget
25 %
Source: S. Benin and B. Yu (2013) ‘Complying with the Maputo Declaration Target: Trends in public agricultural expenditures and implications for pursuit of optimal allocation of public agricultural spending’, ReSAKSS Annual Trends and Outlook Report
Note: The following countries are excluded from this analysis due to lack of data: Comoros, Eritrea, Gabon, Guinea, Somalia, Sudan and Zimbabwe

102 THE 2014 DATA REPORT
ALTERNATIVE MEASURES OF AGRICULTURE SPENDING
Almost as soon as African governments committed to allocate 10% of their budgets to agriculture, a debate ensued as to which expenditures should count towards this target. Similarly to the situation in the health sector described previously, there is no definitive guide on which specific budget lines should be included or excluded. The AU has issued a technical note on what can be considered ‘public agricultural expenditure’, but its country-led process to develop national agriculture investment plans – the Comprehensive Africa Agriculture Development Programme (CAADP) – has not formally supported a particular position.23
Unfortunately, leaders failed to resolve this debate at the Malabo AU Summit. The main questions are whether and how to account for ‘agriculture-supportive’ investments such as agricultural research and development, and multi-purpose development projects such as feeder roads and infrastructure, as well as rural health and education, which can have positive impacts on agricultural productivity. On the other hand, costly infrastructure projects with multiple objectives serve purposes beyond agriculture, and some institutions choose not to include these types of investment in calculating agriculture expenditure. For example, the International Monetary Fund (IMF)’s Classifications of the Function of Government definition excludes all expenditures on multi-purpose development projects, while the AU’s New Partnership for Africa’s Development (NEPAD) agency
recommends including these projects if 70% of the cost is related to agriculture.24 The ReSAKSS data used in ONE’s analysis in this chapter employs a similar definition to that of the IMF. Using a wider-ranging approach, which has come under some criticism, the UN Food and Agriculture Organization (FAO) in its Monitoring African Food and Agriculture Policies (MAFAP) project, also includes expenditures for broader rural development, such as health, education and sanitation.25
Such differences are more than mere technical details; they can have a profound impact on documented levels of government investment in agriculture. To illustrate this, Figure 6 shows the latest five years of Tanzania’s agricultural spending data using a narrow ‘agriculture-specific’ definition versus MAFAP’s broader definition.26
In Tanzania’s case, the total allocation is considerably higher when ‘agriculture-supportive’ expenditures are included. In 2012/13, the definitional distinction would
Sha
re o
f agr
icul
ture
exp
endi
ture
in to
tal
pub
lic e
xpen
ditu
re %
14
12
10
8
6
4
2
02008 / 09 2009 / 10 2010 / 11 2011 / 12 2012 / 13
MAFAP Narrow Definition of Agriculture Expenditure MAFAP Broad Definition of Agriculture Expenditure
Source: FAO, MAFAP (2013) ‘Review of food and agricultural policies in the United Republic of Tanzania’
Figure 6: Comparison of Public Expenditure on Agriculture in Tanzania using Narrow and Broad Definitions

103103
4
TRENDS IN AFRICAN GOVERNMENT SPENDING
have made a 7.5 percentage point difference in terms of the share of government budget devoted to agriculture – with the narrow definition resulting in 5.8% (far below the Maputo target) and the broad definition resulting in 13.3% (well above it).27
Governments, development partners and monitoring institutions (such as ReSAKSS and MAFAP) must resolve this debate on defining agriculture spending. At a minimum, this requires the transparent and detailed publication of national budgets in a timely manner. Ideally, countries would improve the standardisation of their systems of government finance, so as to enable simple cross-country comparison. Inaction on this front will only perpetuate the current, crude system for
measuring governments’ investment of domestic resources in agriculture, which impedes accountability and inhibits the ability of governments and citizens to link spending to results.
DOMESTIC RESOURCES FOR AGRICULTURE BEYOND 2015
In June 2014 at the AU Summit in Malabo, African leaders heeded the call from farmers and civil society to recommit to and improve upon the Maputo Declaration. Among many new targets, they re-pledged to allocate 10% of their budgetary resources to agricultural development and to achieve agricultural growth of 6% annually, and also highlighted the role of responsible
private investment and intra-regional trade. The Malabo Declaration adopted the CAADP Results Framework as the primary mechanism for mutual accountability through a biennial review, coordination across sectors and strengthening of regional and national institutions. This is a major step forward in boosting domestic resources for agriculture and represents a defining moment to hold leaders to their promises. However, African leaders failed to properly acknowledge many key aspects of agricultural development – including a resolution on the debate about defining agriculture spending and improving budget transparency, which will continue to hamper accountability against these commitments.

104
EDUCATIONDAKAR COMMITMENT
At the World Education Forum in Dakar, Senegal in 2000, leaders from 164 countries (including almost every African country) agreed on six Education for All (EFA) goals to improve learning and access for children, youth and adults around the world by 2015. In Dakar, governments also committed to spend 9% of their GDP on education by 2010 (with an interim target of 7% by 2005). Unfortunately, most governments have not made great efforts to achieve this target. Examining the most recent year with data available for each country during the period 2010–13, only one of 33 sub-Saharan African countries (for which data is available) – São Tomé and Príncipe – spent more than 9% of its GDP on education.
Source: UNESCO Institute for Statistics
Note: Data on public education spending is not available for every year for most sub-Saharan African countries. Therefore, this analysis shows the most recent year of data available within the period 2010 –13, rather than a three-year average (as in the health and agriculture analyses above). The following countries are omitted due to lack of data: Botswana, Comoros, Côte d’Ivoire, Equatorial Guinea, Eritrea, Gabon, Guinea-Bissau, Lesotho, Mozambique, Nigeria, Somalia, South Sudan, Sudan and Zambia.
São Tomé and Principe
Namibia
Swaziland
Ghana
Kenya
South Africa
Congo
Tanzania
Burundi
Senegal
Cape Verde
Malawi
Benin
Rwanda
Mali
Ethiopia
Togo
Niger
The Gambia
Seychelles
Mauritius
Angola
Burkina Faso
Uganda
Cameroon
Sierra Leone
Liberia
Madagascar
DR Congo
Zimbabwe
Guinea
Chad
Central African Republic
0 % 1 % 2 % 3 % 4 % 5 % 6 % 7 % 8 % 9 %
Share of GDP
Figure 7: Government Education Expenditure as Share of GDP
10 %

105105
4
ALTERNATIVE MEASURES OF EDUCATION SPENDING
In addition to the Dakar commitment, UNESCO has suggested alternative spending targets. First, UNESCO recommends that governments spend 6% of their gross national product (GNP) on education. While only one sub-Saharan African country currently meets the Dakar target of 9% of GDP, a further seven have achieved education spending levels of 6% of GNP in recent years: Tanzania, South Africa, Ghana, Namibia, Kenya, Swaziland and the Republic of Congo.28 However, this is still a very small number of countries in the region.
This UNESCO recommendation and the Dakar commitment both differ from the Abuja (health) and Maputo (agriculture) commitments described above, in that they are based on a national wealth target, rather than a share of total spending. However, UNESCO also recommends that developing country governments spend 20% of their national budgets on education. Ten countries in sub-Saharan Africa have allocated 20% or more in the past few years, as shown in Figure 8. Two of them, Ghana and Ethiopia, have translated that commitment into remarkable progress in educational outcomes.
Source: UNESCO Institute for Statistics
Note: Data on public education spending is not available for every year for most sub-Saharan African countries. Therefore, this analysis shows the most recent year of data available within the period 2010–13, rather than a three-year average (as in the health and agriculture analyses above). The following countries are omitted due to lack of data: Botswana, Burundi, Comoros, Côte d’Ivoire, Equatorial Guinea, Eritrea, Gabon, Guinea-Bissau, Lesotho, Liberia, Mozambique, Nigeria, Somalia, South Sudan, Sudan and Zambia.
35 %
Figure 8: Government Education Expenditure as Share of Government Budget
Ghana
Congo
Benin
Ethiopia
Swaziland
Kenya
Namibia
Tanzania
Senegal
South Africa
Mali
São Tomé and Principe
Rwanda
Togo
Niger
Madagascar
Cameroon
Cape Verde
Mauritius
Malawi
Burkina Faso
Sierra Leone
Uganda
The Gambia
Seychelles
Chad
Guinea
Angola
DR Congo
Zimbabwe
Central African Republic
0 % 5 % 10 % 15 % 20 % 25 % 30 %
Share of Government Budget

106 THE 2014 DATA REPORT
Ethiopia: Putting Nine Million Children in School
Since Ethiopia emerged from 16 years of civil war in 1991, the government has prioritised education and has achieved impressive results. It has invested specifically in improving access to education, abolishing school fees, increasing expenditures on school construction and maintenance and hiring and training thousands of new teachers, administrators and officials.29 Ethiopia more than doubled its public education spending in absolute terms and as a percentage of total government spending between 2000 and 2010, reaching 24% of the budget in 2010. These resources were used to fund classroom construction and teacher recruitment. Primary school enrolment increased from 37% in 1999 to 87% in 2011, and the number of out-of-school children decreased by three-quarters, from 6.5 million to 1.7 million. Ethiopia’s commitment to improve education has also narrowed the gender gap and benefited the poorest.
Ethiopia has achieved these improvements not only through supply-side investment, but also by increasing the autonomy of regional and local government in
delivering education, and increasing community participation. Donors have played a key role in supporting the country’s education reforms with development assistance and through effective partnership with the Ethiopian government.30
However, with better domestic resource mobilisation, Ethiopia could have achieved even more. UNESCO has estimated that the country could have put the remaining 1.7 million out-of-school children into school by increasing its tax revenues from 12% to 20% of GDP.31 This highlights the twin challenges of ensuring that a strong revenue system is in place, while also allocating those revenues towards effective public investments.
Ghana: What Resource Curse? Mobilising Oil Wealth for Education
Ghana is one of the few sub-Saharan African countries to have met both UNESCO recommendations, as well as coming close to meeting its Dakar commitment. In 2011, it spent 8.1% of GDP and 33% of the
government budget on education. Its prioritisation of education has resulted in remarkable improvements in primary school enrolment. In 2011, 83% of children were enrolled, up from just 61% in 1999. The number of out-of-school children also decreased dramatically, from 1.1 million in 1999 to 641,000 in 2011.32
Ghana’s success in mobilising public resources for education is underpinned by its strengthened base of tax revenues, boosted by receipts from the Jubilee Oil Field.33 Oil revenue is expected to make up a larger proportion of government income than development assistance. Ghana’s oil revenues started flowing into government coffers in 2011 and the Petroleum Revenue Management Act was passed that year, mandating that revenues be invested in priority sectors. The law, combined with Ghana’s membership in the Extractive Industries Transparency Initiative (EITI), will help the government to ensure that the poorest citizens are receiving the resources they are due from the country’s natural wealth. Indeed, Ghana has committed to doubling expenditure on poverty-reducing services between 2009 and 2013.34

107107
4
TRENDS IN AFRICAN GOVERNMENT SPENDING
Domestic Resources for Education Beyond 2015 Education for all is a critical foundation of transformational, sustainable and inclusive development, and yet insufficient financing for the sector has been one of the main obstacles to achieving this. UNESCO has consistently measured financing gaps at a scale of billions of dollars. As demonstrated previously, the majority of African countries have failed to meet any of the various domestic spending targets. Donors have also failed to meet their own Dakar commitment that no country would be prevented from achieving universal education because of a lack of resources. Aid flows for education have stagnated in recent years, and it is unlikely that the EFA goals will be met by the 2015 deadline. In order to guarantee children’s right to education and tap into the transformational power of education to lift people out
of poverty, international donors need to increase support for the sector, and African governments need to implement fundamental reforms in order to mobilise and allocate sufficient domestic resources to education.
There is enormous potential within developing countries, even in some of the poorest parts of Africa, to raise significantly increased resources for education if they strengthen their tax structures, including with support from donors and other partners. Examining 67 developing countries worldwide, UNESCO calculated that they could boost their resources allocated to education by 72% (or $153 billion in one year), through a combination of improved tax-to-GDP ratios and increased public expenditure on education. In 13 of these countries, these reforms would more than double the resources
available for education. For example, if the Central African Republic increased tax revenues from 8% to 13% of GDP, and dedicated 20% of its total expenditure to education, it could see annual expenditure on each primary school child jump from $44 to $95.35 Given this potential, UNESCO is calling for a tenable domestic financing goal for education of 6% of GDP to be included in the post-2015 development framework.36 If the post-2015 education goals are properly designed – including precise and measurable targets on the quality of education, as well as numbers of children enrolled – and properly financed through a partnership of truly committed domestic and donor governments, millions more children could see the life-changing benefits of a quality education over run on 15 years.

108 THE 2014 DATA REPORT
RECOMMENDATIONSSub-Saharan Africa’s prospects for domestic financing are undoubtedly very bright. The sheer scale of the public resources available is growing dramatically, and these trends are set to continue, assuming that there are no major setbacks to economic growth. However, the question is how to seize this potential. Below, we set out a list of key recommendations for governments in the region, as well as donors, to accelerate progress in harnessing overall domestic resources for investments that have a real impact on poverty.
REVENUES
• African countries should broaden their tax base and improve their tax-to-GDP ratios by strengthening fiscal administration systems, improving natural resource governance and working with other governments, international institutions and businesses to stem the tide of illicit financial flows that hurt the poorest people by depriving them of valuable public resources. While mandatory standards requiring the public disclosure of payments to governments – particularly in the oil, gas and mining sectors – is a gold standard, developing countries should pursue voluntary transparency commitments under the Extractive Industries Transparency Initiative (EITI).
• Donors also have a critical role to play. In 2011, a paltry 0.07% of global ODA was channelled towards domestic resource mobilisation – this must be scaled up rapidly, along with financial and technical assistance to help African countries improve their public financial management systems more broadly.37 Donors should also lead by example in improving the transparency and predictability of their aid flows, and ensuring that as much as possible can be recorded on-budget in recipient countries.
• Furthermore, many major donor countries have significant opportunities to address their role in maintaining tax havens, attracting illicit flows and enabling tax evasion and corruption. This should be done through swiftly implementing legislation requiring oil, gas and mining firms to disclose payments to governments on a country- by-country and project-by-project basis, by pursuing international agreements on the automatic exchange of tax information between countries and by implementing public registers of the ownership of companies, trusts and similar legal structures.
• Some of the poorest and most fragile African countries, even making the best attempts they can to raise their tax shares, will struggle to muster sufficient domestic resources to address the massive needs facing their people in the short to medium term. It is important that donors do not view growing overall volumes of domestic resources and private flows to Africa as a substitute for aid across the board. Donors should take care to assess which countries are most in need of support, and should provide sustained aid investments in these countries, including through meeting the target of 0.15–0.20% ODA/GNI and half of all aid to LDCs (see Section 2).

109109
4
TRENDS IN AFRICAN GOVERNMENT SPENDING
EXPENDITURES
• African governments should step up and meet their existing spending promises. The vast majority of countries have not dedicated sufficient shares of their own resources to key poverty-reducing sectors such as health, agriculture and education, as set out in the Abuja, Maputo/Malabo and Dakar commitments respectively. However, while these proportional commitments are a valuable measure of political will, they do not fully account for country context (including the absolute size of the budget, population and burden of need). Governments can use 2015 as an opportunity to listen to the demands of their citizens, especially the poor, and to make new and specific commitments – backed up by adequate budgetary resources – to address the particular needs within their own countries in the next era of development.
• To this end, governments should ensure that budgetary decisions are as participatory as possible and reflective of the priorities of national development and poverty reduction strategies (developed in consultation with civil society). Outcome-based budgeting and linking data on inputs and performance would help citizens to track resources to results. Donors can support this effort by making sure that aid is allocated in harmony with national strategies.
• Lastly, it will be impossible to tell whether financing promises are being kept without a revolution in budget transparency across Africa. Efforts to end extreme poverty and improve the lives of all citizens must be underpinned by a spirit of openness and accountability. Supported by partners and learning lessons from well-performing neighbours in the region, such as Uganda and South Africa, African governments must urgently improve the availability, accessibility, accuracy, timeliness and comparability of their approved budgets and annual financial reporting. The World Bank’s BOOST initiative offers a good opportunity for countries to publish detailed budget datasets all in one place. Launched earlier this year, its Open Budgets Portal currently contains data for 13 countries, with dozens more to be included in the future, though as yet only a few of these are in sub-Saharan Africa.38

110 THE 2014 DATA REPORT
LIBERIA: A LEAST DEVELOPED COUNTRY ON THE RISE BUT STILL IN NEED OF STRONG AID INVESTMENT
Between 1989 and 2003, Liberia suffered 14 years of brutal civil war, devastating its economy, infrastructure and social fabric. Two years after the end of the conflict, in 2005, democratic elections were held, heralding a new era of peace, stability and development under President Ellen Johnson Sirleaf. Sirleaf has led an impressive recovery, with national economic growth reaching 10.2% in 2012.1 Through the Heavily Indebted Poor Countries (HIPC) and Multilateral Debt Relief Initiative (MDRI) schemes, $4.86 billion of the country’s
external debt was cancelled between 2008 and 2010, and today its debts remain at a sustainable level.2 In recent years, FDI has been pouring into the country, totalling $1.35 billion in 2012, equivalent to 78% of its GDP (up from 35% in 2010 and 11% in 2009).3
A combination of macroeconomic stability and growth, institutional reforms and determined political leadership has helped to drive dramatic progress on key development indicators. For example, child mortality was cut by 70% between 1990 and 2012, making Liberia one of just six African countries to have already met this MDG, well ahead of the 2015 deadline.4 In a country where women have played a pivotal role in achieving peace and post-conflict reconstruction, President Sirleaf – Africa’s first elected female head of state – has demonstrated strong personal commitment to gender equality. The ratio of girls to boys in primary school rose from 65% in 1998 to 92% in 2011.5 Almost a third of senior ministerial positions in the government are currently held by women. Although substantial inequalities still exist, Liberia is on track to achieve the MDG target on gender equality.6
However, despite impressive progress, significant challenges remain. Liberia is an LDC and a fragile state, with GDP per capita of just $414 (2012).7 It was ranked 175th out of 187 countries in the UN’s 2014 Human Development Index8 and, according to the most recent official data (from 2007), almost 84% of Liberians live
on less than $1.25 a day.9 Food insecurity remains widespread and the country faces a high burden of communicable diseases, especially malaria, as well as high levels of maternal and neonatal mortality.10 The recent spread of the Ebola virus has taken a heavy toll on Liberia (and the region), highlighting the challenges that persist in the health system and a lack of sufficient resources for meeting urgent needs.
Although FDI has helped to foster national economic recovery, it is not a substitute for public resources to fight poverty. Since the lion’s share of private investment flows into Liberia are directed towards natural resource sectors such as iron ore, timber, rubber, palm oil, gold and diamonds – which are capital-intensive but do not create many jobs – their impact on human development has been limited, particularly given the country’s large unemployed youth population.11
Liberia is heavily reliant on natural resources for economic growth and government revenues; thus improving governance in these sectors is critical. The forestry sector has an acutely troubled history: during the civil war, timber exports were used to finance arms sales and logging companies were embroiled in a number of human rights abuses.12 More recently, widespread fraud and abuse associated with Private Use Permits (PUPs) – licences that allowed logging companies to circumvent regulations and access huge tracts of forest – have led to an investigation and a

111
moratorium on their use.13 Liberia was the first African country to become compliant with the Extractive Industries Transparency Initiative (EITI) standard, and the first worldwide to include the forestry sector (as well as agriculture) in its reporting.14 In June 2014, Liberia published its fifth EITI report, which valued total extractives revenue for the fiscal year 2011/12 at $110 million (more than half of which was from mining).15
Liberia is using the EITI process innovatively to investigate key areas of concern in the allocation of contracts, company payments and earmarking of funding. The publication of its EITI audit – a global first – revealed significant legal violations, which the government must now address.16
Implementing EITI and other institutional reforms has helped Liberia to make strides in domestic financing efforts. In 2012, the government mobilised 28.7% of GDP in tax revenue – significantly more than the average among LDCs. Improvements in tax administration are expected to continue with the establishment of the new Liberia Revenue Authority, which was set up with the support of donors such as the United States, the United Nations Development Programme and the World Bank, and officially began operations in July 2014.17 However, the absolute volume of revenue remains very low, owing to the still small size of the economy. Total government revenue in 2012 came to just $132 per capita, showing the scale of the challenge in providing even the most basic services and infrastructure to all citizens.18
As a result, Liberia remains heavily reliant on donor support. Total flows of ODA to the country in 2012 equated to 1.4 times the government’s own revenues.19
The impact of these sustained aid investments has been transformative. Between 2004 and 2013, development assistance ensured the distribution of over 4.5 million anti-malarial bednets, the provision of antiretroviral therapy to treat HIV/AIDS for 6,500 Liberians, and the detection and treatment of 27,400 cases of tuberculosis.20 Liberia has also achieved and maintained a national vaccine coverage rate of 93% since 2009, thanks to support from GAVI.21
While Liberia has experienced impressive economic growth and is making a concerted effort to improve domestic resource mobilisation, it remains one of the poorest and most vulnerable countries in the world. Beyond 2015, in LDCs such as Liberia, donors will continue to play a transformative role in funding life-saving and life-changing public services and infrastructure that are critical for strengthening human capital, boosting economic progress and thus laying the foundations for a future in which these countries no longer require aid.
In Tonglewin village, Liberia, a women’s group organises maths and literacy classes. Photo: Christopher Herwig / United Nations
TRENDS IN AFRICAN GOVERNMENT SPENDING: LIBERIA

112 THE 2014 DATA REPORT
NIGERIA: SUB-SAHARAN AFRICA’S LARGEST ECONOMY GRAPPLING WITH PERSISTENT POVERTY
In April 2014, Nigeria officially overtook South Africa to become sub-Saharan Africa’s largest economy, following the results of a national statistical exercise to update the calculation of its GDP figures. Its ‘new’ GDP stood at $510 billion in 2013.1 For sub-Saharan Africa’s most populous country (173.6 million people – almost a fifth of the entire regional population), this figure is less impressive in per capita terms, at around $2,700, and the country remains firmly in the lower-middle-income bracket.2 Nevertheless, Nigeria’s GDP per capita is still well above the regional average,3 and the country also dominates the region in terms of private flows. It has
consistently received the highest net flows of FDI of any sub-Saharan African country in recent years ($7.1 billion in 2012) and received a colossal $20.6 billion in remittances in 2012.4 To put this latter figure into perspective, the second and third largest recipients (Kenya and South Africa, whose populations are around a quarter and a third the size of Nigeria’s respectively) received not much more than $1 billion each.5
However, Nigeria’s rapid economic growth – which averaged more than 6% per year between 2000 and 2010 (and more than 3% in per capita terms) – and the dazzlingly large private flows into the country have not led to any meaningful, widespread reduction in poverty.6
In 2010, Nigeria’s level of extreme poverty was 68% – almost exactly the same proportion as in 1996 and yet representing an additional 32 million people, with 109 million now living on less than $1.25 a day.7
Progress on many other key indicators has also been slow. Primary school enrolment has actually decreased compared with 1990, to just 58.6%.8 In 2012, 827,000 Nigerian children died before their fifth birthday – accounting for a quarter of all child deaths across the entire region.9
Nigeria is Africa’s leading oil producer, and its long-running struggles with corruption, lack of economic diversification, acute inequalities and social and political tensions in many ways typify the concept of the ‘resource curse’. However, while Nigeria does remain
dependent on natural resources (oil accounts for around 78% of government revenues),10 the GDP rebasing exercise revealed greater diversification than was previously thought to exist. In 2013, the oil sector contributed 14.4% of GDP, down from 37.4% in 2008.11 In recent years, growth has been driven by agriculture (which now contributes the highest single share of GDP, at 22%), telecoms, construction, retail and hospitality, and the Nollywood film industry. These industries are witnessing the rise of a new generation of home-grown entrepreneurs and business leaders. The most famous among them, Aliko Dangote (the 23rd richest person in the world), built his empire in trading agricultural commodities and textiles, and later in manufacturing and agro-processing.12
There is enormous potential for Nigeria to harness far greater domestic resources to finance its own development. Taking into account its revised GDP figures, the government mobilised a revenue-to-GDP ratio of just 10% in 2013.13 Analysis by Ben Leo of the Center for Global Development demonstrates that Nigeria could have raised an additional $67 billion had its efforts met the recommended benchmark (and median among all African countries) of 25%.14 Nigeria’s Finance Minister Ngozi Okonjo-Iweala has spoken of the pressing need for Nigeria and other developing countries to improve domestic resource mobilisation, and has urged donors to channel more aid towards strengthening tax systems.15 In a speech earlier this year at the Abuja meeting of the Leading Group on Innovative Financing

113
for Development, she highlighted Nigeria’s twin challenges of broadening its tax base in the context of its large informal sector – 75% of registered firms are not accounted for in the tax system – and strengthening its institutions to address the “scourge” of illicit financial flows.16 During 2002–11, Nigeria ranked 10th of all countries worldwide for the annual volume of illicit financial outflows, losing a staggering $142.3 billion cumulatively over this period.17
In the oil sector, it is estimated that hundreds of billions of dollars have been lost since independence due to corruption and theft.18 However, progress is being made in uncovering corruption, thanks to increased transparency in recent years. Nigeria became fully compliant with the Extractive Industries
Transparency Initiative (EITI) standard in 2011, and was the first African country to make reporting of company payments and government receipts legally binding. The country’s 2009 EITI report revealed discrepancies of more than $800 million between what companies claimed to have paid in royalties, taxes and signature bonuses and what the government said it received, and its 2011 EITI report raised concerns that the discrepancies could be as high as $10 billion.19 A 2012 report suggested that Nigeria may have lost $37 billion in oil revenues due to underpayments.20
Corruption and weak mobilisation of resources hinder the government’s ability to provide critical public services and infrastructure to its citizens. Per capita government expenditure in 2013 was a paltry $392,
or less than $700 in purchasing power parity (PPP) terms – an unacceptably low level of public spending per citizen for a country so rich in natural wealth.21 In addition, as demonstrated in Section 4, Nigeria has also performed poorly in allocating its existing resources towards pro-poor spending in health and agriculture, achieving half (or less) of the required budget shares on average over the past three years.22
Furthermore, as work by Nigeria’s Centre for Social Justice shows, government budget documents are unclear and vague on details in many areas of expenditure, making it difficult for the public to understand and monitor government spending.23 In the 2012 Open Budget Index, the country scored just 16 out of 100 – marking the fourth consecutive decline
Construction workers on-site in Nigeria. Construction and real estate is one of the fastest-growing sectors of Nigeria’s economy. Photo: Arne Hoel / World Bank
in its Index score since 2006, and showing in a stark light its poor performance relative to its neighbours in West Africa (including Ghana, Liberia and Sierra Leone), many of which are much poorer countries.24
Nigeria exemplifies sub-Saharan Africa’s enormous potential, alongside its most pernicious social and political challenges, perhaps better than any other country in the region. Yet if it made headway on curbing corruption, improving domestic resource mobilisation and investing these public resources in areas of spending that are catalytic for reducing poverty, it could transform the lives of the 100 million Nigerians living in extreme poverty.
TRENDS IN AFRICAN GOVERNMENT SPENDING: NIGERIA

114 THE 2014 DATA REPORT
115
CONCLUSION AND CALLS TO ACTION
CONCLUSION AND CALLS TO ACTION
A woman cleans soya in Bincheratanga, Ghana. Photo: A. Kauffeld / USAID

116 THE 2014 DATA REPORT
We are less than one year away from the moment when governments around the world will come together at the United Nations to agree the post-2015 Sustainable Development Goals (SDGs), which will define the contours of a new global development agenda. The scale of political will and financial investment required to achieve this agenda is unprecedented. The key question is how best to incentivise and harness a sufficient quantity and quality of diverse resources to meet development needs. It now falls to the international community, working closely with civil society and the private sector, to establish a coherent and rigorous financing strategy to achieve this.
The report by the UN Intergovernmental Committee of Experts on Sustainable Development Finance marks an important milestone in this process. It maps all major types of financial flows and sets out policy measures to help governments adopt a cohesive approach to strengthening resource mobilisation linked to their national development strategies, as well as to strengthen the international economic architecture. The next key moment will be in July 2015, at the Third International Conference on Financing for Development, to be held in Addis Ababa, Ethiopia. This will be a unique and timely opportunity to bring together all stakeholders to advance post-2015
financing discussions ahead of the UN General Assembly in September 2015.
While recognising that private flows are integral to achieving sustainable development, ONE advocates for governments to fulfil their promises to the world’s poor, and the DATA Report focuses on securing the best possible quantity and quality of public resources – international and domestic – for development. As we approach the momentous year of 2015, ONE sets out 11 calls to action to governments around the globe for enhancing public development finance in order to help end extreme poverty.
3 September 2014 – June 2015:Period of preparation for the Third International Financing for Development Conference, including thematic sessions and interactive hearings with civil society and business. The first draft outcome document prepared by the co-facilitators of the consultations (Norway and Guyana) is due in February 2015.
4 October 2014: OECDDevelopment Assistance Committee (DAC) Senior Level Meeting to advance discussions on ODA modernisation, the definition of a new concept of ‘total official support for development’ and a recipient's receipts measure.
6 December 2014: OECDDevelopment Assistance Committee due to fulfil its December 2012 HLM mandate on modernising the development finance measurement system, including reforming the definition and reporting of Official Development Assistance.(ODA)
7 June 2015: Germany hosts thelast G7 Summit before the agreement of the new development framework, with an agenda focused on poverty, climate change and the SDGs.
8 July 2015: Third International Conference on Financing forDevelopment takes place in Addis Ababa – a key opportunity for governments, the private sector and civil society to advance discussions and make commitments on mobilising a sufficient quantity and quality of resources to finance the post-2015 agenda.
10 December 2015: Governments meet at the COP21 Climate Conference in Paris to conclude the negotiation of a binding international climate change agreement, with ambitious and equitable commitments from all countries.
1 September 2014: The OpenWorking Group (OWG) – tasked with proposing new goals and targets for the SDGs – submits its final report to the UN General Assembly.
9 September 2015: Governmentsfrom all over the world agree the new development goals at a UN High Level Summit, following a year of formal negotiations.
2 September 2014: The Intergovernmental Committeeof Experts on Sustainable Development Financing (ICESDF) – tasked with proposing options for a comprehen-sive sustainable development financing strategy – submits its report to the UN General Assembly.
5 Late November/early December 2014: The UNSecretary-General Ban Ki-moon releases his synthesis report, drawing on the OWG and ICESDF inputs and setting the stage for the next phase of formal inter-governmental negotiations.
POST-2015 PROCESS
Sep Oct Nov Dec Jan Feb Mar April May June July Aug Sep Oct Nov Dec
B 2014 2015 2016 2 95
7 3 10
4 6
8
1
January 2016: New SDGs come into effect
Official post-2015 process
Related events

117
ENHANCING DEVELOPMENT FINANCE FOR 2015 AND BEYOND: 11 CALLS TO ACTION
CONCLUSION AND CALLS TO ACTION
The post-2015 development finance landscape is diversifying and the future of aid is changing. But aid investments will continue to play a critical role in many countries, especially in sub-Saharan Africa, where more than half of states are classified as LDCs. ODA is the only external flow explicitly aimed at supporting economic development and improving welfare, and it is also much less volatile than other external flows such as FDI. Over the medium term, at least, development assistance will remain vital in funding basic services for citizens in countries where per capita spending and prospects for mobilising other sizeable resources are low.
1 In the spirit of renewed global partnership for 2015, every donor government must explicitly recommit to the longstanding international commitment to deliver ODA of 0.7% of GNI, and set out a concrete timetable to increase their aid budgets towards this goal as soon as possible. Those countries that have met 0.7% should continue to lead by example, and encourage others to do so.
2 Donors should also better target their development assistance to the poorest and most vulnerable countries, by committing to channel at least half of their total development assistance to LDCs, in line with what these countries are themselves calling for. The existing UN 0.15–0.20% ODA/GNI benchmark could be used as an interim target by some donors that are already close to meeting it. To avoid imposing a debt burden on these countries, donors must publicly commit to providing at least 90% of their aid to LDCs in the form of grants.
Donor and recipient governments could have a real impact on the future of aid quality and credibility by pushing for much needed reforms to the current development finance measurement system through the ODA modernisation process under way in the OECD DAC, as well as other opportunities at the Addis Ababa Financing Conference and at UN level.
3 DAC member states should agree upon a redefined concept of ODA that (i) excludes debt relief; (ii) excludes the majority of in-donor costs; and (iii) includes only the grant equivalent of concessional lending (calculated at a realistic reference rate).
4 Concessionality rules should be amended to meet today’s market realities, and to prevent the practice among some donors of providing unsubsidised loans as ODA, through adopting either the IMF and World Bank’s 5% reference rate or the Differentiated Discount Rates.
5 To guide the choice of grant or loan, an adequate and independent debt sustainability assessment should be made, which takes into account the recipient country’s level of indebtedness and risk of distress (among other factors). The DAC should adopt a debt sustainability criterion, whereby loans must pass this assessment in order to count as ODA. In addition a fair, impartial and transparent international debt arbitration mechanism should be established to ensure efficient restructuring of debts when a debt crisis arises.

118 THE 2014 DATA REPORT
Domestic resources already outweigh external flows in many countries, and prospects are very bright for their dramatic increase over time. However, African governments and their partners must now seize this potential by addressing major challenges in maximising public revenues (particularly in those countries highly dependent on natural resources) and allocating expenditures to ensure a transformative impact on poverty in the region.
6 African governments should broaden their tax base by designing progressive fiscal policies and strengthening public financial management and tax administration. They should reduce corruption, stem the tide of illicit financial flows that deprive citizens of valuable public resources, and improve the governance of natural resources, including implementation of the Extractive Industries Transparency Initiative (EITI) standard to ensure the full public disclosure of payments to governments by oil, gas and mining companies.
7 Donors should play their part by boosting the amount of development assistance dedicated to strengthening public financial management (which currently stands at around 1% of total ODA), and particularly domestic resource mobilisation (which is estimated at just 0.07% of total ODA). They should also lead by example in improving the transparency and predictability of their aid flows, and ensuring that as much as possible can be recorded on-budget in recipient countries.
8 Donor countries also have significant opportunities to address their role in maintaining tax havens, attracting illicit flows and enabling tax evasion and corruption. This should be done through swiftly implementing legislation requiring oil, gas and mining firms to disclose payments to governments on a country-by-country and project-by-project basis, by pursuing international agreements on the automatic exchange of tax information between countries and by implementing public registers of the ownership of companies, trusts and similar legal structures.
9 African governments must meet their own commitments to prioritise spending on programmes and in sectors that make the largest contributions to poverty reduction, including health, agriculture and education. They should use 2015 as an opportunity to listen to the demands of their citizens, especially the extreme poor, and to make new and specific commitments – backed up by adequate budgetary resources – to address these needs. Budgeting should be participatory, outcome-based and aligned with national development and poverty reduction strategies.

119
The post-2015 development agenda must be underpinned by a spirit of citizen accountability at all levels. Accountability is impossible without transparency. The world requires nothing short of a data revolution to build a coherent picture of all the financial resources available for development in every country. Citizens in rich and poor countries alike, and their representatives in parliaments and CSOs, require access to accurate, comprehensive and timely data on both financial inputs and results, so that they can follow the money and hold governments to account.
10 Donors should meet their commitment and fully publish to the International Aid Transparency Initiative (IATI) by 2015. Emerging donors should also improve the transparency of their development cooperation by publishing detailed, comprehensive and timely data on their development assistance. In line with their responsibility as major providers of development assistance, they should also considering publishing to IATI.
11 African governments should systematically publish – in accessible, useful and machine-readable formats – accurate, timely and (as far as possible) standardised and comparable revenue and expenditure data, including – at a minimum – both approved / enacted budgets and year-end reports. The World Bank’s BOOST initiative offers a good opportunity for governments to publish detailed budget data to an Open Budgets Portal that makes such information accessible to the public all in one place. Governments should also link financial data to performance data so that citizens can track resources to results.
Next year poses a historic opportunity. The decisionsmade in 2015 will test our resolve to confront the economic, social and environmental challenges facing all of us. By following these 11 key recommendations, governments around the globe can demonstrate their determination to provide the financial resources required to end extreme poverty and to create a fairer, more equal and more prosperous world.
CONCLUSION AND CALLS TO ACTION

120 THE 2014 DATA REPORT

121
Children attend school in the village of Qoaling in Lesotho. Photo: John Hogg/World Bank
METHODOLOGY
METHODOLOGY

122 THE 2014 DATA REPORT
HOW DOES ONE MEASURE DONOR ASSISTANCE?In the annual DATA Report, ONE tracks official development assistance (ODA) flows from OECD Development Assistance Committee (DAC) donors to all developing countries, to the African continent and to the sub-Saharan African region, according to preliminary data released by the OECD DAC in April each year pertaining to the previous calendar year. The 2013 preliminary data can be accessed from OECD DAC, at www.oecd.org/dac/stats/data.htm. This preliminary data provides only a basic breakdown (for instance, by region, but not by country, sector or aid type) and is subject to revision in the final figures, which are released in December and include a detailed breakdown. Furthermore, it should be noted that in the DAC’s preliminary data, regionally allocated bilateral flows do not necessarily include all types of aid for all donors and thus, for these donors, aid volumes to Africa and sub-Saharan Africa are likely to be higher in the final figures.1
The preliminary data for 2012, used in the 2013 DATA Report, was revised for some countries in the final December 2013 release. These revised 2012 figures have been used for the purpose of this report. The data used in this report is taken from the OECD DAC’s online databases (DAC1, DAC2a and the Creditor Reporting System), which can be accessed at http://stats.oecd.org/. We analyse flows in US dollars, as reported by the DAC, and convert to other currencies using the OECD’s annualised exchange rates; hence flows in these currencies should be taken as close estimations, rather than exact figures. Four countries joined the DAC during 2013 – the Czech Republic, Poland, the Slovak
Republic and Slovenia. To maintain a fair comparison, ONE has retrospectively included these countries in the total DAC grouping for years prior to 2013.
This report also examines ODA from all EU member states. For the nine EU member states that are not members of the DAC (Bulgaria, Croatia, Cyprus, Estonia, Hungary, Latvia, Lithuania, Malta and Romania), ONE sources total ODA figures (Africa and sub-Saharan Africa breakdowns are not available) from European Commission documentation.2 These figures are converted into US dollars (2013 prices) using DAC deflators where available, and otherwise the euro-specific deflator.
CONSTANT PRICES
ONE uses constant prices (real terms) rather than current prices (nominal terms), thus accounting for inflation and national currency devaluations, and assessing change over time in the real value of ODA more accurately. To calculate constant prices, we apply the country deflators published by the DAC for the most recent base year (2013).
BILATERAL AND MULTILATERAL FLOWS
The DAC categorises ODA outflows as either bilateral or multilateral. Bilateral ODA is disbursed directly from donor countries to developing countries. This bilateral category also includes ‘earmarked’ multilateral flows – contributions made by donors to specific recipients, but via multilateral agencies. Multilateral ODA
comprises donors’ core contributions to multilateral orgvanisations, which, by definition, are not disaggregated by country or region. The DAC ‘imputes’ donors’ multilateral flows each year by applying the proportion of each multilateral organisation’s outflows to each region/country to each donor’s total contribution to that multilateral organisation. However, neither these DAC imputations nor multilateral disbursements to developing countries/regions are included in the publication of preliminary data in April; they are not published until the final data release in December. Thus, in the DATA Report, ONE uses a set methodology to estimate how much of each donor’s multilateral ODA can be imputed to Africa and sub-Saharan Africa, indicated in the example below.
• In 2013, a donor provides $10 million in core contributions to a particular multilateral agency.
• In 2012, this agency allocated 41% of its total disbursements to sub-Saharan Africa.
• Thus, ONE estimates that in 2013, the donor provides $4.1 million (41% of $10 million) to sub-Saharan Africa
via this multilateral agency.
Donor contributions to five groups of multilateral agencies are included in the DAC’s preliminary release: UN agencies, the European Commission, the World Bank, regional development banks and ‘other’. We repeat the steps outlined above for each of the five groups, and sum them for the donor’s total multilateral flows imputed to Africa and sub-Saharan Africa. We then add this to bilateral flows to give a full picture of each donor’s total aid flows to Africa and the
123
sub-Saharan region. We fully acknowledge that the figure arrived at by these calculations is an estimate, and that the final figures (which are published by the DAC in December each year) can vary significantly from this estimate. There are three main reasons for this variation: (1) due to lack of information for the most recent year, we assume that the proportion of total funding that a multilateral allocates to a given region has held more or less steady from the previous year (whereas this proportion can increase or decrease); (2) the level of multilateral detail is greatly increased in the final figures: in other words, we can better track each donor’s flows to each individual multilateral agency, rather than the five main groupings listed above; and (3) all the data in the April release (including donor contributions to multilaterals) is preliminary and subject to change.
DEBT RELIEF
Multilateral debt cancellation is included in ODA as tracked by this report. The cost to a donor of cancelling multilateral debt is paid through its contributions to the multilateral agency (e.g. the World Bank’s International Development Association or the African Development Bank). However, ONE excludes bilateral debt relief to assess whether countries’ reported ODA flows represent new, increased resource flows. Debt relief is immensely valuable and, as a result of it, governments are now able to spend resources on health, education and critical infrastructure instead of unsustainable debt service payments. However, the rules on counting bilateral debt cancellation as
development assistance overstate the value of the debt relief. Under current rules, once debt has been cancelled donors can report the whole face value of the debt as ODA. This means that the principal, interest and penalties on arrears for the whole period that the debt has remained unpaid are counted in the ODA figures at the point of cancellation, and are included in the DAC reports. This amount does not reflect either the value to the developing country or the cost to the donor country of cancelling the debt. Exactly how much should be counted is unclear, due to lack of transparency by donors in terms of disclosing their internal accounting or budget pricing (e.g. market-to-market valuations). ONE remains hopeful that a more accurate means of accounting for bilateral debt relief will become available so that, in the future, donors can be duly credited for the allocations they make for bilateral debt cancellation in their annual budgets. In addition, it is unlikely that any African countries will be significantly benefiting from bilateral debt cancellation by 2015. The Heavily Indebted Poor Countries (HIPC) scheme – the only major debt relief scheme in existence – has almost come to an end, and there are only a few eligible African countries remaining. Therefore, donors need to make budgetary provisions to achieve their ODA targets without relying on ODA inflated by bilateral debt cancellation figures. The OECD DAC is currently reviewing the definition of ODA. ONE believes that debt relief should not be reported as ODA. It should instead be additional, as stated in the 2002 Monterrey Consensus agreed at the first International Conference on Financing for Development.
In its preliminary figures, the DAC does not specify the level of debt relief received by individual countries. However, it does provide debt relief figures for the region of sub-Saharan Africa (although not Africa as a whole). In the absence of this information, ONE equates debt relief to sub-Saharan Africa with debt relief to Africa; in other words, we assume bilateral debt relief to North Africa to be zero.
Debt relief is not excluded for non-DAC donors (the nine EU member states that are not members of the DAC) due to lack of data; however, these amounts are very small.
TARGETS AND PAST PROGRESS
The DATA Report measures progress in ODA levels between 2004 and 2013. Currently, the only group of countries with official ODA volume targets still in place are EU member states.
In 2005, the EU agreed to collectively achieve ODA levels of 0.7% of gross national income (GNI) by 2015. The original 15 EU member states (‘the EU15’) also agreed individual ODA/GNI targets of 0.7%, and any countries that had already achieved or surpassed this promised to maintain those levels. The UK committed to achieve 0.7% by 2013, and hence in its donor profile we assess progress against a target of 0.7% in each year from 2013 to 2015. EU member states that acceded after 2004 committed to reach 0.17% ODA/GNI by 2010 and 0.33% by 2015. In our analysis of EU progress towards the 0.7% target, ONE includes ODA from the 28 member states as well as European
METHODOLOGY

124 THE 2014 DATA REPORT
Investment Bank (EIB) loans (which are not imputed back to member states) reported as ODA in the DAC statistics. To calculate the 2015 target, ONE uses GDP growth forecasts published by the OECD in its annual Economic Outlook (and where these are unavailable for certain countries, growth forecasts published by the International Monetary Fund (IMF) in its World Economic Outlook) to estimate the projected value of collective 0.7% ODA/GNI. For the EU member states profiled in the report, we apply this same methodology on an individual basis to calculate 0.7% in 2015.
NB: Loans from the EIB are not included as ODA in the DAC statistics for the period 2008–10, due to questions over their concessionality, and the only figures recorded under EU institutions’ loan disbursements in the period 2008–10 are small amounts of equities. Following a new agreement last year, EIB loans were included in DAC ODA statistics for the first time in the April 2013 release (of 2012 data), but only for the period since 2011.3 While ONE adheres to the official figures reported by the DAC, it should be noted that this results in a statistical ‘cliff’ between 2010 (when only a small volume of $70.5 million in equities is recorded) and 2011 (when EIB ODA loans of $5.35 billion are recorded). Since this amount is still relatively quite small compared with the ODA of the 28 EU member states, it does not make a large difference in our analysis of EU progress towards the 0.7% target; however, consistent retrospective accounting for
EIB loans in the DAC ODA statistics would be preferable.In 2005, the EU Council committed to collectively allocate 50% of the total EU ODA increases (compared with 2004) to Africa. This was a collective EU Council pledge and member states did not specify their own individual targets. However, ONE assumes a ‘fair share’ approach and applies this same ‘50% of all increases’ target to the individual donors profiled in the report. Annual ODA to Africa as shown in the report includes both bilateral contributions and the share of each donor’s estimated multilateral contributions for Africa (estimated imputed figures, as described above). ONE calculates Africa target increases based on the 0.7% target for total aid in 2015. We establish a ‘smoothed’ 2004 baseline (for which multilateral contributions in 2004 and 2005 are averaged, to address the year-on-year ‘lumpiness’ prevalent in multilateral flows), calculate the total difference between this baseline and the 2015 target, and then halve this amount to give the Africa target increase. In assessing collective EU progress, we are only able to examine progress by the 19 EU member states that are also members of the DAC (‘the EU19’) because only these donors report preliminary data on their flows to Africa; thus – unlike for EU progress towards 0.7% – this analysis does not include ODA from the other nine member states or the EIB.
WHY ARE THERE SOMETIMES DIFFERENCES BETWEEN A COUNTRY’S OWN DATA AND DAC DATA?
There are a number of possible reasons for this. For example, a country’s own data may follow a different financial year or a country may include programmatic or assistance categories that deviate from established DAC definitions and guidelines. Another possible reason is that multiple ministries may be responsible for managing development assistance activities. While the totality of each country’s aid programme should be collectively reported to the DAC, domestic reporting may cover only the activities of the main development assistance ministry. Preliminary data does not include a full picture of regional allocations; thus, it effectively often underestimates flows to Africa and sub-Saharan Africa. In the past, there have often been substantial changes to flows to Africa/sub-Saharan Africa in the final data compared with the preliminary estimates. In addition, government reporting is often based on budgets; DAC reporting deals with annual disbursements. Finally, a number of countries use multiple coding, where an activity will be coded for several sectors (for instance 20% to water, 50% to health, 30% to infrastructure), but DAC coding allows for only one sector per project.

125
HOW DOES ONE ANALYSE THE COMPOSITION OF DONOR AID?Data on ODA to least developed countries (LDCs) is derived from the OEDC DAC database, Table 2a. According to our usual method of counting ODA, we include both bilateral and imputed multilateral flows, and exclude debt relief. Our methodology differs from that used in the DAC Secretariat’s own published analysis in two main regards. First, we do not include any estimated portion of regional and global unallocated ODA. Second, we use a historically accurate annual list of LDCs, rather than the World Bank’s current list of LDCs (which misses countries that used to be in the LDC group but have since ‘graduated’ from the list). Grant aid to LDCs is derived from the OECD DAC’s historical documents ‘Table 20: Financial Terms of ODA Commitments’, for each year 2003 to 2012.
Figures for in-donor costs and debt relief are derived from the OEDC DAC database, Table 1. ONE’s assessment of in-donor ODA includes ‘imputed
student costs’, ‘administrative costs not included elsewhere’, ‘development awareness’ and ‘refugees in donor countries’. Indirect (‘imputed’) costs of tuition in donor countries can be reported as ODA in non-fee-charging educational systems, or where fees do not cover the cost of tuition, and if the presence of students is part of the host country’s development policy. Administrative costs not included elsewhere comprise administrative costs of development assistance programmes not already included under other ODA items as an integral part of the costs of delivering or implementing the aid provided. Refugee costs include official sector expenditures for the sustenance of refugees in donor countries during the first 12 months of their stay. Development awareness includes costs of activities designed to increase public support in the donor country of development cooperation efforts, needs and issues. Our analysis of in-donor ODA does not include scholarship and training costs (financial aid awards for individual students and
contributions to trainees from developing countries) because of a lack of comparable historical data in the DAC database.
The terms of average ODA loans were obtained from the OECD DAC’s historical documents, ‘Table 22: Other Terms Parameters’, for loan-giving DAC members for each year from 2004 to 2012. The terms of individual loans for 2012 were downloaded from the DAC Creditor Reporting System (CRS) database. Data on Differentiated Discount Rates is sourced from the OECD repository of DDRs.
It should be noted that ONE’s analysis of ODA loans prior to 2012 does not include EIB loans, due to a lack of full data. Following lengthy discussions in the DAC, it was decided in April 2013 that for the period 2008–10 the data on concessional flows shown for the EU institutions would relate to grants only and that all EIB loans would be recorded as non-concessional.
METHODOLOGY

With TechnoServe's support, members of the Duromina Coffee Cooperative in Ethiopia's Jimma Zone acquired a wet mill and began producing high-quality beans. The farmers used their new income to build a bridge for their remote community, allowing easier access to markets and a health clinic.Photo: Technoserve
126 THE 2014 DATA REPORT
HOW DOES ONE MEASURE DOMESTIC GOVERNMENT EXPENDITURE?Sub-Saharan African total government expenditures are derived from the IMF World Economic Outlook (WEO) database (April 2014 edition). They are calculated by combining general government total expenditure (measured as a percentage of GDP and absolute GDP (in US dollars, current prices) to give estimates of absolute expenditure. To calculate per capita government spending, we use IMF data on GDP per capita (in PPP$).
Sub-Saharan African government expenditures on health are sourced from the World Health Organization (WHO)’s Global Health Expenditure Database, which provides data on the annual share of total government expenditure allocated to health. Governments were assessed against their Abuja commitment, in which they pledged to allocate 15% of total public spending towards health. ONE calculated the average of the annual share of spending devoted to health over the last three years of available data (2010–12). To calculate the total ‘Abuja deficit’ in absolute terms, the annual shares since 2001 (the year the Abuja commitment was made) were converted into US dollars, current prices, using data on total government expenditures as a share of GDP and GDP data, both derived as above from the IMF WEO database. Where countries had a ‘negative deficit’ in any year (i.e. they allocated more
than 15%), their deficit was treated as zero, rather than offsetting under-expenditures by other countries or in other years. Per capita health spending was sourced directly from WHO’s Global Health Expenditure Database. ONE calculated the average per capita spending over the last three years of available data (2010–12).
Sub-Saharan African government expenditures on agriculture are sourced from the Regional Strategic Analysis and Knowledge Support System (ReSAKSS) data published in the 2013 ‘Annual Trends and Outlook Report’, which shows agricultural expenditure as a share of total spending. Governments were assessed against their Maputo commitment, in which they pledged to allocate 10% of total public spending towards agriculture. ONE calculated the average of the annual share of spending devoted to agriculture over the last three years of available data (2008–10). To calculate the total ‘Maputo deficit’ in absolute terms, the annual shares since 2003 (the year the Maputo commitment was made) were converted into US dollars, current prices, using total government expenditures derived as above from the IMF WEO database. Where countries had a ‘negative deficit’ in any year (i.e. they allocated more than 10%) this was treated as zero, rather than offsetting under-expenditures by other countries or in other years.
Sub-Saharan African government expenditures on education are sourced from the UNESCO Institute for Statistics education database, which provides data on annual public expenditure on education as a share of GDP, GNI and total public expenditure. Governments were assessed against their Dakar commitment, in which they pledged to allocate 9% of GDP towards education by 2010, as well as UNESCO’s recommended targets of 6% of GNI and 20% of total government expenditure. Since annual data is far from complete across sub-Saharan African countries, ONE examined spending in the latest year of available data within the period 2010–13.
As highlighted in the report, reliable and timely data on the domestic expenditure of sub-Saharan African countries is significantly limited. Countries for which no data is available are excluded from this analysis, as indicated in the notes accompanying charts and figures.

127

128 THE 2014 DATA REPORT

129METHODOLOGY
REFERENCE TABLES
In Rwanda, where nearly two-thirds of people live in extreme poverty, a woman proudly shows off a carrot she grew in her garden after participating in a Canadian-funded project to improve agricultural skills.Photo: MAECD-DFATD / Steve Simon
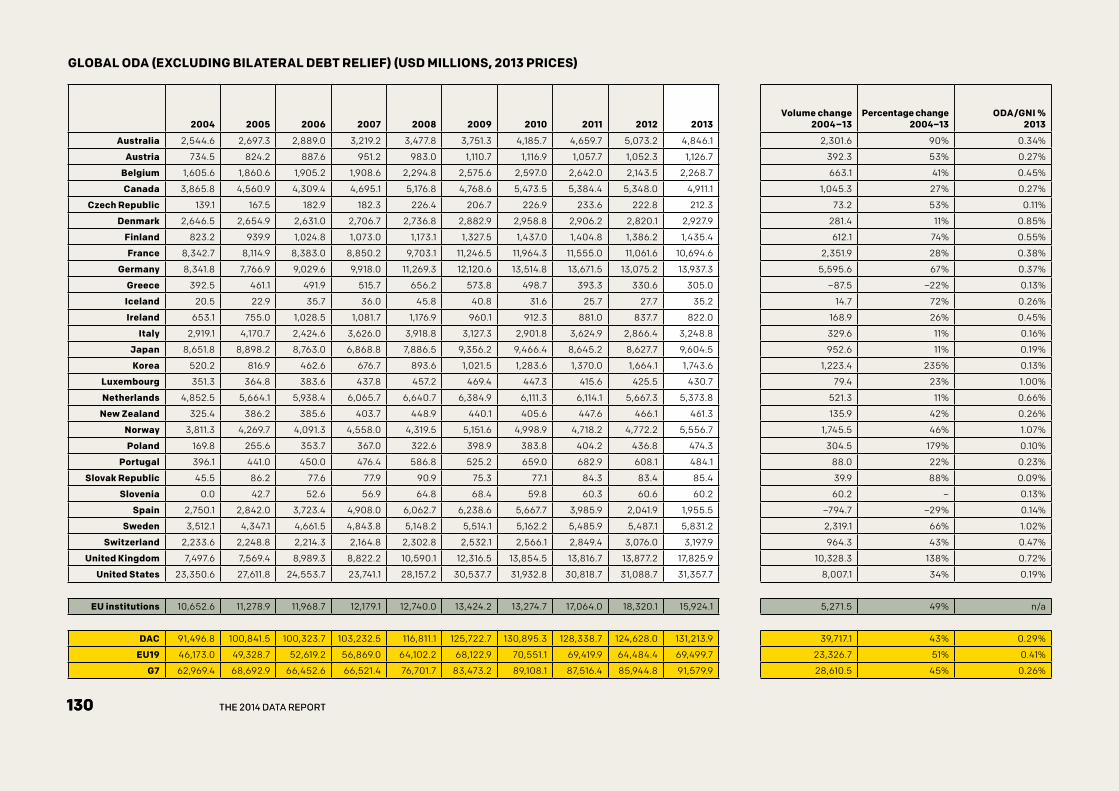
130 THE 2014 DATA REPORT130 THE 2014 DATA REPORT
2004 2005 2006 2007 2008 2009 2010 2011 2012 2013Volume change
2004 – 13Percentage change
2004 – 13ODA/GNI %
2013
Australia 2,544.6 2,697.3 2,889.0 3,219.2 3,477.8 3,751.3 4,185.7 4,659.7 5,073.2 4,846.1 2,301.6 90% 0.34%
Austria 734.5 824.2 887.6 951.2 983.0 1,110.7 1,116.9 1,057.7 1,052.3 1,126.7 392.3 53% 0.27%
Belgium 1,605.6 1,860.6 1,905.2 1,908.6 2,294.8 2,575.6 2,597.0 2,642.0 2,143.5 2,268.7 663.1 41% 0.45%
Canada 3,865.8 4,560.9 4,309.4 4,695.1 5,176.8 4,768.6 5,473.5 5,384.4 5,348.0 4,911.1 1,045.3 27% 0.27%
Czech Republic 139.1 167.5 182.9 182.3 226.4 206.7 226.9 233.6 222.8 212.3 73.2 53% 0.11%
Denmark 2,646.5 2,654.9 2,631.0 2,706.7 2,736.8 2,882.9 2,958.8 2,906.2 2,820.1 2,927.9 281.4 11% 0.85%
Finland 823.2 939.9 1,024.8 1,073.0 1,173.1 1,327.5 1,437.0 1,404.8 1,386.2 1,435.4 612.1 74% 0.55%
France 8,342.7 8,114.9 8,383.0 8,850.2 9,703.1 11,246.5 11,964.3 11,555.0 11,061.6 10,694.6 2,351.9 28% 0.38%
Germany 8,341.8 7,766.9 9,029.6 9,918.0 11,269.3 12,120.6 13,514.8 13,671.5 13,075.2 13,937.3 5,595.6 67% 0.37%
Greece 392.5 461.1 491.9 515.7 656.2 573.8 498.7 393.3 330.6 305.0 –87.5 –22% 0.13%
Iceland 20.5 22.9 35.7 36.0 45.8 40.8 31.6 25.7 27.7 35.2 14.7 72% 0.26%
Ireland 653.1 755.0 1,028.5 1,081.7 1,176.9 960.1 912.3 881.0 837.7 822.0 168.9 26% 0.45%
Italy 2,919.1 4,170.7 2,424.6 3,626.0 3,918.8 3,127.3 2,901.8 3,624.9 2,866.4 3,248.8 329.6 11% 0.16%
Japan 8,651.8 8,898.2 8,763.0 6,868.8 7,886.5 9,356.2 9,466.4 8,645.2 8,627.7 9,604.5 952.6 11% 0.19%
Korea 520.2 816.9 462.6 676.7 893.6 1,021.5 1,283.6 1,370.0 1,664.1 1,743.6 1,223.4 235% 0.13%
Luxembourg 351.3 364.8 383.6 437.8 457.2 469.4 447.3 415.6 425.5 430.7 79.4 23% 1.00%
Netherlands 4,852.5 5,664.1 5,938.4 6,065.7 6,640.7 6,384.9 6,111.3 6,114.1 5,667.3 5,373.8 521.3 11% 0.66%
New Zealand 325.4 386.2 385.6 403.7 448.9 440.1 405.6 447.6 466.1 461.3 135.9 42% 0.26%
Norway 3,811.3 4,269.7 4,091.3 4,558.0 4,319.5 5,151.6 4,998.9 4,718.2 4,772.2 5,556.7 1,745.5 46% 1.07%
Poland 169.8 255.6 353.7 367.0 322.6 398.9 383.8 404.2 436.8 474.3 304.5 179% 0.10%
Portugal 396.1 441.0 450.0 476.4 586.8 525.2 659.0 682.9 608.1 484.1 88.0 22% 0.23%
Slovak Republic 45.5 86.2 77.6 77.9 90.9 75.3 77.1 84.3 83.4 85.4 39.9 88% 0.09%
Slovenia 0.0 42.7 52.6 56.9 64.8 68.4 59.8 60.3 60.6 60.2 60.2 – 0.13%
Spain 2,750.1 2,842.0 3,723.4 4,908.0 6,062.7 6,238.6 5,667.7 3,985.9 2,041.9 1,955.5 –794.7 –29% 0.14%
Sweden 3,512.1 4,347.1 4,661.5 4,843.8 5,148.2 5,514.1 5,162.2 5,485.9 5,487.1 5,831.2 2,319.1 66% 1.02%
Switzerland 2,233.6 2,248.8 2,214.3 2,164.8 2,302.8 2,532.1 2,566.1 2,849.4 3,076.0 3,197.9 964.3 43% 0.47%
United Kingdom 7,497.6 7,569.4 8,989.3 8,822.2 10,590.1 12,316.5 13,854.5 13,816.7 13,877.2 17,825.9 10,328.3 138% 0.72%
United States 23,350.6 27,611.8 24,553.7 23,741.1 28,157.2 30,537.7 31,932.8 30,818.7 31,088.7 31,357.7 8,007.1 34% 0.19%
EU institutions 10,652.6 11,278.9 11,968.7 12,179.1 12,740.0 13,424.2 13,274.7 17,064.0 18,320.1 15,924.1 5,271.5 49% n/a
DAC 91,496.8 100,841.5 100,323.7 103,232.5 116,811.1 125,722.7 130,895.3 128,338.7 124,628.0 131,213.9 39,717.1 43% 0.29%
EU19 46,173.0 49,328.7 52,619.2 56,869.0 64,102.2 68,122.9 70,551.1 69,419.9 64,484.4 69,499.7 23,326.7 51% 0.41%
G7 62,969.4 68,692.9 66,452.6 66,521.4 76,701.7 83,473.2 89,108.1 87,516.4 85,944.8 91,579.9 28,610.5 45% 0.26%
GLOBAL ODA (EXCLUDING BILATERAL DEBT RELIEF) (USD MILLIONS, 2013 PRICES)

131131
2004 2005 2006 2007 2008 2009 2010 2011 2012 2013
Australia 0.24% 0.24% 0.26% 0.29% 0.29% 0.29% 0.32% 0.34% 0.36% 0.34%
Austria 0.20% 0.22% 0.23% 0.24% 0.24% 0.29% 0.28% 0.26% 0.25% 0.27%
Belgium 0.35% 0.40% 0.40% 0.39% 0.46% 0.53% 0.52% 0.51% 0.42% 0.45%
Canada 0.26% 0.30% 0.27% 0.29% 0.32% 0.30% 0.33% 0.32% 0.30% 0.27%
Czech Republic 0.10% 0.11% 0.11% 0.10% 0.12% 0.12% 0.13% 0.12% 0.12% 0.11%
Denmark 0.84% 0.80% 0.76% 0.77% 0.79% 0.87% 0.89% 0.85% 0.83% 0.85%
Finland 0.35% 0.38% 0.40% 0.39% 0.44% 0.54% 0.55% 0.53% 0.53% 0.55%
France 0.33% 0.31% 0.31% 0.32% 0.35% 0.42% 0.44% 0.42% 0.40% 0.38%
Germany 0.26% 0.24% 0.27% 0.28% 0.31% 0.35% 0.38% 0.38% 0.36% 0.37%
Greece 0.16% 0.17% 0.17% 0.16% 0.21% 0.19% 0.17% 0.15% 0.13% 0.13%
Iceland 0.18% 0.18% 0.27% 0.27% 0.47% 0.35% 0.29% 0.21% 0.22% 0.26%
Ireland 0.39% 0.42% 0.54% 0.55% 0.59% 0.54% 0.52% 0.51% 0.47% 0.45%
Italy 0.14% 0.19% 0.11% 0.16% 0.18% 0.15% 0.14% 0.17% 0.14% 0.16%
Japan 0.18% 0.19% 0.18% 0.14% 0.16% 0.20% 0.19% 0.18% 0.17% 0.19%
Korea 0.06% 0.09% 0.05% 0.07% 0.08% 0.10% 0.12% 0.12% 0.14% 0.13%
Luxembourg 0.79% 0.79% 0.89% 0.92% 0.97% 1.04% 1.05% 0.97% 1.00% 1.00%
Netherlands 0.70% 0.76% 0.76% 0.76% 0.79% 0.81% 0.75% 0.74% 0.69% 0.66%
New Zealand 0.23% 0.27% 0.27% 0.27% 0.30% 0.28% 0.26% 0.28% 0.28% 0.26%
Norway 0.87% 0.94% 0.88% 0.94% 0.88% 1.05% 1.05% 0.96% 0.93% 1.07%
Poland 0.05% 0.07% 0.09% 0.10% 0.08% 0.09% 0.08% 0.08% 0.09% 0.10%
Portugal 0.20% 0.21% 0.21% 0.22% 0.27% 0.25% 0.29% 0.31% 0.28% 0.23%
Slovak Republic 0.07% – 0.10% 0.09% 0.10% 0.09% 0.09% 0.09% 0.09% 0.09%
Slovenia – 0.11% 0.12% 0.12% 0.13% 0.15% 0.13% 0.13% 0.13% 0.13%
Spain 0.22% 0.22% 0.27% 0.35% 0.42% 0.45% 0.40% 0.28% 0.15% 0.14%
Sweden 0.77% 0.93% 0.95% 0.92% 0.98% 1.12% 0.97% 0.98% 0.97% 1.02%
Switzerland 0.38% 0.37% 0.35% 0.36% 0.40% 0.41% 0.39% 0.45% 0.47% 0.47%
United Kingdom 0.33% 0.32% 0.37% 0.35% 0.41% 0.51% 0.57% 0.56% 0.56% 0.72%
United States 0.17% 0.19% 0.16% 0.16% 0.18% 0.20% 0.21% 0.20% 0.19% 0.19%
DAC 0.24% 0.26% 0.25% 0.25% 0.27% 0.31% 0.31% 0.30% 0.28% 0.29%
EU19 0.30% 0.32% 0.32% 0.34% 0.38% 0.42% 0.43% 0.41% 0.38% 0.41%
G7 0.21% 0.22% 0.21% 0.20% 0.23% 0.26% 0.27% 0.26% 0.25% 0.26%
GLOBAL ODA/GNI % (EXCLUDING BILATERAL DEBT RELIEF)
REFERENCE TABLES

132 THE 2014 DATA REPORT132 THE 2014 DATA REPORT
2004 2005 2006 2007 2008 2009 2010 2011 2012 2013Volume change
2004 – 13Percentage change
2004 – 13ODA/GNI %
2013
Australia 203.4 222.6 344.5 272.5 241.9 319.0 475.8 563.0 697.0 645.1 441.7 217% 0.05%
Austria 256.5 272.7 337.9 323.7 326.3 419.4 407.8 353.9 375.5 368.2 111.6 44% 0.09%
Belgium 763.9 867.1 946.2 892.4 1,117.1 1,161.3 1,162.8 1,147.0 933.1 1,275.2 511.4 67% 0.25%
Canada 1,226.5 1,780.6 1,822.4 1,824.3 2,228.8 2,021.2 2,265.2 2,116.4 2,467.6 2,269.1 1,042.5 85% 0.13%
Czech Republic 32.5 48.8 55.0 54.0 60.4 54.8 65.3 67.3 73.9 74.9 42.4 130% 0.04%
Denmark 1,103.3 1,142.6 1,238.8 1,309.6 1,261.0 1,286.2 1,248.9 1,297.0 1,223.6 1,076.4 –26.8 –2% 0.31%
Finland 323.8 363.1 441.9 452.6 481.3 558.4 581.8 562.4 598.8 570.8 246.9 76% 0.22%
France 4,320.3 4,115.9 4,986.1 4,963.2 4,736.6 5,585.4 5,492.5 5,366.2 4,822.7 5,139.5 819.1 19% 0.18%
Germany 3,331.3 2,824.8 3,544.9 3,931.5 4,257.5 4,302.0 4,300.0 4,583.6 4,544.8 3,911.3 580.1 17% 0.11%
Greece 107.6 109.8 150.5 143.9 183.3 163.1 153.0 106.2 97.3 92.1 –15.4 –14% 0.04%
Iceland 7.1 8.2 15.1 12.4 19.4 18.0 15.3 12.4 12.8 16.1 9.0 127% 0.12%
Ireland 400.1 424.0 584.4 596.7 692.6 559.5 534.8 496.2 487.1 457.0 56.9 14% 0.25%
Italy 1,182.4 2,000.8 1,050.1 1,658.6 1,670.3 1,281.4 1,262.6 1,283.9 1,048.0 1,253.3 70.9 6% 0.06%
Japan 1,783.1 1,603.1 3,196.3 1,742.2 2,742.1 2,419.9 2,965.4 2,514.6 2,733.0 3,457.4 1,674.3 94% 0.07%
Korea 81.3 134.7 75.4 143.9 188.4 215.5 270.2 310.9 440.4 493.6 412.3 507% 0.04%
Luxembourg 157.7 162.6 183.6 205.3 210.1 212.9 204.8 177.7 171.6 154.3 –3.3 –2% 0.36%
Netherlands 2,219.7 2,200.8 1,850.4 2,086.0 2,197.3 1,811.2 1,563.8 1,743.0 1,502.6 1,637.5 –582.2 –26% 0.20%
New Zealand 38.9 41.1 37.9 37.7 44.3 43.7 36.1 42.9 27.8 61.0 22.1 57% 0.04%
Norway 1,636.2 1,624.4 1,634.0 1,609.2 1,604.1 1,661.0 1,599.5 1,592.5 1,507.9 1,643.1 6.9 0% 0.32%
Poland 73.0 90.8 204.0 99.5 121.3 140.9 125.5 116.7 131.8 191.2 118.2 162% 0.04%
Portugal 208.1 225.4 244.6 237.4 343.1 268.2 409.6 472.3 432.9 319.4 111.3 53% 0.15%
Slovak Republic 13.6 45.2 41.1 43.0 47.5 23.9 26.1 25.0 29.5 32.5 18.9 139% 0.03%
Slovenia 0.0 0.0 0.0 0.0 16.4 18.8 16.5 16.0 18.1 18.5 18.5 – 0.04%
Spain 953.9 926.6 1,273.5 1,551.4 1,936.3 2,285.4 1,834.1 1,368.8 669.0 747.0 –206.9 –22% 0.05%
Sweden 1,215.9 1,660.7 1,709.8 1,819.1 1,931.7 1,943.0 1,749.1 2,107.9 2,071.7 2,001.5 785.6 65% 0.35%
Switzerland 596.7 610.7 703.8 610.5 593.8 659.8 682.2 743.1 809.6 838.7 242.1 41% 0.12%
United Kingdom 3,027.2 2,935.1 4,212.8 3,988.5 4,442.0 4,939.4 5,788.6 5,705.0 5,633.8 7,084.0 4,056.8 134% 0.28%
United States 6,736.4 6,208.0 6,293.5 7,010.6 9,000.5 9,740.4 10,047.8 10,417.0 11,736.7 11,639.0 4,902.6 73% 0.07%
EU institutions 4,759.5 5,099.5 5,195.5 5,527.7 5,680.4 5,704.9 5,794.7 5,997.9 7,571.7 6,061.2 1,301.6 27% n/a
DAC 32,000.4 32,650.4 37,178.3 37,619.9 42,695.3 44,113.9 45,285.1 45,309.0 45,298.8 47,467.9 15,467.5 48% 0.11%
EU19 19,690.8 20,417.1 23,055.4 24,356.6 26,031.9 27,015.4 26,927.7 26,996.1 24,866.0 26,404.7 6,713.9 34% 0.16%
G7 21,607.2 21,468.3 25,106.1 25,118.9 29,077.8 30,289.8 32,122.1 31,986.9 32,986.6 34,753.6 13,146.4 61% 0.10%
AFRICA ODA (EXCLUDING BILATERAL DEBT RELIEF) (USD MILLIONS, 2013 PRICES)

133133
2004 2005 2006 2007 2008 2009 2010 2011 2012 2013
Australia 0.02% 0.02% 0.03% 0.02% 0.02% 0.02% 0.04% 0.04% 0.05% 0.05%
Austria 0.07% 0.07% 0.09% 0.08% 0.08% 0.11% 0.10% 0.09% 0.09% 0.09%
Belgium 0.17% 0.19% 0.20% 0.18% 0.22% 0.24% 0.23% 0.22% 0.18% 0.25%
Canada 0.08% 0.12% 0.12% 0.11% 0.14% 0.13% 0.14% 0.13% 0.14% 0.13%
Czech Republic 0.02% 0.03% 0.03% 0.03% 0.03% 0.03% 0.04% 0.04% 0.04% 0.04%
Denmark 0.35% 0.34% 0.36% 0.37% 0.36% 0.39% 0.38% 0.38% 0.36% 0.31%
Finland 0.14% 0.15% 0.17% 0.17% 0.18% 0.23% 0.22% 0.21% 0.23% 0.22%
France 0.17% 0.16% 0.19% 0.18% 0.17% 0.21% 0.20% 0.19% 0.17% 0.18%
Germany 0.10% 0.09% 0.10% 0.11% 0.12% 0.13% 0.12% 0.13% 0.12% 0.11%
Greece 0.04% 0.04% 0.05% 0.05% 0.06% 0.05% 0.05% 0.04% 0.04% 0.04%
Iceland 0.06% 0.06% 0.11% 0.09% 0.20% 0.15% 0.14% 0.10% 0.10% 0.12%
Ireland 0.24% 0.24% 0.31% 0.30% 0.35% 0.32% 0.31% 0.29% 0.27% 0.25%
Italy 0.06% 0.09% 0.05% 0.07% 0.08% 0.06% 0.06% 0.06% 0.05% 0.06%
Japan 0.04% 0.03% 0.06% 0.03% 0.05% 0.05% 0.06% 0.05% 0.05% 0.07%
Korea 0.01% 0.02% 0.01% 0.02% 0.02% 0.02% 0.02% 0.03% 0.04% 0.04%
Luxembourg 0.35% 0.35% 0.43% 0.43% 0.44% 0.47% 0.48% 0.42% 0.40% 0.36%
Netherlands 0.32% 0.30% 0.24% 0.26% 0.26% 0.23% 0.19% 0.21% 0.18% 0.20%
New Zealand 0.03% 0.03% 0.03% 0.02% 0.03% 0.03% 0.02% 0.03% 0.02% 0.04%
Norway 0.37% 0.36% 0.35% 0.33% 0.33% 0.34% 0.34% 0.32% 0.29% 0.32%
Poland 0.02% 0.02% 0.05% 0.03% 0.03% 0.03% 0.03% 0.02% 0.03% 0.04%
Portugal 0.10% 0.11% 0.11% 0.11% 0.16% 0.13% 0.18% 0.21% 0.20% 0.15%
Slovak Republic 0.02% – 0.05% 0.05% 0.05% 0.03% 0.03% 0.03% 0.03% 0.03%
Slovenia – 0.00% 0.00% 0.00% 0.03% 0.04% 0.03% 0.03% 0.04% 0.04%
Spain 0.08% 0.07% 0.09% 0.11% 0.14% 0.17% 0.13% 0.10% 0.05% 0.05%
Sweden 0.27% 0.35% 0.35% 0.35% 0.37% 0.39% 0.33% 0.38% 0.37% 0.35%
Switzerland 0.10% 0.10% 0.11% 0.10% 0.10% 0.11% 0.10% 0.12% 0.12% 0.12%
United Kingdom 0.13% 0.12% 0.17% 0.16% 0.17% 0.20% 0.24% 0.23% 0.23% 0.28%
United States 0.05% 0.04% 0.04% 0.05% 0.06% 0.07% 0.07% 0.07% 0.07% 0.07%
DAC 0.08% 0.08% 0.09% 0.09% 0.10% 0.11% 0.11% 0.11% 0.10% 0.11%
EU19 0.13% 0.13% 0.14% 0.15% 0.15% 0.17% 0.16% 0.16% 0.15% 0.16%
G7 0.07% 0.07% 0.08% 0.08% 0.09% 0.10% 0.10% 0.10% 0.10% 0.10%
AFRICA ODA/GNI % (EXCLUDING BILATERAL DEBT RELIEF)
REFERENCE TABLES

134 THE 2014 DATA REPORT134 THE 2014 DATA REPORT
2004 2005 2006 2007 2008 2009 2010 2011 2012 2013Volume change
2004 – 13Percentage change
2004 – 13ODA/GNI %
2013
Australia 186.9 212.2 329.9 257.0 219.9 298.7 415.8 477.5 664.8 630.9 444.1 238% 0.04%
Austria 224.5 239.6 305.0 288.6 296.5 365.4 367.6 306.7 320.5 312.1 87.6 39% 0.08%
Belgium 676.7 768.7 850.9 803.4 1,031.0 1,061.8 1,078.2 1,024.4 837.5 1,183.0 506.3 75% 0.23%
Canada 1,102.8 1,282.9 1,505.5 1,338.1 2,087.9 1,674.5 2,076.9 1,932.3 2,301.0 2,110.0 1,007.3 91% 0.12%
Czech Republic 27.0 39.6 43.5 45.3 52.5 48.6 57.5 53.1 56.1 58.1 31.1 115% 0.03%
Denmark 1,024.0 1,071.0 1,138.1 1,199.4 1,149.5 1,203.0 1,153.1 1,117.7 1,099.9 1,019.6 -4.4 0% 0.30%
Finland 280.2 316.5 385.5 401.5 421.5 482.3 530.3 478.2 496.2 489.1 208.8 75% 0.19%
France 3,259.4 3,163.4 3,829.1 4,060.8 3,920.1 4,648.6 4,607.4 4,008.3 3,406.3 3,972.1 712.8 22% 0.14%
Germany 2,874.5 2,300.5 3,007.4 3,205.9 3,605.9 3,554.5 3,687.8 3,727.5 3,630.7 2,999.9 125.3 4% 0.08%
Greece 79.0 87.0 125.3 109.6 149.1 125.0 120.7 73.9 66.0 64.3 -14.7 -19% 0.03%
Iceland 7.1 8.0 14.9 12.3 18.5 18.0 15.0 12.1 12.7 16.1 9.0 127% 0.12%
Ireland 387.2 410.0 568.0 581.7 659.4 548.4 518.6 474.8 459.8 437.2 50.0 13% 0.24%
Italy 916.8 1,765.7 862.2 1,399.4 1,524.6 1,139.2 1,132.0 1,035.1 813.1 1,008.4 91.6 10% 0.05%
Japan 1,506.3 1,610.6 3,110.8 1,590.3 2,366.6 2,174.8 2,722.1 2,356.6 2,649.0 3,312.6 1,806.3 120% 0.07%
Korea 70.6 124.6 63.7 123.8 161.7 184.1 237.7 272.4 400.7 457.4 386.8 548% 0.03%
Luxembourg 144.9 153.2 173.9 182.3 189.7 200.4 182.9 164.6 157.7 146.1 1.2 1% 0.34%
Netherlands 2,054.3 2,022.0 1,712.5 1,932.2 2,050.7 1,697.9 1,468.1 1,610.3 1,352.0 1,505.3 -549.0 -27% 0.19%
New Zealand 37.0 40.0 36.3 35.9 40.4 42.6 34.4 40.0 25.5 59.4 22.4 61% 0.03%
Norway 1,455.7 1,499.6 1,523.4 1,514.4 1,482.9 1,514.3 1,449.8 1,437.7 1,381.7 1,524.0 68.3 5% 0.29%
Poland 61.7 73.8 185.9 80.6 105.1 122.2 109.0 87.8 91.0 147.2 85.5 139% 0.03%
Portugal 193.6 209.8 230.3 206.4 240.8 231.4 395.5 454.9 349.6 296.6 103.0 53% 0.14%
Slovak Republic 11.5 42.2 37.5 37.3 44.3 20.7 23.0 19.3 21.3 24.2 12.7 110% 0.03%
Slovenia 0.0 0.0 0.0 0.0 13.9 16.3 14.5 12.6 13.6 14.1 14.1 – 0.03%
Spain 682.6 738.9 942.7 1,185.7 1,498.1 1,649.4 1,383.8 954.1 476.6 570.3 -112.2 -16% 0.04%
Sweden 1,097.6 1,534.0 1,563.5 1,686.7 1,782.4 1,758.0 1,613.0 1,922.5 1,765.4 1,859.5 761.9 69% 0.32%
Switzerland 567.5 577.3 668.0 579.0 552.4 606.0 644.7 661.9 710.7 774.8 207.3 37% 0.11%
United Kingdom 2,668.3 2,753.1 3,970.6 3,691.3 4,040.4 4,407.5 5,393.0 5,241.3 5,042.4 6,542.0 3,873.7 145% 0.26%
United States 5,836.6 5,706.7 6,018.2 6,448.9 8,363.0 9,424.3 9,848.9 9,991.5 11,348.3 11,189.2 5,352.7 92% 0.07%
EU institutions 3,924.0 4,220.8 4,263.2 4,447.6 4,877.2 4,830.8 4,967.8 4,502.6 5,161.9 4,592.1 668.1 17% n/a
DAC 27,434.1 28,750.7 33,202.5 32,997.7 38,068.7 39,218.1 41,281.3 39,949.1 39,950.0 42,723.4 15,289.3 56% 0.10%
EU19 16,663.7 17,688.7 19,931.9 21,098.1 22,775.5 23,280.7 23,836.0 22,767.3 20,455.8 22,648.9 5,985.2 36% 0.13%
G7 18,164.6 18,582.9 22,303.8 21,734.7 25,908.6 27,023.6 29,468.1 28,292.7 29,190.8 31,134.2 12,969.6 71% 0.09%
SUB-SAHARAN AFRICA ODA (EXCLUDING BILATERAL DEBT RELIEF) (USD MILLIONS, 2013 PRICES)

135135REFERENCE TABLES
2004 2005 2006 2007 2008 2009 2010 2011 2012 2013
Australia 0.02% 0.02% 0.03% 0.02% 0.02% 0.02% 0.03% 0.04% 0.05% 0.04%
Austria 0.06% 0.06% 0.08% 0.07% 0.07% 0.09% 0.09% 0.07% 0.08% 0.08%
Belgium 0.15% 0.17% 0.18% 0.16% 0.21% 0.22% 0.22% 0.20% 0.16% 0.23%
Canada 0.07% 0.08% 0.10% 0.08% 0.13% 0.11% 0.13% 0.11% 0.13% 0.12%
Czech Republic 0.02% 0.03% 0.03% 0.03% 0.03% 0.03% 0.03% 0.03% 0.03% 0.03%
Denmark 0.32% 0.32% 0.33% 0.34% 0.33% 0.36% 0.35% 0.33% 0.32% 0.30%
Finland 0.12% 0.13% 0.15% 0.15% 0.16% 0.20% 0.20% 0.18% 0.19% 0.19%
France 0.13% 0.12% 0.14% 0.15% 0.14% 0.17% 0.17% 0.14% 0.12% 0.14%
Germany 0.09% 0.07% 0.09% 0.09% 0.10% 0.10% 0.10% 0.10% 0.10% 0.08%
Greece 0.03% 0.03% 0.04% 0.03% 0.05% 0.04% 0.04% 0.03% 0.03% 0.03%
Iceland 0.06% 0.06% 0.11% 0.09% 0.19% 0.15% 0.14% 0.10% 0.10% 0.12%
Ireland 0.23% 0.23% 0.30% 0.30% 0.33% 0.31% 0.30% 0.28% 0.26% 0.24%
Italy 0.04% 0.08% 0.04% 0.06% 0.07% 0.05% 0.05% 0.05% 0.04% 0.05%
Japan 0.03% 0.03% 0.06% 0.03% 0.05% 0.05% 0.06% 0.05% 0.05% 0.07%
Korea 0.01% 0.01% 0.01% 0.01% 0.02% 0.02% 0.02% 0.02% 0.03% 0.03%
Luxembourg 0.33% 0.33% 0.40% 0.38% 0.40% 0.45% 0.43% 0.39% 0.37% 0.34%
Netherlands 0.29% 0.27% 0.22% 0.24% 0.24% 0.22% 0.18% 0.19% 0.17% 0.19%
New Zealand 0.03% 0.03% 0.03% 0.02% 0.03% 0.03% 0.02% 0.02% 0.02% 0.03%
Norway 0.33% 0.33% 0.33% 0.31% 0.30% 0.31% 0.30% 0.29% 0.27% 0.29%
Poland 0.02% 0.02% 0.05% 0.02% 0.02% 0.03% 0.02% 0.02% 0.02% 0.03%
Portugal 0.10% 0.10% 0.11% 0.10% 0.11% 0.11% 0.18% 0.21% 0.16% 0.14%
Slovak Republic 0.02% – 0.05% 0.04% 0.05% 0.02% 0.03% 0.02% 0.02% 0.03%
Slovenia – 0.00% 0.00% 0.00% 0.03% 0.04% 0.03% 0.03% 0.03% 0.03%
Spain 0.05% 0.06% 0.07% 0.08% 0.10% 0.12% 0.10% 0.07% 0.04% 0.04%
Sweden 0.24% 0.33% 0.32% 0.32% 0.34% 0.36% 0.30% 0.35% 0.31% 0.32%
Switzerland 0.10% 0.09% 0.11% 0.10% 0.10% 0.10% 0.10% 0.10% 0.11% 0.11%
United Kingdom 0.12% 0.12% 0.16% 0.15% 0.16% 0.18% 0.22% 0.21% 0.20% 0.26%
United States 0.04% 0.04% 0.04% 0.04% 0.05% 0.06% 0.06% 0.06% 0.07% 0.07%
DAC 0.07% 0.07% 0.08% 0.08% 0.09% 0.10% 0.10% 0.09% 0.09% 0.10%
EU19 0.11% 0.11% 0.12% 0.13% 0.13% 0.14% 0.14% 0.14% 0.12% 0.13%
G7 0.06% 0.06% 0.07% 0.07% 0.08% 0.08% 0.09% 0.08% 0.08% 0.09%
SUB-SAHARAN AFRICA ODA/GNI % (EXCLUDING BILATERAL DEBT RELIEF)

136 THE 2014 DATA REPORT
EXECUTIVE SUMMARY
1 United Nations, ‘Millennium Development Goals’, www.un.org/millenniumgoals/
2 World Bank, ‘Poverty & Equity Data’, http://povertydata.worldbank.org/poverty/home/
3 UNGA Resolution (20 December 2013) ‘Follow-up to the International Con ference on Financing for Development (68/204)’, www.un.org/ga/search/view_doc.asp?symbol=A/RES/68/204&Lang=E
4 World Bank, ‘Poverty & Equity Data’, op. cit.; Development Initiatives (2013) ‘Where are the poor and where will they be?’, http://devinit.org/data-visualization/ datavisualization-poverty-map/; P. Edward and A. Sumner (2013) ‘The Future of Poverty in a Multi-Speed World’.
5 UN (2014) ‘List of Least Developed Countries’, www.un.org/en/development/desa/policy/cdp/ldc/ldc_list.pdf; IMF (April 2014) World Economic Outlook.
6 OECD DAC (22 October 2013) ‘“The Where” of Development Finance: Towards Better Targetting of Concessional Finance (DCD/DAC(2013)29)’,
www.oecd.org/dac/externalfinancing-fordevelopment/documentupload/ERG%20S2%20Jan%202014%20-%20The%20Where%20of%20Develop-ment%20Finance%20-%20To-wards%20Better%20Targetting%20DCD-DAC-2013-29-ENG.pdf; OECD DAC (29 April 2014) ‘Targeting ODA Towards Countries in Greatest Need (DCD/DAC(2014)20)’, www.oecd.org/dac/externalfinancing-fordevelopment/documentupload/DAC(2014)20.pdf
7 OECD DAC (22 October 2013) ‘“The Where” of Development Finance’, op. cit.
8 The ‘discount rate’, or ‘reference rate’, is the interest rate used to bring future values back to the present when considering the value of money over time. The discount rate is supposed to approximate the ‘cost’ to the donor of lending the money, based on the expected return the donor might have made if they had kept the money and invested it instead. For further details, see Section 2.
9 One option is the International Monetary Fund and World Bank’s 5% benchmark for external debt analysis in low-income countries (LICs). Another option is to use the Differentiated Discount Rates (DDRs), which better reflects changing market realities as it is currency-specific and subject to annual change. The DDRs are already used as the reference rates to estimate the concessionality level of loans under the OECD Arrangement on Officially Supported Export Credits. For further details, see Section 2.
INTRODUCTION
1 United Nations, ‘Millennium Development Goals’, www.un.org/millenniumgoals/
2 International Conference on Financing for Development (2002) ‘Monterrey Consensus’, www.un.org/esa/ffd/monterrey/MonterreyConsensus.pdf
3 World Bank, World Development Indicators.
4 World Bank, ‘Poverty & Equity Data’, http://povertydata.worldbank.org/poverty/home/
5 Development Initiatives (2013) ‘Where are the poor and where will they be?’, http://devinit.org/data-visualization/ datavisualization-poverty-map/; P. Edward and A. Sumner (2013) ‘The Future of Poverty in a Multi-Speed World’.
6 H. Arakawa et al., World Economic Forum Global Agenda Council on Post-2015 Sustainable Development (2014) ‘Paying for Zero: Global Development Finance and the Post- 2015 Agenda’, www3.weforum.org/docs/GAC/2014/WEF_GAC_PovertySustainableDevel-opment_GlobalDevelopmentFinance_Paper_2014.pdf
7 Ibid.
SECTION 1: TRENDS IN DEVELOPMENT ASSISTANCE
1 ONE (2011) ‘DATA Report’, http://s3.amazonaws.com/one.org/pdfs/dr2011.pdf In the DATA Report, using preliminary 2010 figures from the DAC, ONE estimated that the G8 met 61% of their pledges to Africa. In the final DAC figures released in December 2011, we found the actual progress to be 60%.
2 ‘EU15’ refers to the 15 EU member states that joined the Union before 2004. They are all members of the DAC: Austria, Belgium, Denmark, Finland, France, Germany, Greece, Ireland, Italy, Luxembourg, Netherlands, Portugal, Spain, Sweden and the UK.
3 I. de Lichtervelde, ONE (January 2014) ‘Development Aid Declines, Putting Progress on Poverty at Risk’, www.one.org/international/blog/development-aid-declines-putting- progress-on-poverty-at-risk/
4 If debt relief is included, the Netherlands officially met 0.7% in 2012, but fell slightly short (0.69%) if excluding debt relief, as ONE usually does when tracking ODA.
5 Includes debt relief, based on member state reported estimates, or where lacking, EU Council estimates. Council of the European Union (19 May 2014) ‘Council Conclusions on Annual Report 2014 to the European Council on EU Development Aid Targets’.
6 OECD (April 2014) ‘Aid to developing countries rebounds in 2013 to reach an all-time high’, www.oecd.org/newsroom/aid-to-devel-oping-countries-rebounds-in-2013-to-reach-an-all-time-high.htm
SECTION 2: REFORMING ODA: THE COMPOSITION AND TARGETING OF AID
1 OECD DAC (November 2008) ‘Is it ODA? Factsheet’, www.oecd.org/dac/stats/34086975.pdf
2 Development Initiatives (22 September 2013) ‘Investments to End Poverty’, http://devinit.org/report/investments- to-end-poverty/
3 OECD DAC (22 October 2013) ‘“The Where” of Development Finance: Towards Better Targeting of Concessional Finance (DCD/DAC(2013)29)’, www.oecd.org/dac/externalfinancing-fordevelopment/documentupload/ERG%20S2%20Jan%202014%20-%20The%20Where%20of%20Develop-ment%20Finance%20-%20To-wards%20Better%20Targetting%20DCD-DAC-2013-29-ENG.pdf
4 W. Hynes and S. Scott (October 2013) ‘The Evolution of Official Development Assistance: Achievements, Criticisms and a Way Forward, IIIS Discussion Paper No. 437’, www.oecd.org/dac/externalfinancing-fordevelopment/documentupload/Scott%20Hynes%20ODA%20paper%20Nov%202013.pdf
ENDNOTES

137
5 Currently data on refugee costs is not necessarily comparable between donors, as reporting practices vary in terms of categories of refugees included, types of expenditures covered and the methodology used to assess costs. To improve the transparency of reporting of in-donor refugee costs, the DAC Secretariat has conducted several surveys to seek clarification on the methodologies and calculations used in the reporting of such costs by DAC members. The latest survey was completed in 2012, and its findings relate to 2009 expenditures. OECD DAC Working Party on Statistics (26 July 2006) ‘Letter from Chair of the Working Party on Statistics to Chair of the DAC: Statistical Reporting Issues (DCD/DAC/STAT(2006)22)’, http://search.oecd.org/officialdocu-ments/displaydocumentpdf/?cote= DCD/DAC/STAT(2006)22&docLan-guage=En; OECD DAC, ‘ODA Reporting of in-donor country refugee costs. Members’ methodologies for calculating costs’, www.oecd.org/dac/stats/Refugee-CostsMethodologicalNote.pdf
6 OECD DAC (November 2008) ‘Is it ODA?’, op. cit.
7 OECD DAC (7 February 2013) ‘Loan Concessionality in DAC Statistics (DCD/DAC(2013)2)’, http://search.oecd.org/officialdocu-ments/publicdisplaydocumentpd-f/?cote=DCD/DAC(2013)2&docLan-guage=En; R. Tew, Development Initiatives (April 2013) ‘ODA Loans – Investments to End Poverty Discussion Paper’,
www.devinit.org/archivedsite/wp-con-tent/uploads/ODA-loans-discus-sion-paper-v1.0-22.pdf; S. Colin, Eurodad (November 2013) ‘A matter of high interest: Assessing how loans are reported as development aid’, www.eurodad.org/files/pdf/52dfd-0d16a841.pdf
8 UNGA Resolution (20 December 2013) ‘Follow-up to the International Conference on Financing for Development (68/204)’, www.un.org/ga/search/view_doc.asp?symbol=A/RES/68/204&Lang=E
9 The Monterrey Consensus states that donors should make sure that ‘resources provided for debt relief do not detract from ODA resources intended to be available for developing countries’. Monterrey Consensus on Financing for Development (March 2002), para. 51. The Monterrey Consensus is the outcome document of the UN International Conference on Financing for Development in Monterrey, Mexico in March 2002: www.un.org/esa/ffd/monterrey/MonterreyConsensus.pdf
10 The OECD DAC published in June 2014 two papers that started to explore options for measuring total official support for development (TOSD): OECD DAC (June 2014) ‘Scoping the New Measure of Total Official Support For Development (TOSD), (DCD/DAC(2014)35)’, www.oecd.org/officialdocuments/publicdisplaydocumentpdf/?cote=D-CD/DAC(2014)35&docLanguage=En
and OECD DAC (June 2014) ‘Addressing the Boundary between ODA and Total Official Support For Development (TOSD) in the Field of Peace, Security and Justice (DCD/DAC(2014)34)’, www.oecd.org/officialdocuments/publicdisplaydocumentpdf/?cote=D-CD/DAC(2014)34&docLanguage=En
11 At its High-Level Meeting in London on 4–5 December 2012, the OECD DAC agreed that it would (by December 2014): (1) elaborate a proposal for a new measure of total official support for development (TOSD); (2) explore ways of representing both donor effort and recipient benefit; (3) investigate whether any resulting new measures of external development finance suggested the need to modernise the concept of ODA. In regard to loan concessionality rules, DAC members also agreed to establish, at the latest by 2015, a clear, quantitative definition of ‘concessional in character’, in line with prevailing financial market conditions. The DAC constituted an Expert Reference Group comprising 13 independent experts to provide advice in implementing the HLM mandate. At the last Senior Level Meeting (SLM) on 3–4 March 2014, DAC members assessed progress in implementing the DAC mandate (mostly consideration of what might comprise TOSD, options for modernising ODA, new concessionality rules and ODA targeting) and provided political direction for the following months. The DAC Secretariat aims to present proposals for modernising the system for discussion at the next SLM in October 2014 and for approval at the next DAC HLM in December 2014. OECD DAC (December 2012) ‘2012 DAC HLM Communiqué’,
www.oecd.org/dac/HLM%20Commu-nique%202012%20final%20ENGLISH.pdf; OECD DAC (February 2014) ‘Modernising the DAC’s Development Finance Statistics, DAC Senior Level Meeting, 3–4 March 2014’, www.oecd.org/dac/externalfinancing-fordevelopment/documentupload/SLM%20Dev%20Fin%20DAC(2014)9.pdf
12 The OECD DAC Secretariat pulled together a list of ODA reform proposals in October 2013. See: www.oecd.org/dac/externalfinancing-fordevelopment/documentupload/Background%20paper%20No.%202%20List%20of%20ODA%20re-form%20proposals%202013%2009%2027%20FINAL%2003%20OCT.pdf
13 ActionAid (2011), ‘Real Aid: Ending Aid dependency’, www.actionaid.org/sites/files/actionaid/real_aid_3.pdf
14 CONCORD (2013), ‘2013 AidWatch Report: The Unique Role of European Aid, The Fight Against Poverty’, http://www.concordeurope.org/publications/item/275-2013-aidwatch-report
15 Development Initiatives (September 2013), ‘Investments To End Poverty’, op. cit.
16 S. Colin, Eurodad (November 2013) ‘A matter of high interest’, op. cit.
17 D. Roodman (June 2014) ‘Straightening the Measuring Stick: A 14-Point Plan for Reforming the Definition of Official Development Assistance (ODA)’. CGD Policy Paper 44 Washington, DC: Center
for Global Development, http://www.cgdev.org/sites/default/files/straightening-measur-ing-stick-definition-oda_1.pdf
18 ‘Communiqué of the First High-Level Meeting of the Global Partnership for Effective Development Cooperation’ (16 April 2014), Mexico City, http://effectivecooperation.org/2014/ 03/30/draft-communique-for-the-first-high-level-meeting-of-the-global-part-nership/
19 Publish What You Fund, Aid Transparency Index 2013, www.publishwhatyoufund.org/index/ 2013-ati/
20 OECD DAC (22 October 2013) ‘“The Where” of Development Finance’, op, cit.; OECD DAC (29 April 2014) ‘Targeting ODA Towards Countries in Greatest Need (DCD / DAC (2014) 20)’, www.oecd.org/dac/externalfinancing-fordevelopment/documentupload/DAC(2014)20.pdf
21 Preliminary results from the 2014 DAC Survey on Forward Spending Plans.
22 OECD DAC (22 October 2013) ‘“The Where” of Development Finance’, op. cit.
23 OECD DAC, Preliminary Release of ODA figures for 2013.
24 Current DAC rules restrict ODA eligibility to countries below a certain per capita income threshold. The DAC list of aid recipients includes all low-income countries (LICs) and MICs as published by the World Bank, with the exception of G8 members, EU members and
ENDNOTES

138 THE 2014 DATA REPORT
countries with a firm date for entry into the EU. The list also includes all LDCs as defined by the UN. Countries are removed from the list once they have exceeded the ‘high-income’ threshold in three successive years. The list is reviewed every three years, with the next revision due this year.
25 Cotonou Agenda for productive capacity building in LDCs (July 2014), para. 11, xviii, http://unohrlls.org/custom-content/uploads/2014/08/Cotonou-Agenda-310714-9-43-PM-Final.pdf
26 For example, G. C. Acharya (21 July 2014), ‘Half of all ODA should go to the least developed countries’, http://oecdinsights.org/2014/07/21/half-of-all-oda-should-go-to-the-least-developed-countries/
27 OECD DAC (29 April 2014) ‘Targeting ODA Towards Countries in Greatest Need’, op. cit.
28 The UN target for LDCs was first adopted in the Brussels Programme of Action for the LDCs (2001–10) (BPoA) in May 2001. It was renewed at the Fourth United Nations Conference on the Least Developed Countries in Istanbul in May 2011. www.un.org/wcm/webdav/site/ldc/shared/Report%20of%20the%20Istanbul%20Conference.pdf
29 Cotonou Agenda for productive capacity building in LDCs (July 2014), para. 11, xviii, op. cit.
30 The OECD DAC’s press release on preliminary ODA figures for 2013 did not mention donors’ performance against the 0.15–0.20% LDC target.
31 Alex Evans, Senior Fellow at the Center on International Cooperation, recently commented in a blog post on donors’ performance against both these targets. A. Evans, Global Dashboard (9 May 2014) ‘OECD DAC Chair Erik Solheim replies on ODA to least developed countries’, www.globaldashboard.org/2014/05/09/erik-solheim-oda-least-developed-countries/
32 Our assessment of in-donor ODA includes imputed student costs, administrative costs not included elsewhere, development awareness costs and refugee costs in donor countries. Indirect (‘imputed’) costs of tuition in donor countries can be reported as ODA in non-fee-charging educational systems, or where fees do not cover the cost of tuition, and if the presence of students is part of the host country’s development policy. Administrative costs not included elsewhere comprise administrative costs of development assistance programmes not already included under other ODA items as an integral part of the costs of delivering or implementing the aid provided. Refugee costs include official sector expenditures for the sustenance of refugees in donor countries during the first 12 months of their stay. Development awareness includes costs of activities designed to increase public support in the donor country for development cooperation efforts, needs and issues. Our analysis of in-donor ODA does not include scholarship and training costs (financial aid awards for individual students and contributions to trainees from developing countries) because of a lack of comparable historical data in the DAC
database. OECD DAC (11 June 2013) ‘Converged Statistical Reporting Directives for the Creditor Reporting System (CRS) and the Annual DAC Questionnaire, Chapters 1–6, (DCD/DAC(2013)15/FINAL)’, www.oecd.org/dac/stats/documentup-load/DCD-DAC(2013)15-FINAL-ENG.pdf
33 ActionAid (2011) ‘Real Aid: Ending Aid Dependency’, www.actionaid.org/sites/files/action-aid/real_aid_3.pdf
34 In current aid statistics, data on refugee costs is not necessarily comparable between donors, as reporting practices vary in terms of categories of refugees included, types of expenditure covered and methodology used to assess costs. To improve the transparency of in-donor refugee costs reporting, the DAC Secretariat conducted a number of surveys to seek clarifications on the methodologies and calculations used in the reporting of refugee costs by DAC members. The latest survey was completed in 2012; its findings relate to 2009 expenditures. See: www.oecd.org/dac/stats/Refugee-CostsMethodologicalNote.pdf
35 OECD DAC (February 2014) ‘Modernising the DAC’s Development Finance Statistics’, op. cit.
36 Monterrey Consensus on Financing for Development (March 2002) para. 51, op. cit.
37 Of the 39 countries eligible for the HIPC Initiative, 35 are receiving full debt relief after reaching their completion points. One country, Chad, has reached its
decision point and has benefited from interim debt relief. Three countries, Eritrea, Somalia and Sudan, which have been identified as potentially eligible, have not yet reached their decision points.
38 R. Tew, Development Initiatives (April 2013) ‘ODA Loans – Investments to End Poverty Discussion Paper’, op. cit.
39 OECD DAC (1978) ‘Recommendation on Terms and Conditions of Aid’, www.oecd.org/dac/stats/31426776.pdf
40 IMF (18 March 2014) ‘The Joint World Bank–IMF Debt Sustainability Frame-work for Low-Income Countries, Factsheet’, www.imf.org/external/np/exr/facts/ jdsf.htm
41 R. Tew, Development Initiatives (April 2013) ‘ODA Loans – Investments to End Poverty Discussion Paper’, op. cit.
42 According to the Jubilee Debt Campaign, the IMF and World Bank Framework lacks effectiveness because (1) it does not take into account the impact of debt on poverty and inequality; (2) it is biased because the IMF and the World Bank are major lenders and creditors; (3) it does not sufficiently take into account the impact of economic shocks; (4) it pays too little attention to private sector debts; and (5) it does not assess what lending is used for. Jubilee Debt Campaign (July 2013), Submission to IDC inquiry into ‘The future of UK Development Cooperation’, old.jubileedebtcampaign.org.uk/download.php?id=1130
43 LDC Watch, LDC-IV Civil Society Forum Secretariat (May 2011) ‘Towards A World Without LDCs: Global Civil Society Report and Recommendations to the Fourth United Nations Conference on the Least Developed Countries (LDC-IV)’, www.un.org/wcm/webdav/site/ldc/shared/documents/csoglobalreport.pdf
44 OECD DAC (1978) ‘Recommendation on Terms and Conditions of Aid’, op. cit.
45 ONE assesses donors’ performance only against the second element of the DAC 1978 Recommendation on Terms and Conditions of Aid (at least 90% as grant annually for the LDCs as a group) and not against the first part (at least 86% as grant to each LDC over a period of three years). An analysis of the second element is sufficient to provide a very useful picture of donors’ practices. OECD DAC (1978) ‘Recommendation on Terms and Conditions of Aid’, op. cit.
46 OECD DAC Working Party on Statistics (27 March 2014) ‘Explanation of Concepts used in Concessionality and Grant Element Calculations (DCD/DAC/STAT(2012)18/REV1)’ www.oecd.org/officialdocuments/publicdisplaydocumentpdf/?cote=D-CD/DAC/STAT(2012)18/REV1&docLan-guage=En
47 World Bank, ‘Poverty and Equity: Ghana’, http://povertydata.worldbank.org/poverty/country/GHA
48 African Economic Outlook (2014) ‘Ghana’, www.africaneconomicoutlook.org/en/countries/west-africa/ghana/

139
49 World Bank, World Development Indicators.
50 IMF (May 2014) ‘Article IV Consultation: Ghana’, www.imf.org/external/pubs/ft/scr/2014/cr14129.pdf
51 OECD DAC Creditor Reporting System.
52 IMF (December 2013) ‘HIPC and MDRI Statistical Update’, www.imf.org/external/np/pp/eng/2013/121913.pdf
53 Ibid.
54 World Bank, World Development Indicators.
55 World Bank, ‘Poverty and Equity: Tanzania’, http://povertydata.worldbank.org/poverty/country/TZA
56 World Bank, World Development Indicators; IMF World Economic Outlook.
57 OECD DAC Table 2a; IMF World Economic Outlook.
58 IMF (May 2014) ‘Article IV Consultation: Tanzania’, www.imf.org/external/pubs/ft/scr/2014/cr14120.pdf
59 OECD DAC Creditor Reporting System.
60 However, some donors are considering providing more aid in the form of loans. In particular, a debate has recently been taking place in the UK about establishing a UK development bank.
61 S. Colin, Eurodad (November 2013) ‘A matter of high interest’, op. cit.
62 R. Tew, Development Initiatives (April 2013) ‘ODA Loans – Investments to End Poverty Discussion Paper’, op. cit.; D. Roodman (June 2014) ‘Straightening the Measuring Stick: A 14-Point Plan for Reforming the Definition of Official Development Assistance (ODA)’, op. cit.
63 OECD DAC Working Party on Statistics (10 April 2014) ‘Modernising the Reporting on ODA Loans – Risk- Adjusted Grant Equivalents and Other Approaches (DCD/DAC/STAT(2014)1)’, www.oecd.org/dac/externalfinancing-fordevelopment/documentupload/DCD_DAC_STAT_2014_1_ENG.pdf; OECD DAC (27 May 2014) ‘Options on Concessionality, (DCD/DAC(2014)29)’, http://search.oecd.org/officialdocu-ments/publicdisplaydocumentpd-f/?cote=DCD/DAC(2014)29&docLan-guage=En
64 R. Tew, Development Initiatives (April 2013) ‘ODA Loans – Investments to End Poverty Discussion Paper’, op. cit.
65 OECD DAC (December 2012) ‘2012 DAC HLM Communiqué’, op. cit.
66 OECD DAC Working Party on Statistics (23 May 2013) ‘Chronology of DAC Discussions on Concessionality in Character (DCD/DAC/STAT(2013)11)’, http://search.oecd.org/officialdocu-ments/publicdisplaydocumentpd-f/?cote=DCD/DAC/STAT(2013)11&doc Language=En
67 This option is supported by the independent expert David Roodman: D. Roodman (June 2014) ‘Straightening the Measuring Stick’, op. cit.; D. Roodman (6 February 2014) ‘Undue credit: Are France, Germany, and Japan subverting the definition of aid?’, http://davidroodman.com/blog/ 2014/02/06/undue-credit-are-france-germany-and-japan-subverting-the-definition-of-aid-with-pricey-loans/; and (17 February 2014) ‘What’s the best way to count loans as aid?’, http://davidroodman.com/blog/2014/ 02/17/whats-the-best-way-to-count-loans-as-aid/
68 The OECD Arrangement on Officially Supported Export Credits is an agreement that stipulates the most generous financial terms and conditions that OECD DAC members can offer when providing officially supported export credits.
69 The DDRs are calculated by adding fixed margins to the average of the relevant commercial interest reference rates (CIRRs) for the previous six months. CIRRs are the minimum interest rates that may be applied under the OECD Arrangement on Officially Supported Export Credits. OECD DAC Working Party on Statistics (27 March 2014) ‘Explanation of Concepts used in Concessionality and Grant Element’, op. cit.
70 The IMF / World Bank 5% rate was set by reference to a 10-year average of the monthly USD CIRR and includes a term premium, reflecting the generally long terms of developmental loans to LICs.
71 The analysis was conducted in three countries: Ghana, Senegal and Timor- Leste. The OECD found that Ghana and Senegal use the IMF concessionality test (minimum grant element of 35%, using the 5% discount rate) when assessing what concessional loans to accept. Timor-Leste sets the return on its offshore reserves as a ceiling on borrowing rates. The selection of countries analysed was made on the basis of their access to development finance. Preference was given to recipient countries that represent, according to the OECD DAC, “a typical case study”, meaning countries that are neither highly dependent on aid nor under-aided. OECD DAC (June 2014) ‘The New Development Finance Landscape: Developing Countries’ Perspective, Working Draft presented at the OECD workshop on development finance on 25 June 2014’, www.oecd.org/dac/aid-architecture/The%20New%20Development%20Finance%20Landscape_19%20June%202014.pdf
72 The 5% rate will be reviewed as part of the next review of the Debt Sustainability Framework in 2015, and revised again if market conditions fluctuate. OECD DAC (27 May 2014) ‘Options on Concessionality’, op. cit.
73 This was first proposed by William Hynes and Simon Scott at the OECD, in W. Hynes and S. Scott (October 2013) ‘The Evolution of Official Development Assistance: Achievements, Criticisms and a Way Forward’, op. cit.
74 The DAC has been exploring three ways of taking default risk into account in the discount rate:
(1) Deriving risk premiums from the market: available market data published by specialised financial service providers, namely Morningstar, Bloomberg and Capital IQ. However, this option has a big data availability issue for countries with no market access.
(2) Adopting the Export Credit Arrangement’s Minimum Premium Rate (MPR) system, with fixed coefficients by risk category. Although MPRs are readily available, the OECD Export Credit Division sees them as inappropriate for ODA loan reporting:
– The MPRs are politically negotiated rates. – They have no link to the market or any
other empirical basis. – They have remained largely unchanged
since the 1990s.– They are extremely unsuitable for long
tenures and high risks. (3) Agreeing on a scale of risk premiums
for the purpose of DAC reporting. This could be based on a country classification by risk and a determined premium for each category. However, the DAC Secretariat has indicated that the lack of reliable data for risk premiums may require a certain degree of arbitrariness. OECD DAC Working Party on Statistics (23 June 2014) ‘Possible Use of Risk Premiums For Assessing the Concessionality of Loans in DAC Statistics, (DCD/DAC/STAT/RD(2014) 2/RD1)’,
ENDNOTES

140 THE 2014 DATA REPORT
www.oecd.org/officialdocuments/publicdisplaydocumentpdf/?cote= DCD/DAC/STAT/RD(2014)2/RD1& docLanguage=En; OECD DAC Working Party on Statistics (10 April 2014) ‘Modernising the Reporting on ODA Loans – Risk-Adjusted Grant Equivalents and Other Approaches’, op.cit.; OECD DAC (27 May 2014) ‘Options on Concessionality’, op. cit.
75 D. Roodman (June 2014) ‘Straightening the Measuring Stick’, op. cit.; D. Roodman (6 February 2014) ‘Undue credit: Are France, Germany, and Japan subverting the definition of aid?’, op. cit.; and (17 February 2014) ‘What’s the best way to count loans as aid?’, op. cit.
76 The IMF identifies different categories of loan: (1) concessional loans (a grant element of at least 35%), (2) semi- concessional loans (defined as loans with a grant element but below 35%) and (3) commercial loans (loans with no grant element). Lending to LICs at ‘full’ concessional terms – a grant element of at least 35% – is promoted. OECD DAC (27 May 2014) ‘Options on Concessionality’, op. cit.
77 D. Roodman (June 2014) ‘Straightening the Measuring Stick’, op. cit.
78 OECD DAC (27 May 2014) ‘Options on Concessionality’, op. cit.
79 Although a recommended benchmark exists (ODA to LDCs should either be (a) at least 86% to each LDC over a period of three years, or (b) at least 90% annually for the LDCs as a group), donors have never publicly committed in this way.
80 OECD DAC (7 February 2013) ‘Loan Concessionality in DAC Statistics’, op. cit.
SECTION 3: PROFILES OF COUNTRY PROGRESS
AUSTRALIA
1 March 1996 to December 2007.
2 Kevin Rudd was Prime Minister from December 2007 to June 2010. Julia Gillard took over as Prime Minister in a leadership ballot in June 2010. She went on to win the federal elections of August 2010 with a narrow majority. In June 2013 she lost the leadership back to Rudd in another ballot just weeks before the September 2013 federal election, which Labor then lost to the Coalition.
3 Senate Foreign Affairs, Defence and Trade References Committee (2014) ‘Australia’s overseas aid and development assistance program’, www.aph.gov.au/Parliamentary_Business/Committees/Senate/Foreign_Affairs_Defence_and_Trade/Overseas_aid/Report/~/media/Committees/Senate/committee/fadt_ctte/overseas_aid/report/report.pdf
4 Ibid.
5 Prime Minister Tony Abbott (18 September 2013) ‘The Coalition will restore strong, stable and accountable government’, www.pm.gov.au/media/2013-09-18/coalition-will-restore-strong-stable-and-accountable-government
6 For example, see: N. Towell, Sydney Morning Herald (30 October 2013) ‘AusAID staff anxious for future as they await merger details’, www.smh.com.au/national/public-service/ausaid-staff-anxious-for-future-as-they-await-merger-details-20131029-2we9v.html C. Santamaria, Devex (18 September 2013) ‘After CIDA, AusAID: Australia “integrates” aid into foreign affairs’, www.devex.com/news/after-cida-ausaid-australia-integrates-aid-into-foreign-affairs-81826 R. Davies, Development Policy Centre (31 October 2013) ‘Felled before forty: the once and future AusAID’, http://devpolicy.org/felled-before-forty-the-once-and-future-ausaid/
7 These 14 countries are: Indonesia, Papua New Guinea, Afghanistan, Vietnam, the Solomon Islands, the Philippines, Bangladesh, Timor-Leste, Pakistan, Myanmar, Cambodia, Fiji, Vanuatu and Laos. Senate Foreign Affairs, Defence and Trade References Committee (2014) ‘Australia’s overseas aid and development assistance program’, op. cit. Australian Council for International Development (2014) ‘Federal Budget Analysis, 2014–2015’, www.acfid.asn.au/resources-publications/files/acfid-budget-analysis-2014-15
8 DFAT (June 2014) ‘Australian aid: promoting prosperity, increasing stability, reducing poverty’, http://aid.dfat.gov.au/aidpolicy/developmentpolicy/Pages/geographic-focus.aspx In 2014/15, the proportion allocated to the Indo-Pacific region is estimated to be 92%.
9 DFAT (June 2014) ‘The development assistance budget: a summary’.
10 Minister for Foreign Affairs, The Hon Julie Bishop MP (18 June 2014) ‘The new aid paradigm’, www.foreignminister.gov.au/speeches/Pages/2014/jb_sp_140618.aspx; DFAT (June 2014) ‘Australian aid: promoting prosperity, increasing stability, reducing poverty’, op. cit.
11 DFAT (June 2014) ‘Australian aid: promoting prosperity, increasing stability, reducing poverty’, op. cit.
12 Ibid.; Senate Foreign Affairs, Defence and Trade References Committee (2014) ‘Australia’s overseas aid and development assistance program’, op. cit.
13 R. Davies and J. Pryke, Development Policy Centre (February 2013) ‘That $375 million for asylum seekers: where will it go?’, http://devpolicy.org/that-375-million-for-asylum-seekers-where-will-it-go-20130214/
14 C. Santamaria, Devex (2 August 2013) ‘Australia cuts aid budget to pay for asylum seekers’, www.devex.com/news/australia-cuts-aid-budget-to-pay-for-asylum-seekers-81562
15 Publish What You Fund (2013) ‘Aid Transparency Index: Australia’, http://ati.publishwhatyoufund.org/donor/australia/
16 S. Howes and A. Betteridge, Development Policy Centre (7 November 2013) ‘More transparent, open and effective: Julie Bishop on Australian aid’, http://devpolicy.org/bishop-on-australian-aid-20131107/
17 DFAT (June 2014) ‘Australian aid: promoting prosperity, increasing stability, reducing poverty’, op. cit.
18 Open Government Partnership, ‘Australia’, www.opengovpartnership.org/country/australia
19 Tax Justice Network (2013) ‘Financial Secrecy Index: Australia’, www.financialsecrecyindex.com/PDF/Australia.pdf
20 Australian Government (2013) ‘Consideration of possible enhancements to the requirements for customer due diligence’, www.ag.gov.au/Consultations/Documents/Consultation%20on%20possible%20enhancements%20to%20the%20requirements%20for%20customer%20due%20diligence/Consultation%20Paper%20-%20Consideration%20of%20possible%20enhancements%20to%20the%20requirements%20for%20customer%20due%20diligence.PDF
21 Australian Taxation Office (2014) ‘Tax evasion and crime’, www.ato.gov.au/General/Tax-evasion-and-crime/In-detail/Tax-crime/Project-Wickenby/?anchor=Getting_ results#Getting_results

141
22 Tax Justice Network (2013) ‘Financial Secrecy Index: Australia’, op. cit.
23 S. Howes, Development Policy Centre (19 February 2014) ‘Back to Downer Mark I with the aid objective’, http://devpolicy.org/in-brief/back-to-downer-mark-i-with-the-aid-objective-20140219/; Senate Foreign Affairs, Defence and Trade References Committee (2014) ‘Australia’s overseas aid and development assistance program’, op. cit.; DFAT (June 2014) ‘Australian aid: promoting prosperity, increasing stability, reducing poverty’, op. cit.; Department of Foreign Affairs and Trade (2014) ‘Portfolio Additional Estimates Statements 2013–14’, www.dfat.gov.au/dept/budget/2013- 2014_paes/2013-14_DFAT_PAES.pdf; Minister for Foreign Affairs, The Hon Julie Bishop MP (29 April 2014) ‘A new paradigm in development assistance: harnessing the private sector’, www.foreignminister.gov.au/speeches/Pages/2014/jb_mr_140429.aspx?ministerid=4
24 J. Hayward-Jones, Lowy Interpreter (14 May 2014) ‘Budget 2014: the end of an era?’, www.lowyinterpreter.org/post/2014/05/ 14/Budget-2014-The-end-of-an-aid-era.aspx?COLLCC=4229618496&; S. Howes, Development Policy Centre (14 May 2014) ‘Less aid, less transparency: the 2014–15 budget and the 10% cut’, http://devpolicy.org/less-aid-less-transparency-the-2014-15-aid-budget-and-the-10-aid-cut-20140514-2/
25 Australian Government (2014) ‘Budget 2014–15’, www.budget.gov.au/2014-15/index.htm
26 Ibid.; Australian Council for International Development (2014) ‘Federal Budget Analysis, 2014–15’, op. cit.
27 Minister for Foreign Affairs, The Hon Julie Bishop MP (18 January 2014) ‘Five billion dollar aid budget to focus on the region’, www.foreignminister.gov.au/releases/Pages/2014/jb_mr_140118.aspx?ministerid=4
28 Australian Government (2014) ‘Budget 2014–15’, op. cit.. Australian Council for International Development (2014) ‘Federal Budget Analysis’, 2014–15’, op. cit.
29 J. Massola, Canberra Times (15 May 2014) ‘Tony Abbott indicates goal on foreign aid could be pushed back 10 years’, http://m.canberratimes.com.au/federal-politics/political-news/tony-abbott-indicates-goal-on-foreign-aid-could-be-pushed-back-10-years-20140515-zrdl9.html
30 Australian Council for International Development (2014) ‘Federal Budget Analysis, 2014–15’, op. cit.; Senate Foreign Affairs, Defence and Trade References Committee (2014) ‘Australia’s overseas aid and development assistance program’, op. cit.
31 J. Pryke and H. Gillies (30 October 2013) ‘Australian aid transparency – still a long way to go’, http://devpolicy.org/australian-aid-transparency-still-a-long-way-to-go-20131030/; H. Gillies, J. Pryke and S. Howes (7 February 2014) ‘What happened to aid transparency under Labor?’, http://devpolicy.org/what-happened-to-aid-transparency-under-labor-20140207/
32 S. Howes and A. Betteridge, Development Policy Centre (7 November 2013) ‘More transparent, open and effective: Julie Bishop on Australian aid’, op. cit.
CANADA
1 Government of Canada, ‘Budget 2014’, www.budget.gc.ca/2014/home-accueil-eng.html
2 Foreign Affairs, Trade and Development Canada (2013) ‘Statistical Report on International Assistance 2011–2012, Table D1’, www.acdi-cida.gc.ca/acdi-cida/ACDI- CIDA.nsf/eng/NAD-320101933-JTA
3 Foreign Affairs, Trade and Development Canada (2014) ‘Aid Effectiveness Agenda’, www.acdi-cida.gc.ca/acdi-cida/ACDI- CIDA.nsf/eng/FRA-825105226-KFT
4 Foreign Affairs, Trade and Development Canada (2014) ‘Where we work in International Development’, www.acdi-cida.gc.ca/wherewework
5 Government of Canada (27 June 2014) ‘Canada Enhances Focus in Global Fight Against Poverty’, www.international.gc.ca/media/dev/news-communiques/2014/06/27a.aspx
6 Government of Canada (27 June 2014) ‘Canada Updates List of Development Countries of Focus’, www.international.gc.ca/media/dev/news-communiques/2014/06/27abg.aspx?lang=eng
7 Foreign Affairs, Trade and Development Canada (2014) ‘Thematic Piorities’, www.international.gc.ca/development- developpement/priorities-priorites/index.aspx
8 Prime Minister of Canada (2014) ‘Canada’s Forward Strategy Saving Every Woman, Every Child: Within Arm’s Reach’, http://pm.gc.ca/eng/news/2014/05/29/canadas-forward-strategy-saving- every-woman-every-child-within-arms-reach
9 Foreign Affairs, Trade and Development Canada (8 June 2013) ‘Canada continues leadership in nutrition and food security efforts’, www.acdi-cida.gc.ca/acdi-cida/acdi- cida.nsf/eng/FRA-67222524-4UY
10 Government of Canada, ‘Canada’s Economic Action Plan: Department of Foreign Affairs, Trade and Development’, www.actionplan.gc.ca/en/initiative/department-foreign-affairs-trade- and-development
11 CBC News (28 March 2013) ‘Should international aid serve Canada’s commercial interests?’, www.cbc.ca/news/canada/should-international-aid-serve-canada-s-commercial-interests-1.1354022
12 The budget identifier will provide two new elements to IATI: the economic classification, which distinguishes between capital and recurrent expenditure, and the common code, which matches donors’ sector codes with the sector codes used by most partner countries in their budgets. For more details, see: Publish What You Fund (10 February 2014) ‘The Budget Identifier’,
www.publishwhatyoufund.org/resour ces/summary-budget-identifier-work/
13 Publish What You Fund (2013) ‘Aid Transparency Index: Canada’, http://ati.publishwhatyoufund.org/donor/canada/
14 Open Government Partnership, ‘Canada’, www.opengovpartnership.org/country/canada
15 Tax Justice Network (2013) ‘Financial Secrecy Index: Canada’, www.financialsecrecyindex.com/PDF/Canada.pdf
16 Davis LLP (2014) ‘Canadian Government Announces Framework and Deadline for Mandatory Payment Reporting by Mining and Oil and Gas Companies’, www.davis.ca/en/publication/canada- announces-framework-for-mandatory-payment-reporting-by-mining-and-oil-gas-companies/
ENDNOTES
http://devpolicy.org/less-aid-less-transparency-the-2014-15-aid-budget-and-the-10-aid-cut-20140514-2
http://devpolicy.org/less-aid-less-transparency-the-2014-15-aid-budget-and-the-10-aid-cut-20140514-2
http://devpolicy.org/less-aid-less-transparency-the-2014-15-aid-budget-and-the-10-aid-cut-20140514-2
http://www.cbc.ca/news/canada/should-international-aid-serve-canada-s-commercial-interests-1.1354022
http://www.cbc.ca/news/canada/should-international-aid-serve-canada-s-commercial-interests-1.1354022

142 THE 2014 DATA REPORT
17 Prime Minister of Canada (2013) ‘Canada’s G-8 Action Plan On Transparency Of Corporations and Trusts’, http://pm.gc.ca/eng/news/2013/06/1 8/canadas-g-8-action-plan-transparency-corporations-and-trusts
18 Norton Rose Fulbright (2013) ‘Federal government launches consultation on Canada Business Corporations Act’, www.nortonrosefulbright.com/knowledge/publications/110427/federal-government-launches-consultation-on-canada-business-corporations-act
19 Prime Minister of Canada (2013) ‘Canada’s G-8 Action Plan On Transparency Of Corporations and Trusts’, op. cit.
EUROPEAN UNION
1 Debt relief is excluded only where data allows, i.e. for the EU19.
2 In past years, ONE’s DATA Report has tracked ODA from the EU15, which were the only EU member states that were also members of the DAC. However, in 2013 four other EU member states joined the DAC, thus providing more data on their flows to Africa and sub-Saharan Africa, and enabling ONE to track progress by this ‘EU19’ group for the first time.
3 ONE’s analysis of ODA excludes debt relief. For more details, see the Methodology section. It should be noted that this proportion (54%) was
calculated on the basis of total DAC ODA plus aid from the nine non-DAC EU member states and ODA loans from the EIB that are not imputed back to member states, totalling $135.5 billion altogether. This total differs slightly from total ODA analysed elsewhere in this report ($131.2 billion), which accounts for DAC donors only.
4 The only other country in the world to meet the 0.7% ODA/GNI target is Norway.
5 Denmark did not specify any particular deadline for reaching 1.0%.
6 Using a ‘smoothed’ baseline whereby the average is taken for multilateral contributions over 2004 and 2005, so as not to provide an unusually high or low baseline, as multilateral contributions fluctuate significantly year on year.
7 Organisation for Economic Co-operation and Development (2014) ‘Aid to developing countries rebounds in 2013 to reach an all-time high’, www.oecd.org/development/aid-to-developing-countries-rebounds-in-2013-to-reach-an-all-time-high.htm
8 Council of the European Union (2013) ‘Council adopts the multiannual financial framework 2014 – 2020’, www.consilium.europa.eu/uedocs/cms_data/docs/pressdata/en/ecofin/139831.pdf
9 European Commission (2013) ‘MFF State of Play. Presentation at the Policy Forum for Development’, https://webgate.ec.europa.eu/fpfis/mwikis/aidco/images/9/9f/%287%29_Session_1_MFF_LB_1806.pdf
10 Council of the European Union (2012) ‘Increasing the Impact of EU Development Policy: an Agenda for Change – Council Conclusions’, http://register.consilium.europa.eu/doc/srv?l=EN&f=ST%209369%202012%20INIT
11 The Commission had originally proposed to end bilateral cooperation in 19 Development Cooperation Instrument (DCI) countries. However, the final DCI regulation adopted in 2014 specifies that three countries (Colombia, Ecuador and Peru) that were on the original list will remain eligible for bilateral ODA.
12 Council of the European Union (2011) ‘Council Conclusions on Guidelines for the participation of the European Union in the Fourth UN Conference on the Least Developed Countries (LDC-IV, Istanbul, 9 – 13 May 2011)’, http://eu-un.europa.eu/articles/en/article_10886_en.htm
13 Publish What You Fund (2013) ‘Aid Transparency Index: European Commission’ http://ati.publishwhat youfund.org/major-donor/european-commission/
14 ONE (20 February 2014) ‘European Parliament hunts down phantom firms’, www.one.org/international/blog/european-parliament-hunts-down- phantom-firms/. The revision of the Anti-Money Laundering Directive was ongoing at the time this report went to print, see: European Parliament (11 March 2014) ‘Parliament toughens up anti-money laundering rules’,
www.europarl.europa.eu/news/en/news-room/content/20140307IPR 38110/html/Parliament-toughens- up-anti-money-laundering-rules. The extractives reporting measures were adopted under the Accounting Directive: ‘Directive 2013/34/EU of the European Parliament and of the Council of 26 June 2013 on the annual financial statements, consolidated financial statements and related reports of certain types of undertakings’ and the Transparency Directive: ‘Directive 2013/50/EU of the European Parliament and of the Council of 22 October 2013 amending Directive 2004/109/EC of the European Parliament and of the Council on the harmonisation of transparency requirements in relation to information about issuers whose securities are admitted to trading on a regulated market’.
15 Council of the European Union (2014) ‘Council conclusions on Annual Report 2014 to the European Council on EU Development Aid Targets’, www.consilium.europa.eu/uedocs/cms_data/docs/pressdata/EN/foraff/142676.pdf
16 Ibid.
FRANCE
1 It should also be noted that this drop was in spite of the government’s allocation, for the first time, of a portion of a financial transaction tax (€60 million) as additional development assistance.
2 With a decrease of nearly €105 million in 2008, which was largely compensated for in 2009.
3 Of €453.5 million, which equates to a 15% decrease.
4 ONE’s calculations are based on the preliminary figures published by the OECD in April 2014, which are subject to change in the final figures to be released in December 2014. ONE estimates imputed multilateral flows to Africa and sub-Saharan Africa. It should be noted that France’s preliminary figures on aid to the region do not include imputed student costs, scholarships or in-donor refugee costs; the geographical breakdown of these categories of aid is only available in the final figures. Thus, regional ODA in 2012 and previous years includes these categories, but the 2013 estimated figures do not.
5 Project-specific grants (dons projets) have decreased by 20.8% since 2008, according to government budget documents. Such grants, which reach the poorest countries, include project-specific subsidies with the French Development Agency (AFD), the Priority Solidarity Fund (FSP), NGOs and technical support. They do not include the Fund for Research and Aid to the Private Sector (FASEP) nor the Programme of Commercial Capacity Building (PRCC), global budgetary aid, the French Fund for Global Environment (FFEM) or the Social Development Fund (FSD). This figure is based on information in the ‘Inter-departmental Policy Document’ (Document de politique transversale 2014, Politique française en faveur du développement), of November 2013.

143
6 France’s priority poor countries are Benin, Burkina Faso, Burundi, Comoros, Djibouti, Ghana, Guinea, Madagascar, Mali, Mauritania, Niger, Central African Republic, Democratic Republic of the Congo, Senegal, Chad and Togo. Until 2013, this list also included Rwanda, but this country was removed in 2014. See AFD annual report.
7 The definition of bilateral grants (subventions) given in France’s ‘Inter-Departmental Policy Document’ is broader than the definition of project-specific grants that ONE uses in the rest of this report. Bilateral grants include bilateral project grants from the AFD, the FSP and the FSD, technical assistance (including FASEP and PRCC), global budgetary aid and the FFEM.
8 Bilateral grants decreased by 17.4% between 2008 and 2014, according to government budget documents.
9 France’s first ever law on international development and solidarity was adopted in June 2014. The four priority sectors are: 1) promotion of peace, stability, human rights and gender equality; 2) equity, social justice and human development; 3) sustainable economic development, generating jobs; and 4) protection of the environment and of global public goods. In addition to these four sectors, the law stipulates two cross-cutting priorities: 1) the promotion of women’s empowerment and a systematic gender approach for all development activities; and 2) the fight against climate change.
10 Donor countries initially pledged to allocate 0.15% of their ODA/GNI to LDCs. The countries that fulfilled this objective further pledged to reach 0.20%. Those that have reached 0.20% have now committed to maintaining their ODA/GNI contribution to LDCs or to increasing it. France’s short-term goal is to reach 0.15% ODA/GNI but it has committed to the full objective, meaning that as soon as it has fulfilled the 0.15% target, it should strive for 0.20% ODA/GNI.
11 A minimum grant element of 25% is required for a loan to count as ODA. OECD, ‘Statistics on resource flows to developing countries, Table 20’, www.oecd.org/dac/stats/statisticson resourceflowstodevelopingcountries.htm
12 OECD DAC (7 February 2013) ‘Loan Concessionality in DAC Statistics, (DCD/DAC(2013)2)’, www.oecd.org/officialdocuments/publicdisplaydocumentpdf/?cote=D-CD/DAC(2013)2&docLanguage=En
13 ONE’s estimates. When applying the IMF/World Bank fixed 5% rate, the number of French loans counting as ODA in 2012 is 28. When using the Differentiated Discount Rates (which are currency-, time- and loan-specific) the number is 27. See Section 2.
14 This is an undertaking which dates from the presidential campaign of François Hollande, and one of the three key proposals of ONE’s campaign ‘ONE VOTE 2012’.
15 IATI is a voluntary, multi-stakeholder initiative that seeks to improve the transparency of aid, development and
humanitarian resources in order to increase their effectiveness in tackling poverty. IATI brings together donor and recipient countries, CSOs and other experts in aid information to work together to increase the transparency of aid. See more at: www.aidtransparency.net/
16 http://transparence.ambafrance-ml.org/. It should be noted that these advances were not yet taken into account in Publish What You Fund’s 2013 Aid Transparency Index, cited here.
17 The Open Government Partnership (OGP) is a global partnership initiated in 2011 by the United States and Brazil, which brings together states wishing to promote transparency of governmental action. Its founding text is the Declaration of Open Government, the principles of which are enshrined in the Universal Declaration of Human Rights and the United Nations Convention Against Corruption. To date, OGP member states have taken over 1,000 concrete commitments to improve the transparency and accountability of their governments, in areas such as access to information, budget transparency, participative citizenship, natural resources and e-government.
18 The tax has been in place since 2006 and has already raised €1.25 billion; see: Y. Collin and F. Keller (21 November 2013) ‘Report 156 (2013–2014) on the Budget Bill 2014’, www.senat.fr/rap/l13-156-34/l13-156-343.html. At least 80% of the revenues are allocated to UNITAID and a maximum of 10% goes to IFFIm.
19 France introduced a financial transaction tax (FTT) at national level in 2012. In 2013, €60 million was used for development; in 2014, the amount is estimated to increase to €100 million. So far, funds have mainly been used for global health, water and sanitation, but are likely to be at least partly directed to the Green Climate Fund in the future. France is also one of 10 EU countries that will introduce a joint FTT by January 2016, but no decision has been made thus far on jointly earmarking the tax for development.
20 IFFIm is one of GAVI’s innovative finance channels. Between 2007 and 2013, France allocated €218.7 million. Its total pledge from 2014 through to 2026 is €987.9 billion.
21 Document de politique transversale 2014, Politique française en faveur du développement, op.cit.
22 Between 2007 and 2012, this levy raised €98.3 million. French Development Agency (AFD) (June 2013) La coopération décentralisée dans le secteur Eau et Assainissement – bilan 2012, www.afd.fr/webdav/site/afd/shared/PORTAILS/SECTEURS/COOPERATION/ps_eau_la_cooperation_decentralisee_dans_le_secteur_eau_et_assainissement_bilan_2012_2013-Vd%C3%A9f.pdf. A similar mechanism is likely to be intro duced this year for waste management.
23 Tax Justice Network (2013) ‘Financing Secrecy Index: France’, www.financialsecrecyindex.com/PDF/France.pdf
24 In its 2014 Finance Amendment Bill, the government suggests a €73 million cut to core ODA, which would result in a 22% decrease since 2011.
25 This means that the French government will receive more reimbursements of past loans (counted as negative ODA) than the amount of newly issued loans.
26 In 2005, the 15 Member States of the EU agreed to reach the 0.7% objective by 2015, following the political commitments made at the Gleneagles G8 summit. Before the presidential elections, François Hollande committed – in a letter to ONE – to set a “credible path to progressively reach the objective of 0.7%”. In March 2013, at the closure of the conference “Assises du développement et de la solidarité internationale”, the President stated that “as soon as it [a sufficient level of growth] is back, we can resume an ascending trajectory towards the international objectives we have set ourselves”. www.one.org/fr/blog/one-vote-2012-francois-hollande-en-deuxieme-position/ and www.elysee.fr/declarations/article/intervention-de- m-le-president-de-la-republique-a- la-seance-de-cloture-des-assises-du-developpement-et-de-la-solidarite-internationale/
ENDNOTES

144 THE 2014 DATA REPORT
27 An increase in ODA of €7.06 billion would be needed in order to reach this goal. However, the financial impact on the French government will be less severe, should it continue to allocate part of its ODA in the form of loans (leveraged on the financial markets and of which only the grant element is funded through state resources).
GERMANY
1 ‘EU15’ refers to the 15 EU member states that joined the Union before 2004. They are all members of the Development Assistance Committee (DAC) and have all committed to achieve 0.7% ODA/GNI by 2015: Austria, Belgium, Denmark, Finland, France, Germany, Greece, Ireland, Italy, Luxembourg, the Netherlands, Portugal, Spain, Sweden and the United Kingdom.
2 The regional allocations by other departments have not yet been published. This issue may be particularly exacerbated in 2013, since it is the first year in which emergency aid funds (amounting to €87 million) have been transferred from the remit of BMZ to that of the Foreign Office.
3 Bundesministerium für Wirtschaftliche Zusammenarbeit und Entwicklung (January 2014) ’Bilaterale ODA-Rangliste 2012’, www.bmz.de/de/ministerium/zahlen_fakten/leistungen/bilaterale_oda_rangliste_2012/index.html
4 Bundesministerium der Finanzen (April 2014) ‘Informationsvermerk für den Haushaltsausschuss und den AWZ zu den Vertraulichen Erläuterungen 2014 für die bilaterale FZ und TZ’, p.9.
5 Bundestag (9 April 2014) ‘Plenarprotokoll 29. Sitzung, 18. Wahlperiode’, http://dip21.bundestag.de/dip21/btp/18/18029.pdf, p.2408.
6 Bundesministerium für Wirtschaftliche Zusammenarbeit und Entwicklung (March 2014) ‘Die neue Afrika-Politik des BMZ –Afrika auf dem Weg vom Krisen- zum Chancenkontinent’,
http://www.bmz.de/de/presse/aktuelleMeldungen/2014/maerz/140321_pm_025_Die-neue-Afrika-Politik-des-BMZ/25_Die_neue_Afrikapolitik_des_BMZ.pdf, p.8.
7 A minimum grant element of 25% is required to count as ODA.
8 Publish What You Fund (2013) ‘Aid Transparency Index: Germany’, http://ati.publishwhatyoufund.org/major-donor/germany/
9 Bundesregierung (December 2013) ‘Deutschlands Zukunft gestalten, Koalitionsvertrag zwischen CDU, CSU und SPD’, http://www.bundesregierung.de/Content/DE/_Anlagen/2013/2013-12-17-koalitionsvertrag.pdf?__blob=publicationFile&v=2
10 Bundesregierung (December 2013) ‘Deutschlands Zukunft gestalten, Koalitionsvertrag zwischen CDU, CSU und SPD’, op. cit.
11 See, for example: SPD (October 2013) ‘Verantwortung für mehr soziale Gerechtigkeit’, www.spd.de/presse/Pressemitteilungen/110748/20131020_beschluss_ konvent.html
12 Debt2Health is the Global Fund’s innovative financing mechanism that grants debt relief in exchange for domestic investments in national health programmes.
13 Tax Justice Network (2013) ‘Financial Secrecy Index: Germany’, www.financialsecrecyindex.com/PDF/Germany.pdf
14 Bundesregierung (December 2013) ‘Deutschlands Zukunft gestalten, Koalitionsvertrag zwischen CDU, CSU und SPD’, op. cit.
15 Note that the €2 billion is a cumulative figure. Compared with the 2013 baseline, the straight-line trajectory would be €200 million more in FY2014, €400 million more in FY2015, €600 million more in FY2016 and €800 million more in FY2017.
16 Publish What You Fund (2013) Aid Transparency Index, ‘Germany’, op. cit.
ITALY
1 If including debt relief, Italy reached a peak of 0.26% ODA/GNI in 2005.
2 Ministry of Foreign Affairs (March 2014) ‘La cooperazione italiana allo sviluppo nel triennio 2014–2016. Linee guida e indirizzi di programmazione – Aggiornamento: marzo 2014’, www.esteri.it/MAE/approfondimenti/ 2014/LLGG_2014-2016_Comitato_Direzionale_27_marzo_2014.pdf
3 Ibid.
4 Ministry of Foreign Affairs (December 2013) ‘Italy-Africa initiative under way: We must focus the spotlight on Africa once again, says Bonino’, www.esteri.it/MAE/EN/Sala_stampa/ArchivioNotizie/Approfondimenti/ 2013/12/20131230_inizitafrbon.htm
5 Organisation for Economic Co-operation and Development (May 2014) ‘OECD Development Co-Operation Peer Review – Italy 2014’, www.oecd.org/dac/peer-reviews/Italy_peerreview2014.pdf
6 Publish What You Fund (2013) ‘Aid Transparency Index: Italy’, http://ati.publishwhatyoufund.org/donor/italy-ministry-of-foreign-affairs/; Publish What You Fund (18 June 2013) ‘Campaigners Welcome G8 Commitment to Aid Transparency’, www.publishwhatyoufund.org/updates/news/press-release-campaigners- welcome-g8-commitment-aid-transparency/
7 Open Government Partnership , ‘Italy’, www.opengovpartnership.org/country/italy
8 Ministry of Foreign Affairs, ‘OpenAID’ Italia, http://openaid.esteri.it/en/
9 ‘Joint Statement by ministers of Member States participating in enhanced cooperation in the area of financial transaction tax (Austria, Belgium, Estonia, France, Germany, Greece, Italy, Portugal, Slovakia and Spain)’ (May 2014), www.bundesfinanzministerium.de/ Content/DE/Standardartikel/Themen/Internationales_Finanzmarkt/2014-05_06-ftt-statement-anlage.pdf?__blob=publicationFile&v=2
10 European Commission (July 2013) ‘EU Accountability Report 2013 on Financing for Development. Review of progress by the EU and its Member States’, http://aei.pitt.edu/43413/1/SWD_(2013)_273_2.pdf
11 Transparency International (2013) Corruption Perceptions Index, ‘Results’, http://cpi.transparency.org/cpi2013/results/
12 Tax Justice Network (2013) Financial Secrecy Index, ‘Italy’, www.financialsecrecyindex.com/PDF/Italy.pdf

145
13 www.ifcreview.com/restricted.aspx? articleId=7476
14 Ministry of Foreign Affairs (January 2014) ‘Development Cooperation reform under way – A government priority once again, says Letta’, www.esteri.it/MAE/EN/Sala_Stampa/ArchivioNotizie/Approfondimenti/2014/ 01/20140124_riformacooplett.htm
15 Organisation for Economic Co-operation and Development (May 2014) ‘OECD Development Co-Operation Peer Review – Italy 2014’, op. cit.
16 Ministry of Economy and Finance (April 2014) ‘Documento di Economia e Finanza 2014 – Sezione Programma di Stabilità dell’Italia’, www.dt.tesoro.it/modules/documenti_en/analisi_progammazione/documenti_programmatici/DEF_Sezione_I_Programma_di_Stabilitx.pdf
17 Ministry of Foreign Affairs (May 2014) ‘Cooperation – Investment growing in spite of cuts says Pistelli’, www.esteri.it/MAE/EN/Sala_stampa/ArchivioNotizie/Approfondimenti/2014/ 05/20140506_Cooperazione.htm
18 From 1 May to 31 October 2015, Italy will host the next world’s fair, Expo 2015, in Milan. The theme will be ‘Feeding the Planet, Energy for Life’, and the global event will thus focus heavily on issues of food security and nutrition. www.expo2015.org/en
19 Ministry of Foreign Affairs (March 2014) ‘La cooperazione italiana allo sviluppo nel triennio 2014–2016’, op. cit.
20 Publish What You Fund (2013) Aid Transparency Index, ‘Italy’, op. cit.
JAPAN
1 ONE (2011) ‘DATA Report’, http://one-org.s3.amazonaws.com/us/wp-content/uploads/2012/11/dr2011.pdf
2 Japan International Cooperation Agency (JICA) (November 2012) ‘JICA Annual Report 2012’, www.jica.go.jp/english/publications/reports/annual/2012/c8h0vm00002qe6vj-att/all.pdf, p.12.
3 JICA (2013) ‘JICA Annual Report 2013’, www.jica.go.jp/english/publications/reports/annual/2013/c8h0vm00008m8edo-att/all.pdf, p.10.
4 A. Versi, Global Briefing (August 2013) ‘Out of Africa: Africa’s new relationship with Japan’, www.global-briefing.org/2013/08/out-of-africa-japan-and-africa/
5 TICAD has been held every five years since 1993. Ministry of Foreign Affairs of Japan (MOFA) (March 2013) ‘TICAD V – Hand in Hand with a More Dynamic Africa’, www.mofa.go.jp/region/africa/ticad/pdfs/brochure_en.pdf, p.3.
6 A. Versi, Global Briefing (August 2013) ‘Out of Africa: Africa’s new relationship with Japan’, op. cit.
7 JICA (2012) ‘JICA Annual Report 2012’, op. cit., p.52.
8 MOFA (2013) ‘Japan’s Assistance Package for Africa at TICAD V’, www.mofa.go.jp/files/000005505.pdf
9 Ibid.
10 Ibid.
11 MOFA (2013) ‘Japan’s Official Development Assistance White Paper 2013: Sub-Saharan Africa’, www.mofa.go.jp/policy/oda/white/2013/pdfs/020203_5.pdf
12 Ibid.; ‘East Asia’, www.mofa.go.jp/policy/oda/white/2013/pdfs/020203_1.pdf, p.110, p.113.
13 Group 1 includes Cameroon, Ghana, Guinea, Kenya, Madagascar, Mali, Mozambique, Nigeria, Senegal, Sierra Leone, Tanzania and Uganda. JICA (2012) ‘JICA Annual Report 2012’, op. cit. p.93.
14 ‘Nutrition for Growth Commitments: Executive Summary’, www.gov.uk/government/uploads/system/uploads/attachment_data/ file/207274/nutrition-for-growth- commitments.pdf
15 JICA (2013) ‘JICA Annual Report 2013’, op. cit., p.78.
16 Due to a lack of data, we are unable to assess the in-donor expenditure of scholarships in years prior to 2010, and so this information is not included in the main part of the analysis in Section 2. However, examining the data for 2010– 12, it is clear that Japan has one of the highest shares of ODA devoted to in-donor scholarships of any DAC donor.
17 IATI (30 June 2014) ‘Japan publishes IATI data’, www.aidtransparency.net/news/japan-publishes-iati-data
18 Publish What You Fund (2013) ‘Aid Transparency Index: Japan’, http://ati.publishwhatyoufund.org/major-donor/japan/
19 Tax Justice Network (2013) ‘Financial Secrecy Index: Japan’, www.financialsecrecyindex.com/PDF/Japan.pdf
20 MOFA (2013) ‘Japan Action Plan to prevent the misuse of companies and legal arrangements’, www.mofa.go.jp/files/000006562.pdf
UNITED KINGDOM
1 The others were Norway, Sweden, Luxembourg and Denmark. The Netherlands provided 0.7% ODA/GNI for several decades but no longer meets the target.
2 As the preliminary data does not include a regional breakdown for the small portion of ODA provided through government departments other than DFID, the UK’s aid levels to Africa and sub-Saharan Africa may rise when the final statistics are published in December 2014.
3 DFID (2011), ‘The future of UK aid’, www.gov.uk/government/news/the-future-of-uk-aid; and DFID (2013) ‘What we do’, www.gov.uk/government/organisations/ department-for-international-development/about#where-we-work
4 DFID (November 2012), ‘India: Greening announces new development relationship’, www.gov.uk/government/news/india-greening-announces-new-development-relationship; and DFID (April 2013), ‘UK to end direct financial support to South Africa’, www.gov.uk/government/news/uk-to-end-direct-financial-support- to-south-africa
5 OECD DAC Creditor Reporting System.
6 DFID (April 2014) ‘Provisional UK Official Development Assistance as a proportion of Gross National Income, 2013’, www.gov.uk/government/uploads/system/uploads/attachment_data/file/300084/Prov-ODA-GNI-2013a.pdf. Statistics on bilateral ODA by geographic region are available only for the portion of UK aid channelled through DFID. No breakdown by country is yet available.
ENDNOTES

146 THE 2014 DATA REPORT
7 The ‘government and civil society’ category includes areas such as public sector policy, public financial management, democratic participation and women’s rights. OECD DAC Creditor Reporting System.
8 DFID (January 2014) ‘Economic development for shared prosperity and poverty reduction: a strategic framework’, www.gov.uk/government/uploads/system/uploads/attachment_data/file/276859/Econ-development-strategic-framework_.pdf
9 DFID (January 2014) ‘Greening: UK will focus on frontier economic development’, www.gov.uk/government/news/greening-uk-will-focus-on-frontier-economic-development
10 UK Parliament International Development Committee (2014) ‘The Future of UK Development Cooperation: Phase 1: Development Finance’, www.publications.parliament.uk/pa/cm201314/cmselect/cmintdev/334/334vw.pdf
11 Government response (May 2014) ‘The Future of UK Development Cooperation: Phase 1: Development Finance’, www.publications.parliament.uk/pa/cm201314/cmselect/cmintdev/1255/125504.htm
12 Publish What You Fund (2013) ‘Aid Transparency Index: United Kingdom’, http://ati.publishwhatyoufund.org/major-donor/united-kingdom/
13 DFID, ‘Development Tracker’, http://devtracker.dfid.gov.uk/
14 Ibid.
15 Open Government Partnership, ‘United Kingdom’, www.opengovpartnership.org/country/united-kingdom
16 Tax Justice Network (2013) ‘Financial Secrecy Index: United Kingdom’, www.financialsecrecyindex.com/PDF/UnitedKingdom.pdf
17 Cabinet Office (June 2014) ‘Queen’s Speech 2014’, www.gov.uk/government/speeches/queens-speech-2014
UNITED STATES
1 OECD DAC Table DAC2a, 2012.
2 OECD Development Cooperation Report (2013) ‘United States’, www.oecd-ilibrary.org/development/development-co-operation-report- 2013/united-states_dcr-2013-47-en
3 USAID Forward Results, Data Tables, ‘Strengthen Local Capacity’, www.usaid.gov/sites/default/files/USAID%20Forward%20Data_Local%20Solutions.xlsx
4 Publish What You Fund (2013) ‘Aid Transparency Index: United States’, http://ati.publishwhatyoufund.org/major-donor/united-states/
5 Ibid.
6 Civil Society Progress Report (June 2014) ‘First Check-In on the Implementation of the United States’ Open Government National Action Plan’, http://openthegovernment.org/sites/default/files/Check%20In%201%20Report%20June%2019%202014.pdf
7 Tax Justice Network (2013) ‘Financial Secrecy Index: USA’, www.financialsecrecyindex.com/PDF/USA.pdf
8 White House (18 June 2013) ‘United States G-8 Action Plan for Transparency of Company Ownership and Control’, www.whitehouse.gov/the-press-office/2013/06/18/united-states-g-8- action-plan-transparency-company- ownership-and-control
9 White House (5 December 2013) ‘The Open Government Partnership: Second Open Government National Action Plan for the United States of America’, www.whitehouse.gov/sites/default/files/docs/us_national_action_plan_6p.pdf
10 US Department of the Interior (2014) ‘U.S. Extractive Industries Transparency Initiative’, www.doi.gov/EITI/index.cfm
11 US Office of Information and Regulatory Affairs (2014) ‘Disclosure of Payments by Resource Extraction Issuers’, www.reginfo.gov/public/do/eAgendaView Rule?pubId=201404&RIN=3235-AL53
12 Feed the Future (2014) ‘Progress Report’, http://feedthefuture.gov/sites/default/files/ftf_progressreport_2014.pdf
KEY IMPACTS OF DONOR ASSISTANCE
1 Australian Department of Foreign Affairs and Trade (February 2014) ‘Annual Review of Aid Effectiveness 2012–13’, http://aid.dfat.gov.au/Publications/Documents/annual-review-aid-effectiveness-2012-13.pdf
2 Canadian Department of Foreign Affairs, Trade and Development (2013) ‘Development for Results 2011–2012’, www.acdi-cida.gc.ca/INET/IMAGES.NSF/vLUImages/d4r/$file/development-for-results-2011-2012.pdf
3 European Commission (2013) ‘EU contribution to the Millennium Development Goals – Key results from European Commission programmes’, http://www.dochas.ie/Shared/Files/4/mdg-brochure-2013.pdf
4 Agence Française de Développement (AFD) (2014) ‘2013 Annual Report’, www.afd.fr/webdav/shared/PUBLICATIONS/Colonne-droite/Rapport-annuel-AFD-VF.pdf
5 Kreditanstalt für Wiederaufbau (August 2013) ‘Innovation wirkt. Technologie für Entwicklung. Jahres-bericht über die Zusammenarbeit mit Entwicklungsländern 2012’, www.kfw-entwicklungsbank.de/Download-Center/PDF-Dokumente-Jahresberichte/2012_Jahresbericht_ E.pdf.
6 Japan International Cooperation Agency (JICA) (2013) ‘JICA Annual Report 2013’, www.jica.go.jp/english/publications/reports/annual/2013/c8h0vm00008m8edo-att/all.pdf; MOFA (2013) ‘20 years of the TICAD process and Japan’s ODA to Africa’, www.mofa.go.jp/policy/oda/pamphlet/pdfs/ticad_20_en.pdf.
7 Baseline year varies.
8 Department for International Development (DFID) (2013) ‘Annual Report and Accounts 2012–13’, www.gov.uk/government/uploads/system/uploads/attachment_data/file/208445/annual-report-accounts2013-13.pdf
9 Feed the Future (2014) ‘Progress Report’, http://feedthefuture.gov/sites/default/files/ftf_progressreport_2014.pdf; PEPFAR (2013) Report to Congress, www.pepfar.gov/documents/organization/223065.pdf

147
SECTION 4: TRENDS IN AFRICAN GOVERNMENT SPENDING
1 ODA is not fully additional to government expenditures, since it includes a portion of the latter in most countries (on-budget aid). However, due to insufficient availability of data, it is not possible to calculate precisely the volumes of government expenditures that are financed by ODA.
2 The 29 LDCs are Angola, Benin, Burkina Faso, Burundi, Central African Republic, Chad, Comoros, Democratic Republic of the Congo, Equatorial Guinea, Eritrea, Ethiopia, The Gambia, Guinea, Guinea-Bissau, Lesotho, Liberia, Madagascar, Malawi, Mali, Mozambique, Niger, Rwanda, São Tomé and Príncipe, Senegal, Sierra Leone, Tanzania, Togo, Uganda and Zambia. Cape Verde is not included as it stopped being categorised as an LDC after 2006.
3 J. McArthur (February 2014) ‘How much aid for basic needs to 2030? Some very coarse numbers’, http://johnmcarthur.com/2014/02/how-much-aid-for-basic-needs-to-2030-some-very-coarse-numbers/
4 Development Initiatives (2013) ‘Investments to End Poverty’, http://devinit.org/wp-content/uploads/2013/09/Investments_to_End_Poverty_full_report.pdf
5 African Economic Outlook (2014) ‘Equatorial Guinea’, www.africaneconomicoutlook.org/en/countries/central-africa/equatorial-guinea/. The most recent official statistics by the World Bank indicate a national poverty ratio of 76.8%, although these have not been updated since 2006.
6 Momentum on domestic resource mobilisation has picked up considerably in recent years. For example, in April 2014, at the first High Level Meeting of the Global Partnership for Effective Development Cooperation in Mexico, domestic resource mobilisation was one of the five ‘focus areas’ and the subject of multiple voluntary initiatives advanced at the meeting. Global Partnership for Effective Development Cooperation (2014) ‘First High Level Meeting of the Global Partnership’, http://effectivecooperation.org/2014/ 04/10/first-high-level-meeting-of-the-global-partnership/; E. Postel (2014) ‘Financing the future: why domestic revenue mobilisation belongs on the post-2015 development agenda’, http://devcooperation.org/category/domestic-resource-mobilisation/. In their Common African Position on the Post-2015 Development Agenda, African governments emphasised the primary responsibility of each national government and the critical role for domestic resources. African Union (2014) ‘Common African Position on the Post-2015 Development Agenda’,
www.africa.undp.org/content/dam/ rba/docs/Reports/RBA-common- position.pdf. Interest in tax has never been stronger or more widespread, as the development community recognises the massive potential that can be harnessed by strengthening tax administration systems, improving governance of the extractives industries, and tackling tax evasion, corruption and illicit financial flows. A. Hudson (2013) ‘A G8 Transparency Revolution? Yeah, some’, www.one.org/international/blog/a-g8-transparency-revolution-yeah-some/; A. Evans, CIC (2013) ‘Delivering on the Post-2015 Development Agenda: Options for a Global Partnership’, http://cic.nyu.edu/sites/default/ files/delivering_post_2015_agenda_brief.pdf; Christian Aid (2014) ‘Africa Rising? Inequalities and the essential role of fair taxation’, www.christianaid.org.uk/images/Africa-tax-and-inequality-report- Feb2014.pdf;
International Budget Partnership (2012) ‘Open Budget Survey’, http://internationalbudget.org/ wp-content/uploads/OBI2012- Report-English.pdf
7 International Budget Partnership (2012) ‘Open Budget Survey’, op. cit.
8 P. de Renzio and R. Simson (2013) ‘Transparency for what? The usefulness of publicly available budget information in African countries’.
www.odi.org/sites/odi.org.uk/files/odi-assets/publications-opinion-files/8754.pdf
9 The international datasets ONE uses in this section (WHO for health; ReSAKSS for agriculture; UNESCO for education), which are compiled from national accounts, are the best comparative sources available and yet are far from perfect: they contain gaps, rely on some estimated and modelled data, use inconsistent indicators (e.g. mixing planned and actual expenditures), and are published with a 2– 4 year time lag.
10 WHO (2014) ‘Global Health Expenditure Database: National Health Accounts Indicators’.
11 ONE calculations based on IMF (April 2014) ‘World Economic Outlook’ and WHO (2014) ‘Global Health Expenditure Database: National Health Accounts Indicators’. Countries that spent over 15% in any years are counted as having a zero, rather than a negative, ‘Abuja deficit’, so that this does not offset the countries that spent less than 15%.
12 ONE calculations based on IMF (April 2014) ‘World Economic Outlook’ and WHO (2014) ‘Global Health Expenditure Database: National Health Accounts Indicators’.
13 X. Ke et al (2010) ‘Exploring the thresholds of health expenditure for protection against financial risk’.
14 Chatham House (2014) ‘Shared Responsibilities for Health: A Coherent Global Framework for Health Financing’.
15 Taskforce on Innovative Financing for Health Systems (2010) ‘Constraints to Scaling Up the Health Millennium Development Goals: Costing and Financial Gap Analysis’.
16 ONE calculations based on IMF (April 2014) ‘World Economic Outlook’ and WHO (2014) ‘Global Health Expenditure Database: National Health Accounts Indicators’.
17 Oxfam International (2014) ‘“Model Hospital” for privatised African health care threatens to swamp country’s budget’, http://www.oxfam.org.uk/media-centre/press-releases/2014/04/blog
18 C. Murray et al., WHO, ‘Defining and Measuring Fairness in Financial Contribution to the Health System’.
19 Ibid.
20 A. Tandon et al. (2014) ‘Reprioritizing Government Spending on Health: Pushing an Elephant up the Stairs?’
ENDNOTES

148 THE 2014 DATA REPORT
21 The Comprehensive Africa Agriculture Development Programme (CAADP) was launched in 2003, but many countries did not develop national agriculture investment plans until several years later. Additionally, government administrations change over time and a more accurate picture of commitment to agricultural investment uses the most recent data available.
22 S. Benin and B. Yu, International Food Policy Research Institute (IFPRI) (2013) ‘Complying with the Maputo Declaration Target: Trends in public agricultural expenditures and implications for pursuit of optimal allocation of public agricultural spending’, ReSAKSS Annual Trends and Outlook Report 2012. Recently, according to their national budget documents (where available), other countries have been moving closer to the 10% target; for example, Rwanda allocated 9.7% of its total spending to agriculture in its 2014/15 budget.
23 African Union Commission (AUC) (2005) ‘Guidance Note for Agriculture Expenditure Tracking System in African Countries’, Midrand, South Africa.
24 IMF (2001) ‘Government Finance Statistics Manual 2001 (GFSM 2001)’.
25 FAO (2013) ‘Monitoring African Food and Agricultural Policies (MAFAP)’.
26 MAFAP (2013) ‘Review of food and agricultural policies in the United Republic of Tanzania’, MAFAP Country Report Series, FAO, Rome, Italy. The narrow definition of ‘agriculture-specific’ is defined as expenditures that generate monetary transfers
to agricultural agents (producers, consumers, input suppliers, trades, processors and transporters) or the sector as a whole (e.g. in the form of research or extension services).
27 Ibid.
28 UNESCO (2014) ‘Education for All Global Monitoring Report 2014’.
29 J. Engel with P. Rose, Overseas Development Institute (June 2011) ‘Development Progress: Ethiopia’s Progress on Education: A rapid and equitable expansion of access’, www.developmentprogress.org/sites/developmentprogress.org/files/resource_document/ethiopia_web_master_final.pdf
30 Ibid.
31 UNESCO (2014) ‘Education for All Global Monitoring Report 2014’.
32 Ibid.
33 Extractive Industries Transparency Initiative (EITI) (8 March 2013) ‘Ghana’s revenues from natural resources increase 400%’, http://eiti.org/news/ghana-eiti-reports-revenue-oil-and-gas-first-time
34 UNESCO (2014) ‘Education for All Global Monitoring Report 2014’.
35 Ibid.
36 Ibid.
37 Development Iniatives (February 2014) ‘Aid for domestic resource mobilisation: how much is there?’, http://devinit.org/wp-content/uploads/2014/02/Aid-for-domestic-resource-mobilisation-%E2%80%93-how-much-is-there.pdf
38 World Bank, Open Budgets Portal, http://wbi.worldbank.org/boost/
LIBERIA
1 World Bank, World Development Indicators.
2 IMF (December 2013) ‘HIPC and MDRI – Statistical Update’, www.imf.org/external/np/pp/eng/2013/ 121913.pdf; World Bank/IMF (November 2013) ‘Liberia: Debt Sustainability Analysis; IMF Country Report No. 13/365’, www.imf.org/external/pubs/ft/dsa/pdf/2013/dsacr13365.pdf
3 World Bank, World Development Indicators.
4 UN Inter-Agency Group on Child Mortality Estimation (2013) ‘Levels & Trends in Child Mortality’, www.childinfo.org/files/Child_Mortality_Report_2013.pdf
5 World Bank, World Development Indicators.
6 African Economic Outlook (2014) ‘Liberia’, www.africaneconomicoutlook.org/fileadmin/uploads/aeo/2014/PDF/CN_Long_EN/Liberia_EN.pdf
7 World Bank, World Development Indicators.
8 UNDP (2014) Human Development Index, http://hdr.undp.org/en/content/table-1-human-development-index-and-its-components
9 World Bank, World Development Indicators.
10 ReSAKSS (2013) ‘Liberia Country Profile’, www.resakss.org/region/monitoring-progress/liberia; WHO (2013) ‘Country Cooperation Strategy’, www.who.int/countryfocus/cooperation _strategy/ccsbrief_lbr_en.pdf?ua=1
11 World Bank, ‘Liberia Overview’, www.worldbank.org/en/country/liberia/overview; African Economic Outlook (2014) ‘Liberia’, op. cit.
12 Global Witness (2012) ‘Signing their Lives Away: Liberia’s Private Use Permits and the Destruction of Community-Owned Rainforest’, www.globalwitness.org/sites/default/files/library/Signing%20their%20Lives%20away%20-%20Liberian%20Private%20Use%20Permits%20-%204%20Sept%202012%20U_0.pdf
13 African Economic Outlook (2014) ‘Liberia’, op. cit.; Global Witness (2012) ‘Signing their Lives Away’, op. cit.
14 EITI (2009) ‘Liberia Designated EITI Compliant by the EITI Board’, http://eiti.org/news-events/liberia-designated-eiti-compliant-eiti-board
15 EITI, ‘Liberia’, http://eiti.org/Liberia
16 EITI (June 2013) ‘Liberia EITI Report includes the first EITI “should-be-paid” audit’, http://eiti.org/news/liberia-eiti- report-includes-first-eiti-should- be-paid-audit; Global Witness (May 2013) ‘Liberian government publishes landmark resource audit, but urgently needs to address findings’, www.globalwitness.org/library/liberian-government-publishes-landmark-resource-audit-urgently-needs-address-findings
17 IMF (2014) World Economic Outlook; African Economic Outlook (2014) ‘Liberia’, op. cit.; D. Yates, Daily Observer (2 July 2014) ‘Revenue Authority Begins Official Operations’, www.liberianob server.com/business/revenue-authority-begins-official-operations
18 IMF (2014) World Economic Outlook.
19 OECD DAC Table 2a.
20 Global Fund (2014) ‘Liberia‘, http://portfolio.theglobalfund.org/en/Country/Index/LBR
21 GAVI (2014) ‘Liberia’, www.gavialliance.org/country/liberia/

149
NIGERIA
1 Nigerian National Bureau of Statistics (6 April 2014) ‘Measuring Better: Preliminary Results of the Rebased Nominal Gross Domestic Product (GDP) Estimates for Nigeria, 2010 to 2013’.
2 World Bank, World Development Indicators.
3 The median GDP per capita among sub-Saharan African countries with available data for 2013 was $994. World Bank, World Development Indicators.
4 Ibid.
5 Ibid.
6 Ibid.
7 World Bank, ‘Poverty & Equity: Nigeria’, http://povertydata.worldbank.org/poverty/country/NGA
8 World Bank, World Development Indicators.
9 UN Inter-Agency Group for Child Mortality Estimation (2013) ‘Levels and Trends in Child Mortality’, www.childinfo.org/files/Child_Mortality_Report_2013.pdf
10 African Economic Outlook (2014) ‘Nigeria’, www.africaneconomicoutlook.org/ fileadmin/uploads/aeo/2014/PDF/CN_Long_EN/Nigeria_EN.pdf
11 Ibid.
12 Forbes, ‘The World’s Billionaires: Aliko Dangote’, www.forbes.com/profile/aliko-dangote/
13 Calculated using revenue data from IMF World Economic Outlook (April 2014) and GDP data from World Bank, World Development Indicators.
14 B. Leo, Center for Global Development (25 April 2014) ‘Is it time to end the Nigerian aid charade?’, www.cgdev.org/blog/it-time-end-nigeria-aid-charade
15 N. Okonjo-Iweala (15 April 2014) ‘Opening Statement at the First High Level Meeting of the Global Partnership for Effective Development Cooperation’, https://www.facebook.com/ngoziokonjoiweala/posts/731526766897590?stream_ref=10
16 N. Okonjo-Iweala (17 January 2014) ‘Opening Remarks at the Leading Group on Innovative Financing for Development 12th Plenary Session’, http://leadinggroup.org/IMG/pdf/Ngozi_Speech_Innovative_Financing.pdf
17 Global Financial Integrity (2013) ‘Illicit financial flows from developing countries: 2002–2011’, http://gfintegrity.org/wp-content/ uploads/2014/05/Illicit_Financial_Flows_from_Developing_Countries_ 2002-2011-HighRes.pdf
18 I. Nnochiri (28 August 2012) ‘Nigeria loses $400bn to oil thieves – Ezekwesili’, www.vanguardngr.com/2012/08/ nigeria-loses-400bn-to-oil-thieves-
ezekwesili/ 19 N. Shaxton (2009) ‘Nigeria’s Extractive
Industry Transparency Initiative: Just a Glorious Audit?’, http://eiti.org/files/NEITI%20 Chatham%20house_0.pdf; The Nigerian Voice (23 November 2012) ‘NEITI to Sanction Companies, Govt. Agencies over N1.3 Trillion Revenue Loss’, www.thenigerianvoice.com/news/ 101948/1/neiti-to-sanction-companies-govt-agencies-over-n13.html
20 E. Bala-Gbogbo (2 November 2012) ‘Nigerian Report Alleges $37 billion Oil Underpayments’, www.bloomberg.com/news/2012-11-02/nigerian-report-alleges-37-billion-oil- underpayments.html
21 World Bank, World Development Indicators; IMF World Economic Outlook (April 2014).
22 WHO (2014) Global Health Expenditure Database: National Health Accounts Indicators.
23 Centre for Social Justice, Citizens Wealth Platform (2012) ‘Recommendations on the Line Items of the 2013 Federal Budget Estimates’, http://csj-ng.org/publications/public-finance-management/pro-poor-rights-based-budgeting/
24 International Budget Partnership (2012) ‘Open Budget Survey: Nigeria’, http://internationalbudget.org/wp- content/uploads/OBI2012-NigeriaCS- English.pdf
METHODOLOGY
1 For example, preliminary data on French aid to sub-Saharan Africa does not include refugee costs, imputed student costs or scholarships, which comprise a sizeable portion of its aid to the region.
2 European Commission (April 2014) ‘Publication of Preliminary Data on 2013 Official Development Assistance: MEMO/14/263’,
http://europa.eu/rapid/press-release_MEMO-14-263_en.htm
3 For further details, see ONE (2013) ‘DATA Report 2013: Special Report Tracking Development Assistance’, http://one_org_international.s3.amazonaws.com/international/wp-content/uploads/2013/07/data_report_2013_tracking_development_assistance_summary.pdf
ENDNOTES

BERLINLuisenstraße 4010117 BerlinGermanyBRUSSELS3rd FloorRue d’Idalie 9– 131050 BrusselsBelgiumJOHANNESBURGSilverstream Office ParkMain Building, 1st Floor 10 Muswell RoadBryanston 2191JohannesburgSouth AfricaLONDON151 Wardour StreetLondon, W1F 8WEUnited Kingdom
NEW YORK49 W. 27th StreetFloor 3New York, NY 10005United StatesPARIS47 rue du Montparnasse75014 ParisFranceWASHINGTON, DC1400 Eye Street NWSuite 600Washington, DC 20005United States
ONE.ORG
OFFICES