the federal bureau of prisons inmate release preparation
148
THE FEDERAL BUREAU OF PRISONS INMATE RELEASE PREPARATION AND TRANSITIONAL REENTRY PROGRAMS U.S. Department of Justice Office of the Inspector General Audit Division Audit Report 04-16 March 2004
Transcript of the federal bureau of prisons inmate release preparation
THE FEDERAL BUREAU OF PRISONS INMATE RELEASE
PREPARATION AND TRANSITIONAL REENTRY PROGRAMS
U.S. Department of Justice Office of the Inspector General
Audit Division
Audit Report 04-16 March 2004
i
THE FEDERAL BUREAU OF PRISONS INMATE RELEASE PREPARATION AND TRANSITIONAL REENTRY PROGRAMS
EXECUTIVE SUMMARY
The Federal Bureau of Prisons’ (BOP) stated mission is to protect society by confining offenders in the controlled environments of prisons and community-based facilities that are safe, humane, cost-efficient, appropriately secure, and that provide work and other self-improvement opportunities to assist offenders in becoming law-abiding citizens. It is a strategic objective of the BOP to “provide productive work, education, occupational training, and recreational activities which prepare inmates for employment opportunities and a successful reintegration upon release, and which have a clear correctional management purpose which minimizes inmate idleness.”1
During Fiscal Year (FY) 2000 through FY 2002, the BOP reported that
74,401 federal prison inmates were released from its institutions. It is expected that a large percentage of inmates released will recidivate. Based on the most recent statistics available on federal inmates from the U.S. Department of Justice (DOJ), Bureau of Justice Statistics (BJS), approximately 16 percent of federal inmates released will return to federal prisons within 3 years.2 Further, according to the most recent study conducted by the BOP on recidivism rates for federal inmates, about 41 percent of federal inmates released to the community in 1987 were rearrested or had their parole revoked within 3 years of release.3
According to the DOJ Strategic Plan, since a majority of inmates will be
released at some point, it is important for the DOJ to provide them the means to increase their chances for successful reentry into society. The Strategic Plan states that the BOP has a responsibility to offer program opportunities to inmates that provide the skills necessary for successful reentry into society. Therefore, in addition to the basic services (such as
1 The BOP, State of the Bureau 2002, Accomplishments and Goals.
2 The DOJ BJS, Special Report, Offenders Returning to Federal Prisons, 1986-97, dated September 2000.
3 The BOP, Recidivism Among Federal Prisoners Released in 1987, dated August 4, 1994.
ii
clothing, food, and access to health care), the BOP provides inmates with a variety of educational, vocational, recreational, religious, and psychological programs. The BOP’s inmate programs are geared, ultimately, toward preparing inmates for eventual release.
In addition to programs offered during incarceration designed to
prepare inmates for reentry into society (reentry programs), the BOP requires that all eligible inmates receive transitional reentry services through placement in Community Corrections Centers (CCC), also referred to as halfway houses, prior to release. This placement is intended to help inmates adjust to life in the community and find suitable post-release employment.4
The DOJ Office of the Inspector General (OIG) conducted this audit to
evaluate whether the BOP ensures that federal inmates participate in its programs designed to prepare them for successful reentry into society. The objectives of our audit were to determine whether the BOP ensures that:
• each of the BOP’s institutions maximize the number of inmates that complete programs designed to prepare them for reentry into society, including occupational, educational, psychological, and other programs; and
• all eligible inmates are provided the opportunity to transition through a
CCC in preparation for reentry into society.
Background
The DOJ is responsible for the detention and incarceration of persons charged with violating federal statutes. The DOJ defines detention as the temporary confinement of individuals and incarceration as the imprisonment of individuals convicted and sentenced for federal crimes. The U.S. Marshals Service and the BOP share the DOJ’s detention responsibilities; the incarceration of federal inmates is the sole responsibility of the BOP.
As of November 2003, the BOP consisted of 103 institutions, 6 regional
offices, a central office, 2 staff training centers, and 28 community corrections offices. The BOP is currently responsible for the custody and care of approximately 174,000 federal offenders.
4 As of October 2003, the BOP had 6,451 inmates placed in CCCs.
iii
In conducting the audit, we interviewed officials from the BOP Central Office and 3 of the 6 BOP regional offices. We conducted fieldwork or obtained information through questionnaires from 27 institutions. Additionally, we examined reported data for 82 institutions, including the Administrative Maximum Security (ADX) institution, and all Federal Correctional Institutions (FCI), Federal Prison Camps (FPC), and United States Penitentiaries (USP). We excluded Federal Detention Centers (FDC), Federal Medical Centers (FMC), Federal Transfer Centers (FTC), Metropolitan Correctional Centers (MCC), Medical Centers for Federal Prisoners (MCFP), and Metropolitan Detention Centers (MDC) because of the unique missions of these institutions.
Additional information related to our audit objectives, scope, and
methodology appears in Appendix III of this report. Summary of Audit Findings Research conducted by both governmental and private institutions concludes that successful completion of occupational, educational, psychological, and other programs during an inmate’s incarceration leads to both a reduction in recidivism and an increase in post-release employment opportunities. Research in this area also concludes that inmates who transition into the community through a CCC are less likely to recidivate. Therefore, our audit focused on whether the BOP ensures that federal inmates receive the maximum benefit from its programs designed to prepare them for successful reentry into society. Overall, our audit concluded that each BOP institution offers similar types of reentry programs that are generally recognized to reduce recidivism. However, we found that the BOP does not provide assurance that its institutions are maximizing the number of inmates that complete these programs and that all eligible inmates are provided the opportunity to transition through a CCC to help prepare them for reentry into society. Reentry Program Completions
We reviewed the types of reentry programs offered by the BOP to prepare inmates for successful reentry into society and found that each of the 82 BOP institutions included in our audit offer a full range of occupational, educational, psychological, and other programs that, based on studies, are shown to be effective in helping inmates successfully reenter society. We found that:
iv
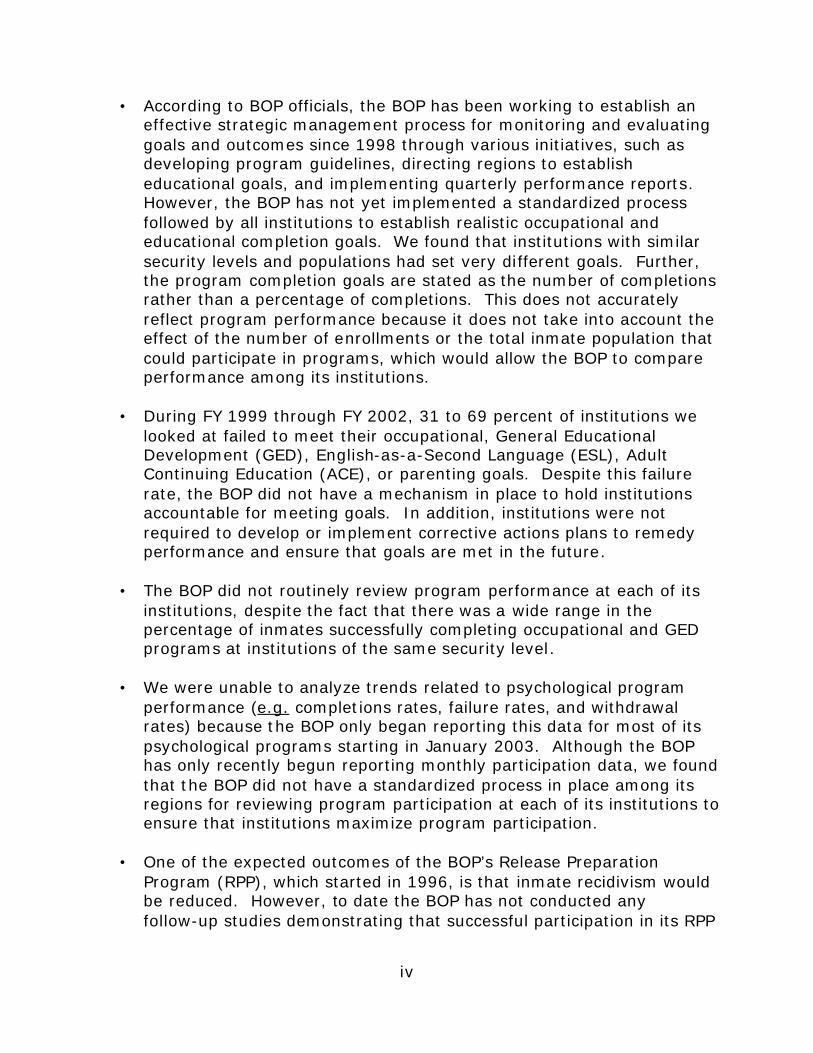
• According to BOP officials, the BOP has been working to establish an effective strategic management process for monitoring and evaluating goals and outcomes since 1998 through various initiatives, such as developing program guidelines, directing regions to establish educational goals, and implementing quarterly performance reports. However, the BOP has not yet implemented a standardized process followed by all institutions to establish realistic occupational and educational completion goals. We found that institutions with similar security levels and populations had set very different goals. Further, the program completion goals are stated as the number of completions rather than a percentage of completions. This does not accurately reflect program performance because it does not take into account the effect of the number of enrollments or the total inmate population that could participate in programs, which would allow the BOP to compare performance among its institutions.
• During FY 1999 through FY 2002, 31 to 69 percent of institutions we
looked at failed to meet their occupational, General Educational Development (GED), English-as-a-Second Language (ESL), Adult Continuing Education (ACE), or parenting goals. Despite this failure rate, the BOP did not have a mechanism in place to hold institutions accountable for meeting goals. In addition, institutions were not required to develop or implement corrective actions plans to remedy performance and ensure that goals are met in the future.
• The BOP did not routinely review program performance at each of its
institutions, despite the fact that there was a wide range in the percentage of inmates successfully completing occupational and GED programs at institutions of the same security level.
• We were unable to analyze trends related to psychological program
performance (e.g. completions rates, failure rates, and withdrawal rates) because the BOP only began reporting this data for most of its psychological programs starting in January 2003. Although the BOP has only recently begun reporting monthly participation data, we found that the BOP did not have a standardized process in place among its regions for reviewing program participation at each of its institutions to ensure that institutions maximize program participation.
• One of the expected outcomes of the BOP’s Release Preparation
Program (RPP), which started in 1996, is that inmate recidivism would be reduced. However, to date the BOP has not conducted any follow-up studies demonstrating that successful participation in its RPP
v
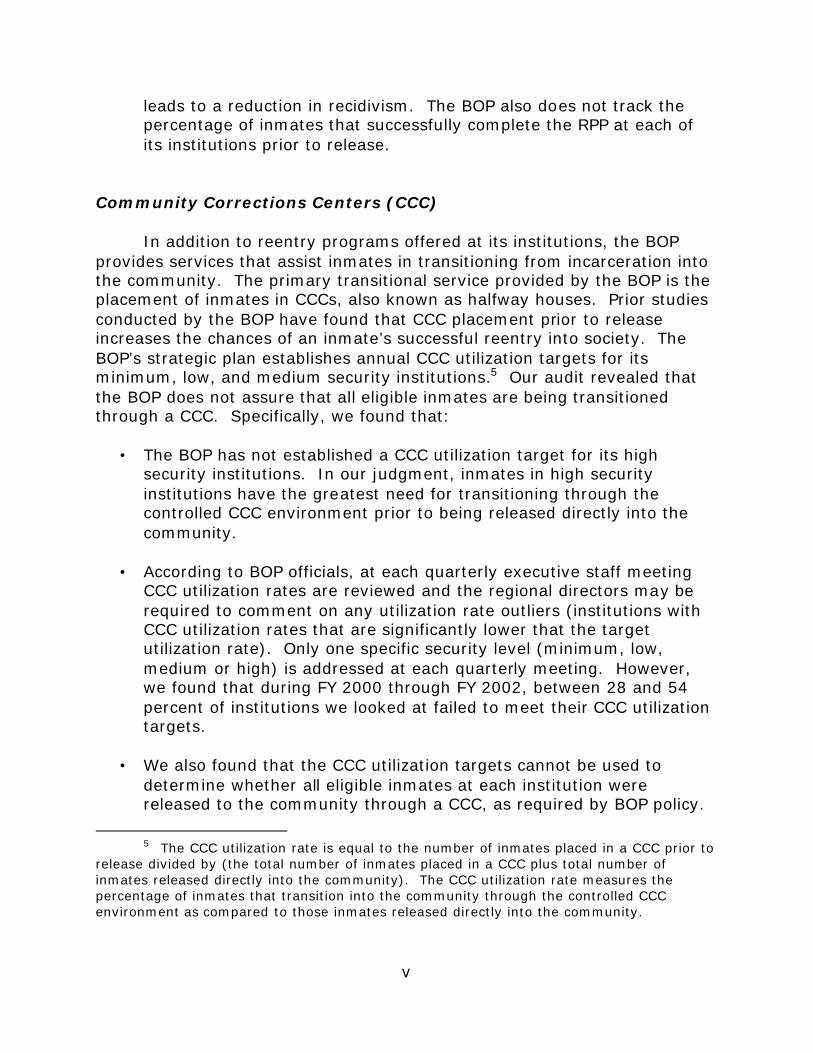
leads to a reduction in recidivism. The BOP also does not track the percentage of inmates that successfully complete the RPP at each of its institutions prior to release.
Community Corrections Centers (CCC)
In addition to reentry programs offered at its institutions, the BOP provides services that assist inmates in transitioning from incarceration into the community. The primary transitional service provided by the BOP is the placement of inmates in CCCs, also known as halfway houses. Prior studies conducted by the BOP have found that CCC placement prior to release increases the chances of an inmate’s successful reentry into society. The BOP’s strategic plan establishes annual CCC utilization targets for its minimum, low, and medium security institutions.5 Our audit revealed that the BOP does not assure that all eligible inmates are being transitioned through a CCC. Specifically, we found that:
• The BOP has not established a CCC utilization target for its high
security institutions. In our judgment, inmates in high security institutions have the greatest need for transitioning through the controlled CCC environment prior to being released directly into the community.
• According to BOP officials, at each quarterly executive staff meeting
CCC utilization rates are reviewed and the regional directors may be required to comment on any utilization rate outliers (institutions with CCC utilization rates that are significantly lower that the target utilization rate). Only one specific security level (minimum, low, medium or high) is addressed at each quarterly meeting. However, we found that during FY 2000 through FY 2002, between 28 and 54 percent of institutions we looked at failed to meet their CCC utilization targets.
• We also found that the CCC utilization targets cannot be used to
determine whether all eligible inmates at each institution were released to the community through a CCC, as required by BOP policy.
5 The CCC utilization rate is equal to the number of inmates placed in a CCC prior to
release divided by (the total number of inmates placed in a CCC plus total number of inmates released directly into the community). The CCC utilization rate measures the percentage of inmates that transition into the community through the controlled CCC environment as compared to those inmates released directly into the community.

vi
Currently, the CCC utilization targets range from 65 percent for medium security level institutions to 80 percent for minimum security level institutions; therefore, even if an institution achieves or exceeds the CCC utilization target for its security level, the BOP can not assure that all eligible inmates were transitioned through a CCC.
Recommendations
We make thirteen recommendations that focus on specific steps that
the BOP should take to maximize the number of inmates that complete its programs designed to prepare inmates for successful reentry into society and to ensure that eligible inmates are transitioned into society through a CCC. Our recommendations include:
• establishing realistic occupational and educational completion goals stated as a percentage of enrollments, and ensuring that institutions are held accountable for meeting occupational and educational goals and outcomes on an annual basis;
• evaluating the performance factors for occupational programs to
ensure that institutions are held accountable for low performance;
• developing a suitable measure of literacy program performance and evaluating the percentage of citizen inmates required to participate in the literacy program who have dropped out;
• evaluating participation data for psychological programs and tracking
RPP participation to ensure that institutions are held accountable for low performance;
• screening inmates prior to enrollment in occupational programs to
ensure that they have the ability and are willing to commit to completing the course; and
• establishing a CCC utilization target for high security institutions and
developing a CCC utilization monitoring process that ensures that all eligible inmates are transitioned through a CCC as required by BOP policy.
THE FEDERAL BUREAU OF PRISONS INMATE RELEASE PREPARATION AND TRANSITIONAL REENTRY PROGRAMS
TABLE OF CONTENTS
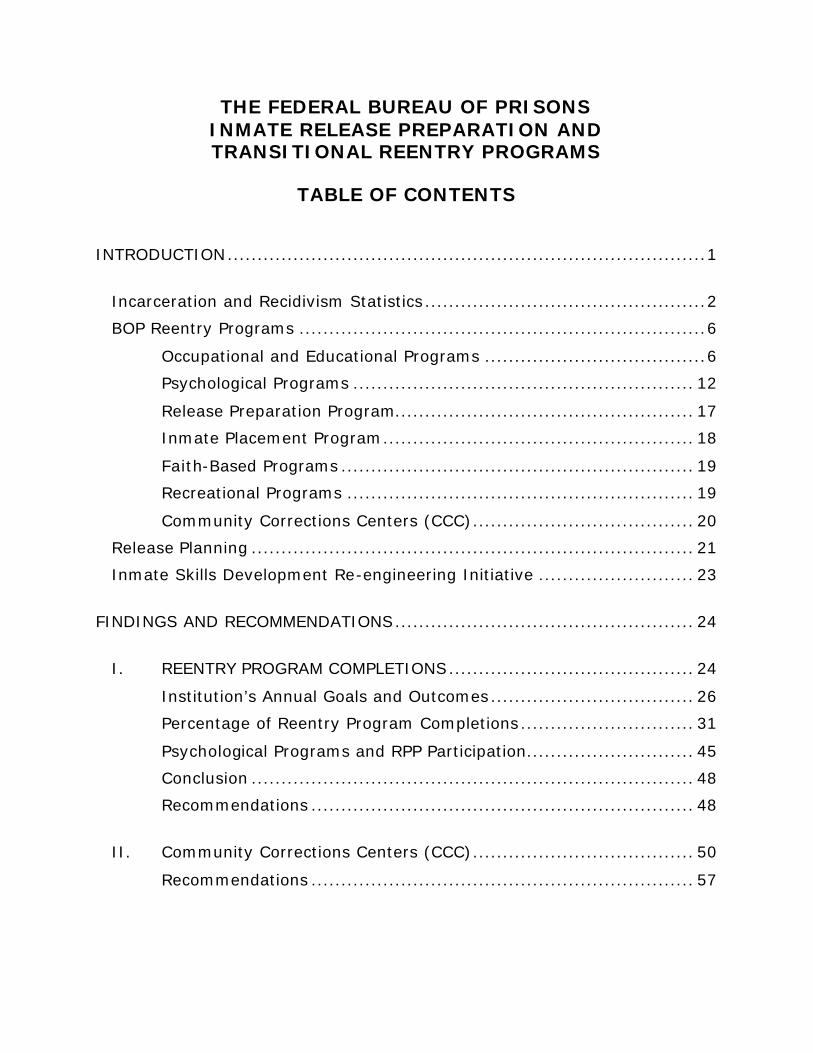
INTRODUCTION................................................................................1
Incarceration and Recidivism Statistics...............................................2
BOP Reentry Programs ....................................................................6
Occupational and Educational Programs .....................................6
Psychological Programs ......................................................... 12
Release Preparation Program.................................................. 17
Inmate Placement Program.................................................... 18
Faith-Based Programs ........................................................... 19
Recreational Programs .......................................................... 19
Community Corrections Centers (CCC)..................................... 20
Release Planning .......................................................................... 21
Inmate Skills Development Re-engineering Initiative .......................... 23
FINDINGS AND RECOMMENDATIONS.................................................. 24
I. REENTRY PROGRAM COMPLETIONS......................................... 24
Institution’s Annual Goals and Outcomes.................................. 26
Percentage of Reentry Program Completions............................. 31
Psychological Programs and RPP Participation............................ 45
Conclusion .......................................................................... 48
Recommendations ................................................................ 48
II. Community Corrections Centers (CCC)..................................... 50
Recommendations ................................................................ 57

APPENDIX I - STATEMENT ON COMPLIANCE WITH LAWS AND REGULATIONS............................................................................. 58
APPENDIX II - STATEMENT ON MANAGEMENT CONTROLS ...................... 59
APPENDIX III - OBJECTIVES, SCOPE, AND METHODOLOGY..................... 61
APPENDIX IV - ANALYSIS OF THE OCCUPATIONAL EDUCATION GOALS
AND OUTCOMES FY 2001 THROUGH FY 2002 .................................... 66
Occupational Education Completion Goals and Outcomes FY 2001 ......... 67
Occupational Education Completion Goals and Outcomes FY 2002 ......... 70
APPENDIX V - ANALYSIS OF THE GED GOALS AND OUTCOMES FY 2001.... 73
GED Completion Goals and Outcomes FY 2001................................... 74
APPENDIX VI - ANALYSIS OF THE ESL GOALS AND OUTCOMES
FY 2001 THROUGH FY 2002 ........................................................... 77
ESL Completion Goals and Outcomes FY 2001 ................................... 78
ESL Completion Goals and Outcomes FY 2002 ................................... 81
APPENDIX VII - ANALYSIS OF THE ACE GOALS AND OUTCOMES
FY 2001 THROUGH FY 2002 ........................................................... 84
ACE Completion Goals and Outcomes FY 2001................................... 85
ACE Completion Goals and Outcomes FY 2002................................... 88
APPENDIX VIII - ANALYSIS OF THE PARENTING GOALS AND
OUTCOMES FY 2001 THROUGH FY 2002........................................... 91
Parenting Completion Goals and Outcomes FY 2001............................ 92
Parenting Completion Goals and Outcomes FY 2002............................ 95
APPENDIX IX - ANALYSIS OF THE PERCENT PARTICIPATION GOALS
AND OUTCOMES FY 2002............................................................... 98
Percent Participation Goals and Outcomes FY 2002............................. 99
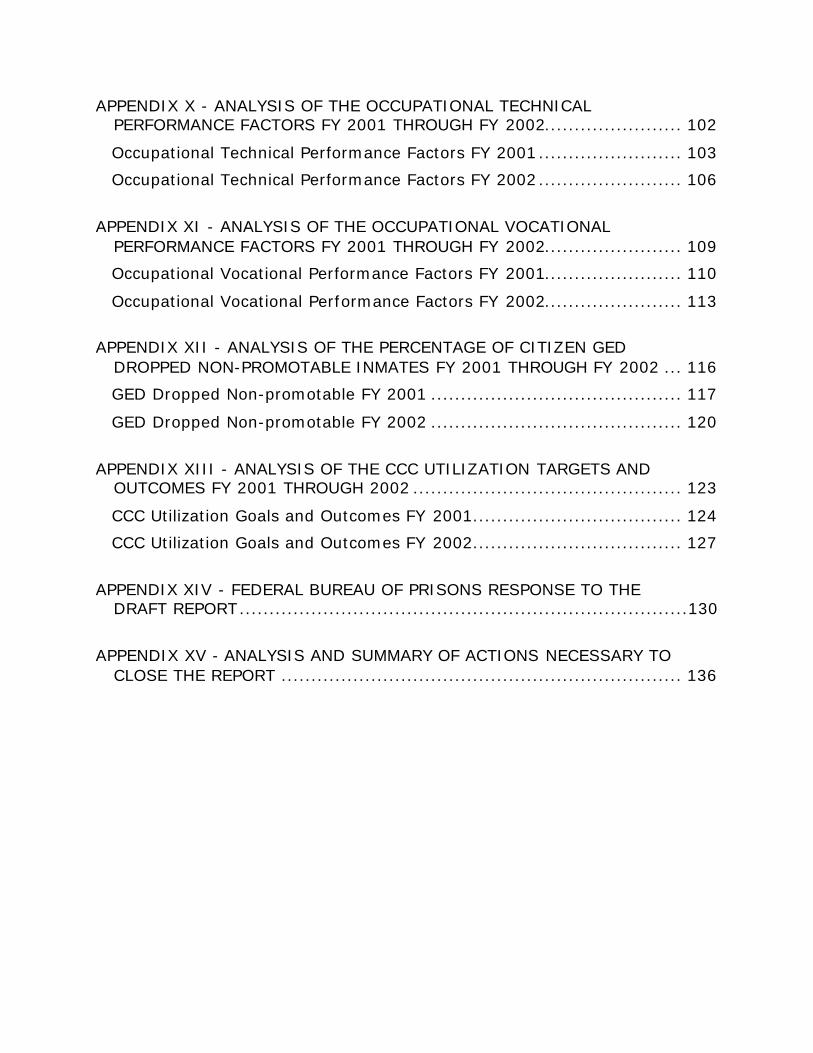
APPENDIX X - ANALYSIS OF THE OCCUPATIONAL TECHNICAL PERFORMANCE FACTORS FY 2001 THROUGH FY 2002....................... 102
Occupational Technical Performance Factors FY 2001........................ 103
Occupational Technical Performance Factors FY 2002........................ 106
APPENDIX XI - ANALYSIS OF THE OCCUPATIONAL VOCATIONAL
PERFORMANCE FACTORS FY 2001 THROUGH FY 2002....................... 109
Occupational Vocational Performance Factors FY 2001....................... 110
Occupational Vocational Performance Factors FY 2002....................... 113
APPENDIX XII - ANALYSIS OF THE PERCENTAGE OF CITIZEN GED
DROPPED NON-PROMOTABLE INMATES FY 2001 THROUGH FY 2002 ... 116
GED Dropped Non-promotable FY 2001 .......................................... 117
GED Dropped Non-promotable FY 2002 .......................................... 120
APPENDIX XIII - ANALYSIS OF THE CCC UTILIZATION TARGETS AND
OUTCOMES FY 2001 THROUGH 2002 ............................................. 123
CCC Utilization Goals and Outcomes FY 2001................................... 124
CCC Utilization Goals and Outcomes FY 2002................................... 127
APPENDIX XIV - FEDERAL BUREAU OF PRISONS RESPONSE TO THE
DRAFT REPORT...........................................................................130
APPENDIX XV - ANALYSIS AND SUMMARY OF ACTIONS NECESSARY TO
CLOSE THE REPORT ................................................................... 136
1
INTRODUCTION
During Fiscal Year (FY) 2000 through FY 2002, 74,401 inmates were released from federal custody.6 Based on the most recent statistics available on federal inmates from the Department of Justice (DOJ) Bureau of Justice Statistics (BJS), approximately 16 percent of federal inmates released will return to federal prisons within 3 years.7 Further, according to the most recent study conducted by the Federal Bureau of Prisons (BOP) on recidivism rates for federal inmates, approximately 41 percent of federal inmates released to the community were rearrested or had their parole revoked within 3 years.8
One strategic objective of the BOP is to “provide productive work,
education, occupational training, and recreational activities which prepare inmates for employment opportunities and a successful reintegration upon release, and which have a clear correctional management purpose which minimizes inmate idleness.”9
According to the DOJ Strategic Plan, since a majority of inmates will be
released at some point, it is important to provide them the means to increase their chances for successful reentry into society. The Strategic Plan states that the BOP has a responsibility to offer program opportunities to inmates that provide the skills necessary for successful reentry into society. Therefore, in addition to the basic services (such as clothing, food, and access to health care), the BOP provides inmates with educational, vocational, recreational, religious, and psychological programs. The BOP’s inmate programs are geared, ultimately, toward preparing inmates for eventual release.
6 The Federal Bureau of Prisons (BOP), Key Indicators, A Strategic Support System
of the Federal Bureau of Prisons, Volume 14, Number 1, January 2003. The BOP’s Key Indicators system provides statistical information related to inmate programs, strategic goals and outcomes, inmate population characteristics, etc., to assist in the management and monitoring of the BOP and its institutions.
7 The DOJ BJS, Special Report, Offenders Returning to Federal Prisons, 1986-97, dated September 2000.
8 The BOP, Recidivism Among Federal Prisoners Released in 1987, dated August 4, 1994.
9 The BOP, State of the Bureau 2002, Accomplishments and Goals.
2
The DOJ Office of the Inspector General (OIG) conducted this audit to evaluate whether the BOP ensures that federal inmates participate in its programs designed to prepare them for successful reentry into society. The objectives of our audit were to determine whether the BOP ensures that:
• each of the BOP’s institutions maximize the number of inmates that complete programs designed to prepare them for reentry into society including occupational, educational, psychological, and other programs; and
• all eligible inmates are provided the opportunity to transition through a
Community Correction Center (CCC) in preparation for reentry into society.
In conducting the audit, we interviewed officials from the BOP Central
Office and 3 of the 6 BOP regional offices. We conducted fieldwork or obtained information through questionnaires from 27 institutions. Additionally, we examined reported data for 82 institutions including the Administrative Maximum Security (ADX) institution, and all Federal Correctional Institutions (FCI), Federal Prison Camps (FPC), and United States Penitentiaries (USP). We excluded Federal Detention Centers (FDC), Federal Medical Centers (FMC), Federal Transfer Centers (FTC), Metropolitan Correctional Centers (MCC), Medical Centers for Federal Prisoners (MCFP), and Metropolitan Detention Centers (MDC) because of the unique missions of these institutions.
Additional information related to our audit objectives, scope, and
methodology appears in Appendix III of this report.
Incarceration and Recidivism Statistics
According to a recent BJS report, as of the end of 2001, approximately 4.3 million U.S. residents were formerly federal, state, and local prison inmates, and an additional 1.3 million are currently confined in prisons.10 Between 1974 and 2001, the number of U.S. adult residents that had ever served time in prison, including current prison inmates, increased by about 3.8 million.
10 The DOJ BJS, Special Report, Prevalence of Imprisonment in the U.S. Population,
1974-2001, dated August 2003.
3
There are four measures generally accepted for determining recidivism: rearrest, reconviction, resentence, and reconfinement in prison. As a part of our audit, we reviewed government and private studies conducted on recidivism; however, we found no studies on recidivism of federal inmates that are comprehensive and current.11 The most recent data available from the BJS revealed the following statistics.
• About 61 percent of federal inmates had been convicted of a prior offense, while 39 percent had no previous prison sentence.12 Of the current federal inmates with prior convictions, 23 percent had current or prior violent convictions, and 38 percent had current or prior nonviolent convictions.
• Additionally, 76 percent of state inmates had been convicted of prior
offenses, while 24 percent had no previous prison sentence.
• Approximately 16 percent of federal inmates released to the community will return to federal prisons within 3 years.13 Information was not available on the number of federal inmates released to the community who were subsequently imprisoned for a state offense.
• The proportion of offenders returning to federal prisons within 3 years
increased from 11 percent in 1986 to 19 percent in 1994. Of the offenders returning to prison between 1986 and 1997, 54 percent returned within 1 year of release, 34 percent within 2 years, and 12 percent within 3 years.
• The rate at which federal inmates return to federal prison increases
with the amount of time that they served prior to release.14 Overall,
11 The most recent study on recidivism of federal inmates, the DOJ BJS Special Report Offenders Returning to Federal Prisons, 1986-97, dated September 2000, does not include information on federal inmates released to the community who were subsequently imprisoned for a state offense. Further, the study does not contain any information on inmates who were rearrested or reconvicted. The most recent comprehensive study on recidivism rates of federal inmates, the BOP’s Recidivism Among Federal Prisoners Released in 1987, dated August 4, 1994, was issued 9 years ago and was based on inmates released over 16 years ago.
12 The DOJ BJS, Sourcebook of Criminal Justice Statistics, 2000.
13 The DOJ BJS, Special Report, Offenders Returning to Federal Prisons, 1986-97, dated September 2000.
14 The DOJ BJS, Special Report, Offenders Returning to Federal Prisons, 1986-97, dated September 2000.
4
14 percent of inmates that served sentences of less than 1 year returned to federal prison, as compared to 25 percent of inmates that served sentences of more than 5 years.
• About 32 percent of federal inmates originally convicted of violent
offenses return to federal prison within 3 years of release, as compared to 13 percent of drug offenders.
The most recent BOP study on recidivism rates for federal inmates
indicates that about 41 percent of federal inmates released to the community were rearrested or had their parole revoked within 3 years.15 Of the 41 percent of federal inmates that recidivated, 11 percent were rearrested or had their parole revoked within 6 months after release, and 20 percent within 1 year after release.
This BOP study also identifies the variables that correlate to the likelihood that a federal inmate released to the community will recidivate. Specifically, the major findings of the study concluded that:
• Male and female inmates recidivated at about the same rate.
Forty-one percent of male inmates released recidivated, as compared to 40 percent of female inmates.
• Older inmates were less likely to recidivate than younger inmates.
Fifteen percent of inmates released that were 55 years of age or older recidivated, as compared to 57 percent of inmates that were 25 years of age or younger.
• Inmates that were employed full time or attended school for at least
6 months within 2 years prior to incarceration were less likely to recidivate than those who did not. Twenty-seven percent of inmates released who were employed full time or attended school for at least 6 months within 2 years prior to incarceration recidivated, as compared to 60 percent of inmates who did not.
• Inmates that were living with a spouse after release were less likely to
recidivate than inmates with other living arrangements.
15 The BOP, Recidivism Among Federal Prisoners Released in 1987, dated August 4,
1994. It should be noted that federal inmates that are rearrested are not necessarily reincarcerated in federal prisons, which is why the recidivism rate based on rearrest is significantly higher than the recidivism rate based on federal inmates that are reincarcerated in federal prisons.
5
Twenty percent of inmates released were living with a spouse recidivated, as compared to 48 percent of inmates with other living arrangements.
As demonstrated by the above studies, there are many variables
associated with the likelihood that an inmate will recidivate and most of these variables are outside of the BOP’s control. Therefore, in our judgment, it becomes important for the BOP to focus its resources and programs on those variables that are within its control while the inmate is in their custody to help decrease an inmate’s chance of recidivism. For example, the same BOP study also found a positive correlation between recidivism and actions that relate to some extent to the programs (discussed later in this report) offered by the BOP. Specifically,
• Inmates that successfully completed one or more educational programs every 6 months while incarcerated were less likely to recidivate than inmates who did not participate. Thirty-six percent of inmates released that successfully completed one or more educational programs every 6 months while incarcerated recidivated, as compared to 44 percent of inmates who did not participate.
• Inmates who had arranged for employment prior to release were less
likely to recidivate than inmates who did not. Twenty-eight percent of inmates released that had arranged for employment prior to release recidivated, as compared to 54 percent of inmates who did not.
• Inmates transitioned into the community through a CCC were less
likely to recidivate than inmates released directly to the community. Thirty-one percent of inmates released that were transitioned into the community through a CCC recidivated, as compared to 51 percent of inmates that were released directly to the community.
As a part of our audit, we reviewed additional studies on the
effectiveness of reentry programs to determine the types of programs that are most likely to prepare inmates for successful reentry into society. We compared these studies to the programs offered by the BOP. Based on our comparison, we determined that the BOP offers a full range of occupational, educational, psychological, and other programs that are shown to prepare inmates for successful reentry into society. The studies as they relate to the types of programs offered by the BOP are discussed in the following sections of this report.
6
BOP Reentry Programs For FY 2003, the BOP received funding of $216 million for all inmate
programs, which equates to about 5 percent of the BOP’s $4.5 billion total agency budget.16 Of the $216 million budgeted for inmate programs, $148 million was designated for reintegration efforts that include occupational and educational programs, psychological support programs, release preparation programs, and other programs that are geared towards preparing inmates for reentry into society and increasing post-release employment opportunities. This amount represents an increase of $23 million (19 percent) of the total BOP reintegration funding from FY 2002.
The following sections provide an overview of each of the reentry
programs offered by the BOP and the studies on recidivism that we found are associated with these types of program. Almost all of the studies found a positive correlation between the kind of program offered by the BOP and a reduction in recidivism. It should also be noted that several of the programs offered by the BOP are similar to programs or services that are offered by the community to non-inmates, such as General Educational Development (GED) and English-as-a-Second Language (ESL).
Occupational and Educational Programs
The following studies support a link between occupational and educational programs and successful reentry of inmates upon release into the community.
• The Practice and Promise of Prison Programming17 - The results of this study indicate that the majority of research studies that evaluated prison programming support the hypothesis that inmate participation in occupational and educational programs leads to a reduction in recidivism and an increase in employment opportunities, as shown in the following table.
16 This amount does not include funding for Federal Prison Industries (FPI), which is
self funded.
17 The Urban Institute, Justice Policy Center, The Practice and Promise of Prison Programming, dated May 2002.

7
THE EFFECTIVENESS OF CORRECTIONAL PROGRAMMING
Occupational Programs • 9 of 13 studies found participants were less likely to
recidivate
• 5 of 7 studies found participants were more likely to be employed after release
Pre-College Education (Elementary/Secondary/GED) • 9 of 14 studies found participants were less likely to
recidivate
• 3 of 4 studies found participants were more likely to be employed after release
College-Level Education • 10 of 14 studies found an inverse relationship
between college education and recidivism
• 3 of 3 studies found participants more likely to be employed after release
Source: The Urban Institute, Justice Policy Center, The Practice and Promise of Prison Programming, dated May 2002.
• PREP: Training Inmates through Industrial Work Participation, and Vocational and Apprenticeship Instruction18 - This study was designed to evaluate the impact of prison work experience and occupational and apprenticeship training on an inmate’s behavior upon release into the community. The results of this study indicate that prison programs have a positive impact on post-release employment and recidivism. The inmates who worked in prison industries or participated in an occupational or apprenticeship training program were 14 percent more likely to be employed 12 months after release than statistically similar inmates who did not participate. Additionally, inmates who worked in prison industries or participated in an occupational or apprenticeship training program were 35 percent less likely to recidivate within the first 12 months (6.6 percent vs. 10.1 percent). Further, inmates who worked in prison industries were 24 percent less likely to recidivate in the long term (8 to 12 years),
18 The BOP, Office of Research and Evaluation, PREP: Training Inmates through
Industrial Work Participation, and Vocational and Apprenticeship Instruction, dated September 24, 1996.
8
and inmates who participated in an occupational or apprenticeship program were 33 percent less likely to recidivate in the long term.
• Three State Recidivism Study19 - The preliminary results of this
study support the hypotheses that inmates who participate in educational programs have lower rearrest, reconviction, and reincarceration rates than those offenders that do not participate. The study found that: (1) 48 percent of inmates who participated in educational programs were rearrested, as compared to 57 percent of those who did not participate; (2) 27 percent of inmates who participated in educational programs were reconvicted, as compared to 35 percent of inmates who did not participate; and (3) 22 percent of inmates who participated in educational programs were reincarcerated, as compared to 31 percent of inmates who did not participate.
• Recidivism Among Federal Prisoners Released in 198720 - This study found that among other characteristics related to recidivism, inmates that successfully completed one or more educational programs every 6 months while incarcerated were less likely to recidivate than inmates who did not participate. Overall, 36 percent of inmates released that successfully completed one or more educational programs every 6 months while incarcerated recidivated, as compared to 44 percent of inmates who did not participate.
• Prison Education Program Participation and Recidivism: A Test
of the Normalization Hypothesis21 - This study concludes that there is a three-way relationship between inmate participation in educational programs, the level of education achieved while incarcerated, and recidivism. The study found that a much larger percentage of persons sentenced to federal prisons (43 percent) are in need of a high school degree or equivalent to function adequately in society than the general U.S. population (14 percent). The study also found that 30 percent of inmates who completed an average of 0.5 education courses per each 6 months of confinement recidivated, as compared to 45 percent of inmates who completed no education courses during confinement.
19 The U.S. Department of Education, Office of Correctional Education, Three State
Recidivism Study, Preliminary Summary Report, dated September 30, 2001.
20 The BOP, Office of Research and Evaluation, Recidivism Among Federal Prisoners Released in 1987, dated August 4, 1994.
21 The BOP, Office of Research and Evaluation, Prison Education Program Participation and Recidivism: A Test of the Normalization Hypotheses, dated May 1995.

9
We compared the types of reentry programs offered by the BOP with the studies and research noted above and found that the BOP offers a wide range of occupational and educational programs that correspond to the types of activities shown to help prepare inmates for successful reentry into society, as described below.
• Occupational Programs – BOP policy requires that each institution
provide occupational programs that allow interested inmates the opportunity to obtain marketable skills to enhance employment opportunities after release into the community.22 These occupational programs also contribute to the operation and maintenance of the BOP institutions. Not all occupational programs are offered at each institution; however, the wide variety of occupational programs offered to inmates by the BOP includes those listed in the following table.
Occupational Programs
• Computer Skills
• Business Management
• Computer Aided Drafting
• Culinary Arts
• Housekeeping
• Building Maintenance
• Auto and Small Engine Mechanics
• Dentistry
• Horticulture and Landscaping
• Barbering and Cosmetology
• Small Appliance Repair
• Construction and Carpentry
• Masonry
• Plumbing, Electrical and Welding
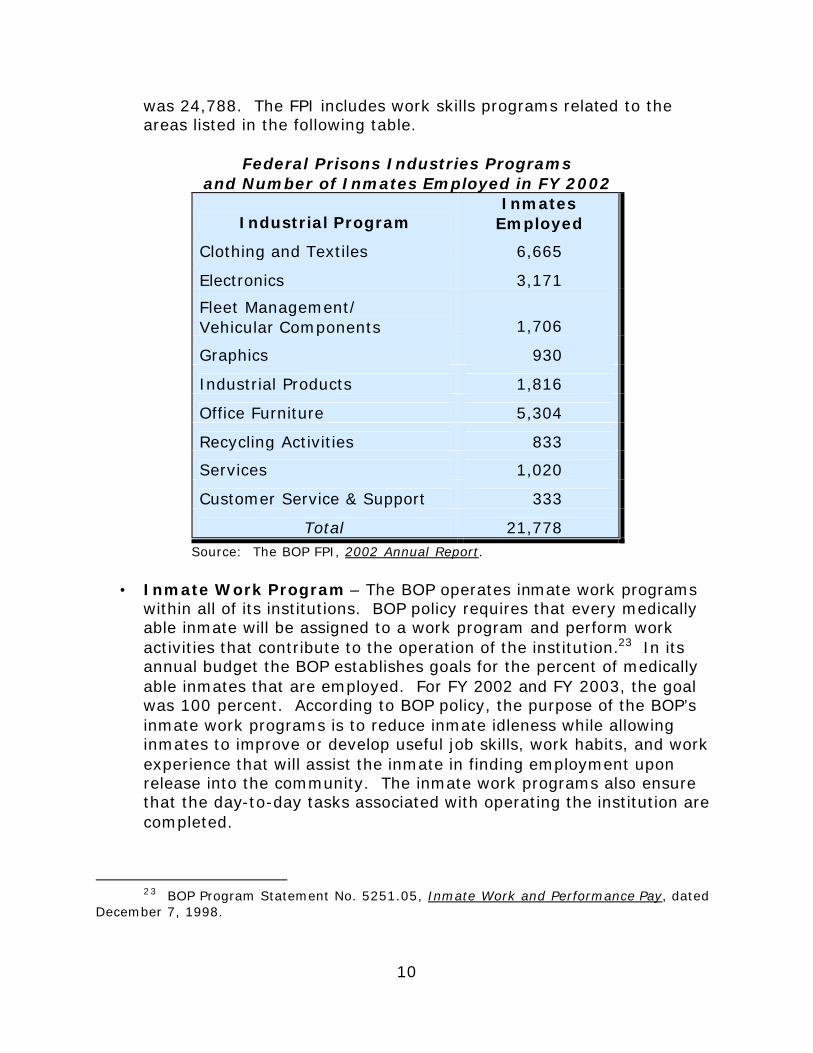
• Federal Prison Industries – According to the Federal Prison
Industries, Inc. (FPI) Annual Report, “It is the mission of the FPI to employ and provide job skills training to the greatest practicable number of inmates confined within the BOP; [and] contribute to the safety and security of our Nation’s federal correctional facilities by keeping inmates constructively occupied . . .” In its annual budget the BOP establishes goals for the number of inmates employed by the FPI. During FY 2002, the number of inmates employed by the FPI was 21,778 (13 percent of total BOP inmates), and the goal for FY 2003
22 BOP Program Statement No. 5300.18, Occupational Education Programs, dated
December 23, 1996.
10
was 24,788. The FPI includes work skills programs related to the areas listed in the following table.
Federal Prisons Industries Programs
and Number of Inmates Employed in FY 2002
Industrial Program Inmates
Employed
Clothing and Textiles 6,665
Electronics 3,171
Fleet Management/ Vehicular Components 1,706
Graphics 930
Industrial Products 1,816
Office Furniture 5,304
Recycling Activities 833
Services 1,020
Customer Service & Support 333
Total 21,778 Source: The BOP FPI, 2002 Annual Report.
• Inmate Work Program – The BOP operates inmate work programs
within all of its institutions. BOP policy requires that every medically able inmate will be assigned to a work program and perform work activities that contribute to the operation of the institution.23 In its annual budget the BOP establishes goals for the percent of medically able inmates that are employed. For FY 2002 and FY 2003, the goal was 100 percent. According to BOP policy, the purpose of the BOP’s inmate work programs is to reduce inmate idleness while allowing inmates to improve or develop useful job skills, work habits, and work experience that will assist the inmate in finding employment upon release into the community. The inmate work programs also ensure that the day-to-day tasks associated with operating the institution are completed.
23 BOP Program Statement No. 5251.05, Inmate Work and Performance Pay, dated
December 7, 1998.

11
• Literacy Program - Individuals without a basic level of education frequently encounter serious difficulty in obtaining employment. Therefore, the BOP requires that each inmate should have the opportunity to complete a literacy program leading to a GED certificate and/or high school diploma.24 The intent of this policy is to provide inmates with the basic literacy skills necessary to compete for employment.
• English-as-a-Second Language Program - Pursuant to federal
statute, limited English proficient inmates confined in federal institutions are required to attend an ESL program until they can function at the equivalent of the eighth-grade level on a nationally recognized education achievement test.25 The BOP also requires that inmates with limited English proficiency skills will be afforded the opportunity to enhance their communication skills through its ESL programs.26
• Adult Continuing Education Programs – The BOP offers a variety of
Adult Continuing Education (ACE) programs in formal instructional classes that provide inmates with learning in areas that may be of special interest. Inmates rather than education staff members teach many ACE courses, which enables the BOP to offer a large number of these courses. The type of ACE programs offered to inmates by the BOP includes those listed in the table on the following page.
24 BOP Program Statement No. 5300.21, Education, Training and Leisure Time
Program Standards, dated February 18, 2002.
25 The Crime Control Act of 1990, codified in 18 U.S.C § 3624 (f).
26 BOP Program Statement No. 5350.24, English-as-a-Second Language Program, dated July 24, 1997.

12
Adult Continuing Education Programs
• Foreign Languages
• Mathematics
• Commercial Drivers License
• Writing
• Finance
• History
• Legal Research
• Literature
• Public Speaking
• Chess
• Motivation
• Cardiopulmonary Resuscitation (CPR)
• Typing
• Sign Language
• Floral Design
• Health
• Life Skills
• Time Management
• Postsecondary Education Programs – Postsecondary education programs generally include correspondence courses provided through junior or community colleges, 4-year colleges and universities, and postsecondary vocational or technical schools. Inmates are expected to pay the tuition for these postsecondary programs from personal funds or other sources such as scholarship awards provided through FPI programs.
• Parenting Program – The BOP requires that parenting programs be
provided in all institutions.27 The BOP parenting programs are expected to promote and reinforce positive relationships, family values, and mutual support among inmates and their spouses that may be sustained after the inmate is released into the community.
Psychological Programs
In addition to occupational and educational programs, BOP policy
requires that psychology services within each institution be sufficient to ensure that every inmate with a documented need or interest in psychological treatment has access to a level of care comparable to that
27 BOP Program Statement No. 5355.03, Parenting Program Standards, dated
January 20, 1995.
13
offered in the community.28 Through its psychology services, the BOP seeks to create an environment where inmates can develop habits and skills that will make them more productive members of society upon release to the community.
According to the BOP, the main priority of the BOP’s psychology services is acute crisis intervention. However, the BOP also provides counseling services, including individual or group treatment. At a minimum, a psychology services staff member must screen all inmates entering into a BOP institution within 14 days (30 days for transferred inmates). Additionally, the BOP offers the following psychological programs.
• Drug Abuse Education Program – This program provides inmates
with specific instruction on the risks involved with drug use and abuse, and presents strategies toward living a drug free lifestyle while introducing the inmate to the concepts of drug treatment and motivating the inmate to enter and participate in the BOP’s Residential Drug Abuse Treatment Program.
• Residential Drug Abuse Treatment Program – This program is
designed for intensive drug abuse treatment. Inmates are housed separately in residential drug abuse treatment units for up to 12 months. The specialized drug units provide extensive assessment, treatment planning, and individual and group counseling.
• Non-Residential Drug Abuse Treatment Program – This program
consists of both group and individual therapy delivered through the psychology services department in each institution. This program offers flexibility to inmates who are not eligible for or do not choose to enter the BOP’s Residential Drug Abuse Treatment Program. Non-residential treatment services are also provided as a follow-up to the BOP’s Residential Drug Abuse Treatment Program while inmates are awaiting release.
• Transitional Drug Abuse Treatment Program – This program was
developed for successful Residential Drug Abuse Treatment Program graduates who are released to the community under BOP custody. The continuation of treatment, through community-based drug treatment, is required of these inmates during their transition back
28 BOP Program Statement No. 5310.12, Psychology Services Manual, dated
August 30, 1993.
14
into society. Additionally, the community transition program now accepts inmates who have not participated in a Residential Drug Abuse Treatment Program but have later been identified to be in need of drug abuse treatment.
• Sex Offender Management Plan – The Sex Offender Management
Plan is a comprehensive management strategy for all sex offenders incarcerated in BOP institutions. The purpose of the program is to increase institution security and ensure effective transition of inmates into the community.
• Sex Offender Treatment Program – The Sex Offender Treatment
Program is a residential program offered at FCI Butner to help sex offenders manage their sexual deviance in order to reduce recidivism. The program is based on the notion that, while there is probably no permanent cure, criminal sexual behavior can be effectively managed in most cases through a combination of treatment and intensive supervision.
• Challenge, Opportunity, Discipline and Ethics (CODE) Program –
The CODE program is a residential treatment program offered in high security institutions designed for inmates whose psychological distress, mental illness or neurocognitive deficits interfere with the inmate’s ability to adjust satisfactorily to incarceration. The program is designed to teach inmates basic core values such as respect for self and others, responsibility for personal actions, honesty in relationships with others, and tolerance towards the actions of others.
• E-CODE Program – The E-CODE program is an intensive, multi-
phase, non-residential and residential treatment program for maximum security inmates. The purpose of the program is to teach inmates self-discipline, the value of conforming to pro-social lifestyles, and changing negative thoughts and behaviors that lead to incarceration-related problems. The program is designed to manage and treat violent and predatory inmates housed at USP Marion.
• Impulsive-Aggressive CODE Pilot – The Impulsive-Aggressive
CODE Pilot is a residential program designed to identify inmates with impulsive-aggressive disorders and to provide effective treatment and management to reduce their maladaptive behavior.
15
• Bureau Responsibility and Values Enhancement Program (BRAVE) – The BRAVE program was established in response to the BOP’s research which revealed that medium security inmates 30 years old or younger have the greatest difficulty adapting to institution rules. The goals of the BRAVE program are to: (1) assist in the adjustment of medium security inmates entering the BOP custody for the first time; (2) improve institutional adjustment and reduce incidents of misconduct through organized activities that promote positive behavior; and (3) identify psychological disorders that may contribute to criminal activity and poor institutional adjustment, and provide appropriate clinical intervention.
• Skills Program – The Skills Program is a specialized treatment
program for inmates that have significant learning and social functioning deficits. The Skills Program is a cooperative working arrangement between unit, education, recreation, and psychology staff. The primary program components include: (1) assessment and orientation, (2) intensive treatment that includes relational, academic, and wellness skill building, and (3) transitional planning. Additionally, the Skills Program includes the use of well-screened inmate mentors.
• New Pathways Program – The New Pathways Program was
established in response to research concluding that many women with criminal and substance histories also have a history of sexual, psychological and/or physical abuse, either as children or adults. The objectives of the New Pathways Program are to treat the trauma resulting from sexual, psychological, or physical abuse and to assist female inmates in developing the skills that will lead to independence and healthy decision making.
The following studies support a link between the BOP’s psychological
programs, inmate misconduct, and successful reentry of inmates into the community.
• Triad Drug Treatment Evaluation Project, Final Report of
Three-Year Outcomes29 - This report is based on inmates who had been released from BOP custody for 3 years. The report revealed that male inmates who completed the Residential Drug Abuse Treatment Program and had been released to the community for a minimum of
29 The BOP, Triad Drug Treatment Evaluation Project, Final Report of Three-Year
Outcomes, dated September 2000.
16
3 years were 16 percent less likely to be rearrested and use drugs than those inmates who had not received treatment. Female inmates who completed the Residential Drug Abuse Treatment Program and had been released to the community for a minimum of 3 years were 18 percent less likely to be rearrested, and 17 percent less likely to use drugs, than those inmates who had not received treatment.
• Technical Report for Preliminary Results From the Evaluation of
the Beckley Responsibility and Values Enforcement (BRAVE) Program30 - The major finding of this evaluation was that inmates who participated in the BRAVE program had substantially lower rates of misconduct when compared to all other inmates who met the criteria used to select participants for the program that were incarcerated in the BOP during the same time period. The study found that inmates who participated in the BRAVE program, overall, had an average misconduct rate that was 26 percent lower than the comparison group. The study concluded that since inmates are directly designated into the BRAVE program upon incarceration, the lower misconduct rate could be attributed to the program itself.
The study also found that 87 percent of the inmates successfully completed the program and the rate of misconduct among inmates successfully completing the program was 55 percent lower than the comparison group.
• Misconduct Rates by Drug Abuse Program (DAP) graduates in USPs31 - This review of misconduct rates among DAP graduates revealed a substantial decline in the rate of misconduct among USP inmates after graduation. Overall, the rate of misconduct among these inmates was 49 percent lower after they had graduated from DAP. For these inmates, the rate of violent offenses was reduced by 46 to 54 percent depending on the level of offense, the rate of drug offenses was reduced by 57 percent, the rate of alcohol offenses was reduced by 35 percent, the rate of refusal/insubordination offenses was reduced by 55 percent, and the rate of other offenses was reduced by 44 percent.
30 The BOP, Office of Research and Evaluation, Technical Report for Preliminary
Results from the Evaluation of the Beckley Responsibility and Values Enhancement (BRAVE) Program, (not dated).
31 The BOP, Office of Research and Evaluation, memorandum, Misconduct rates by DAP graduates in USPs, dated October 8, 1996.
17
Release Preparation Program
To prepare inmates for final release into the community, the BOP implemented the Release Preparation Program (RPP).32 The purpose of the RPP is to provide inmates with the basic information and contacts necessary for successful reentry into society and the work force. The BOP requires each institution to have a RPP for all sentenced inmates reentering into the community, with the exception of administrative maximum security institutions. Each institution is responsible for developing the curriculum for its RPP to suit the specific needs of its inmates. However, the RPP must be based on core topics and include courses for each of the following six broad categories: (1) health and nutrition, (2) employment, (3) personal finance and consumer skills, (4) information and community resources, (5) release requirements and procedures, and (6) personal growth and development. BOP policy requires that eligible inmates enroll in the RPP no later than 30 months prior to release to the community or a CCC.
The expected results of the RPP are that:
• inmates will participate in the RPP to enhance their chances for
successful reintegration into society;
• the BOP will provide releasing inmates with information, programs, and services by entering into partnerships with private industry, other federal agencies, community services providers, and CCCs; and
• inmate recidivism will be reduced through participation in the RPP and contact with community resources.
All sentenced inmates committed to BOP custody are required to
participate in the RPP except those: (1) committed for study and observation; (2) committed to the BOP serving a sentence of 6 months or less; (3) committed to the BOP with a sentence of "death"; (4) confined in an administrative maximum security institution; or (5) deportable aliens.
The BOP requires that its unit staff strongly encourage and support inmate participation in the institution’s RPP. Inmates who refuse to participate in the RPP are considered to lack the responsibility necessary for
32 BOP Program Statement No. 5325.06, Release Preparation Program, dated
March 4, 2002.
18
CCC placement and will not ordinarily participate in these types of community-based programs.
The BOP has not conducted any studies related to successful
participation in its RPP and recidivism. Inmate Placement Program
The BOP’s Inmate Placement Program was established because many inmates do not have basic skills necessary to secure and retain employment after release. Many BOP institutions hold mock job fairs at which inmates are interviewed by recruiters from real companies. The mock job fairs assist inmates in developing interviewing skills. The Inmate Placement Program also assists inmates in preparing employment portfolios that include a resume, education certificates, diplomas, transcripts, and other documents necessary for employment.
The BOP contracted for three studies of its mock job fairs conducted at FCI Terminal Island, FPC Phoenix, and FCI Big Spring.33 All three studies generally concluded that inmate participation in mock job fairs: (1) increased their awareness of employment opportunities that are available to them upon release into the community, (2) provided them with tools to assist them in finding employment upon release into the community, and (3) increased their self-confidence and self-esteem. The studies also concluded that after participating in the mock job fairs, employers perceived inmates as confident, motivated, and employable, rather than as “ex-cons” and “felons.”
The BOP Inmate Placement Program Branch also conducted surveys related to inmates that participated in mock job fairs prior to their release. The surveys were conducted by sending questionnaires to the probation officers of inmates that had participated in a mock job fair during incarceration. The BOP survey results revealed that as of June 2001, 69 percent of inmates had jobs with an average monthly income of $1,288, and only 7 percent of inmates had been reincarcerated. The second year study revealed that as of May 2002, 61 percent of the inmates had jobs with an average monthly income of $1,552, and again only 7 percent of inmates
33 Workplace Learning Resource Center, First Annual Mock Job Fair, “Gateway to Success, Federal Correctional Institution Terminal Island, dated December 15, 1998; Development Systems Corporation, Mock Job Fair, FCI Big Spring, dated May 17, 1999; and Development Systems Corporation, Mock Job Fair, FPC Phoenix, dated May 26, 1999.

19
had been reincarcerated. The surveys of inmates participating in mock job fairs do not include an scientific correlation between inmate participation in mock job fairs and post-release employment. Further, the surveys do not include a comparison group consisting of inmates who did not participate in a mock job fair during incarceration.
Faith-Based Programs
One BOP Strategic Objective is to “ensure reasonable accommodations exist for all recognized faith groups.”34 Further, BOP policy requires its institutions to provide inmates of all faith groups with reasonable and equitable opportunities to pursue religious beliefs and practices, within the constraints of budgetary limitations and consistent with the security level and orderly operation of the institution.35 The BOP provides religious services and meeting times for numerous faith groups. Inmates can also participate in self-improvement forums such as scripture study and religious workshops. Additionally, the BOP also offers the following residential faith-based program.
• Life Connections Program – The BOP recently established the Life Connections Program. According to the BOP, the purpose of the program is to foster personal growth and responsibility, and to use the inmate’s faith commitment “to bring reconciliation and restoration to the relationship among the victim, inmate, and the community.” Additionally, inmates are connected with faith-based support groups in the community in which they will be released. The program goals are to change behavior, improve adjustment to incarceration, and reduce recidivism. The BOP has established a FY 2003 goal of 545 inmates participating in a Life Connections program in its budget.
Recreational Programs
BOP policy requires its institutions to encourage inmates to use their
leisure time effectively by offering a variety of activities, including sports,
34 The BOP, State of the Bureau 2002, Accomplishments and Goals.
35 BOP Program Statement No. 5360.08, Religious Beliefs and Practices, dated May 25, 2001.
20
wellness, arts, and hobby crafts.36 The expected results of offering recreational activities to inmates are that the programs will: (1) keep inmates occupied and reduce idleness; (2) enhance the physical, emotional, and social well being of inmates; (3) encourage and assist inmates in adopting healthy lifestyles through participation in physical fitness and health education programs; and (4) decrease the need for inmate medical treatment.
Community Corrections Centers (CCC)
In addition to programs offered at its institutions, the BOP provides services that assist inmates in transitioning from incarceration into the community. The primary transitional service is the placement of inmates in CCCs, also known as halfway houses. BOP policy requires that eligible inmates should be released to the community through a CCC, unless there is some impediment outlined by the BOP.37
According to the BOP, during the transitional period at a CCC inmate activities are closely monitored while inmates are provided with a suitable residence, structured programs, job placement, and counseling. Further, all CCCs offer drug testing and counseling for alcohol and drug-related problems. During their stay, inmates are required to pay a subsistence charge to defer the cost of their confinement in a CCC (25 percent of their gross income, not to exceed the average daily cost of their CCC placement).
We found that the following studies support a link between the BOP’s transitional services offered through CCC placement and recidivism.
• PREP: Training Inmates through Industrial Work Participation, and Vocational and Apprenticeship Instruction38 - The results of this study indicate a link between inmates who transition into the community through the BOP’s CCC placement program and post-release employment. The study found that 87 percent of inmates
36 BOP Program Statement No. 5370.10, Recreation Programs, Inmate, dated
February 23, 2000.
37 BOP Program Statement No. 7310.04, Community Corrections Center (CCC) Utilization and Transfer Procedure, dated December 16, 1998.
38 The BOP, Office of Research and Evaluation, PREP: Training Inmates through Industrial Work Participation, and Vocational and Apprenticeship Instruction, dated September 24, 1996.
21
who transitioned into the community through a CCC achieved full-time employment, as compared to 62 percent of inmates who were released directly into the community. Further, an additional 9 percent of inmates who transitioned into the community through a CCC achieved day labor, as compared to 1 percent of inmates who were released directly into the community.
• Recidivism Among Federal Prisoners Released in 198739 - This
study found that among other characteristics related to recidivism, inmates transitioned into the community through a CCC were less likely to recidivate than inmates released directly to the community. Thirty-one percent of inmates that were transitioned into the community through a CCC recidivated, as compared to 51 percent of inmates that were released directly to the community.
Release Planning The BOP has implemented a unit management concept to manage and encourage inmate participation in its reentry programs. Under the unit management concept, multi-discipline unit teams determine an inmate’s program needs and monitor the inmate’s participation in programs that encourage pro-social behaviors that benefit the inmates, staff, and the community. The unit teams make decisions concerning supervision, work assignments, and programming for the inmate, and at a minimum include the unit manager, a case manager, and a counselor. Additionally, an education advisor and psychology services representative are generally members of the teams.
The BOP requires that each newly committed inmate be scheduled for
an initial classification within 4 weeks of the inmate's arrival at the institution. The initial classification occurs at a meeting with the unit team, at which time the preliminary release preparation needs of the inmate are assessed and the preparation of federal inmates for reentry into society begins.
In preparation for the initial classification, the BOP requires the unit
team to prepare a program review report. This report ordinarily includes information on the apparent needs of the inmate and offers a correctional
39 The BOP, Office of Research and Evaluation, Recidivism Among Federal Prisoners
Released in 1987, dated August 4, 1994.
22
program designed to meet those needs. In our review of inmate case files, we found that generally the inmate's initial classification program review report includes information on: (1) work requirements, (2) RPP requirements, (3) educational and occupational program requirements, and (4) CCC recommendations. According to BOP policy, the correctional program plans are required to be stated in measurable terms, establishing time limits, performance levels, and specific expected program accomplishments.
The primary source of data used to determine inmate’s needs at the
time of initial classification is the Presentence Investigation Report prepared by the U.S. Probation Office. The Presentence Investigation Report includes information related to the inmate’s: (1) criminal history, (2) substance abuse, (3) education, (4) vocational skills, and (5) employment history.
According to the BOP, release planning and preparation begins with the initial classification and is reassessed throughout confinement during program reviews conducted by the unit team. The unit team is required to conduct a program review for each inmate at least once every 180 days. Further, the unit team is required to conduct a program review at least every 90 days when an inmate is within 12 months of the inmate’s projected release date. At the time of the program review, the unit team also prepares a report that documents the inmate’s progress toward expected program accomplishments and any program changes identified during the program review process.
However, regardless of the BOP’s emphasis on release preparation and
planning, the inmate may choose not to participate in the offered programs, unless the program is a work assignment, mandated by federal statute, court order, or BOP policy. Programs mandated by federal statute are the literacy program for inmates who do not have a verified GED credential or high school diploma and the ESL program. Further, federal statute requires that 100 percent of eligible inmates participate in drug treatment programs.
During our audit, we found that at the institutions we visited release
planning was continuous from initial classification through final release as documented in inmate files. Additionally, our review of the inmate program review reports included in the inmate files indicated that the BOP staff strongly encouraged participation in its reentry programs.

23
Inmate Skills Development Re-engineering Initiative
In May 2000, the BOP established an Inmate Skills Development Re-engineering Workgroup to examine how the BOP could improve efforts to equip inmates with the necessary skills to succeed upon release. The purpose of the re-engineering workgroup was to conduct an investigation of successful agencies, institutions, and programs, as well as, literature and other research, to identify best practices related to preparation of inmates for release into the community. The workgroup also utilized focus groups throughout the BOP to assist in the identification of the necessary inmate skills including, educational, vocational, interpersonal, leisure time, cognitive, wellness, and mental health.
Based on the recommendation of the re-engineering workgroup, in
June 2003, the BOP established the Inmate Skills Development branch within the Correctional Programs Division. The mission of the Inmate Skills Development Branch is to “coordinate the [BOP’s] efforts to implement inmate skill development initiatives and provide a centralized point of liaison with external agencies to equip inmates with the necessary skills to succeed upon release.”
In order to achieve its mission the Inmate Skills Development branch has been charged with the (1) development of an inmate skill assessment process which includes the design of an individualized skill development plan to monitor progress; (2) coordination of program linkage to address skill needs; and (3) collaborative partnership building to assist with community transition.
To accurately evaluate inmate abilities and assess reentry needs, the BOP has developed an Inmate Skills Assessment Tool. The assessment tool was demonstrated over a six-month period at six institutions (one within each of the BOP’s six regions) representing a wide range in security levels and male and female inmates. Currently, the BOP’s Office of Research and Evaluation is conducting an evaluation of the assessment tool and related data.
24
FINDINGS AND RECOMMENDATIONS I. REENTRY PROGRAM COMPLETIONS
The BOP does not demonstrate that its institutions maximized the number of inmates that complete programs designed to prepare inmates for successful reentry into society. We found that the BOP does not ensure that: (1) institutions set realistic occupational and educational completion goals, (2) institutions are held accountable for meeting goals, (3) data for occupational and educational programs is reviewed to identify low performance, and (4) statistical data related to psychological programs and RPP performance is maintained and utilized.
As stated previously in this report, the research we reviewed related to
inmate recidivism concludes that the completion of occupational, educational, psychological, and other programs during incarceration leads to a reduction in recidivism and an increase in post-release employment opportunities. We reviewed the types of programs offered by the BOP and found that the 82 institutions included in our audit offer a full range of occupational, educational, psychological, and other programs. We compared the programs offered by the BOP to the research and concluded that the BOP offers the types of programs that have been shown in these studies to better prepare inmates for successful reentry into society. Therefore, our audit focused on whether the BOP ensures that each of its institutions maximize the number inmates that successfully complete its reentry programs.
To determine the process by which the BOP monitors its reentry
programs, we conducted site visits at institutions of each security level, three regional offices, and the BOP Central Office. At the institutions, we reviewed inmate files to determine whether the unit teams assessed inmate reentry program needs and monitored inmate participation in reentry programs. We found that at the institutions we visited, release planning was continuous from initial classification through final release as documented in inmate files. Additionally, our review of the inmate files revealed that the BOP staff strongly encouraged participation in its reentry programs. At the BOP Central Office and regional offices, we identified the process by which the BOP monitors reentry program performance at its institutions. We found that the BOP relies on its program review process and staff assistance visits conducted by regional office officials to monitor reentry program
25
performance. We reviewed program review reports and staff assistance reports prepared by the BOP and found that the reports generally focused on compliance with BOP policies rather than actual program performance.
The BOP has a process that requires each institution to establish
annual program completion goals. If this process is used effectively, it could ensure that each of its institutions maximize the number of inmates that participate in and complete occupational and educational programs. Each fiscal year the institution’s Supervisor of Education is required to report on achievements towards the occupational and educational program goals in an Annual Program Report for Education and Recreation Services. The BOP does not require its institutions to establish goals and outcomes for psychological programs or the RPP.
According to BOP officials, since 1998 the BOP’s Education Branch has
systematically been working on establishing an effective strategic management process for monitoring and evaluating education program outcomes. This included the development of draft outcome based program review guidelines, that were recently issued in December 2003; directing regional staff to negotiate education completion goals for FY 2003 with the institutions; and the development of a Quarterly Performance Indicator Report to provide detailed educational program data to the institutions for verification which became operational in February 2002.
For each of the 82 institutions included in our audit, we reviewed the
institution’s Annual Program Report for Education and Recreation Services for FY 1999 through FY 2002 to determine whether the institutions met their occupational and educational program completion goals. We analyzed the annual reported completion goals and the institution’s outcomes for occupational, GED, ESL, ACE, and parenting programs to determine whether stated goals were achieved and, as a result, whether the BOP as a whole was able to maximize the number of inmates who completed these reentry programs. For FY 2002, we also reviewed the BOP’s goals and outcomes for the overall percentage of inmates enrolled in one or more educational programs during the year.
We also compared the number of inmates who completed occupational
and educational programs to the number of inmates who eventually withdrew from the programs. We calculated a program performance factor, based on the number of completions divided by the number of completions plus total withdrawals for each fiscal year. (We used completion and withdrawal data that was reported in the BOP’s Key Indicators system for educational and occupational programs to calculate the performance factor.)
26
In our judgment, this comparison is an important indicator of an institution’s success and can be used to compare program performance among institutions. We were unable to analyze the percentage of inmates who completed the BOP’s psychological programs and the RPP because the BOP does not maintain completion and withdrawal statistics for these programs in its Key Indicators system. The results of our performance factor calculations and comparison are described later in this report.
Institution’s Annual Goals and Outcomes As stated previously, the BOP stated that it has been working to
establish an effective strategic management process for monitoring and evaluating occupational and educational goals and outcomes since 1998. However, we found that the BOP has not implemented a standardized process followed by all institutions to establish occupational and educational completion goals. Our review of the goals and outcomes reported in each institution’s Annual Program Report for Education and Recreation Services for FY 1999 through FY 2002 revealed that the institutions did not always set realistic occupational, GED, ACE, and parenting goals. The institutions, in conjunction with the BOP regional offices, establish their own completion goals. Our review revealed that the goal setting process is inadequate and inconsistent, resulting in institutions setting their goals too high or too low when compared to the prior year’s performance. We found instances where institutions consistently exceeded their goals for each fiscal year by a significant margin, yet failed to establish goals for the following fiscal that adequately reflected prior years outcomes.
• One institution with an occupational completion goal of 35 inmates and
an actual outcome of 103 inmates completing the program in FY 2001, decreased its occupational completion goal to 20 inmates in FY 2002, but had an actual outcome of 111 inmates completing the program.
• One institution with an ESL completion goal of 60 inmates and an
actual outcome of 74 inmates completing the program in FY 2001, kept the same ESL completion goal of 60 inmates in FY 2002, and had an actual outcome of 72 inmates completing the program. The same ESL completion goal of 60 inmates was also established for FY 2003.
• One institution with an ACE completion goal of 65 inmates and an
actual outcome of 192 inmates completing the program in FY 2001, only increased its ACE completion goal to 120 inmates in FY 2002, and had an actual outcome of 293 inmates completing the program.
27
Conversely, we found institutions consistently did not meet their goals by a significant margin, yet failed to establish goals for the following fiscal that reflected prior years outcomes. For example, we found the following instances where the established goals appear inconsistent with the prior year’s performance and the annual report did not include an adequate explanation for the increase or decrease in the goals from the prior year.
• One institution with a GED completion goal of 150 inmates had an
actual outcome of 98 inmates completing the program in FY 1999, but increased its GED completion goal to 240 inmates in FY 2000, and had an actual outcome of 161 inmates completing the program.
• One institution with an ACE completion goal of 88 inmates had an
actual outcome of 49 inmates completing the program in FY 2000, but increased its FY 2001 ACE goal to 132 completions.
Additionally, we found a lack of consistency in setting goals between
institutions with similar security levels and populations. These institutions had set very different goals for the fiscal year. Further, we found that the program completion goals are stated as the number of completions rather than a percentage of completions, which does not take into account the number of enrollments or the effect the inmate population could have when comparing among institutions.
During our audit, BOP officials we interviewed agreed that the BOP
should standardize the goal setting process among institutions to enhance consistency based on security level and population. In our judgment, the factors considered in setting program goals should include not only the security level of the institution and the inmate population, but also other factors such as classroom size, number of classes, number of instructors, whether the institution has a wait list for its program, and historical program completion data.
Although our audit concluded that the BOP’s goal setting process is
inadequate and inconsistent, we found that the completion goals were the only available source of data within the BOP we could use to determine whether the BOP institutions maximize the number of inmates that complete occupational and educational reentry programs. Therefore, we analyzed the goals and outcomes reported for each institutions’ occupational, GED, ESL, ACE, and parenting programs using this information. For FY 2002, we were able to also use the National Strategic Plan goal and outcome for the percentage of inmates enrolled in one or more educational programs during the fiscal year at each institution, which was only included in the
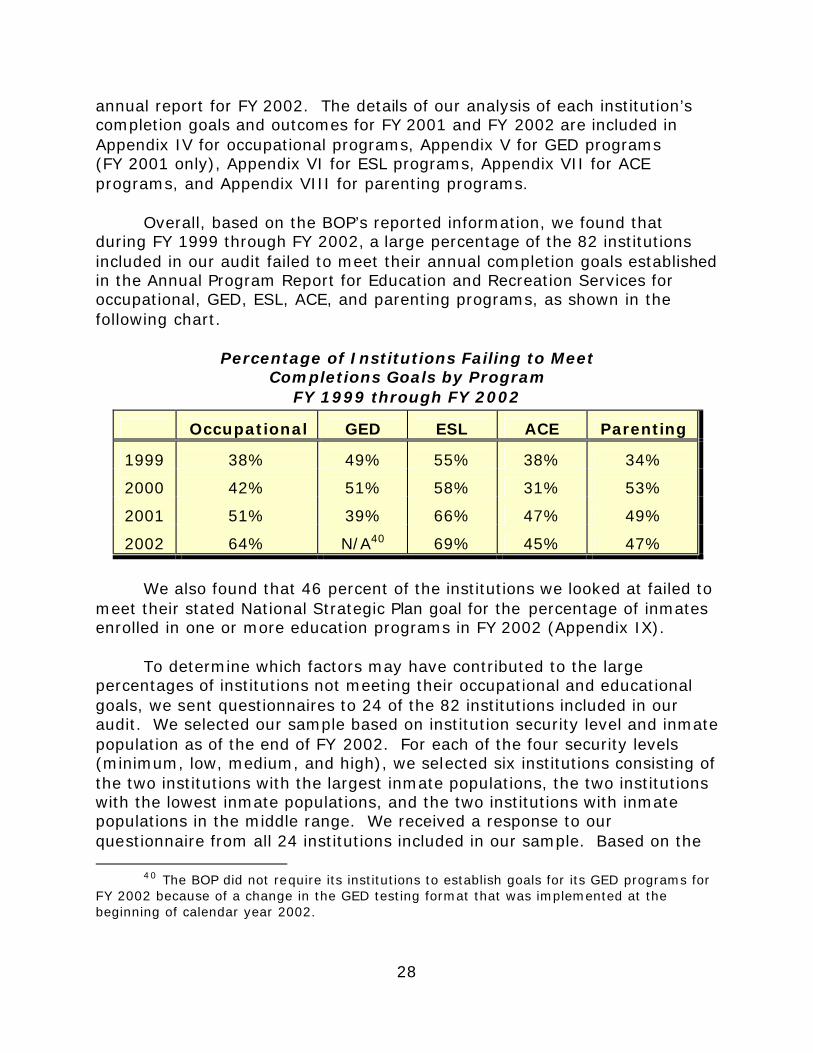
28
annual report for FY 2002. The details of our analysis of each institution’s completion goals and outcomes for FY 2001 and FY 2002 are included in Appendix IV for occupational programs, Appendix V for GED programs (FY 2001 only), Appendix VI for ESL programs, Appendix VII for ACE programs, and Appendix VIII for parenting programs.
Overall, based on the BOP’s reported information, we found that
during FY 1999 through FY 2002, a large percentage of the 82 institutions included in our audit failed to meet their annual completion goals established in the Annual Program Report for Education and Recreation Services for occupational, GED, ESL, ACE, and parenting programs, as shown in the following chart.
Percentage of Institutions Failing to Meet
Completions Goals by Program FY 1999 through FY 2002
Occupational GED ESL ACE Parenting
1999 38% 49% 55% 38% 34%
2000 42% 51% 58% 31% 53%
2001 51% 39% 66% 47% 49%
2002 64% N/A40 69% 45% 47%
We also found that 46 percent of the institutions we looked at failed to
meet their stated National Strategic Plan goal for the percentage of inmates enrolled in one or more education programs in FY 2002 (Appendix IX).
To determine which factors may have contributed to the large percentages of institutions not meeting their occupational and educational goals, we sent questionnaires to 24 of the 82 institutions included in our audit. We selected our sample based on institution security level and inmate population as of the end of FY 2002. For each of the four security levels (minimum, low, medium, and high), we selected six institutions consisting of the two institutions with the largest inmate populations, the two institutions with the lowest inmate populations, and the two institutions with inmate populations in the middle range. We received a response to our questionnaire from all 24 institutions included in our sample. Based on the
40 The BOP did not require its institutions to establish goals for its GED programs for FY 2002 because of a change in the GED testing format that was implemented at the beginning of calendar year 2002.

29
responses to our questions, we found that institutions that met their completion goals cited the following factors:
• The education department at the institution was fully staffed or received increased staffing during the years that the goals were met or exceeded.
• The institution added additional classes to meet its goals.
• The inmate population at the institution increased resulting in
increased enrollments.
• The institution increased enrollments by shortening weekly class time allowing more inmates to be enrolled or increased class size.
• Institution staff encouraged inmates not to withdraw from the reentry
programs.
• Institution staff screened inmates prior to enrollment in voluntary programs to ensure that they have the ability and are willing to commit to completing the courses.
• The unit team assisted in providing inmates with information about the
program benefits and encouraged participation.
Based on the responses to our questions, we found that institutions that did not meet their completion goals cited the following factors:
• The education department was not fully staffed. • The Supervisor of Education did not receive GED testing authorization
for a significant period of time; as a result, no testing was performed during the period.
• The institution experienced a decrease in the inmate population or the
number of inmates with GED needs.
• The institution’s GED testing license was suspended because of a GED testing security breach.
• The institution experienced prolonged periods of lock-down.
• The institution reduced in the number of classes offered.
30
• Inmates did not complete the course because the course was too long.
• Inmates were transferred prior to completing the program.
Overall, we noted from the responses that institutions that met their goals appear to promote a proactive management approach (i.e., strongly encouraging inmate participation, screening applicants, and unit team involvement) and effectively used their available resources (i.e., shortening class time and adding more classes). Those institutions that did not meet their goals attributed their failure to inadequate staffing, an insufficient number of classes offered, and factors outside the control of staff such as inmate population, inmate transfers, and prolonged periods of lock-down. However, in our judgment some of these adverse factors could have been recognized and mitigated if, as noted below, the BOP had a process in place to determine why goals were not met and timely action taken to remedy poor performance.
We conducted interviews with BOP officials related to the large
percentage of institutions that failed to meet their annual occupational and educational goals during FY 1999 through FY 2002. BOP officials stated that currently institutions are not held accountable for failing to meet their goals. BOP officials also stated the Central office has been moving towards performance monitoring since 1998. Currently the institutions are only held accountable for the program review guidelines, which focus on compliance with BOP policy rather than performance.
Despite the fact that the BOP’s annual report process was in place and
a large number of institutions failed to meet one or more of their annual occupational or educational goals during FY 1999 through FY 2002, the BOP did not have a mechanism to assess the information included in the required reports, hold institutions accountable, or redirect resources to meet emerging deficiencies. Institutions were not required to develop or implement corrective action plans to remedy performance and ensure that their goals are met in the future. In our judgment, the BOP’s failure to hold institutions accountable for low performance contributed to its institutions not meeting their completion goals.
During our audit, the BOP issued a draft program review guideline that
includes a review of the institution’s performance towards meeting its occupational, GED, and percent participation program goals. We noted that the BOP’s program reviews generally only occur every 3 years for institutions that receive a superior or good program review rating, every 2 years for institutions that receive an acceptable rating, and every
31
18 months for institutions that receive a deficient rating. As a result, it could be up to 3 years before corrective actions are taken for institutions that failed to meet their annual occupational and educational program goals. Further, the draft program review guidelines do not include a review of the ESL, ACE, or parenting program goals. In our judgment, the draft program review guidelines are not sufficient to ensure that corrective actions are implemented timely. We recommend that the BOP establish and implement an annual process to ensure that institutions are held accountable for meeting their occupational and educational goals and that corrective action plans are developed to remedy program performance and ensure that goals are met in future fiscal years.
We also noted during our audit that the FY 2001 Annual Program
Report for Education and Recreation Services only includes the occupational and educational outcomes reported for FY 2000 and FY 2001, and the projected outcomes for FY 2002. The FY 2001 report does not include the FY 2001 occupational and educational goals for comparison with the outcomes. The FY 2001 goals can only be found in the FY 2000 Annual Program Report for Education and Recreation Services. Similarly, the FY 2002 Annual Program Report for Education and Recreation Services does not include the FY 2002 occupational and educational goals for comparison with the outcomes. We recommend that the Annual Program Report for Education and Recreation Services be revised to include both the goals and outcomes for the reported fiscal year, so that the BOP can readily determine whether its institutions meet their completion goals.
Percentage of Reentry Program Completions
In addition to reviewing each institution’s occupational and educational goals and outcomes, we also compared the number of inmates who completed occupational and educational programs to the number of inmates who eventually withdrew from the programs. We calculated a program performance factor based on the number of completions divided by the number of completions plus total withdrawals for each fiscal year.41 In our judgment, this comparison is an important indicator of an institution’s success and can be used to compare program performance among institutions.
41 We used completion and withdrawal data that was reported in the BOP’s Key Indicators system for educational and occupational programs to calculate the performance factor.
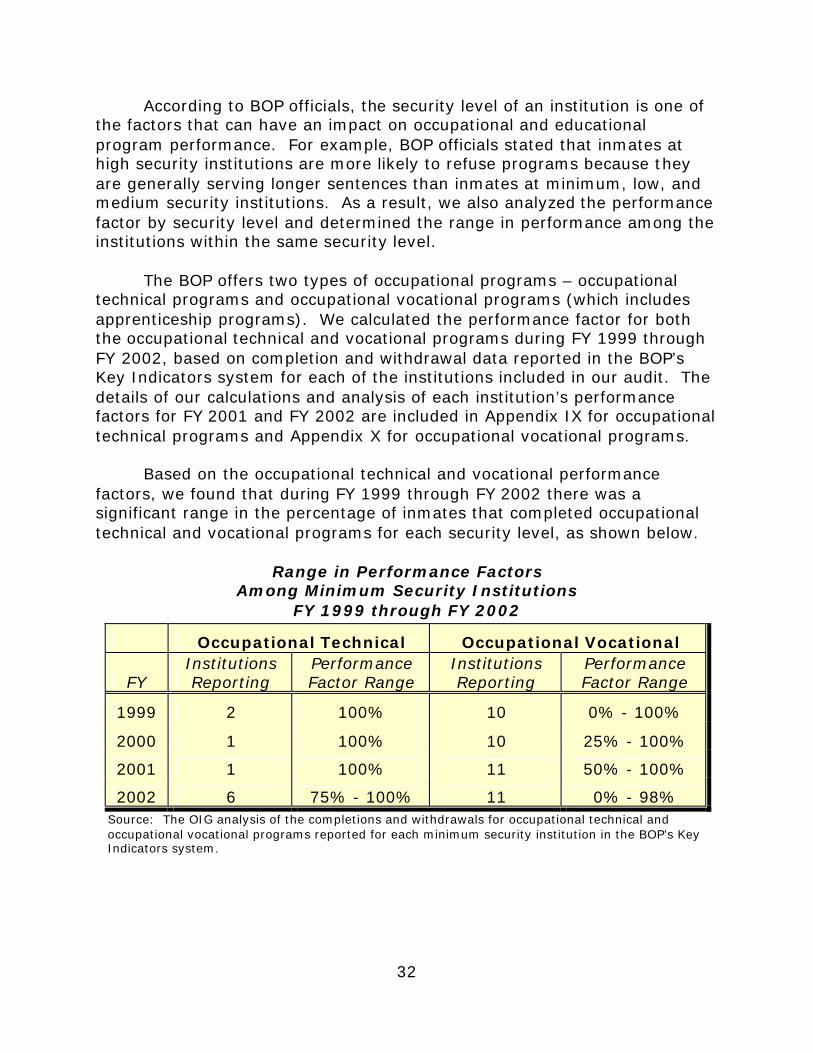
32
According to BOP officials, the security level of an institution is one of the factors that can have an impact on occupational and educational program performance. For example, BOP officials stated that inmates at high security institutions are more likely to refuse programs because they are generally serving longer sentences than inmates at minimum, low, and medium security institutions. As a result, we also analyzed the performance factor by security level and determined the range in performance among the institutions within the same security level.
The BOP offers two types of occupational programs – occupational
technical programs and occupational vocational programs (which includes apprenticeship programs). We calculated the performance factor for both the occupational technical and vocational programs during FY 1999 through FY 2002, based on completion and withdrawal data reported in the BOP’s Key Indicators system for each of the institutions included in our audit. The details of our calculations and analysis of each institution’s performance factors for FY 2001 and FY 2002 are included in Appendix IX for occupational technical programs and Appendix X for occupational vocational programs.
Based on the occupational technical and vocational performance
factors, we found that during FY 1999 through FY 2002 there was a significant range in the percentage of inmates that completed occupational technical and vocational programs for each security level, as shown below.
Range in Performance Factors
Among Minimum Security Institutions FY 1999 through FY 2002
Occupational Technical Occupational Vocational
FY Institutions Reporting
Performance Factor Range
Institutions Reporting
Performance Factor Range
1999 2 100% 10 0% - 100%
2000 1 100% 10 25% - 100%
2001 1 100% 11 50% - 100%
2002 6 75% - 100% 11 0% - 98% Source: The OIG analysis of the completions and withdrawals for occupational technical and occupational vocational programs reported for each minimum security institution in the BOP’s Key Indicators system.
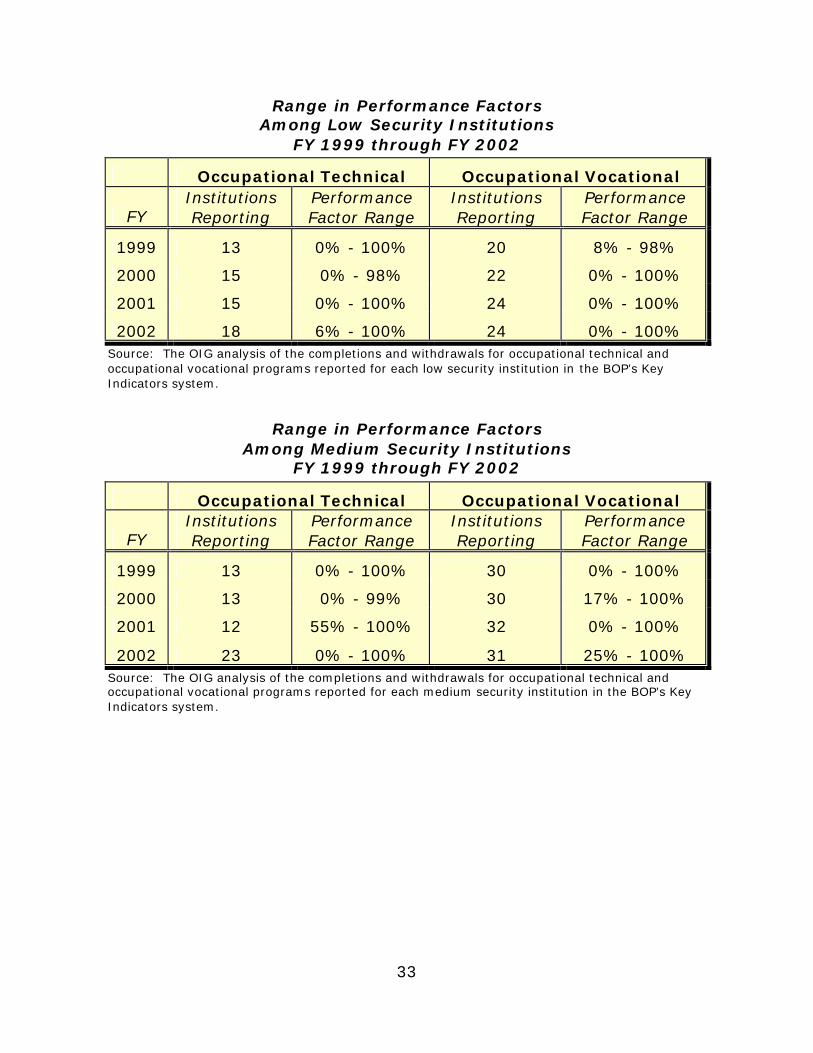
33
Range in Performance Factors Among Low Security Institutions
FY 1999 through FY 2002
Occupational Technical Occupational Vocational
FY Institutions Reporting
Performance Factor Range
Institutions Reporting
Performance Factor Range
1999 13 0% - 100% 20 8% - 98%
2000 15 0% - 98% 22 0% - 100%
2001 15 0% - 100% 24 0% - 100%
2002 18 6% - 100% 24 0% - 100% Source: The OIG analysis of the completions and withdrawals for occupational technical and occupational vocational programs reported for each low security institution in the BOP’s Key Indicators system.
Range in Performance Factors Among Medium Security Institutions
FY 1999 through FY 2002
Occupational Technical Occupational Vocational
FY Institutions Reporting
Performance Factor Range
Institutions Reporting
Performance Factor Range
1999 13 0% - 100% 30 0% - 100%
2000 13 0% - 99% 30 17% - 100%
2001 12 55% - 100% 32 0% - 100%
2002 23 0% - 100% 31 25% - 100% Source: The OIG analysis of the completions and withdrawals for occupational technical and occupational vocational programs reported for each medium security institution in the BOP’s Key Indicators system.
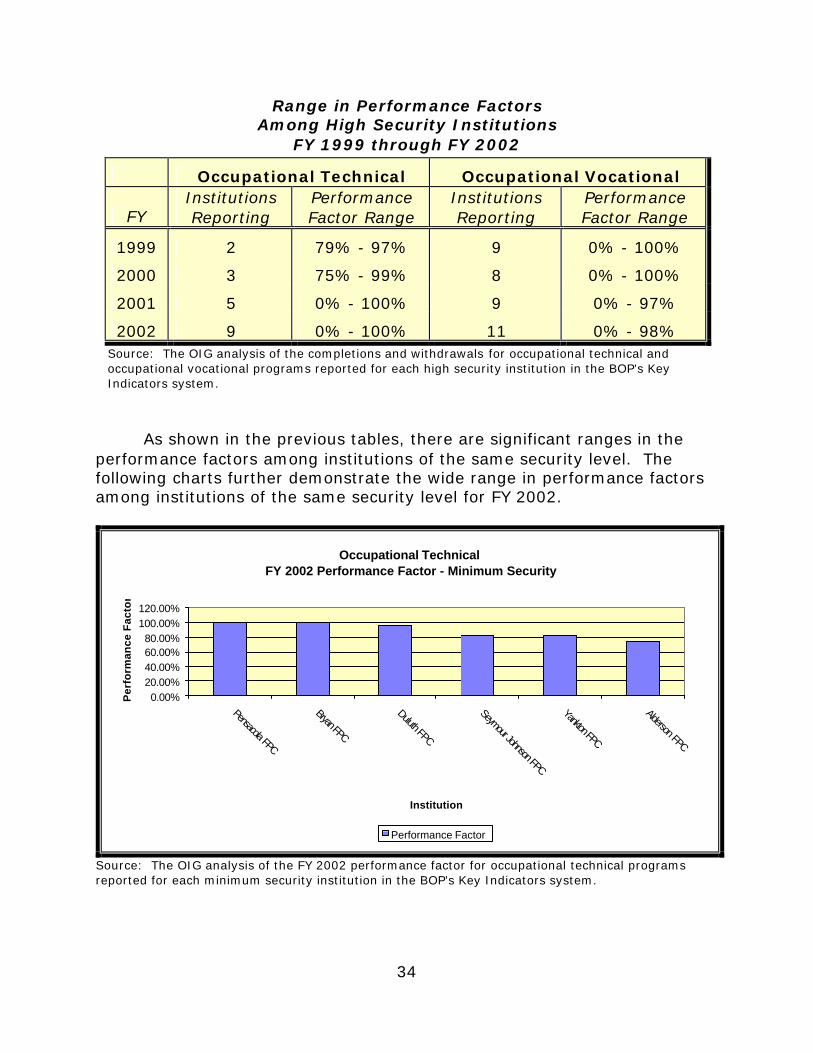
34
Range in Performance Factors Among High Security Institutions
FY 1999 through FY 2002
Occupational Technical Occupational Vocational
FY Institutions Reporting
Performance Factor Range
Institutions Reporting
Performance Factor Range
1999 2 79% - 97% 9 0% - 100%
2000 3 75% - 99% 8 0% - 100%
2001 5 0% - 100% 9 0% - 97%
2002 9 0% - 100% 11 0% - 98% Source: The OIG analysis of the completions and withdrawals for occupational technical and occupational vocational programs reported for each high security institution in the BOP’s Key Indicators system.
As shown in the previous tables, there are significant ranges in the performance factors among institutions of the same security level. The following charts further demonstrate the wide range in performance factors among institutions of the same security level for FY 2002.
Occupational TechnicalFY 2002 Performance Factor - Minimum Security
0.00%20.00%40.00%60.00%80.00%
100.00%120.00%
Pensacola FPC
Bryan FPC
Duluth FPC
Seymour Johnson FPC
Yankton FPC
Alderson FPC
Institution
Per
form
ance
Fac
tor
Performance Factor
Source: The OIG analysis of the FY 2002 performance factor for occupational technical programs reported for each minimum security institution in the BOP’s Key Indicators system.
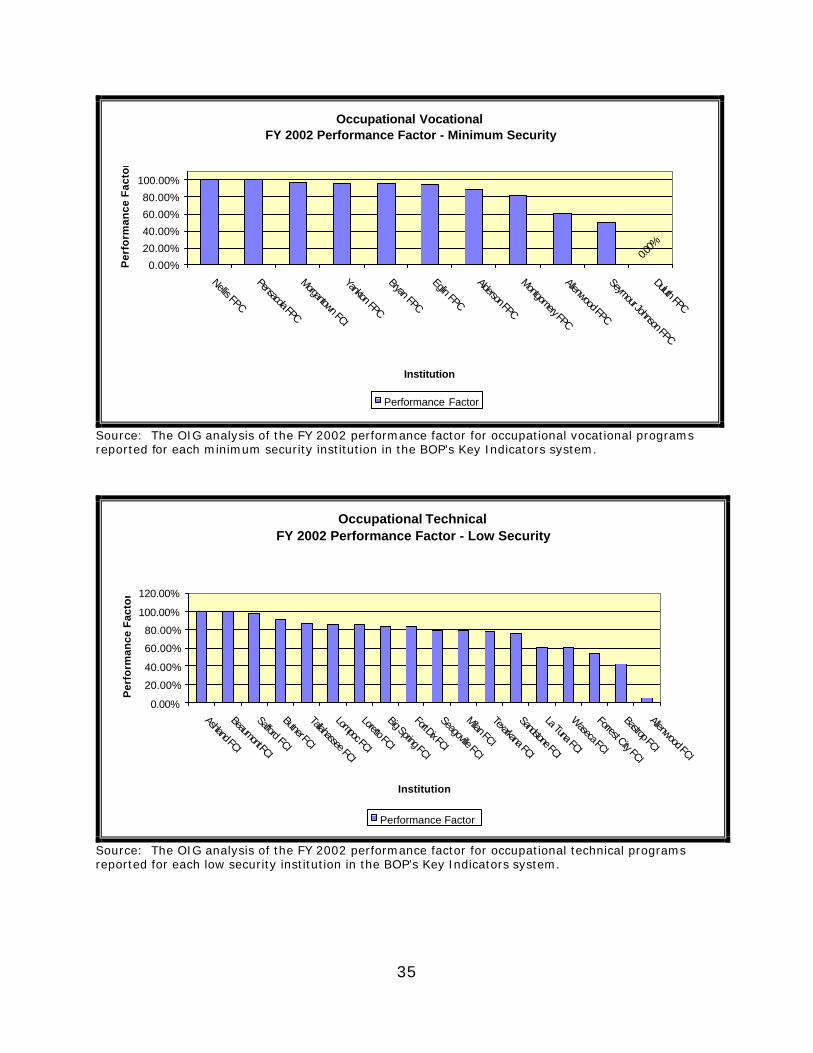
35
Occupational VocationalFY 2002 Performance Factor - Minimum Security
0.00%
0.00%
20.00%
40.00%
60.00%
80.00%
100.00%
Nellis FPC
Pensacola FPC
Morgantown FCI
Yankton FPC
Bryan FPC
Eglin FPC
Alderson FPC
Montgomery FPC
Allenwood FPC
Seymour Johnson FPC
Duluth FPC
Institution
Per
form
ance
Fac
tor
Performance Factor
Source: The OIG analysis of the FY 2002 performance factor for occupational vocational programs reported for each minimum security institution in the BOP’s Key Indicators system.
Occupational TechnicalFY 2002 Performance Factor - Low Security
0.00%
20.00%
40.00%
60.00%
80.00%
100.00%
120.00%
Ashland FCI
Beaumont FCI
Safford FCI
Butner FCI
Tallahassee FCI
Lompoc FCI
Loretto FCI
Big Spring FCI
Fort Dix FCI
Seagoville FCI
Milan FCI
Texarkana FCI
Sandstone FCI
La Tuna FCI
Waseca FCI
Forrest City FCI
Bastrop FCI
Allenwood FCI
Institution
Per
form
ance
Fac
tor
Performance Factor
Source: The OIG analysis of the FY 2002 performance factor for occupational technical programs reported for each low security institution in the BOP’s Key Indicators system.
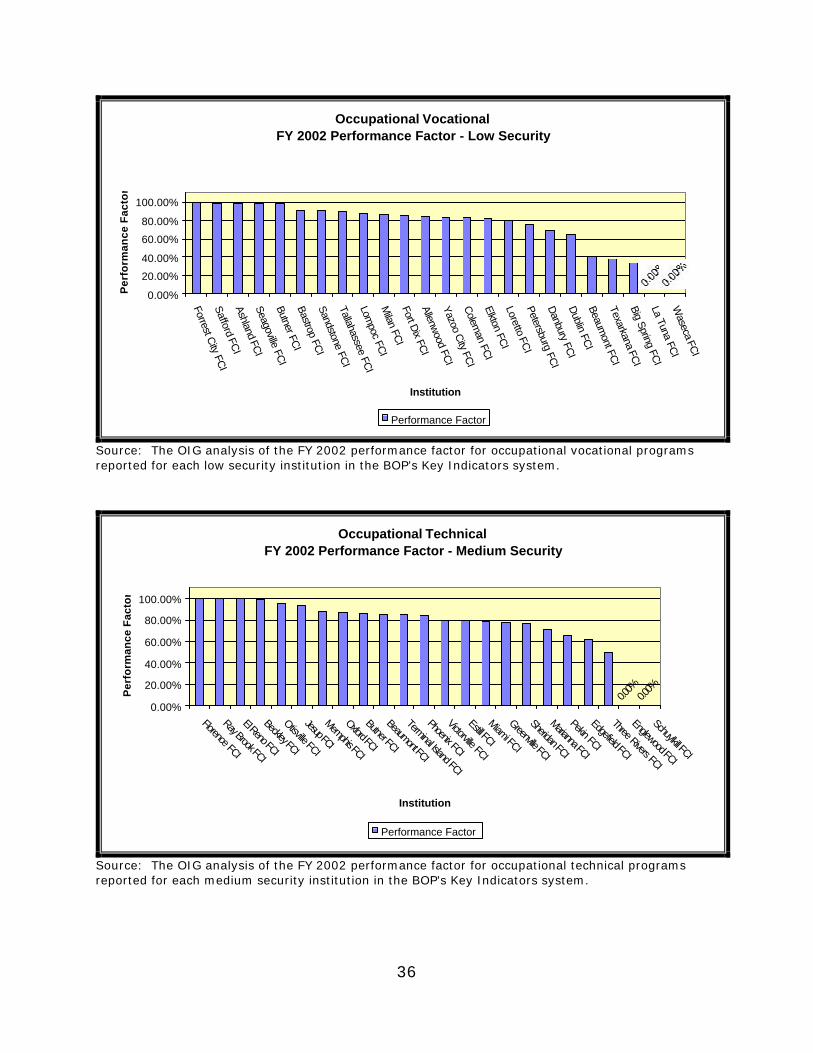
36
Occupational VocationalFY 2002 Performance Factor - Low Security
0.00%
20.00%
40.00%
60.00%
80.00%
100.00%
Forrest City FC
ISafford FC
IAshland FC
ISeagoville FC
IButner FC
IBastrop FC
ISandstone FC
ITallahassee FC
ILom
poc FCI
Milan FC
IFort D
ix FCI
Allenwood FC
IYazoo C
ity FCI
Colem
an FCI
Elkton FCI
Loretto FCI
Petersburg FCI
Danbury FC
ID
ublin FCI
Beaumont FC
ITexarkana FC
IBig Spring FC
ILa Tuna FC
IW
aseca FCI
Institution
Per
form
ance
Fac
tor
Performance Factor
Source: The OIG analysis of the FY 2002 performance factor for occupational vocational programs reported for each low security institution in the BOP’s Key Indicators system.
Occupational TechnicalFY 2002 Performance Factor - Medium Security
0.00%
0.00%
0.00%
20.00%
40.00%
60.00%
80.00%
100.00%
Florence FCI
Ray Brook FCI
El Reno FCI
Beckley FCI
Otisville FCI
Jesup FCI
Memphis FCI
Oxford FCI
Butner FCI
Beaumont FCI
Terminal Island FCI
Phoenix FCI
Victorville FCI
Estill FCI
Miami FCI
Greenville FCI
Sheridan FCI
Marianna FCI
Pekin FCI
Edgefield FCI
Three Rivers FCI
Englewood FCI
Schuylkill FCI
Institution
Per
form
ance
Fac
tor
Performance Factor
Source: The OIG analysis of the FY 2002 performance factor for occupational technical programs reported for each medium security institution in the BOP’s Key Indicators system.
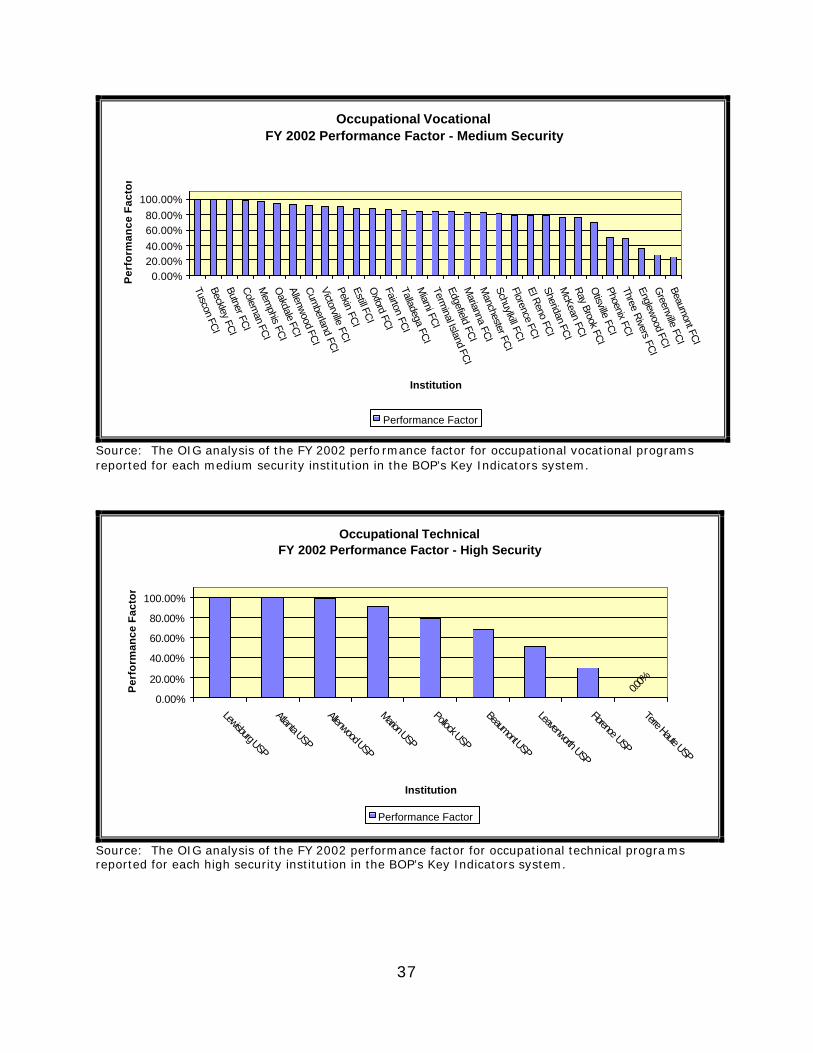
37
Occupational VocationalFY 2002 Performance Factor - Medium Security
0.00%20.00%40.00%60.00%80.00%
100.00%
Tuscon FCI
Beckley FCI
Butner FCI
Colem
an FCI
Mem
phis FCI
Oakdale FC
IAllenw
ood FCI
Cum
berland FCI
Victorville FCI
Pekin FCI
Estill FCI
Oxford FC
IFairton FC
ITalladega FC
IM
iami FC
ITerm
inal Island FCI
Edgefield FCI
Marianna FC
IM
anchester FCI
Schuylkill FCI
Florence FCI
El Reno FC
ISheridan FC
IM
cKean FCI
Ray Brook FCIO
tisville FCI
Phoenix FCI
Three Rivers FC
IEnglew
ood FCI
Greenville FC
IBeaum
ont FCI
Institution
Per
form
ance
Fac
tor
Performance Factor
Source: The OIG analysis of the FY 2002 perfo rmance factor for occupational vocational programs reported for each medium security institution in the BOP’s Key Indicators system.
Occupational TechnicalFY 2002 Performance Factor - High Security
0.00%
0.00%
20.00%
40.00%
60.00%
80.00%
100.00%
Lewisburg USP
Atlanta USP
Allenwood USP
Marion USP
Pollock USP
Beaumont USP
Leavenworth USP
Florence USP
Terre Haute USP
Institution
Per
form
ance
Fac
tor
Performance Factor
Source: The OIG analysis of the FY 2002 performance factor for occupational technical programs reported for each high security institution in the BOP’s Key Indicators system.
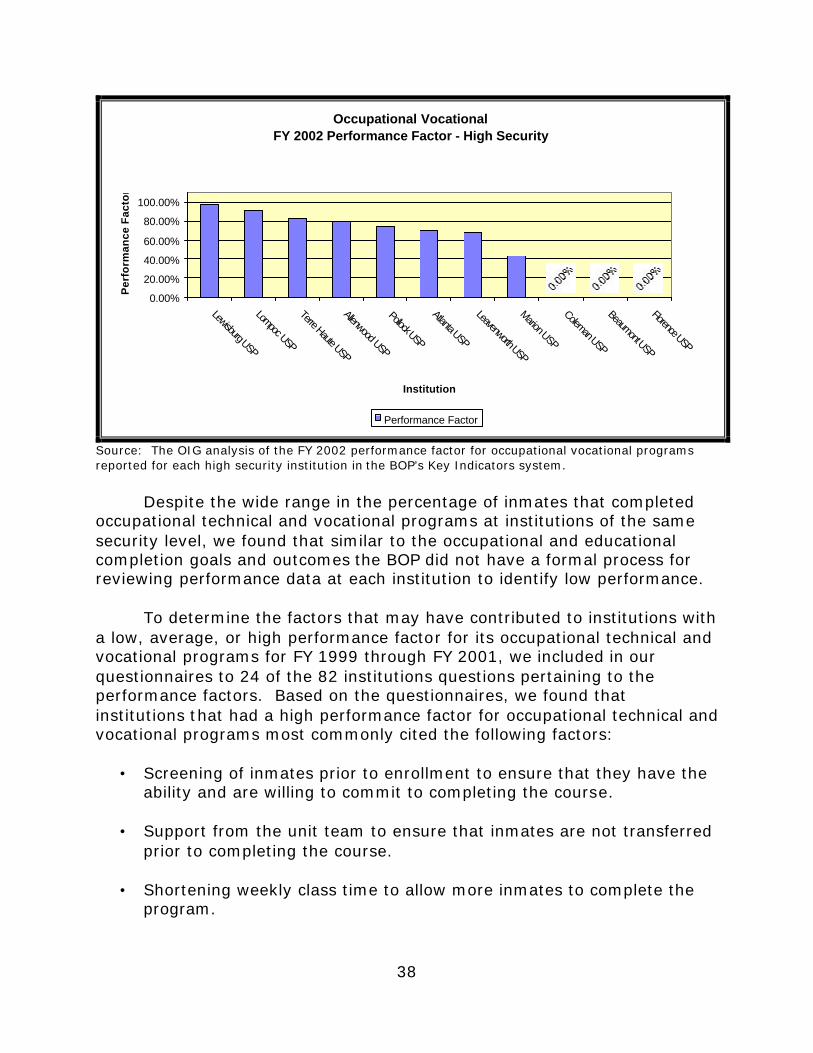
38
Occupational VocationalFY 2002 Performance Factor - High Security
0.00%
20.00%
40.00%
60.00%
80.00%
100.00%
Lewisburg USP
Lompoc USP
Terre Haute USP
Allenwood USP
Pollock USP
Atlanta USP
Leavenworth USP
Marion USP
Coleman USP
Beaumont USP
Florence USP
Institution
Per
form
ance
Fac
tor
Performance Factor
Source: The OIG analysis of the FY 2002 performance factor for occupational vocational programs reported for each high security institution in the BOP’s Key Indicators system.
Despite the wide range in the percentage of inmates that completed
occupational technical and vocational programs at institutions of the same security level, we found that similar to the occupational and educational completion goals and outcomes the BOP did not have a formal process for reviewing performance data at each institution to identify low performance.
To determine the factors that may have contributed to institutions with
a low, average, or high performance factor for its occupational technical and vocational programs for FY 1999 through FY 2001, we included in our questionnaires to 24 of the 82 institutions questions pertaining to the performance factors. Based on the questionnaires, we found that institutions that had a high performance factor for occupational technical and vocational programs most commonly cited the following factors:
• Screening of inmates prior to enrollment to ensure that they have the ability and are willing to commit to completing the course.
• Support from the unit team to ensure that inmates are not transferred
prior to completing the course.
• Shortening weekly class time to allow more inmates to complete the program.
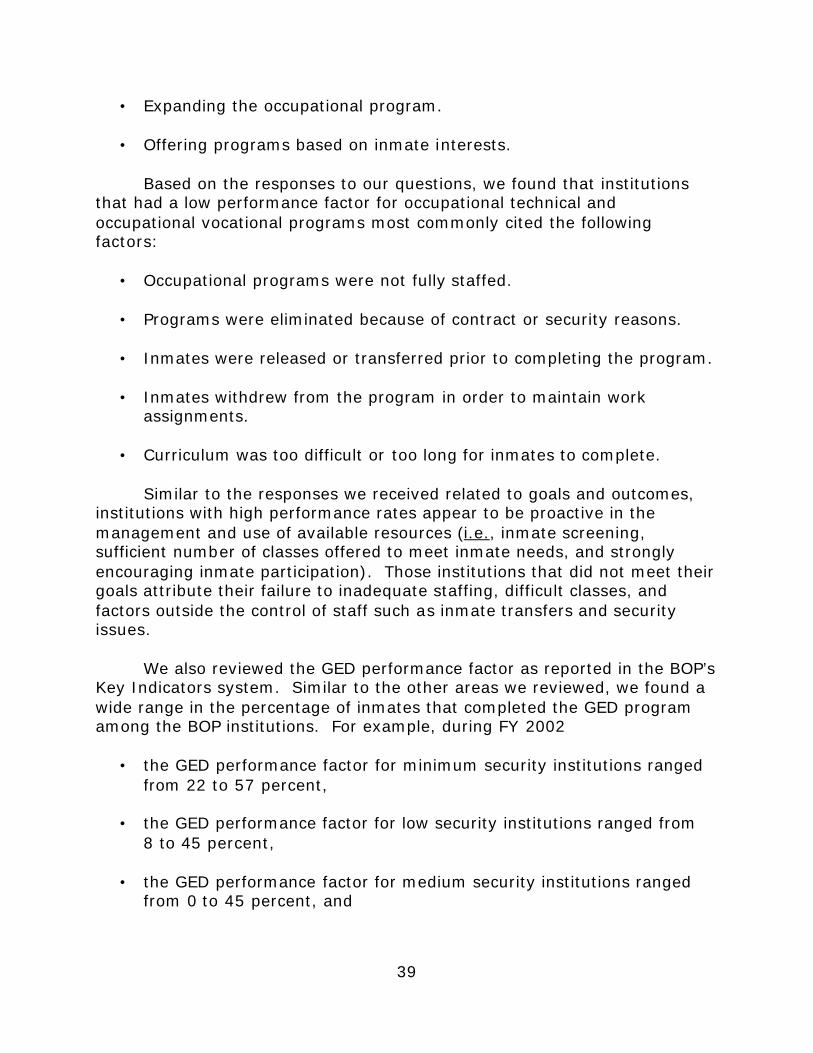
39
• Expanding the occupational program.
• Offering programs based on inmate interests.
Based on the responses to our questions, we found that institutions that had a low performance factor for occupational technical and occupational vocational programs most commonly cited the following factors:
• Occupational programs were not fully staffed. • Programs were eliminated because of contract or security reasons.
• Inmates were released or transferred prior to completing the program.
• Inmates withdrew from the program in order to maintain work
assignments.
• Curriculum was too difficult or too long for inmates to complete. Similar to the responses we received related to goals and outcomes,
institutions with high performance rates appear to be proactive in the management and use of available resources (i.e., inmate screening, sufficient number of classes offered to meet inmate needs, and strongly encouraging inmate participation). Those institutions that did not meet their goals attribute their failure to inadequate staffing, difficult classes, and factors outside the control of staff such as inmate transfers and security issues.
We also reviewed the GED performance factor as reported in the BOP’s
Key Indicators system. Similar to the other areas we reviewed, we found a wide range in the percentage of inmates that completed the GED program among the BOP institutions. For example, during FY 2002
• the GED performance factor for minimum security institutions ranged from 22 to 57 percent,
• the GED performance factor for low security institutions ranged from
8 to 45 percent,
• the GED performance factor for medium security institutions ranged from 0 to 45 percent, and
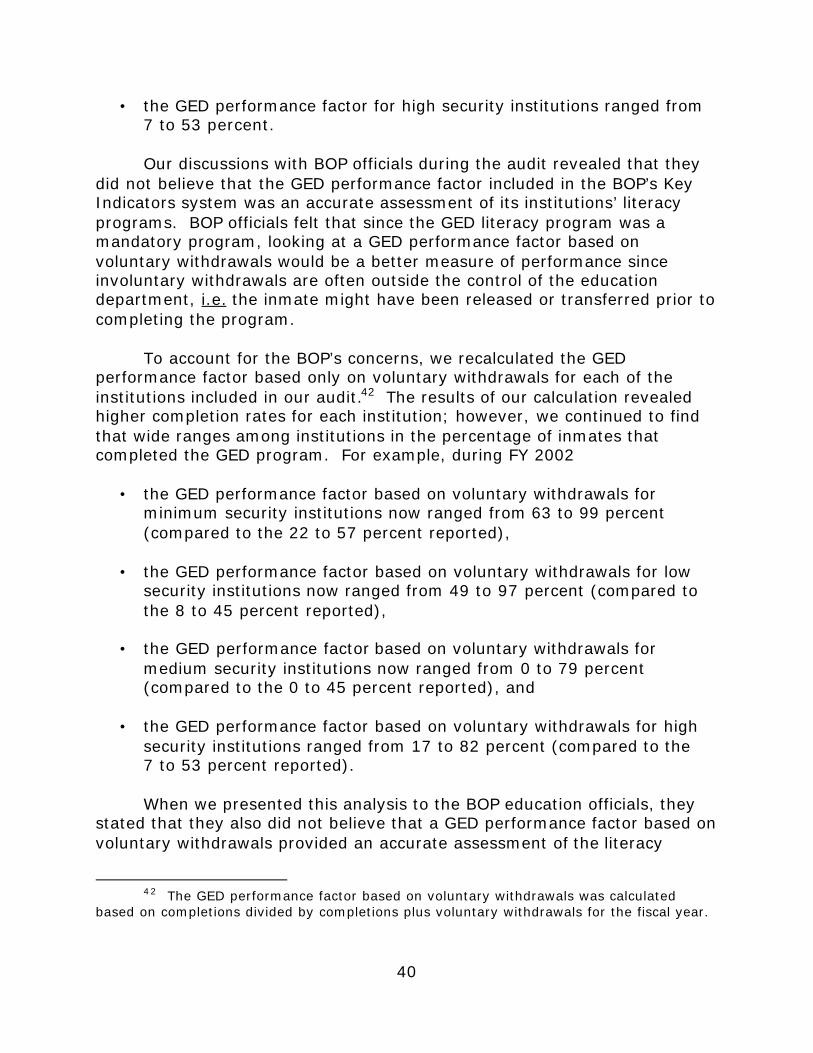
40
• the GED performance factor for high security institutions ranged from 7 to 53 percent.
Our discussions with BOP officials during the audit revealed that they
did not believe that the GED performance factor included in the BOP’s Key Indicators system was an accurate assessment of its institutions’ literacy programs. BOP officials felt that since the GED literacy program was a mandatory program, looking at a GED performance factor based on voluntary withdrawals would be a better measure of performance since involuntary withdrawals are often outside the control of the education department, i.e. the inmate might have been released or transferred prior to completing the program.
To account for the BOP’s concerns, we recalculated the GED
performance factor based only on voluntary withdrawals for each of the institutions included in our audit.42 The results of our calculation revealed higher completion rates for each institution; however, we continued to find that wide ranges among institutions in the percentage of inmates that completed the GED program. For example, during FY 2002
• the GED performance factor based on voluntary withdrawals for minimum security institutions now ranged from 63 to 99 percent (compared to the 22 to 57 percent reported),
• the GED performance factor based on voluntary withdrawals for low
security institutions now ranged from 49 to 97 percent (compared to the 8 to 45 percent reported),
• the GED performance factor based on voluntary withdrawals for
medium security institutions now ranged from 0 to 79 percent (compared to the 0 to 45 percent reported), and
• the GED performance factor based on voluntary withdrawals for high
security institutions ranged from 17 to 82 percent (compared to the 7 to 53 percent reported). When we presented this analysis to the BOP education officials, they
stated that they also did not believe that a GED performance factor based on voluntary withdrawals provided an accurate assessment of the literacy
42 The GED performance factor based on voluntary withdrawals was calculated
based on completions divided by completions plus voluntary withdrawals for the fiscal year.
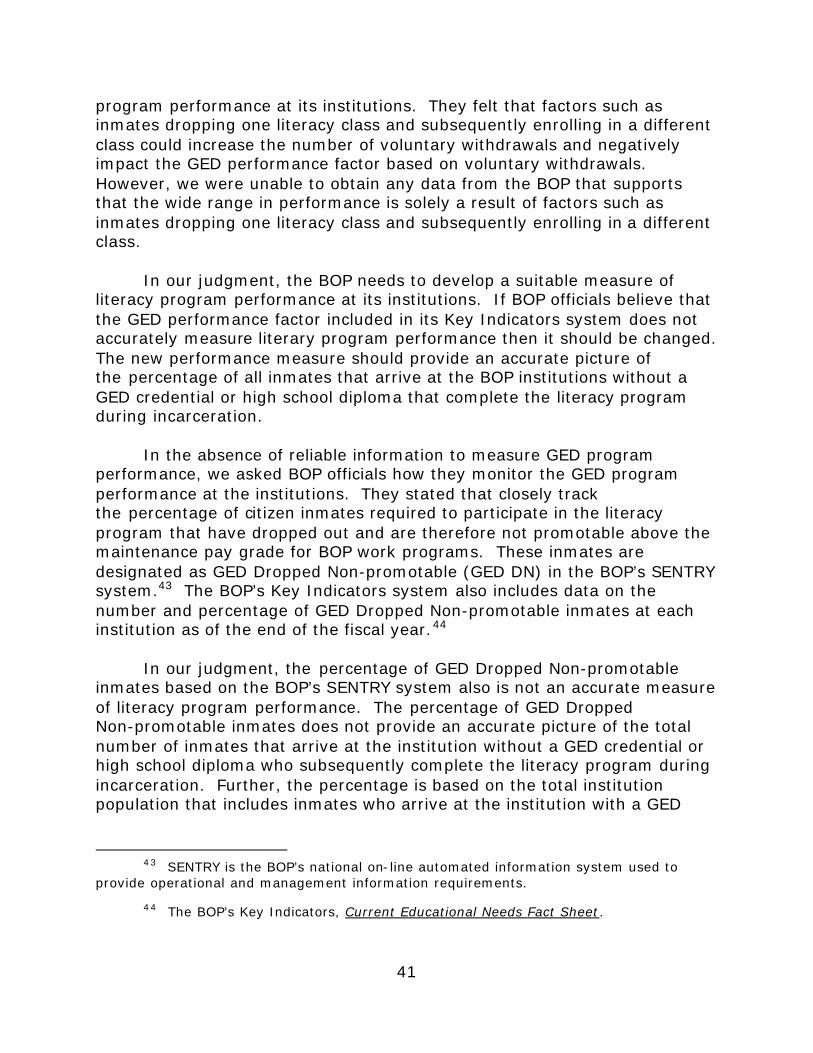
41
program performance at its institutions. They felt that factors such as inmates dropping one literacy class and subsequently enrolling in a different class could increase the number of voluntary withdrawals and negatively impact the GED performance factor based on voluntary withdrawals. However, we were unable to obtain any data from the BOP that supports that the wide range in performance is solely a result of factors such as inmates dropping one literacy class and subsequently enrolling in a different class.
In our judgment, the BOP needs to develop a suitable measure of
literacy program performance at its institutions. If BOP officials believe that the GED performance factor included in its Key Indicators system does not accurately measure literary program performance then it should be changed. The new performance measure should provide an accurate picture of the percentage of all inmates that arrive at the BOP institutions without a GED credential or high school diploma that complete the literacy program during incarceration.
In the absence of reliable information to measure GED program performance, we asked BOP officials how they monitor the GED program performance at the institutions. They stated that closely track the percentage of citizen inmates required to participate in the literacy program that have dropped out and are therefore not promotable above the maintenance pay grade for BOP work programs. These inmates are designated as GED Dropped Non-promotable (GED DN) in the BOP’s SENTRY system.43 The BOP’s Key Indicators system also includes data on the number and percentage of GED Dropped Non-promotable inmates at each institution as of the end of the fiscal year.44
In our judgment, the percentage of GED Dropped Non-promotable
inmates based on the BOP’s SENTRY system also is not an accurate measure of literacy program performance. The percentage of GED Dropped Non-promotable inmates does not provide an accurate picture of the total number of inmates that arrive at the institution without a GED credential or high school diploma who subsequently complete the literacy program during incarceration. Further, the percentage is based on the total institution population that includes inmates who arrive at the institution with a GED
43 SENTRY is the BOP’s national on-line automated information system used to
provide operational and management information requirements.
44 The BOP’s Key Indicators, Current Educational Needs Fact Sheet.
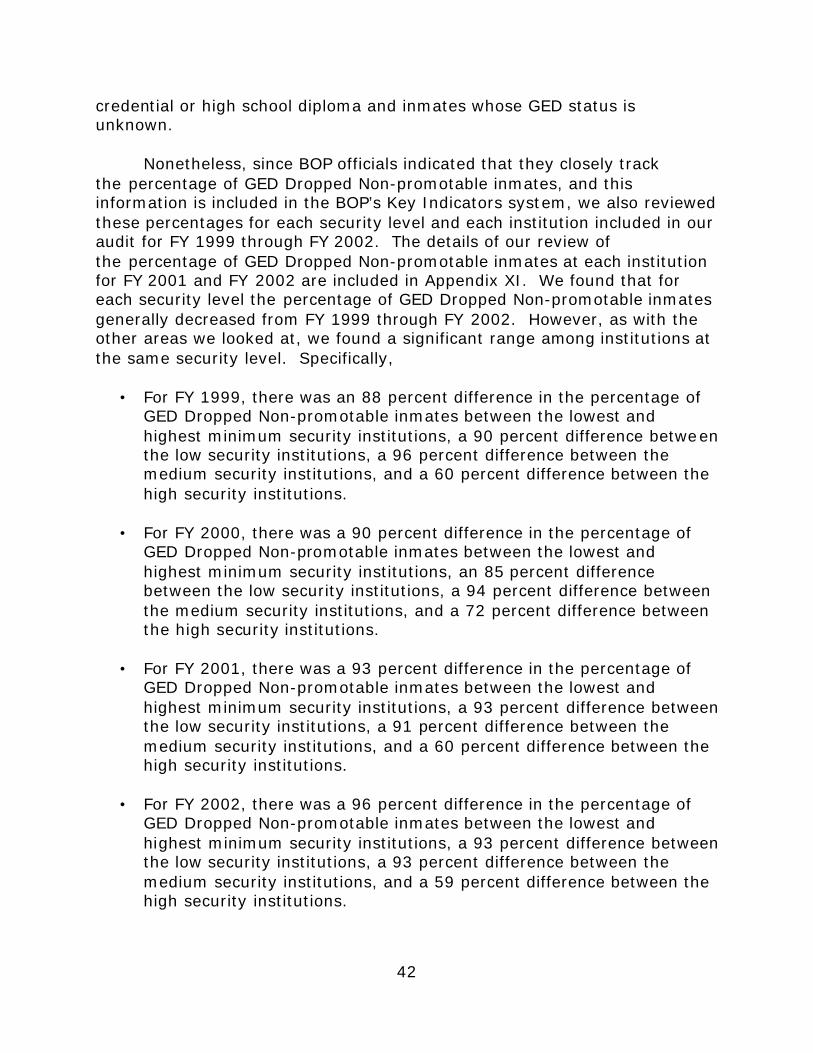
42
credential or high school diploma and inmates whose GED status is unknown.
Nonetheless, since BOP officials indicated that they closely track
the percentage of GED Dropped Non-promotable inmates, and this information is included in the BOP’s Key Indicators system, we also reviewed these percentages for each security level and each institution included in our audit for FY 1999 through FY 2002. The details of our review of the percentage of GED Dropped Non-promotable inmates at each institution for FY 2001 and FY 2002 are included in Appendix XI. We found that for each security level the percentage of GED Dropped Non-promotable inmates generally decreased from FY 1999 through FY 2002. However, as with the other areas we looked at, we found a significant range among institutions at the same security level. Specifically,
• For FY 1999, there was an 88 percent difference in the percentage of GED Dropped Non-promotable inmates between the lowest and highest minimum security institutions, a 90 percent difference between the low security institutions, a 96 percent difference between the medium security institutions, and a 60 percent difference between the high security institutions.
• For FY 2000, there was a 90 percent difference in the percentage of
GED Dropped Non-promotable inmates between the lowest and highest minimum security institutions, an 85 percent difference between the low security institutions, a 94 percent difference between the medium security institutions, and a 72 percent difference between the high security institutions.
• For FY 2001, there was a 93 percent difference in the percentage of
GED Dropped Non-promotable inmates between the lowest and highest minimum security institutions, a 93 percent difference between the low security institutions, a 91 percent difference between the medium security institutions, and a 60 percent difference between the high security institutions.
• For FY 2002, there was a 96 percent difference in the percentage of
GED Dropped Non-promotable inmates between the lowest and highest minimum security institutions, a 93 percent difference between the low security institutions, a 93 percent difference between the medium security institutions, and a 59 percent difference between the high security institutions.

43
We also noted that the BOP maintains data on the percentage of noncitizen inmates required to participate in the literacy program that have dropped out and are therefore subject to a loss of good conduct time. These inmates are designated as Exempt GED Non-promotable (GED XN) in the BOP’s SENTRY system. The BOP’s Key Indicators system also includes data on the number and percentage of Exempt GED Non-promotable inmates at each institution as of the fiscal year-end.
We reviewed the percentage of Exempt GED Non-promotable inmates
for each security level during FY 1999 through FY 2002 based on the data contained in the BOP’s Key Indicators system. We found that, with the exception of minimum security institutions, for each security level as a whole the percentage of Exempt GED Non-promotable inmates increased from FY 1999 through FY 2002, as shown in the following charts.
Exempt from GED / Non-promotable (XN) - Minimum SecurityFY 1999 - FY 2002
0.20%
0.10%
0.20%
0.20%
0.08%
0.10%
0.12%
0.14%
0.16%
0.18%
0.20%
0.22%
1999
2000
2001
2002
Fiscal Year
Per
cen
t E
xem
pt
fro
m G
ED
/ N
on
-p
rom
ota
ble
(X
N)
Exempt from GED / Non-promotable (XN)
Source: The OIG analysis of the percentage Exempt GED Non-promotable inmates at minimum security institutions reported in the BOP’s Key Indicators system for FY 1999 through FY 2002.
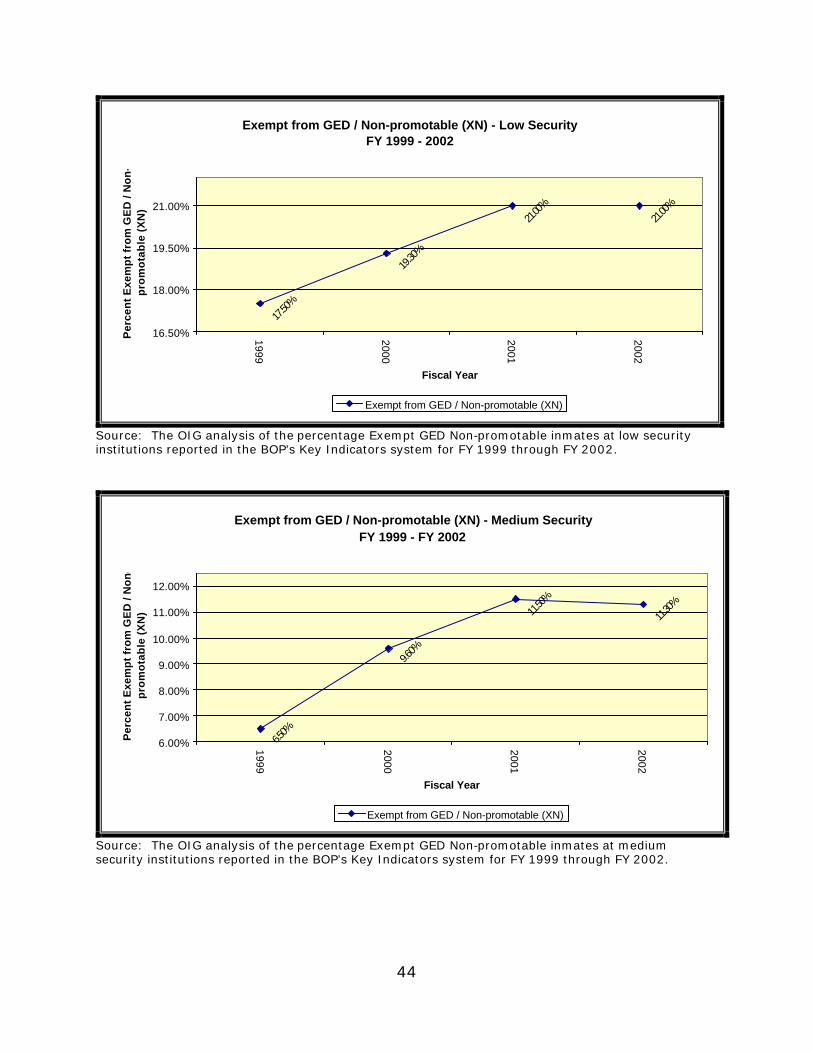
44
Exempt from GED / Non-promotable (XN) - Low SecurityFY 1999 - 2002
17.50
%
19.30
%
21.00%
21.00%
16.50%
18.00%
19.50%
21.00%
1999
2000
2001
2002
Fiscal Year
Per
cen
t E
xem
pt
fro
m G
ED
/ N
on
-p
rom
ota
ble
(X
N)
Exempt from GED / Non-promotable (XN)
Source: The OIG analysis of the percentage Exempt GED Non-promotable inmates at low security institutions reported in the BOP’s Key Indicators system for FY 1999 through FY 2002.
Exempt from GED / Non-promotable (XN) - Medium SecurityFY 1999 - FY 2002
6.50%
9.60%
11.50%
11.30%
6.00%
7.00%
8.00%
9.00%
10.00%
11.00%
12.00%
1999
2000
2001
2002
Fiscal Year
Per
cen
t E
xem
pt
fro
m G
ED
/ N
on
-p
rom
ota
ble
(X
N)
Exempt from GED / Non-promotable (XN)
Source: The OIG analysis of the percentage Exempt GED Non-promotable inmates at medium security institutions reported in the BOP’s Key Indicators system for FY 1999 through FY 2002.
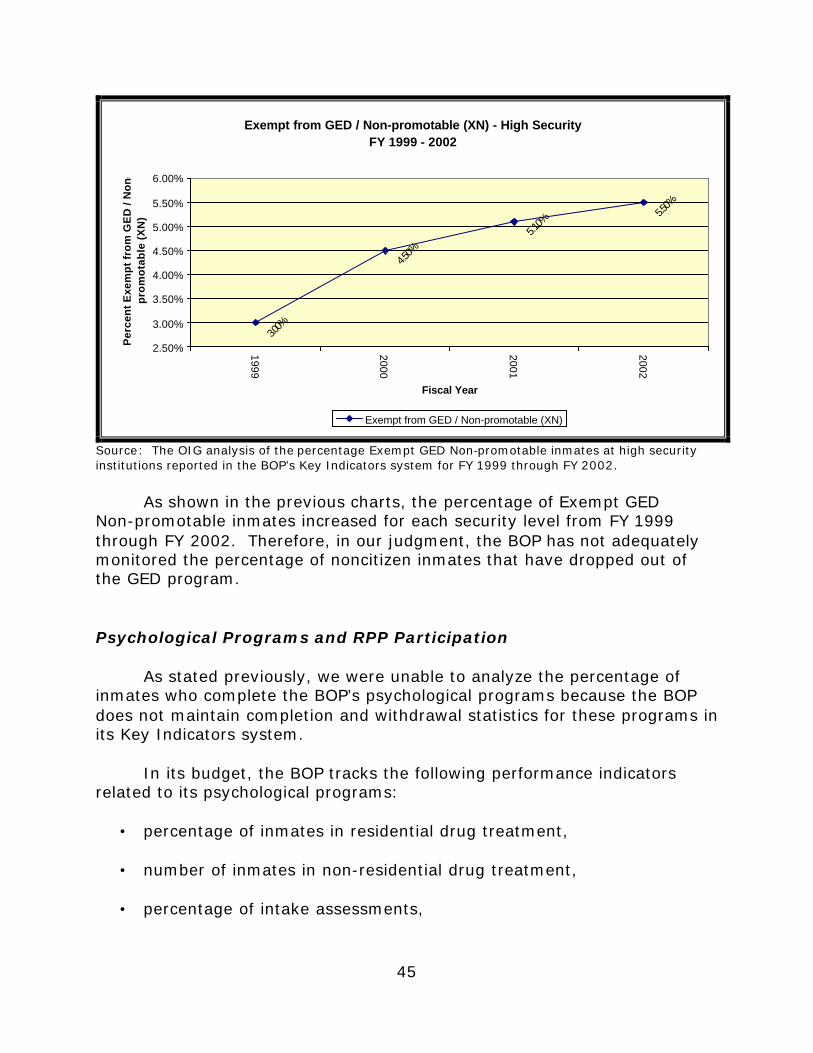
45
Exempt from GED / Non-promotable (XN) - High SecurityFY 1999 - 2002
3.00%
4.50%
5.10%
5.50%
2.50%
3.00%
3.50%
4.00%
4.50%
5.00%
5.50%
6.00%
1999
2000
2001
2002
Fiscal Year
Per
cen
t E
xem
pt
fro
m G
ED
/ N
on
-p
rom
ota
ble
(X
N)
Exempt from GED / Non-promotable (XN)
Source: The OIG analysis of the percentage Exempt GED Non-promotable inmates at high security institutions reported in the BOP’s Key Indicators system for FY 1999 through FY 2002.
As shown in the previous charts, the percentage of Exempt GED
Non-promotable inmates increased for each security level from FY 1999 through FY 2002. Therefore, in our judgment, the BOP has not adequately monitored the percentage of noncitizen inmates that have dropped out of the GED program.
Psychological Programs and RPP Participation
As stated previously, we were unable to analyze the percentage of inmates who complete the BOP’s psychological programs because the BOP does not maintain completion and withdrawal statistics for these programs in its Key Indicators system.
In its budget, the BOP tracks the following performance indicators
related to its psychological programs:
• percentage of inmates in residential drug treatment, • number of inmates in non-residential drug treatment,
• percentage of intake assessments,
46
• number of individual therapy/crisis counseling sessions provided, and
• number of suicide risk assessments. However, these performance indicators only cover a small portion of the psychological programs offered by the BOP.
Prior to January 2003, the BOP did not report on psychological
program performance data for most of its programs. As a result, we were unable to use this data to analyze trends related to performance, such as completion rates, failure rates, and withdrawal rates.
Since January 2003, the BOP has reported on monthly participation
data for the majority of its psychological programs; however, this data is still not included in its Key Indicators system. The data provided in the monthly reports prepared by the BOP’s Office of Research and Evaluation includes: (1) admissions, (2) completions, (3) expulsions, (4) failures, (5) withdrawals, (6) incompletes, and (7) waiting lists for the following programs.
• Residential Drug Abuse Treatment Program, • Non-Residential Drug Abuse Treatment Program,
• Transitional Drug Abuse Treatment Program,
• BRAVE Program,
• CODE Program,
• New Pathways Program, and
• Sex Offender Treatment Program.
BOP officials stated that the participation data is a tool but not necessarily a measure of performance. For example, BOP officials stated that a large failure or expulsion rate in a psychological program is not necessarily an indication of low performance because sometimes expulsions are necessary to hold inmates accountable for their actions.
BOP officials also stated that it is difficult to evaluate performance of psychological programs since they are dealing with human behavior that is not easily determined based on completion rates or other data and that
47
statistical data for these types of programs is best used as a tool to evaluate trends over a period of time. In our judgment, participation data of this nature is also relevant and should be used by management as an indicator of potential immediate concerns. For example, a large number of withdrawals could indicate inmates are being transferred to another institution prior to completing a program. In addition, a large number of expulsions, failures, and withdrawals also may indicate a problem related to a specific psychological program at an institution.
At each of the three regional offices included in our audit, we identified
the process for evaluating the monthly psychological program participation data for the institutions in their respective areas. We found that the BOP regional offices did not have a standardized process for evaluating the participation data or holding its institutions accountable for low participation. Generally, if the regional officials stated that if they noted trends in the participation data, such as a high failure rate in a particular program on the monthly participation report, they would follow-up by telephone. However, we found no formal review process in place at the regional level.
As with its psychological programs, we found that he BOP does not
maintain completion and withdrawal statistics for the RPP in its Key Indicators system. Additionally, one of the expected outcomes of the BOP’s RPP is that inmate recidivism will be reduced. Yet, the BOP has not conducted any studies demonstrating that successful participation in its RPP leads to a reduction in recidivism. All eligible inmates committed to BOP custody are required to participate in the RPP and must enroll in the program no later than 30 months prior to release to the community or a CCC. Although the BOP can determine the RPP status of each inmate at any given point in time, no statistical data related to RPP performance is tracked.
At each of the three regional offices included in our audit, we identified the process for evaluating RPP participation for its institutions. We found that two of the three regional offices did not review RPP participation. The third, the Northeast Regional Office, sends a monthly roster to each of its institutions listing those inmates within 30 months of release that have not enrolled in the RPP. However, no formal response is required from the institutions. The BOP should, at a minimum, track participation data for its institutions to determine the percentage of eligible inmates that have completed the RPP prior to release into the community. Based on our discussions with BOP officials, we determined that the percentage of eligible
48
inmates that have completed the RPP prior to release into the community could be included in its Key Indicators system.
In addition to tracking the percentage of eligible inmates that have
completed the RPP prior to release into the community, the BOP needs to establish a mechanism to hold institutions accountable for RPP performance and implement corrective actions plans to remedy low performance. Conclusion
In summary, we found that the BOP does not ensure that: (1) institutions set realistic occupational and educational completion goals, (2) institutions are held accountable for meeting goals, (3) data for occupational, educational, and psychological programs is reviewed to identify low performance, and (4) statistical data related to RPP performance is not maintained. As a result, we concluded that the BOP does not provide assurance that each of its institutions maximized the number of inmates that complete programs designed to prepare inmates for successful reentry into society.
Recommendations
We recommend that the BOP: 1. Ensure that a formalized process is established to set realistic
occupational and educational completion goals stated as a percentage of completions to account for total enrollments and inmate population. The factors considered in setting educational goals should include the security level of the institution, inmate population, classroom size, number of classes, number of instructors, whether the institution has a wait list for its programs, and historical educational program completion data.
2. Establish and implement a formal process to ensure that institutions
are held accountable for meeting their occupational and educational goals and that corrective action plans are developed to remedy performance so that goals are met in future years.

49
3. Revise the Annual Program Report for Education and Recreation Services to include both the occupational and educational goals and outcomes for the reported fiscal year so that the BOP can readily determine whether the institution met its goals.
4. Establish and implement a formal standardized process for evaluating
the performance factor for occupational technical and vocational programs on an annual basis to ensure that the BOP institutions are held accountable for low performance and that corrective action plans are developed to remedy occupational program performance.
5. Ensure that a formal standardized process is developed and
implemented to screen all inmates prior to enrollment in all occupational programs to ensure that they have the ability and are willing to commit to completing the course.
6. Ensure that a suitable measure of literacy program performance is
developed to evaluate its institutions. The new performance measure should provide an accurate picture of the percentage of all inmates that arrive at the BOP institutions without a GED credential or high school diploma who complete the literacy program during incarceration.
7. Ensure that the percentage of citizen inmates required to participate in
the literacy program that have dropped out at each institution is more closely evaluated.
8. Ensure that the percentage of noncitizen inmates that have dropped
out of the literacy program at each institution is monitored. 9. Establish and implement a mechanism to hold institutions accountable
for the monthly psychological program participation data that includes corrective action plans for institutions with low participation.
10. Ensure that participation data is tracked for all of the BOP institutions
to determine the percentage of eligible inmates that have completed the RPP prior to release into the community.
11. Establish and implement a mechanism to hold institutions accountable
for RPP performance that includes corrective action plans for institutions with low performance.
50
II. Community Corrections Centers (CCC)
The BOP offers transitional services to inmates through CCC placement, which has been found to increase the chances of successful reentry into society. The BOP establishes CCC utilization targets for its minimum, low, and medium security institutions. However, our audit revealed that a large number of institutions failed to meet their CCC utilization targets during FY 2000 through FY 2002. Also, the BOP has not developed a CCC utilization target for its high security institutions, and does not adequately ensure that all eligible inmates are provided the opportunity to transition through a CCC in preparation for reentry into society. In addition to reentry programs offered to inmates while serving their
sentences at BOP institutions, the BOP provides services that assist inmates when they transition from incarceration into the community. The primary transitional service provided by the BOP is the placement of inmates in CCCs, also known as halfway houses. Pursuant to 18 U.S.C. § 3624(c), the BOP is required, to the extent possible, to assure that inmates spend a reasonable part of their term of incarceration under conditions that will afford the prisoner a reasonable opportunity to adjust to and prepare for reentry into the community. The BOP believes the transitional services provided through a CCC meet the requirements of 18 U.S.C. § 3624(c). Pursuant to this federal statute, the BOP can place inmates in a CCC for a period not to exceed the last 6 months of confinement or a period equal to 10 percent of the inmate’s sentence, whichever is less.
At the institutions we visited, we reviewed inmate files to determine
whether eligible inmates were placed in CCCs prior to release. We found that the unit team generally referred eligible inmates for CCC placement; however, not all inmates referred for CCC placement were transitioned through a CCC. The reasons that those inmates that were not transitioned through a CCC included that the inmates (1) were not eligible (e.g., were deportable aliens), (2) were considered a flight risk, (3) were considered a high risk, or (4) refused placement.
51
BOP policy requires that eligible inmates be released to the community through a CCC. However, the policy also states that the BOP does not ordinarily consider the following inmates for CCC programs.45
• Inmates who are assigned a “Sex Offender” Public Safety Factor. • Inmates who are assigned a “Deportable Alien” Public Safety Factor.
• Inmates who require inpatient medical, psychological, or psychiatric
treatment.
• Inmates who refuse to participate in the Inmate Financial Responsibility Program.
• Inmates who refuse to participate, withdraw, are expelled, or
otherwise fail to meet attendance and examination requirements in a required Drug Abuse Education program.
• Inmates serving sentences of 6 months or less.
• Inmates who refuse to participate in the RPP.
• Inmates who pose a significant threat to the community. These are
inmates whose current offense or behavioral history suggests a substantial or continuing threat to the community.
BOP officials we interviewed believe that CCCs provide an excellent
transitional environment for inmates nearing the end of their sentences. According to the BOP, during the transitional period at a CCC, inmate activities are closely monitored, and inmates are provided with a suitable residence, structured programs, job placement and counseling. CCCs also offer drug testing and counseling for alcohol and drug-related problems. Further, during their stay inmates are required to pay a subsistence charge to defer the cost of their confinement in a CCC (25 percent of their gross income, not to exceed the average daily cost of their CCC placement).
A strategic objective of the BOP sets target CCC utilization rates for minimum, low, and medium security institutions.46 (The CCC utilization rate
45 BOP Program Statement No. 7310.04, Community Corrections Center (CCC)
Utilization and Transfer Procedure, dated December 16, 1998.
46 The BOP, State of the Bureau 2002, Accomplishments and Goals.
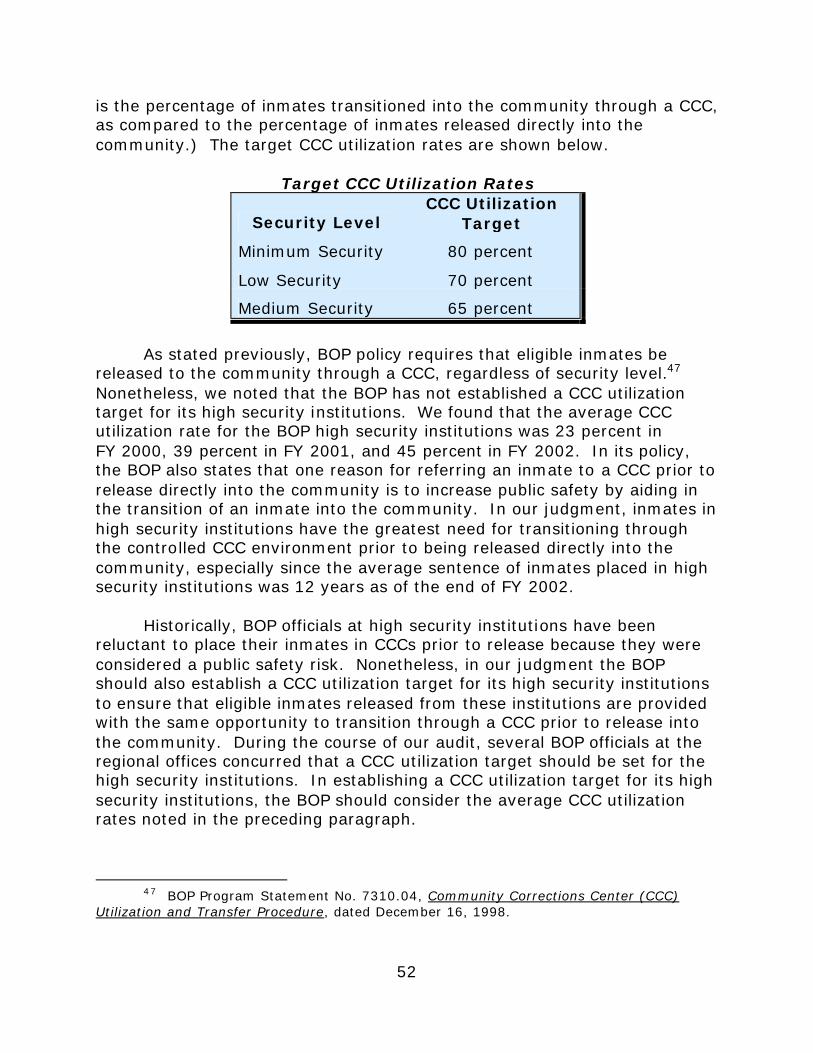
52
is the percentage of inmates transitioned into the community through a CCC, as compared to the percentage of inmates released directly into the community.) The target CCC utilization rates are shown below.
Target CCC Utilization Rates
Security Level CCC Utilization
Target
Minimum Security 80 percent
Low Security 70 percent
Medium Security 65 percent
As stated previously, BOP policy requires that eligible inmates be
released to the community through a CCC, regardless of security level.47 Nonetheless, we noted that the BOP has not established a CCC utilization target for its high security institutions. We found that the average CCC utilization rate for the BOP high security institutions was 23 percent in FY 2000, 39 percent in FY 2001, and 45 percent in FY 2002. In its policy, the BOP also states that one reason for referring an inmate to a CCC prior to release directly into the community is to increase public safety by aiding in the transition of an inmate into the community. In our judgment, inmates in high security institutions have the greatest need for transitioning through the controlled CCC environment prior to being released directly into the community, especially since the average sentence of inmates placed in high security institutions was 12 years as of the end of FY 2002.
Historically, BOP officials at high security institutions have been
reluctant to place their inmates in CCCs prior to release because they were considered a public safety risk. Nonetheless, in our judgment the BOP should also establish a CCC utilization target for its high security institutions to ensure that eligible inmates released from these institutions are provided with the same opportunity to transition through a CCC prior to release into the community. During the course of our audit, several BOP officials at the regional offices concurred that a CCC utilization target should be set for the high security institutions. In establishing a CCC utilization target for its high security institutions, the BOP should consider the average CCC utilization rates noted in the preceding paragraph.
47 BOP Program Statement No. 7310.04, Community Corrections Center (CCC)
Utilization and Transfer Procedure, dated December 16, 1998.
53
The 82 institutions we reviewed included 13 high security institutions and 1 maximum security institution. Therefore, we were only able to review the CCC utilization targets and outcomes during FY 2000 through FY 2002 for the remaining 68 minimum, low, and medium security institutions. We used the total number of inmates transferred to a CCC and the total number of inmates released directly to the community as reported in the BOP’s Key Indicators system to calculate the CCC utilization rate for each institution and compared this calculation to the BOP’s CCC utilization targets. The details of our calculations and analysis of each institution’s CCC utilization rate for FY 2001 and FY 2002 are included in Appendix XII.
Overall, the results of our review revealed that a large number of
institutions failed to meet the BOP’s stated CCC utilization targets for FY 2000 through FY 2002. Specifically, we found the following for each fiscal year.
• For the 67 institutions reporting in FY 2000, 36 (54 percent) failed to meet their CCC utilization target for that fiscal year.
• For the 67 institutions reporting in FY 2001, 19 (28 percent) failed to meet their CCC utilization target for that fiscal year.
• For the 68 institutions reporting in FY 2002, 27 (40 percent) failed to meet their CCC utilization target for that fiscal year. Since the BOP established its CCC utilization targets by security level,
we analyzed the CCC utilization targets and outcomes by security level and determined the range in performance among the institutions within the same security level.
Our analysis of the CCC utilization targets and outcomes by security level revealed that for FY 2000, none of the 11 minimum security institutions reporting failed to meet their CCC utilization target, 14 (58 percent) of the 24 low security institutions reporting failed to meet their CCC utilization target, and 22 (69 percent) of the 32 medium security institutions reporting failed to meet their CCC utilization target.
Additionally, for each security level there was generally a significant
range in the CCC utilization rates achieved by each institution (Appendix XIII), as shown in the following charts.
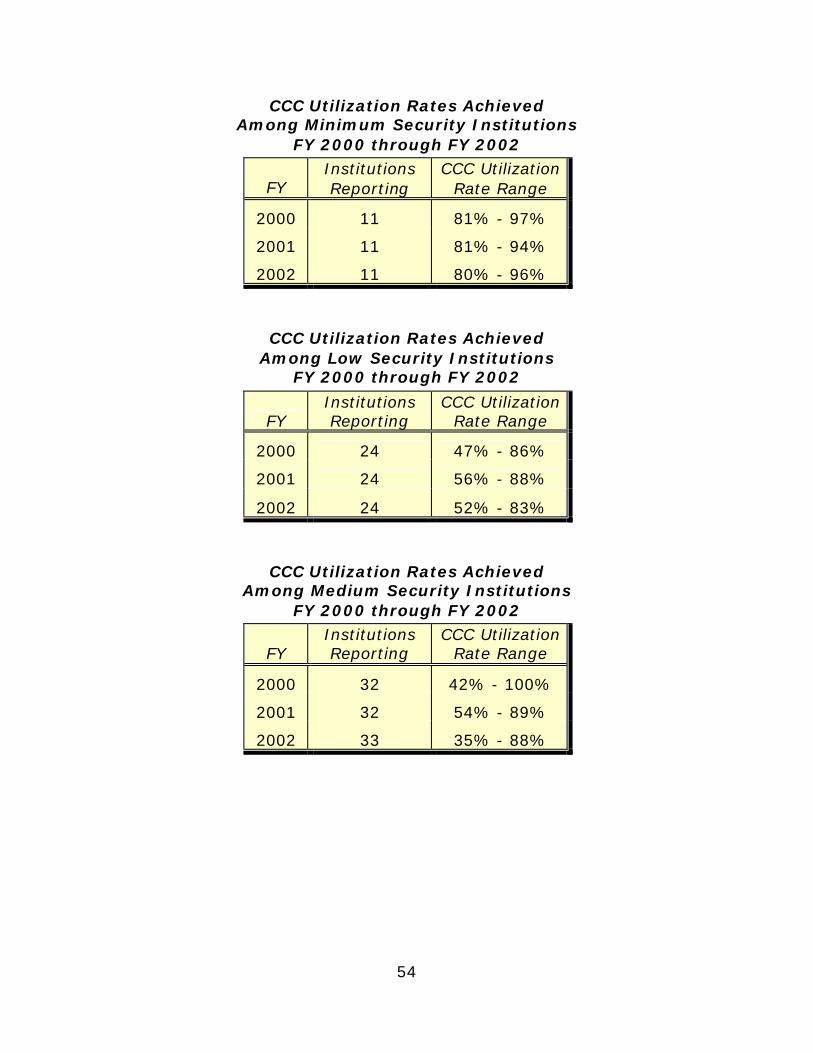
54
CCC Utilization Rates Achieved Among Minimum Security Institutions
FY 2000 through FY 2002
FY Institutions Reporting
CCC Utilization Rate Range
2000 11 81% - 97%
2001 11 81% - 94%
2002 11 80% - 96%
CCC Utilization Rates Achieved Among Low Security Institutions
FY 2000 through FY 2002
FY Institutions Reporting
CCC Utilization Rate Range
2000 24 47% - 86%
2001 24 56% - 88%
2002 24 52% - 83%
CCC Utilization Rates Achieved Among Medium Security Institutions
FY 2000 through FY 2002
FY Institutions Reporting
CCC Utilization Rate Range
2000 32 42% - 100%
2001 32 54% - 89%
2002 33 35% - 88%
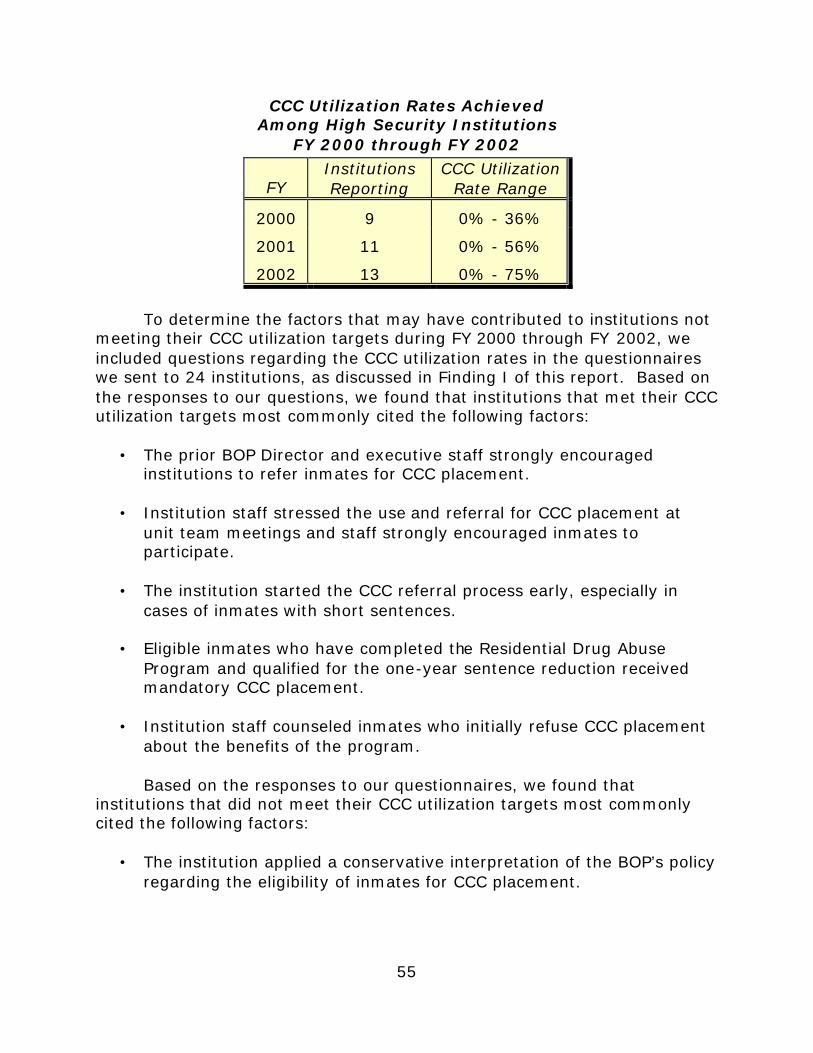
55
CCC Utilization Rates Achieved Among High Security Institutions
FY 2000 through FY 2002
FY Institutions Reporting
CCC Utilization Rate Range
2000 9 0% - 36%
2001 11 0% - 56%
2002 13 0% - 75%
To determine the factors that may have contributed to institutions not
meeting their CCC utilization targets during FY 2000 through FY 2002, we included questions regarding the CCC utilization rates in the questionnaires we sent to 24 institutions, as discussed in Finding I of this report. Based on the responses to our questions, we found that institutions that met their CCC utilization targets most commonly cited the following factors:
• The prior BOP Director and executive staff strongly encouraged institutions to refer inmates for CCC placement.
• Institution staff stressed the use and referral for CCC placement at unit team meetings and staff strongly encouraged inmates to participate.
• The institution started the CCC referral process early, especially in
cases of inmates with short sentences.
• Eligible inmates who have completed the Residential Drug Abuse Program and qualified for the one-year sentence reduction received mandatory CCC placement.
• Institution staff counseled inmates who initially refuse CCC placement
about the benefits of the program.
Based on the responses to our questionnaires, we found that institutions that did not meet their CCC utilization targets most commonly cited the following factors:
• The institution applied a conservative interpretation of the BOP’s policy regarding the eligibility of inmates for CCC placement.
56
• The institution had a large number of inmates who declined CCC placement.
• The institution had a large number of inmates with pending charges in other districts and inmates with short sentences.
Overall, institutions that met their goals attributed their success to
support from executive staff and unit teams that strongly encourage inmate participation. Those institutions that did not meet their goals attributed their failure to conservative interpretation of policy and factors outside the control of staff, such as a large percentage of inmates that were ineligible for CCC placement. According to BOP officials, at each quarterly executive staff meeting CCC utilization rates are reviewed and the regional directors may be asked to comment on any utilization rate outliers (institutions with CCC utilization rates that are significantly lower than the target utilization rate). BOP officials also stated that the regional directors are ultimately held responsible for monitoring the CCC utilization rates within their region. Although quarterly meetings are held and regional directors monitor their respective regional progress, only one specific security level (minimum, low, medium or high) is addressed at each quarterly meeting and each regional director may have a different process for monitoring CCC utilization rates. However, as shown previously, we found that during FY 2000 through FY 2002, between 28 and 54 percent of institutions we looked at failed to meet their CCC utilization targets.
As with the other areas we reviewed, this may be attributed BOP regional offices did not follow a formal standardized process to ensure that institutions are held accountable for meeting their targets and that corrective action plans are developed to remedy low CCC utilization. At each of the three regional offices we identified the process for reviewing CCC utilization rates and found that each of the three regional offices had different processes. For example, one regional office did not have a process in place for reviewing CCC utilization rates, while another reviewed the rates but did not necessarily follow-up consistently with institutions that did not meet their targets.
Conversely, the Northeast Regional Office has established a formal process to ensure that all eligible inmates at each of its institutions are provided the opportunity to transition into the community through a CCC. The Northeast Regional Office officials review the CCC utilization data contained in Key Indicators system and the quarterly CCC utilization report
57
prepared by the BOP’s Central Office in order to determine if its institutions are “on track” to meet established CCC utilization targets. Further, the Northeast Regional Office requires each of its institutions to submit a monthly CCC utilization report identifying both the number of inmates referred for and those denied CCC placement. For all inmates denied CCC placement, regional officials ask the institution to provide a detailed explanation regarding the basis for the inmate’s CCC denial. Regional officials then review each denial in order to determine whether the denial is in compliance with the CCC utilization policy.
We also found that the CCC utilization rates and targets cannot be used to determine whether all eligible inmates at each institution were released to the community through a CCC, as required by BOP policy. Currently, the CCC utilization targets range from 65 percent for medium security level institutions to 80 percent for minimum security level institutions (a CCC utilization target has not been established for high security level institutions). Therefore, even if an institution achieves or exceeds the CCC utilization target for its security level, the BOP does not assure that all eligible inmates were transitioned through a CCC. In our judgment implementing a formal process for reviewing eligible inmates that are denied CCC placement, similar to the Northeast Regional Office, would also ensure that all eligible inmates are placed in a CCC prior to release.
It should be noted that subsequent to our audit, the BOP proposed a
revision to the CCC utilization targets including the establishment of a CCC utilization target for high security level institutions and increasing the targets for minimum, low and medium security level institutions. However, to date the BOP has not approved or implemented the proposed revisions to the CCC utilization targets.
Recommendations
We recommend that the BOP: 12. Establish a CCC utilization target for its high security institutions. 13. Establish and implement a formal process to ensure that all eligible
inmates are placed in a CCC prior to release.

APPENDIX I
58
STATEMENT ON COMPLIANCE WITH LAWS AND REGULATIONS
We conducted our audit of the BOP preparation of Inmates for Reentry into Society in accordance with Government Auditing Standards. As required by the standards, we audited the BOP’s programs designed to prepare inmates for reentry into society in order to obtain reasonable assurance that the BOP complied with laws and regulations, that, if not complied with, in our judgment could have a material effect on the administration its programs. Compliance with laws and regulations related to the preparation of inmates for reentry into society is the responsibility of the BOP management. An audit includes examining, on a test basis, evidence about compliance with laws and regulations. At the time of our audit, the pertinent legislation and the applicable regulations were the:
• Violent Crime Control and Law Enforcement Act of 1994 (VCCLEA), • Prison Litigation Reform Act of 1995 (PLRA), and
• Crime Control Act of 1990.
Except for the issues discussed in the Findings and Recommendations
section of this report, nothing came to our attention that caused us to believe that the BOP management was not in compliance with the laws listed above.
APPENDIX II
59
STATEMENT ON MANAGEMENT CONTROLS
In planning and performing our audit of the BOP Preparation of Inmates for Reentry into Society, we considered the BOP’s management controls for the purpose of determining our auditing procedures. The evaluation was not made for the purpose of providing assurance on the management control structure as a whole; however, we noted certain matters that we consider reportable conditions under generally accepted government auditing standards.
• The BOP did not ensure that its institutions set realistic occupational and educational completion goals. Further, the program completion goals are stated as the number of completions rather than a percentage of completions, which does not accurately reflect program performance because it does not take into account the number of enrollments or the inmate population, see Finding I.
• The BOP did not have a mechanism in place to hold institutions
accountable for meeting goals. Additionally, institutions were not required to develop or implement corrective actions plans to remedy performance and ensure that goals are met in the future, see Finding I.
• Despite the wide range in the percentage of inmates that successfully
completed occupational programs and the percentage of inmates that withdrew from the mandatory GED program at institutions of the same security level, the BOP did not use the data for reviewing program performance at each of its institutions, see Finding I.
• The BOP has only tracked the participation data for most of its
psychological programs since January 2003. However, the BOP does not use its data for reviewing program participation at each of its institutions, see Finding I.
• The BOP also does not track the percentage of inmates that
successfully complete the RPP at each of its institutions prior to release, see Finding I.
• The BOP has not established a CCC utilization target for its high
security institutions. Additionally, the BOP does not have a formal standardized process to ensure that institutions are held accountable

APPENDIX II
60
for meeting their goals and that corrective actions plans are developed to remedy low CCC utilization, see Finding II.
• The CCC utilization rates and targets cannot be used to determine
whether all eligible inmates at each institution were released to the community through a CCC, as required by BOP policy, see Finding II.
Because we are not expressing an opinion on the BOP’s overall
management control structure, this statement is intended solely for the information and use of the BOP in managing its programs designed to prepare inmates for reentry into society.

APPENDIX III
61
OBJECTIVES, SCOPE, AND METHODOLOGY
The purpose of our audit was to determine whether the BOP ensures that federal inmates benefit from its programs designed to prepare inmates for successful reentry into society. The objectives of our audit were to determine whether the BOP ensures that each of its institutions maximize the number inmates that complete programs designed to prepare inmates for reentry into society including occupational, educational, psychological, and other programs; and all eligible inmates are provided the opportunity to transition through a CCC in preparation for reentry into society.
We conducted our audit in accordance with Government Auditing Standards. We included such tests as were necessary to accomplish the audit objectives.
We conducted fieldwork at the BOP Central Office, and conducted field work and/or obtained information through questionnaires from the following BOP regional offices and institutions:
• North Central Regional Office, Kansas City, Kansas; • Northeast Regional Office, Philadelphia, Pennsylvania; • South Central Regional Office, Dallas, Texas; • FPC Alderson, Alderson, West Virginia; • USP Allenwood, White Deer, Pennsylvania; • USP Atlanta, Atlanta, Georgia; • FCI Bastrop, Bastrop, Texas; • FCI Beaumont, Beaumont, Texas; • FCI Beckley, Beaver, West Virginia; • FCI Butner, Butner, North Carolina; • FPC Eglin, Eglin, Florida;

APPENDIX III
62
• FCI El Reno, El Reno, Oklahoma;
• FCI Elkton, Elkton, Ohio; • FCI Englewood, Englewood, Colorado; • ADX Florence, Florence, Colorado; • FCI Florence and the adjacent camp, Florence, Colorado; • USP Florence, Florence, Colorado; • FCI Fort Dix, Fort Dix, New Jersey; • FCI Greenville, Greenville, Illinois; • USP Leavenworth, Leavenworth, Kansas; • USP Lompoc, Lompoc, California; • USP Marion, Marion, Illinois; • FCI Milan, Milan, Michigan; • FCI Morgantown, Morgantown, West Virginia; • FPC Pensacola, Pensacola, Florida; • FCI Safford, Safford, Arizona; • FCI Sandstone, Sandstone, Minnesota; • FPC Seymour Johnson, Goldsboro, North Carolina; • USP Terre Haute, Terre Haute, Indiana; and • FPC Yankton, Yankton, South Dakota.
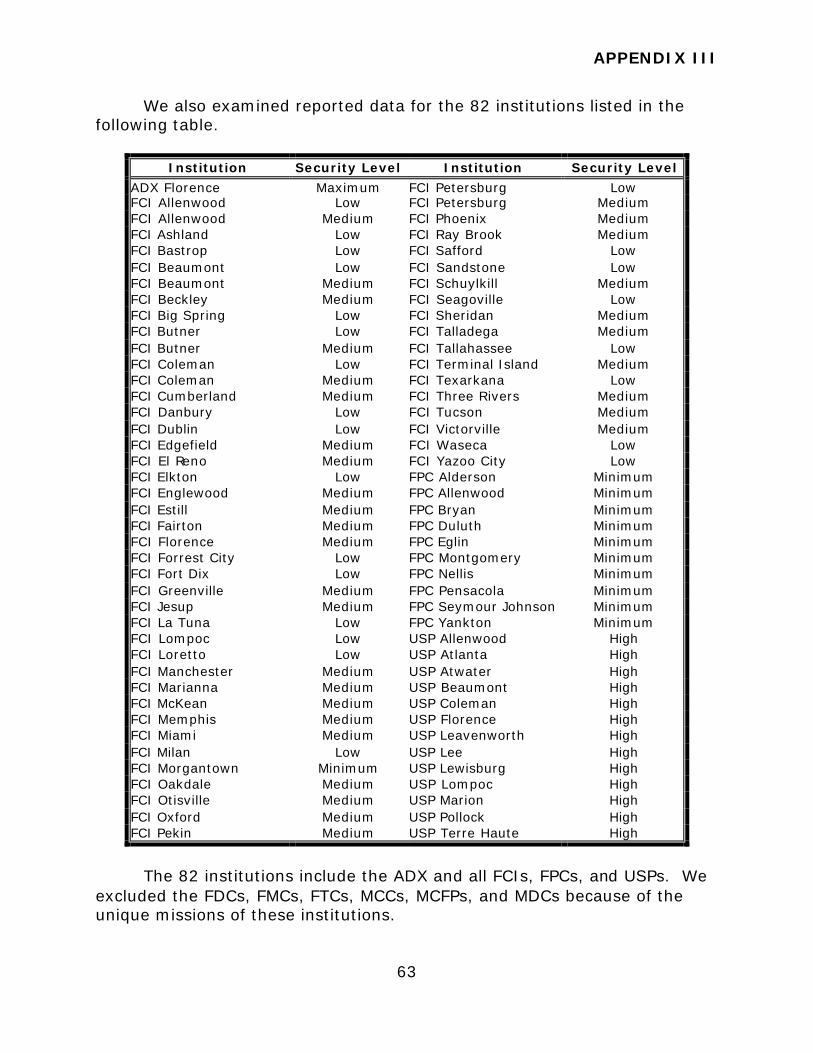
APPENDIX III
63
We also examined reported data for the 82 institutions listed in the following table.
Institution Security Level Institution Security Level
ADX Florence Maximum FCI Petersburg Low FCI Allenwood Low FCI Petersburg Medium FCI Allenwood Medium FCI Phoenix Medium FCI Ashland Low FCI Ray Brook Medium FCI Bastrop Low FCI Safford Low FCI Beaumont Low FCI Sandstone Low FCI Beaumont Medium FCI Schuylkill Medium FCI Beckley Medium FCI Seagoville Low FCI Big Spring Low FCI Sheridan Medium FCI Butner Low FCI Talladega Medium FCI Butner Medium FCI Tallahassee Low FCI Coleman Low FCI Terminal Island Medium FCI Coleman Medium FCI Texarkana Low FCI Cumberland Medium FCI Three Rivers Medium FCI Danbury Low FCI Tucson Medium FCI Dublin Low FCI Victorville Medium FCI Edgefield Medium FCI Waseca Low FCI El Reno Medium FCI Yazoo City Low FCI Elkton Low FPC Alderson Minimum FCI Englewood Medium FPC Allenwood Minimum FCI Estill Medium FPC Bryan Minimum FCI Fairton Medium FPC Duluth Minimum FCI Florence Medium FPC Eglin Minimum FCI Forrest City Low FPC Montgomery Minimum FCI Fort Dix Low FPC Nellis Minimum FCI Greenville Medium FPC Pensacola Minimum FCI Jesup Medium FPC Seymour Johnson Minimum FCI La Tuna Low FPC Yankton Minimum FCI Lompoc Low USP Allenwood High FCI Loretto Low USP Atlanta High FCI Manchester Medium USP Atwater High FCI Marianna Medium USP Beaumont High FCI McKean Medium USP Coleman High FCI Memphis Medium USP Florence High FCI Miami Medium USP Leavenworth High FCI Milan Low USP Lee High FCI Morgantown Minimum USP Lewisburg High FCI Oakdale Medium USP Lompoc High FCI Otisville Medium USP Marion High FCI Oxford Medium USP Pollock High FCI Pekin Medium USP Terre Haute High
The 82 institutions include the ADX and all FCIs, FPCs, and USPs. We
excluded the FDCs, FMCs, FTCs, MCCs, MCFPs, and MDCs because of the unique missions of these institutions.

APPENDIX III
64
To determine the percentage of the educational and occupational goals achieved, we obtained the Annual Program Report for Education and Recreation Services for FY 1999 through FY 2002 for each institution included in our audit. We compared the completion goals and outcomes reported for each institution’s GED, ESL, ACE, parenting, and occupational programs and determined the percentage of goal achieved, which equates to the outcome divided by goal. Additionally, for FY 2002 we compared the National Strategic Plan performance indicator goal and outcome for the percent of inmates enrolled in one or more education programs for each institution and determined the percentage of goal obtained.
To determine the percentage of the CCC utilization targets achieved
for each institution during FY 2000 through 2002, we obtained the total number of inmates transferred to a CCC and total number of inmates released directly to the community as reported in the BOP’s Key Indicators system.48 To calculate the CCC utilization rate for each institution, which equates to the number of inmates transferred to a CCC divided by the number of inmates transferred to a CCC plus the number of inmates released directly into the community. We then compared the CCC utilization rate for each institution to the BOP’s goal for that security level and determined the percentage of the goal achieved which equates to the outcome divided by goal.
To determine the GED performance factor for each institution during
FY 1999 through FY 2002, we obtained the total number of completions and withdrawals from the BOP’s Key Indicators system. We then calculated the GED performance factor, which equates to completions divided by completions plus withdrawals. Additionally, to determine the GED performance factor based on voluntary withdrawals for each institution, we obtained the total number of completions and voluntary withdrawals from the BOP’s Key Indicators system. We then calculated the GED performance factor, which equates to completions divided by completions plus voluntary withdrawals.
To determine the percentage of citizen inmates required to participate
in the literacy program that have dropped out and are therefore not promotable above the maintenance pay grade for work programs, we obtained the percentage of GED Dropped Non-promotable (GED DN) from the BOP’s Key Indicators system for FY 1999 through FY 2002. Additionally,
48 The BOP, Key Indicators, A Strategic Support System of the Federal Bureau of
Prisons, Volume 14, Number 1, January 2003.
APPENDIX III
65
to determine the percentage of noncitizen inmates required participate in the literacy program that have dropped out and are therefore not promotable above the maintenance pay grade for work programs, we obtained the percentage of Exempt GED Non-promotable (GED XN) from the BOP’s Key Indicators system.
Finally, to determine the occupational technical and vocational
performance factors for each institution during FY 1999 through FY 2002, we obtained the total number of completions and withdrawals from the BOP’s Key Indicators system. We then calculated the occupational technical performance factor, which equates to completions divided by completions plus withdrawals.

APPENDIX IV
66
ANALYSIS OF THE OCCUPATIONAL EDUCATION GOALS AND OUTCOMES FY 2001 THROUGH FY 2002
For the institutions included in our audit, we reviewed the occupational goals and outcomes for FY 1999 through FY 2002 reported in each institution’s Annual Program Report for Education and Recreation Services. (The BOP did not require its institutions to establish occupational goals for FY 2002 because of a change in the format of the Annual Program Report for Education and Recreation Services; however, we used the FY 2002 occupational projected outcomes reported in the FY 2001 Annual Program Report for Education and Recreation Services as the FY 2002 occupational goals for our analysis.)
The following schedules provide the details of our analysis of the
occupational goals and outcomes reported by each institution in its Annual Program Report for Education and Recreation Services for FY 2001 through FY 2002. Those institutions for which the occupational goal and/or outcome is shown as “---“ in the following schedules did not include a goal and/or outcome in their Annual Program Report for Education and Recreation Services. Further, unless noted otherwise, those institutions for which the occupational goal and/or outcome is shown as “N/A“ did not submit an Program Report for Education and Recreation Services because the institution was not open and/or fully operational during the fiscal year.
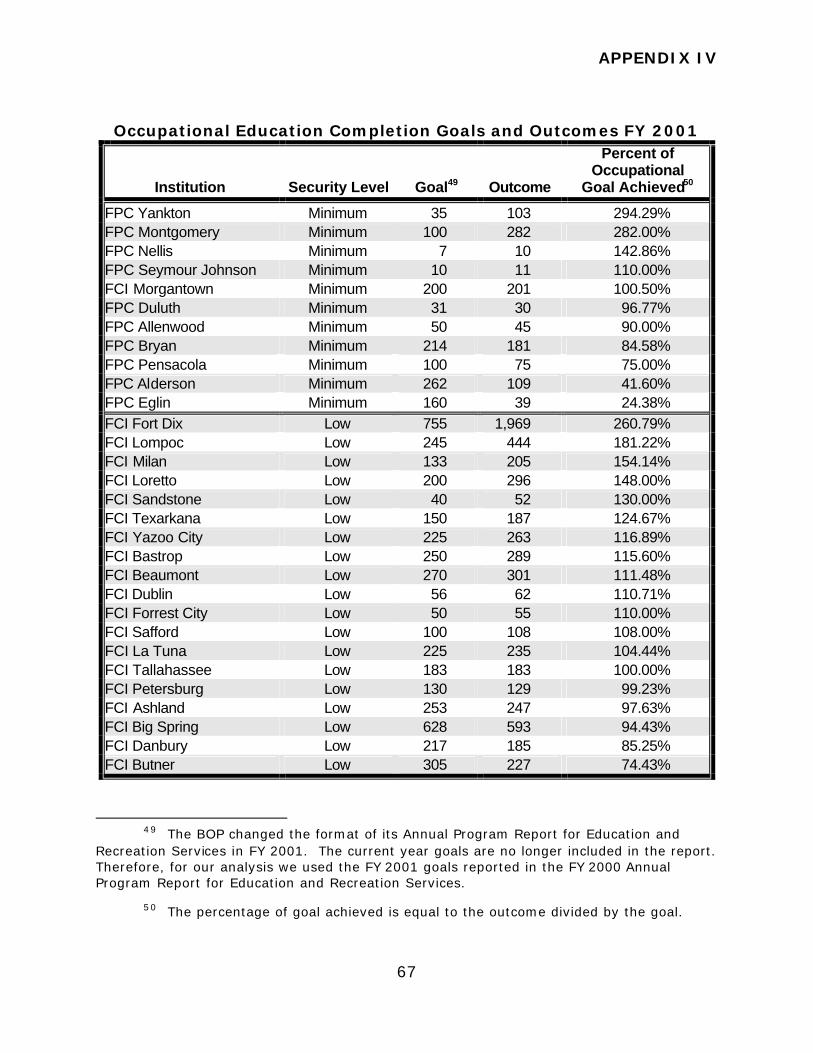
APPENDIX IV
67
Occupational Education Completion Goals and Outcomes FY 2001
Institution Security Level Goal49 Outcome
Percent of Occupational
Goal Achieved50
FPC Yankton Minimum 35 103 294.29% FPC Montgomery Minimum 100 282 282.00% FPC Nellis Minimum 7 10 142.86% FPC Seymour Johnson Minimum 10 11 110.00% FCI Morgantown Minimum 200 201 100.50% FPC Duluth Minimum 31 30 96.77% FPC Allenwood Minimum 50 45 90.00% FPC Bryan Minimum 214 181 84.58% FPC Pensacola Minimum 100 75 75.00% FPC Alderson Minimum 262 109 41.60% FPC Eglin Minimum 160 39 24.38% FCI Fort Dix Low 755 1,969 260.79% FCI Lompoc Low 245 444 181.22% FCI Milan Low 133 205 154.14% FCI Loretto Low 200 296 148.00% FCI Sandstone Low 40 52 130.00% FCI Texarkana Low 150 187 124.67% FCI Yazoo City Low 225 263 116.89% FCI Bastrop Low 250 289 115.60% FCI Beaumont Low 270 301 111.48% FCI Dublin Low 56 62 110.71% FCI Forrest City Low 50 55 110.00% FCI Safford Low 100 108 108.00% FCI La Tuna Low 225 235 104.44% FCI Tallahassee Low 183 183 100.00% FCI Petersburg Low 130 129 99.23% FCI Ashland Low 253 247 97.63% FCI Big Spring Low 628 593 94.43% FCI Danbury Low 217 185 85.25% FCI Butner Low 305 227 74.43%
49 The BOP changed the format of its Annual Program Report for Education and
Recreation Services in FY 2001. The current year goals are no longer included in the report. Therefore, for our analysis we used the FY 2001 goals reported in the FY 2000 Annual Program Report for Education and Recreation Services.
50 The percentage of goal achieved is equal to the outcome divided by the goal.
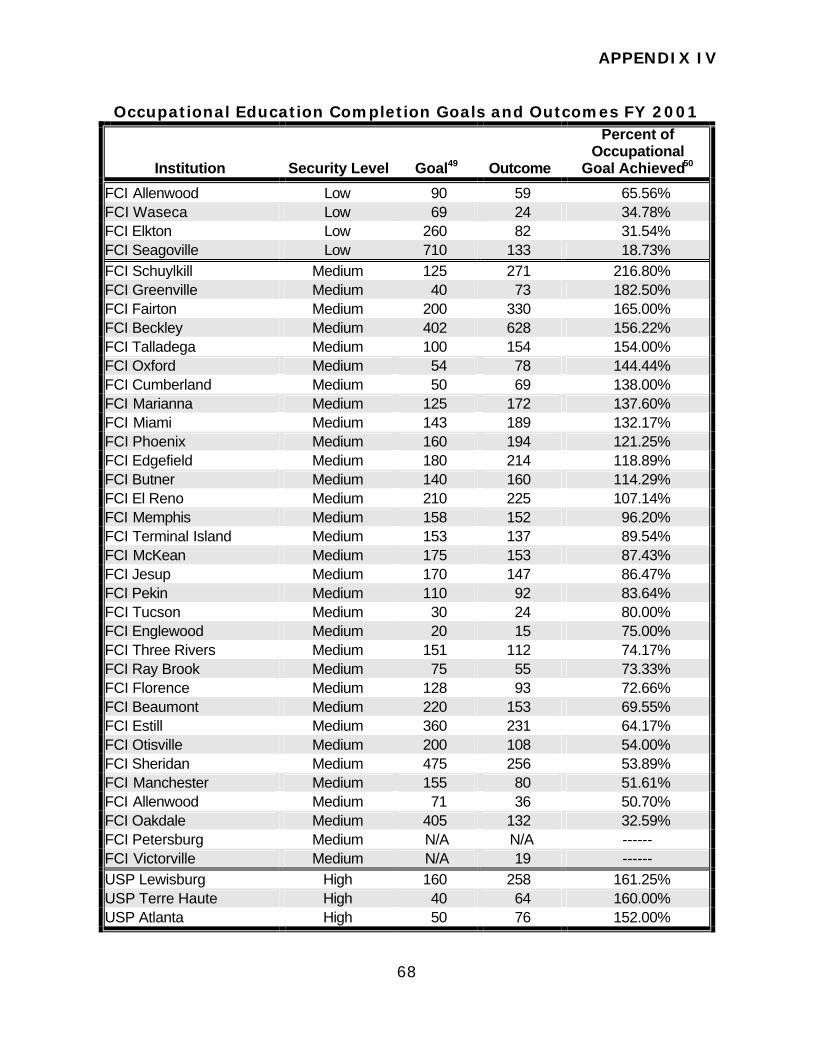
APPENDIX IV
68
Occupational Education Completion Goals and Outcomes FY 2001
Institution Security Level Goal49 Outcome
Percent of Occupational
Goal Achieved50
FCI Allenwood Low 90 59 65.56% FCI Waseca Low 69 24 34.78% FCI Elkton Low 260 82 31.54% FCI Seagoville Low 710 133 18.73% FCI Schuylkill Medium 125 271 216.80% FCI Greenville Medium 40 73 182.50% FCI Fairton Medium 200 330 165.00% FCI Beckley Medium 402 628 156.22% FCI Talladega Medium 100 154 154.00% FCI Oxford Medium 54 78 144.44% FCI Cumberland Medium 50 69 138.00% FCI Marianna Medium 125 172 137.60% FCI Miami Medium 143 189 132.17% FCI Phoenix Medium 160 194 121.25% FCI Edgefield Medium 180 214 118.89% FCI Butner Medium 140 160 114.29% FCI El Reno Medium 210 225 107.14% FCI Memphis Medium 158 152 96.20% FCI Terminal Island Medium 153 137 89.54% FCI McKean Medium 175 153 87.43% FCI Jesup Medium 170 147 86.47% FCI Pekin Medium 110 92 83.64% FCI Tucson Medium 30 24 80.00% FCI Englewood Medium 20 15 75.00% FCI Three Rivers Medium 151 112 74.17% FCI Ray Brook Medium 75 55 73.33% FCI Florence Medium 128 93 72.66% FCI Beaumont Medium 220 153 69.55% FCI Estill Medium 360 231 64.17% FCI Otisville Medium 200 108 54.00% FCI Sheridan Medium 475 256 53.89% FCI Manchester Medium 155 80 51.61% FCI Allenwood Medium 71 36 50.70% FCI Oakdale Medium 405 132 32.59% FCI Petersburg Medium N/A N/A ------ FCI Victorville Medium N/A 19 ------ USP Lewisburg High 160 258 161.25% USP Terre Haute High 40 64 160.00% USP Atlanta High 50 76 152.00%
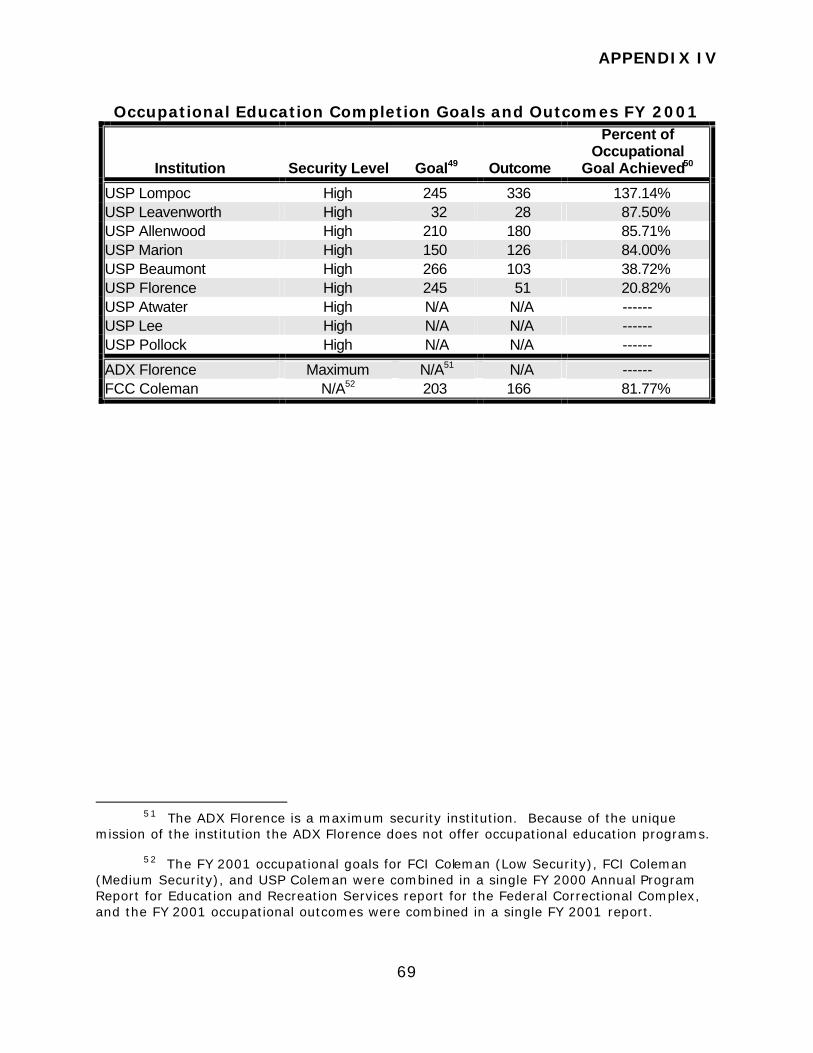
APPENDIX IV
69
Occupational Education Completion Goals and Outcomes FY 2001
Institution Security Level Goal49 Outcome
Percent of Occupational
Goal Achieved50
USP Lompoc High 245 336 137.14% USP Leavenworth High 32 28 87.50% USP Allenwood High 210 180 85.71% USP Marion High 150 126 84.00% USP Beaumont High 266 103 38.72% USP Florence High 245 51 20.82% USP Atwater High N/A N/A ------ USP Lee High N/A N/A ------ USP Pollock High N/A N/A ------
ADX Florence Maximum N/A51 N/A ------ FCC Coleman N/A52 203 166 81.77%
51 The ADX Florence is a maximum security institution. Because of the unique
mission of the institution the ADX Florence does not offer occupational education programs.
52 The FY 2001 occupational goals for FCI Coleman (Low Security), FCI Coleman (Medium Security), and USP Coleman were combined in a single FY 2000 Annual Program Report for Education and Recreation Services report for the Federal Correctional Complex, and the FY 2001 occupational outcomes were combined in a single FY 2001 report.
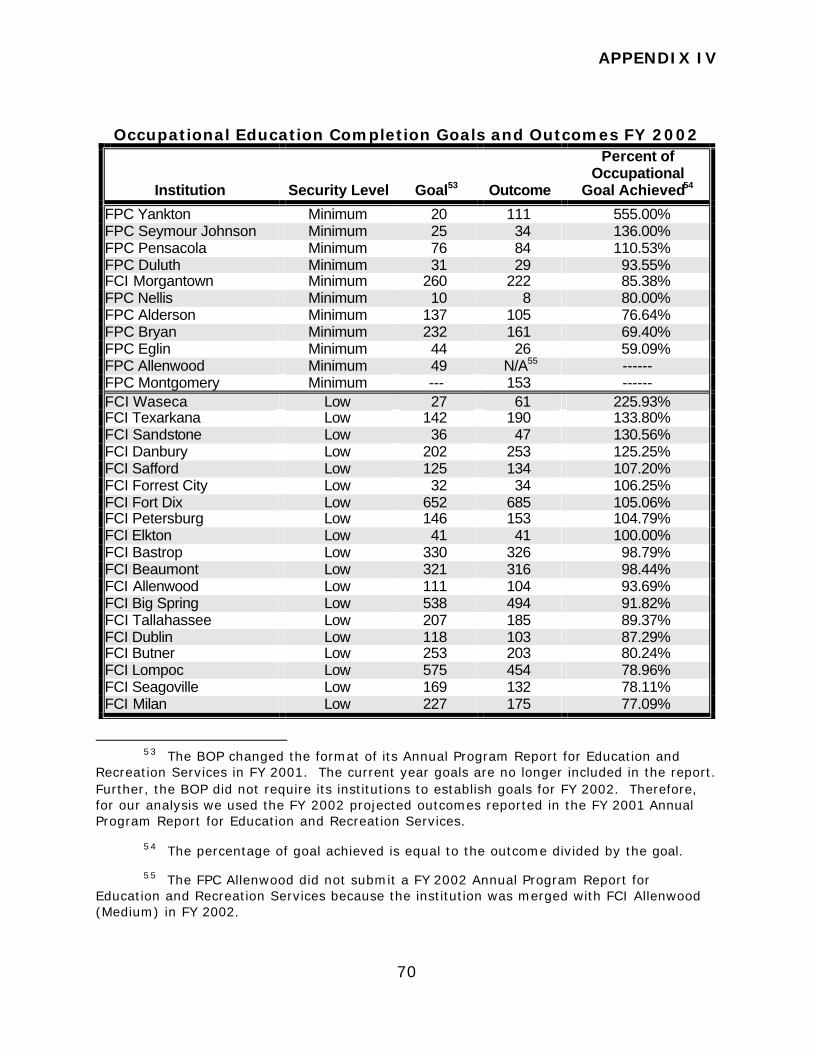
APPENDIX IV
70
Occupational Education Completion Goals and Outcomes FY 2002
Institution Security Level Goal53 Outcome
Percent of Occupational
Goal Achieved54
FPC Yankton Minimum 20 111 555.00% FPC Seymour Johnson Minimum 25 34 136.00% FPC Pensacola Minimum 76 84 110.53% FPC Duluth Minimum 31 29 93.55% FCI Morgantown Minimum 260 222 85.38% FPC Nellis Minimum 10 8 80.00% FPC Alderson Minimum 137 105 76.64% FPC Bryan Minimum 232 161 69.40% FPC Eglin Minimum 44 26 59.09% FPC Allenwood Minimum 49 N/A55 ------ FPC Montgomery Minimum --- 153 ------ FCI Waseca Low 27 61 225.93% FCI Texarkana Low 142 190 133.80% FCI Sandstone Low 36 47 130.56% FCI Danbury Low 202 253 125.25% FCI Safford Low 125 134 107.20% FCI Forrest City Low 32 34 106.25% FCI Fort Dix Low 652 685 105.06% FCI Petersburg Low 146 153 104.79% FCI Elkton Low 41 41 100.00% FCI Bastrop Low 330 326 98.79% FCI Beaumont Low 321 316 98.44% FCI Allenwood Low 111 104 93.69% FCI Big Spring Low 538 494 91.82% FCI Tallahassee Low 207 185 89.37% FCI Dublin Low 118 103 87.29% FCI Butner Low 253 203 80.24% FCI Lompoc Low 575 454 78.96% FCI Seagoville Low 169 132 78.11% FCI Milan Low 227 175 77.09%
53 The BOP changed the format of its Annual Program Report for Education and
Recreation Services in FY 2001. The current year goals are no longer included in the report. Further, the BOP did not require its institutions to establish goals for FY 2002. Therefore, for our analysis we used the FY 2002 projected outcomes reported in the FY 2001 Annual Program Report for Education and Recreation Services.
54 The percentage of goal achieved is equal to the outcome divided by the goal.
55 The FPC Allenwood did not submit a FY 2002 Annual Program Report for Education and Recreation Services because the institution was merged with FCI Allenwood (Medium) in FY 2002.
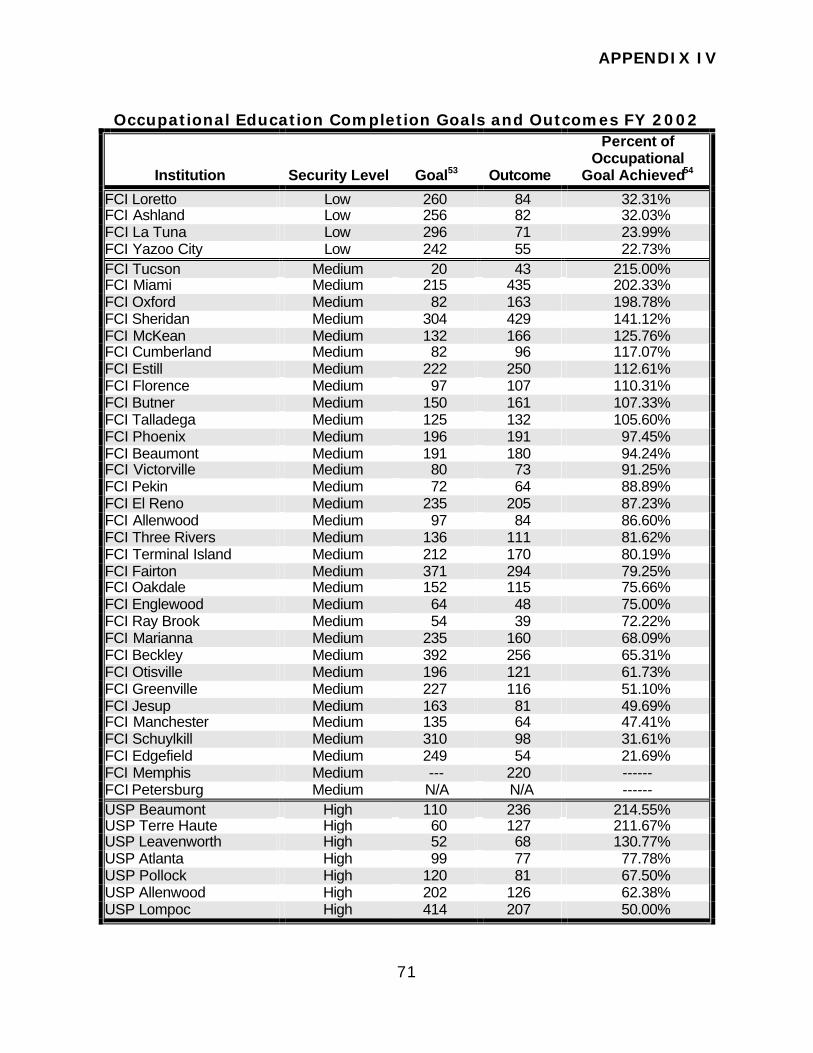
APPENDIX IV
71
Occupational Education Completion Goals and Outcomes FY 2002
Institution Security Level Goal53 Outcome
Percent of Occupational
Goal Achieved54
FCI Loretto Low 260 84 32.31% FCI Ashland Low 256 82 32.03% FCI La Tuna Low 296 71 23.99% FCI Yazoo City Low 242 55 22.73% FCI Tucson Medium 20 43 215.00% FCI Miami Medium 215 435 202.33% FCI Oxford Medium 82 163 198.78% FCI Sheridan Medium 304 429 141.12% FCI McKean Medium 132 166 125.76% FCI Cumberland Medium 82 96 117.07% FCI Estill Medium 222 250 112.61% FCI Florence Medium 97 107 110.31% FCI Butner Medium 150 161 107.33% FCI Talladega Medium 125 132 105.60% FCI Phoenix Medium 196 191 97.45% FCI Beaumont Medium 191 180 94.24% FCI Victorville Medium 80 73 91.25% FCI Pekin Medium 72 64 88.89% FCI El Reno Medium 235 205 87.23% FCI Allenwood Medium 97 84 86.60% FCI Three Rivers Medium 136 111 81.62% FCI Terminal Island Medium 212 170 80.19% FCI Fairton Medium 371 294 79.25% FCI Oakdale Medium 152 115 75.66% FCI Englewood Medium 64 48 75.00% FCI Ray Brook Medium 54 39 72.22% FCI Marianna Medium 235 160 68.09% FCI Beckley Medium 392 256 65.31% FCI Otisville Medium 196 121 61.73% FCI Greenville Medium 227 116 51.10% FCI Jesup Medium 163 81 49.69% FCI Manchester Medium 135 64 47.41% FCI Schuylkill Medium 310 98 31.61% FCI Edgefield Medium 249 54 21.69% FCI Memphis Medium --- 220 ------ FCI Petersburg Medium N/A N/A ------ USP Beaumont High 110 236 214.55% USP Terre Haute High 60 127 211.67% USP Leavenworth High 52 68 130.77% USP Atlanta High 99 77 77.78% USP Pollock High 120 81 67.50% USP Allenwood High 202 126 62.38% USP Lompoc High 414 207 50.00%
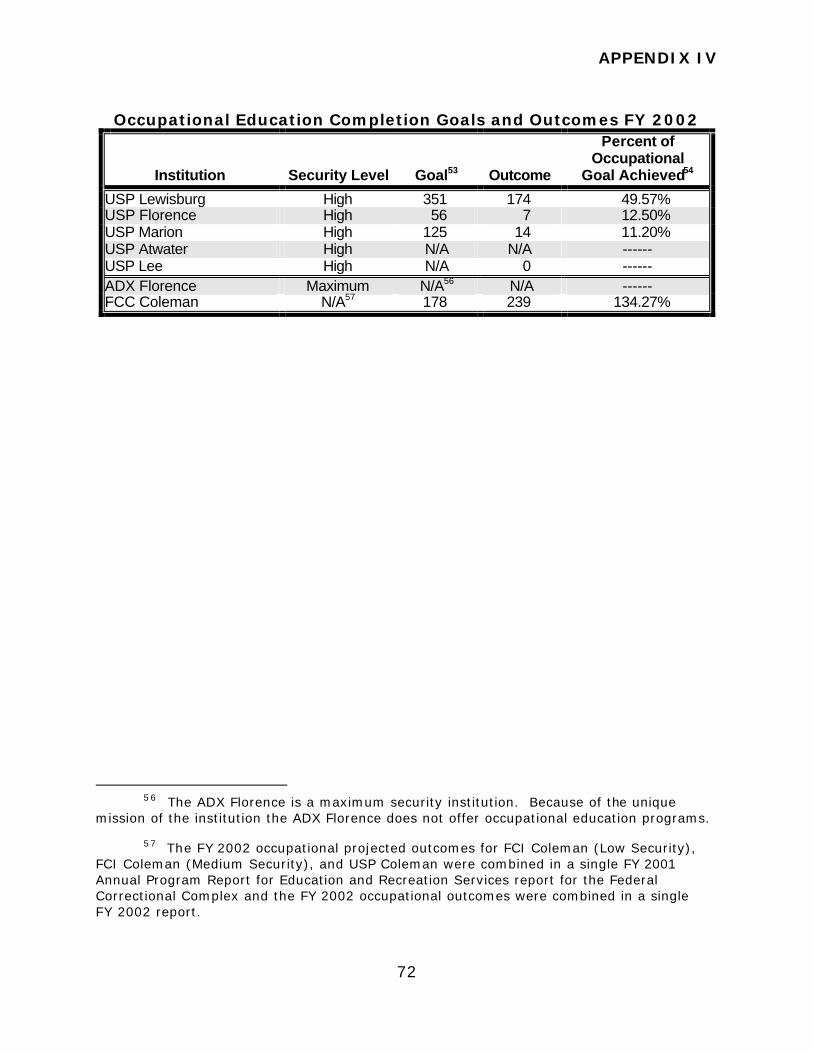
APPENDIX IV
72
Occupational Education Completion Goals and Outcomes FY 2002
Institution Security Level Goal53 Outcome
Percent of Occupational
Goal Achieved54
USP Lewisburg High 351 174 49.57% USP Florence High 56 7 12.50% USP Marion High 125 14 11.20% USP Atwater High N/A N/A ------ USP Lee High N/A 0 ------ ADX Florence Maximum N/A56 N/A ------ FCC Coleman N/A57 178 239 134.27%
56 The ADX Florence is a maximum security institution. Because of the unique
mission of the institution the ADX Florence does not offer occupational education programs.
57 The FY 2002 occupational projected outcomes for FCI Coleman (Low Security), FCI Coleman (Medium Security), and USP Coleman were combined in a single FY 2001 Annual Program Report for Education and Recreation Services report for the Federal Correctional Complex and the FY 2002 occupational outcomes were combined in a single FY 2002 report.

APPENDIX V
73
ANALYSIS OF THE GED GOALS AND OUTCOMES FY 2001
For the institutions included in our audit, we reviewed the GED goals and outcomes for FY 1999 through FY 2001 reported in each institution’s Annual Program Report for Education and Recreation Services. (The BOP did not require its institutions to establish GED goals for FY 2002 because of a change in the GED testing format that was implemented at the beginning of calendar year 2002.)
The following schedule provides the details of our analysis of the GED goals and outcomes reported by each institution in its Annual Program Report for Education and Recreation Services for FY 2001. Those institutions for which the GED goal and/or outcome is shown as “---“ in the following schedules did not include a goal and/or outcome in their Annual Program Report for Education and Recreation Services. Further, unless noted otherwise, those institutions for which the GED goal and/or outcome is shown as “N/A“ did not submit an Program Report for Education and Recreation Services because the institution was not open and/or fully operational during the fiscal year.
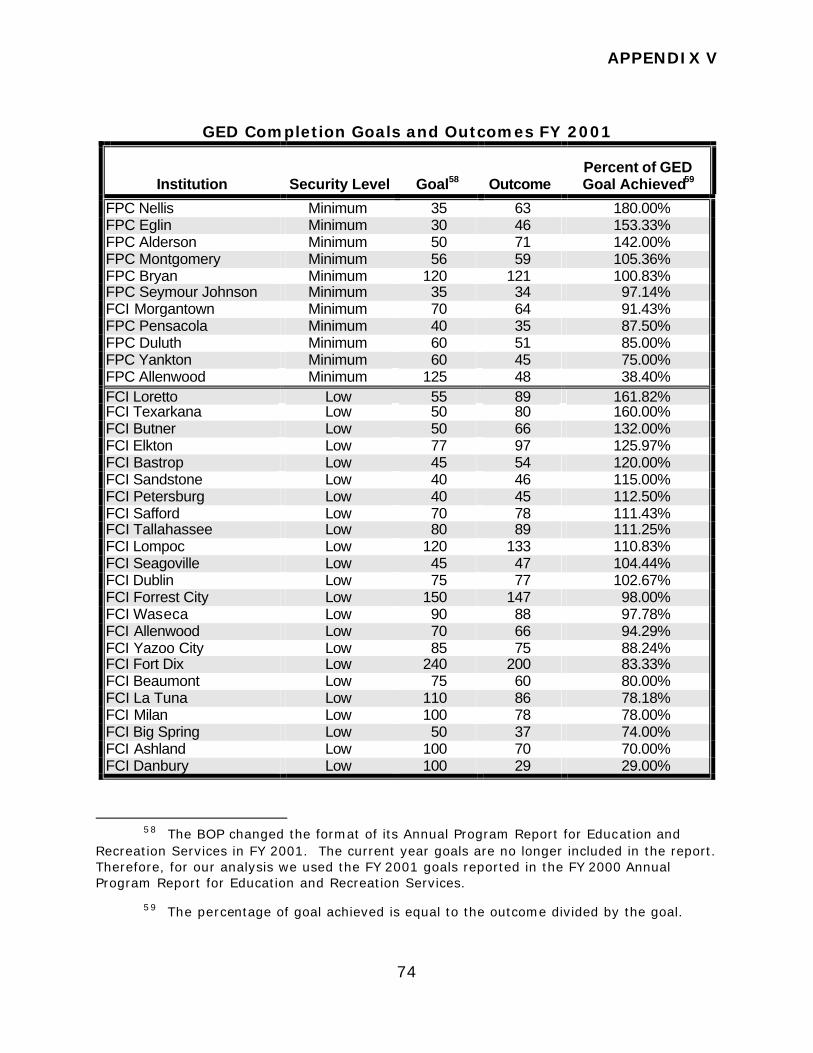
APPENDIX V
74
GED Completion Goals and Outcomes FY 2001
Institution Security Level Goal58 Outcome Percent of GED Goal Achieved59
FPC Nellis Minimum 35 63 180.00% FPC Eglin Minimum 30 46 153.33% FPC Alderson Minimum 50 71 142.00% FPC Montgomery Minimum 56 59 105.36% FPC Bryan Minimum 120 121 100.83% FPC Seymour Johnson Minimum 35 34 97.14% FCI Morgantown Minimum 70 64 91.43% FPC Pensacola Minimum 40 35 87.50% FPC Duluth Minimum 60 51 85.00% FPC Yankton Minimum 60 45 75.00% FPC Allenwood Minimum 125 48 38.40% FCI Loretto Low 55 89 161.82% FCI Texarkana Low 50 80 160.00% FCI Butner Low 50 66 132.00% FCI Elkton Low 77 97 125.97% FCI Bastrop Low 45 54 120.00% FCI Sandstone Low 40 46 115.00% FCI Petersburg Low 40 45 112.50% FCI Safford Low 70 78 111.43% FCI Tallahassee Low 80 89 111.25% FCI Lompoc Low 120 133 110.83% FCI Seagoville Low 45 47 104.44% FCI Dublin Low 75 77 102.67% FCI Forrest City Low 150 147 98.00% FCI Waseca Low 90 88 97.78% FCI Allenwood Low 70 66 94.29% FCI Yazoo City Low 85 75 88.24% FCI Fort Dix Low 240 200 83.33% FCI Beaumont Low 75 60 80.00% FCI La Tuna Low 110 86 78.18% FCI Milan Low 100 78 78.00% FCI Big Spring Low 50 37 74.00% FCI Ashland Low 100 70 70.00% FCI Danbury Low 100 29 29.00%
58 The BOP changed the format of its Annual Program Report for Education and
Recreation Services in FY 2001. The current year goals are no longer included in the report. Therefore, for our analysis we used the FY 2001 goals reported in the FY 2000 Annual Program Report for Education and Recreation Services.
59 The percentage of goal achieved is equal to the outcome divided by the goal.
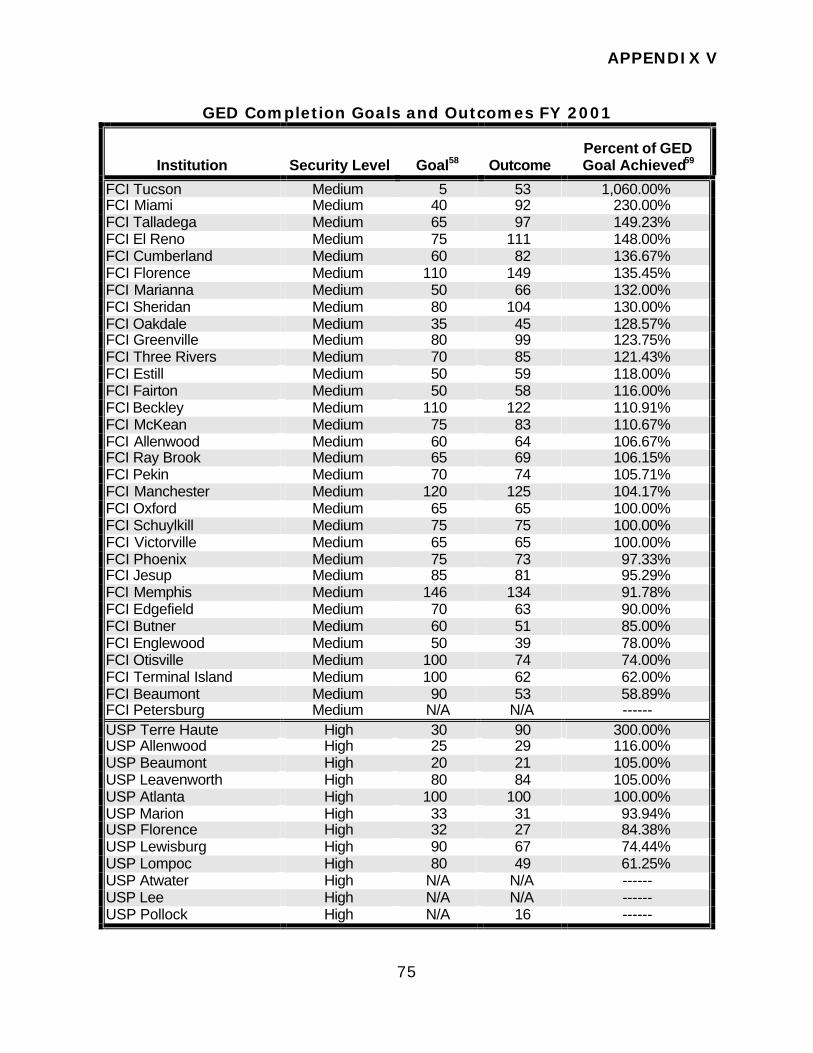
APPENDIX V
75
GED Completion Goals and Outcomes FY 2001
Institution Security Level Goal58 Outcome Percent of GED Goal Achieved59
FCI Tucson Medium 5 53 1,060.00% FCI Miami Medium 40 92 230.00% FCI Talladega Medium 65 97 149.23% FCI El Reno Medium 75 111 148.00% FCI Cumberland Medium 60 82 136.67% FCI Florence Medium 110 149 135.45% FCI Marianna Medium 50 66 132.00% FCI Sheridan Medium 80 104 130.00% FCI Oakdale Medium 35 45 128.57% FCI Greenville Medium 80 99 123.75% FCI Three Rivers Medium 70 85 121.43% FCI Estill Medium 50 59 118.00% FCI Fairton Medium 50 58 116.00% FCI Beckley Medium 110 122 110.91% FCI McKean Medium 75 83 110.67% FCI Allenwood Medium 60 64 106.67% FCI Ray Brook Medium 65 69 106.15% FCI Pekin Medium 70 74 105.71% FCI Manchester Medium 120 125 104.17% FCI Oxford Medium 65 65 100.00% FCI Schuylkill Medium 75 75 100.00% FCI Victorville Medium 65 65 100.00% FCI Phoenix Medium 75 73 97.33% FCI Jesup Medium 85 81 95.29% FCI Memphis Medium 146 134 91.78% FCI Edgefield Medium 70 63 90.00% FCI Butner Medium 60 51 85.00% FCI Englewood Medium 50 39 78.00% FCI Otisville Medium 100 74 74.00% FCI Terminal Island Medium 100 62 62.00% FCI Beaumont Medium 90 53 58.89% FCI Petersburg Medium N/A N/A ------ USP Terre Haute High 30 90 300.00% USP Allenwood High 25 29 116.00% USP Beaumont High 20 21 105.00% USP Leavenworth High 80 84 105.00% USP Atlanta High 100 100 100.00% USP Marion High 33 31 93.94% USP Florence High 32 27 84.38% USP Lewisburg High 90 67 74.44% USP Lompoc High 80 49 61.25% USP Atwater High N/A N/A ------ USP Lee High N/A N/A ------ USP Pollock High N/A 16 ------
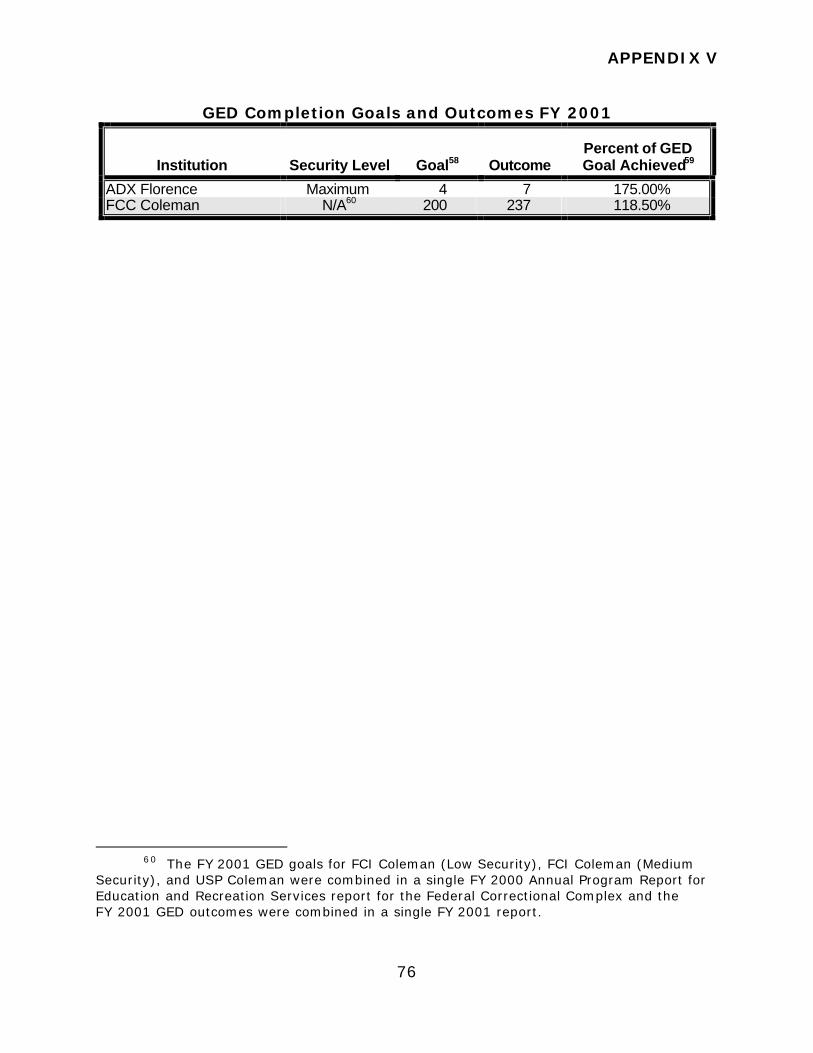
APPENDIX V
76
GED Completion Goals and Outcomes FY 2001
Institution Security Level Goal58 Outcome Percent of GED Goal Achieved59
ADX Florence Maximum 4 7 175.00% FCC Coleman N/A60 200 237 118.50%
60 The FY 2001 GED goals for FCI Coleman (Low Security), FCI Coleman (Medium
Security), and USP Coleman were combined in a single FY 2000 Annual Program Report for Education and Recreation Services report for the Federal Correctional Complex and the FY 2001 GED outcomes were combined in a single FY 2001 report.

APPENDIX VI
77
ANALYSIS OF THE ESL GOALS AND OUTCOMES FY 2001 THROUGH FY 2002
For the institutions included in our audit, we reviewed the ESL goals and outcomes for FY 1999 through FY 2002 reported in each institution’s Annual Program Report for Education and Recreation Services. (The BOP did not require its institutions to establish ESL goals for FY 2002 because of a change in the format of the Annual Program Report for Education and Recreation Services; however, we used the FY 2002 ESL projected outcomes reported in the FY 2001 Annual Program Report for Education and Recreation Services as the FY 2002 ESL goals for our analysis.)
The following schedules provide the details of our analysis of the ESL
goals and outcomes reported by each institution in its Annual Program Report for Education and Recreation Services for FY 2001 through FY 2002. Those institutions for which the ESL goal and/or outcome is shown as “---“ in the following schedules did not include a goal and/or outcome in their Annual Program Report for Education and Recreation Services. Further, unless noted otherwise, those institutions for which the ESL goal and/or outcome is shown as “N/A“ did not submit an Program Report for Education and Recreation Services because the institution was not open and/or fully operational during the fiscal year.
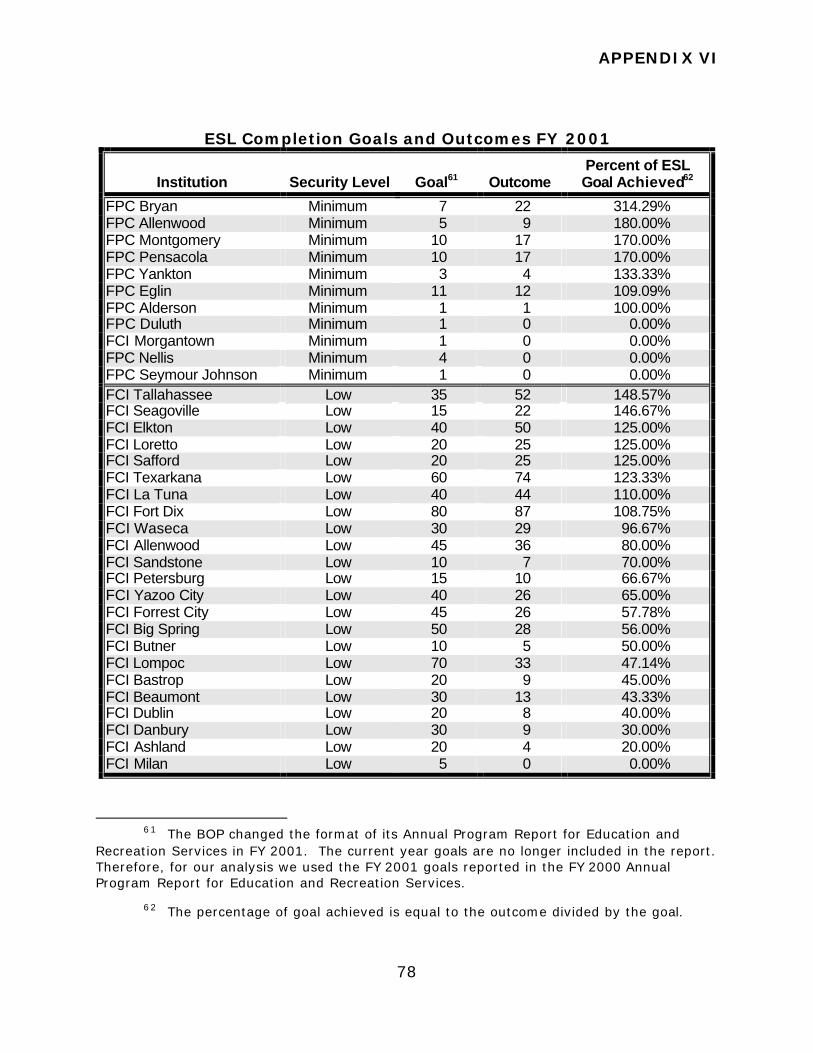
APPENDIX VI
78
ESL Completion Goals and Outcomes FY 2001
Institution Security Level Goal61 Outcome Percent of ESL Goal Achieved62
FPC Bryan Minimum 7 22 314.29% FPC Allenwood Minimum 5 9 180.00% FPC Montgomery Minimum 10 17 170.00% FPC Pensacola Minimum 10 17 170.00% FPC Yankton Minimum 3 4 133.33% FPC Eglin Minimum 11 12 109.09% FPC Alderson Minimum 1 1 100.00% FPC Duluth Minimum 1 0 0.00% FCI Morgantown Minimum 1 0 0.00% FPC Nellis Minimum 4 0 0.00% FPC Seymour Johnson Minimum 1 0 0.00% FCI Tallahassee Low 35 52 148.57% FCI Seagoville Low 15 22 146.67% FCI Elkton Low 40 50 125.00% FCI Loretto Low 20 25 125.00% FCI Safford Low 20 25 125.00% FCI Texarkana Low 60 74 123.33% FCI La Tuna Low 40 44 110.00% FCI Fort Dix Low 80 87 108.75% FCI Waseca Low 30 29 96.67% FCI Allenwood Low 45 36 80.00% FCI Sandstone Low 10 7 70.00% FCI Petersburg Low 15 10 66.67% FCI Yazoo City Low 40 26 65.00% FCI Forrest City Low 45 26 57.78% FCI Big Spring Low 50 28 56.00% FCI Butner Low 10 5 50.00% FCI Lompoc Low 70 33 47.14% FCI Bastrop Low 20 9 45.00% FCI Beaumont Low 30 13 43.33% FCI Dublin Low 20 8 40.00% FCI Danbury Low 30 9 30.00% FCI Ashland Low 20 4 20.00% FCI Milan Low 5 0 0.00%
61 The BOP changed the format of its Annual Program Report for Education and
Recreation Services in FY 2001. The current year goals are no longer included in the report. Therefore, for our analysis we used the FY 2001 goals reported in the FY 2000 Annual Program Report for Education and Recreation Services.
62 The percentage of goal achieved is equal to the outcome divided by the goal.
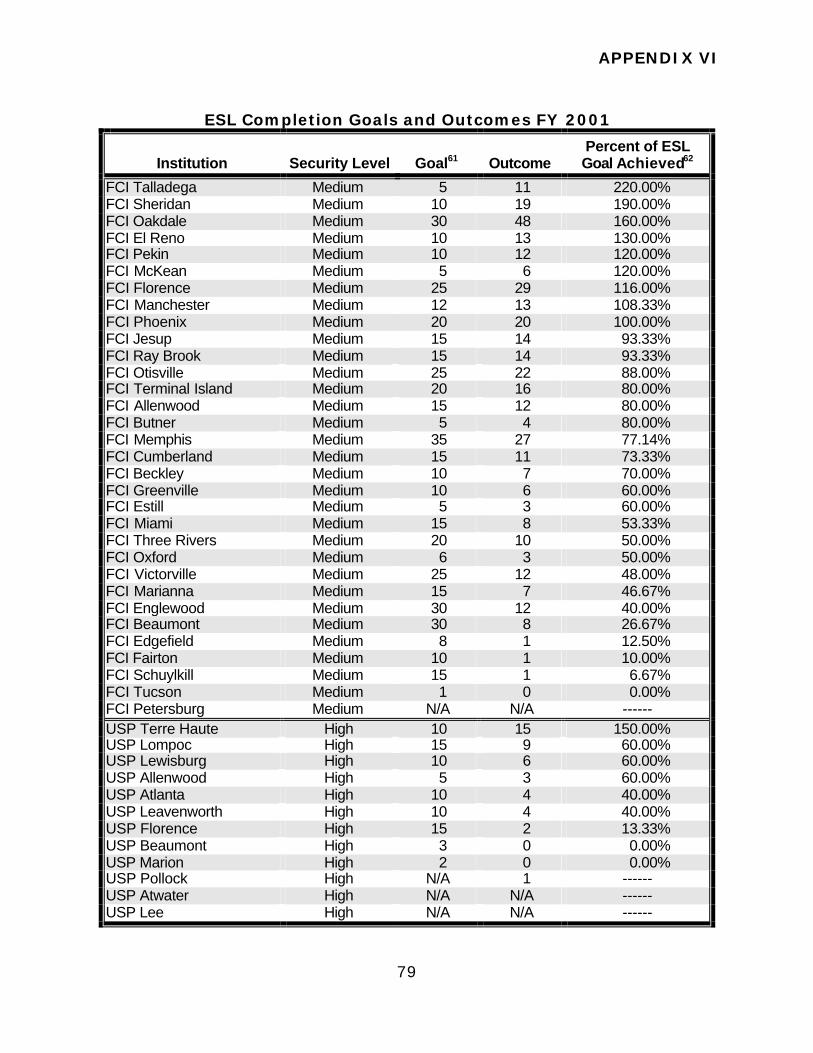
APPENDIX VI
79
ESL Completion Goals and Outcomes FY 2001
Institution Security Level Goal61 Outcome Percent of ESL Goal Achieved62
FCI Talladega Medium 5 11 220.00% FCI Sheridan Medium 10 19 190.00% FCI Oakdale Medium 30 48 160.00% FCI El Reno Medium 10 13 130.00% FCI Pekin Medium 10 12 120.00% FCI McKean Medium 5 6 120.00% FCI Florence Medium 25 29 116.00% FCI Manchester Medium 12 13 108.33% FCI Phoenix Medium 20 20 100.00% FCI Jesup Medium 15 14 93.33% FCI Ray Brook Medium 15 14 93.33% FCI Otisville Medium 25 22 88.00% FCI Terminal Island Medium 20 16 80.00% FCI Allenwood Medium 15 12 80.00% FCI Butner Medium 5 4 80.00% FCI Memphis Medium 35 27 77.14% FCI Cumberland Medium 15 11 73.33% FCI Beckley Medium 10 7 70.00% FCI Greenville Medium 10 6 60.00% FCI Estill Medium 5 3 60.00% FCI Miami Medium 15 8 53.33% FCI Three Rivers Medium 20 10 50.00% FCI Oxford Medium 6 3 50.00% FCI Victorville Medium 25 12 48.00% FCI Marianna Medium 15 7 46.67% FCI Englewood Medium 30 12 40.00% FCI Beaumont Medium 30 8 26.67% FCI Edgefield Medium 8 1 12.50% FCI Fairton Medium 10 1 10.00% FCI Schuylkill Medium 15 1 6.67% FCI Tucson Medium 1 0 0.00% FCI Petersburg Medium N/A N/A ------ USP Terre Haute High 10 15 150.00% USP Lompoc High 15 9 60.00% USP Lewisburg High 10 6 60.00% USP Allenwood High 5 3 60.00% USP Atlanta High 10 4 40.00% USP Leavenworth High 10 4 40.00% USP Florence High 15 2 13.33% USP Beaumont High 3 0 0.00% USP Marion High 2 0 0.00% USP Pollock High N/A 1 ------ USP Atwater High N/A N/A ------ USP Lee High N/A N/A ------

APPENDIX VI
80
ESL Completion Goals and Outcomes FY 2001
Institution Security Level Goal61 Outcome Percent of ESL Goal Achieved62
ADX Florence Maximum 1 0 0.00% FCC Coleman N/A63 45 107 237.78%
63 The FY 2001 ESL goals for FCI Coleman (Low Security), FCI Coleman (Medium
Security), and USP Coleman were combined in a single FY 2000 Annual Program Report for Education and Recreation Services report for the Federal Correctional Complex and the FY 2001 ESL outcomes were combined in a single FY 2001 report.
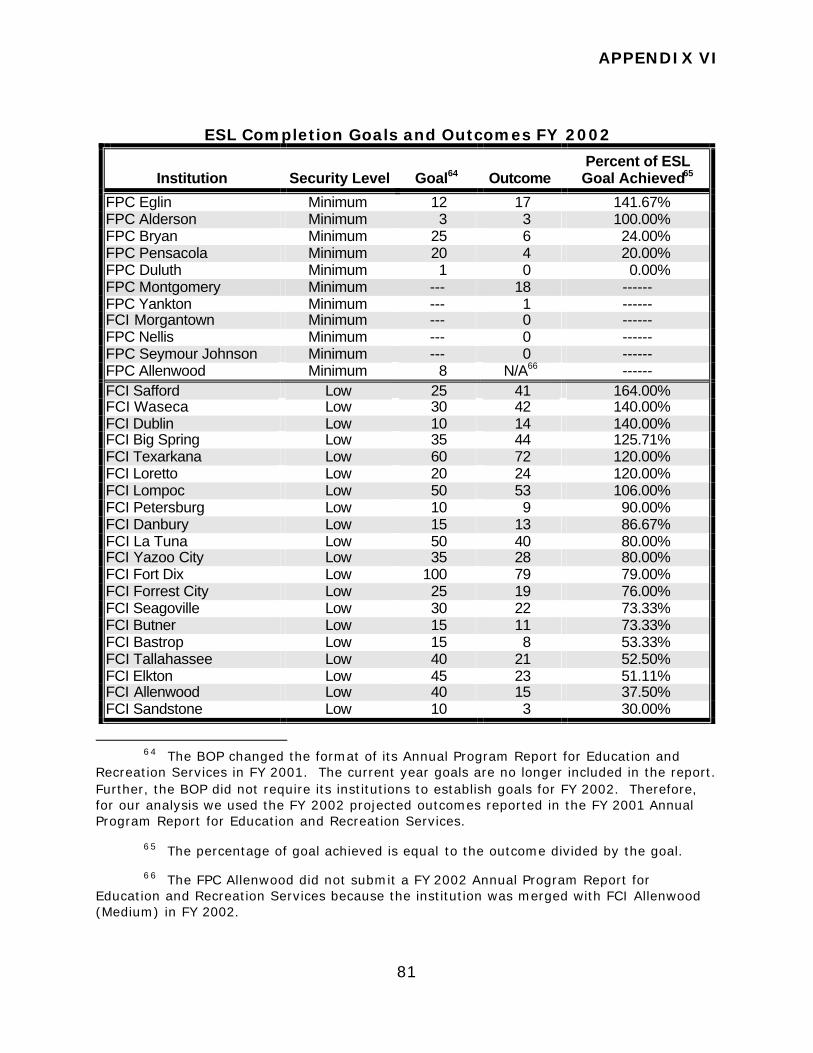
APPENDIX VI
81
ESL Completion Goals and Outcomes FY 2002
Institution Security Level Goal64 Outcome Percent of ESL Goal Achieved65
FPC Eglin Minimum 12 17 141.67% FPC Alderson Minimum 3 3 100.00% FPC Bryan Minimum 25 6 24.00% FPC Pensacola Minimum 20 4 20.00% FPC Duluth Minimum 1 0 0.00% FPC Montgomery Minimum --- 18 ------ FPC Yankton Minimum --- 1 ------ FCI Morgantown Minimum --- 0 ------ FPC Nellis Minimum --- 0 ------ FPC Seymour Johnson Minimum --- 0 ------ FPC Allenwood Minimum 8 N/A66 ------ FCI Safford Low 25 41 164.00% FCI Waseca Low 30 42 140.00% FCI Dublin Low 10 14 140.00% FCI Big Spring Low 35 44 125.71% FCI Texarkana Low 60 72 120.00% FCI Loretto Low 20 24 120.00% FCI Lompoc Low 50 53 106.00% FCI Petersburg Low 10 9 90.00% FCI Danbury Low 15 13 86.67% FCI La Tuna Low 50 40 80.00% FCI Yazoo City Low 35 28 80.00% FCI Fort Dix Low 100 79 79.00% FCI Forrest City Low 25 19 76.00% FCI Seagoville Low 30 22 73.33% FCI Butner Low 15 11 73.33% FCI Bastrop Low 15 8 53.33% FCI Tallahassee Low 40 21 52.50% FCI Elkton Low 45 23 51.11% FCI Allenwood Low 40 15 37.50% FCI Sandstone Low 10 3 30.00%
64 The BOP changed the format of its Annual Program Report for Education and
Recreation Services in FY 2001. The current year goals are no longer included in the report. Further, the BOP did not require its institutions to establish goals for FY 2002. Therefore, for our analysis we used the FY 2002 projected outcomes reported in the FY 2001 Annual Program Report for Education and Recreation Services.
65 The percentage of goal achieved is equal to the outcome divided by the goal.
66 The FPC Allenwood did not submit a FY 2002 Annual Program Report for Education and Recreation Services because the institution was merged with FCI Allenwood (Medium) in FY 2002.
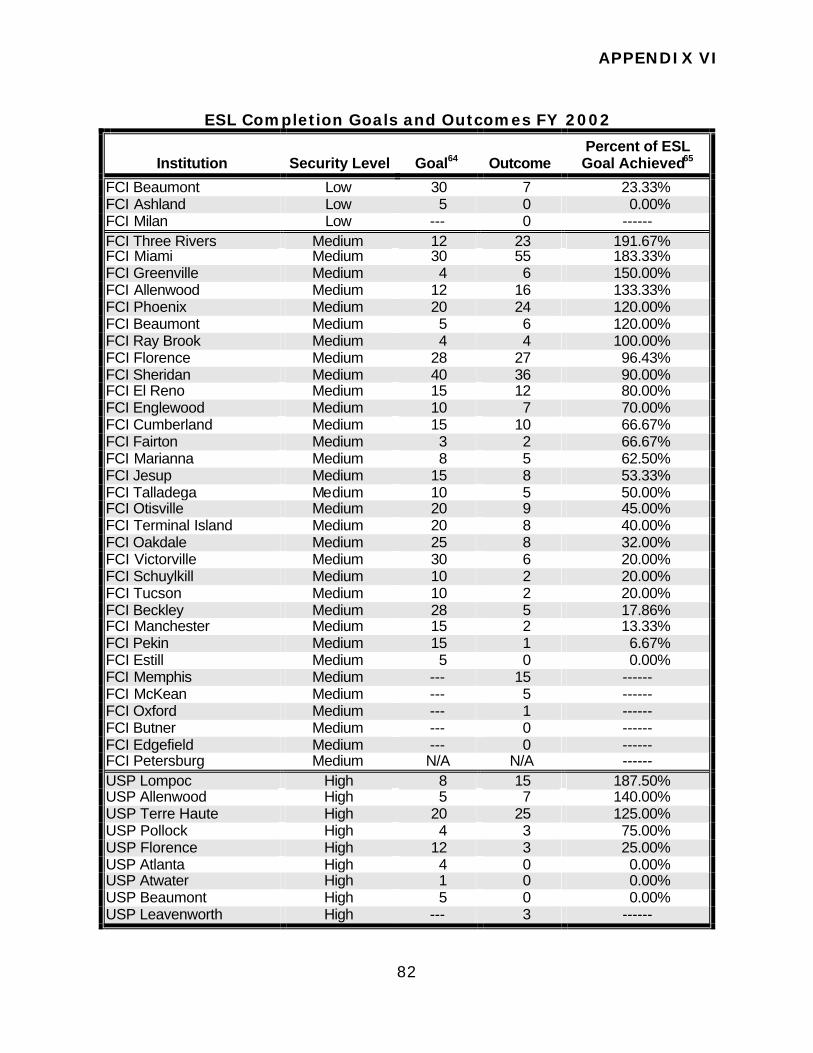
APPENDIX VI
82
ESL Completion Goals and Outcomes FY 2002
Institution Security Level Goal64 Outcome Percent of ESL Goal Achieved65
FCI Beaumont Low 30 7 23.33% FCI Ashland Low 5 0 0.00% FCI Milan Low --- 0 ------ FCI Three Rivers Medium 12 23 191.67% FCI Miami Medium 30 55 183.33% FCI Greenville Medium 4 6 150.00% FCI Allenwood Medium 12 16 133.33% FCI Phoenix Medium 20 24 120.00% FCI Beaumont Medium 5 6 120.00% FCI Ray Brook Medium 4 4 100.00% FCI Florence Medium 28 27 96.43% FCI Sheridan Medium 40 36 90.00% FCI El Reno Medium 15 12 80.00% FCI Englewood Medium 10 7 70.00% FCI Cumberland Medium 15 10 66.67% FCI Fairton Medium 3 2 66.67% FCI Marianna Medium 8 5 62.50% FCI Jesup Medium 15 8 53.33% FCI Talladega Medium 10 5 50.00% FCI Otisville Medium 20 9 45.00% FCI Terminal Island Medium 20 8 40.00% FCI Oakdale Medium 25 8 32.00% FCI Victorville Medium 30 6 20.00% FCI Schuylkill Medium 10 2 20.00% FCI Tucson Medium 10 2 20.00% FCI Beckley Medium 28 5 17.86% FCI Manchester Medium 15 2 13.33% FCI Pekin Medium 15 1 6.67% FCI Estill Medium 5 0 0.00% FCI Memphis Medium --- 15 ------ FCI McKean Medium --- 5 ------ FCI Oxford Medium --- 1 ------ FCI Butner Medium --- 0 ------ FCI Edgefield Medium --- 0 ------ FCI Petersburg Medium N/A N/A ------ USP Lompoc High 8 15 187.50% USP Allenwood High 5 7 140.00% USP Terre Haute High 20 25 125.00% USP Pollock High 4 3 75.00% USP Florence High 12 3 25.00% USP Atlanta High 4 0 0.00% USP Atwater High 1 0 0.00% USP Beaumont High 5 0 0.00% USP Leavenworth High --- 3 ------
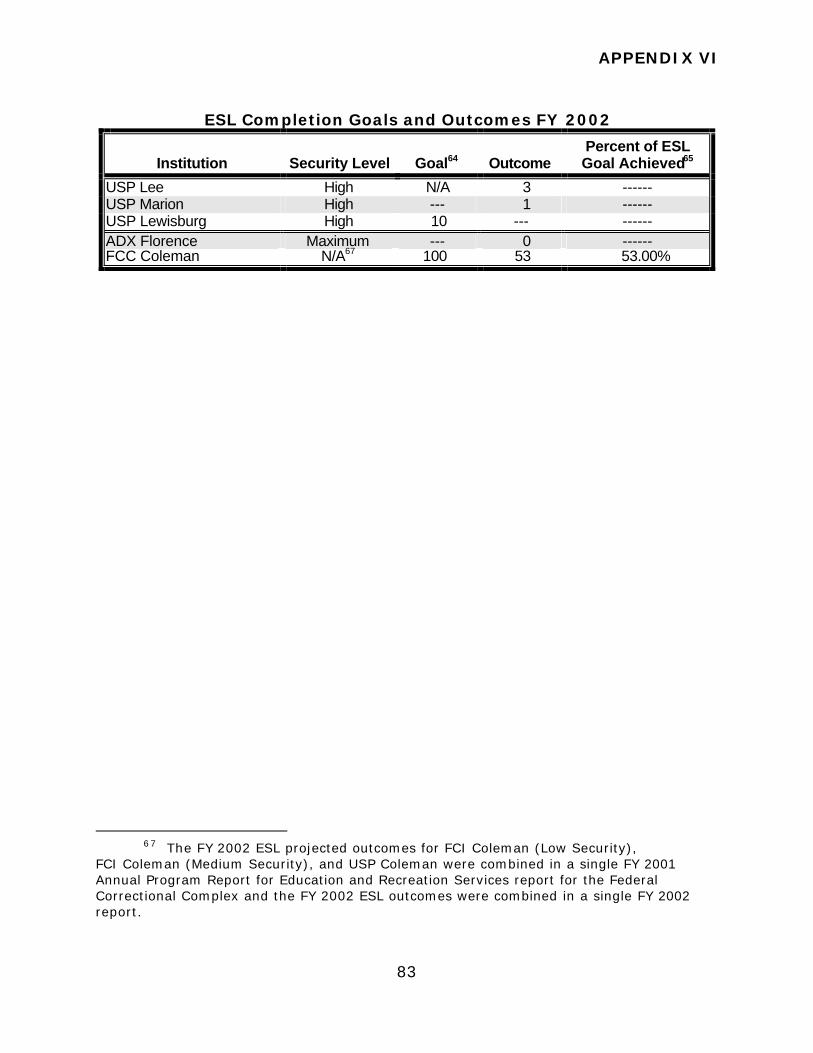
APPENDIX VI
83
ESL Completion Goals and Outcomes FY 2002
Institution Security Level Goal64 Outcome Percent of ESL Goal Achieved65
USP Lee High N/A 3 ------ USP Marion High --- 1 ------ USP Lewisburg High 10 --- ------ ADX Florence Maximum --- 0 ------ FCC Coleman N/A67 100 53 53.00%
67 The FY 2002 ESL projected outcomes for FCI Coleman (Low Security),
FCI Coleman (Medium Security), and USP Coleman were combined in a single FY 2001 Annual Program Report for Education and Recreation Services report for the Federal Correctional Complex and the FY 2002 ESL outcomes were combined in a single FY 2002 report.
APPENDIX VII
84
ANALYSIS OF THE ACE GOALS AND OUTCOMES FY 2001 THROUGH FY 2002
For the institutions included in our audit, we reviewed the ACE goals and outcomes for FY 1999 through FY 2002 reported in each institution’s Annual Program Report for Education and Recreation Services. (The BOP did not require its institutions to establish ACE goals for FY 2002 because of a change in the format of the Annual Program Report for Education and Recreation Services; however, we used the FY 2002 ACE projected outcomes reported in the FY 2001 Annual Program Report for Education and Recreation Services as the FY 2002 ACE goals for our analysis.)
The following schedules provide the details of our analysis of the ACE
goals and outcomes reported by each institution in its Annual Program Report for Education and Recreation Services for FY 2001 through FY 2002. Those institutions for which the ACE goal and/or outcome is shown as “---“ in the following schedules did not include a goal and/or outcome in their Annual Program Report for Education and Recreation Services. Further, unless noted otherwise, those institutions for which the ACE goal and/or outcome is shown as “N/A“ did not submit an Program Report for Education and Recreation Services because the institution was not open and/or fully operational during the fiscal year.
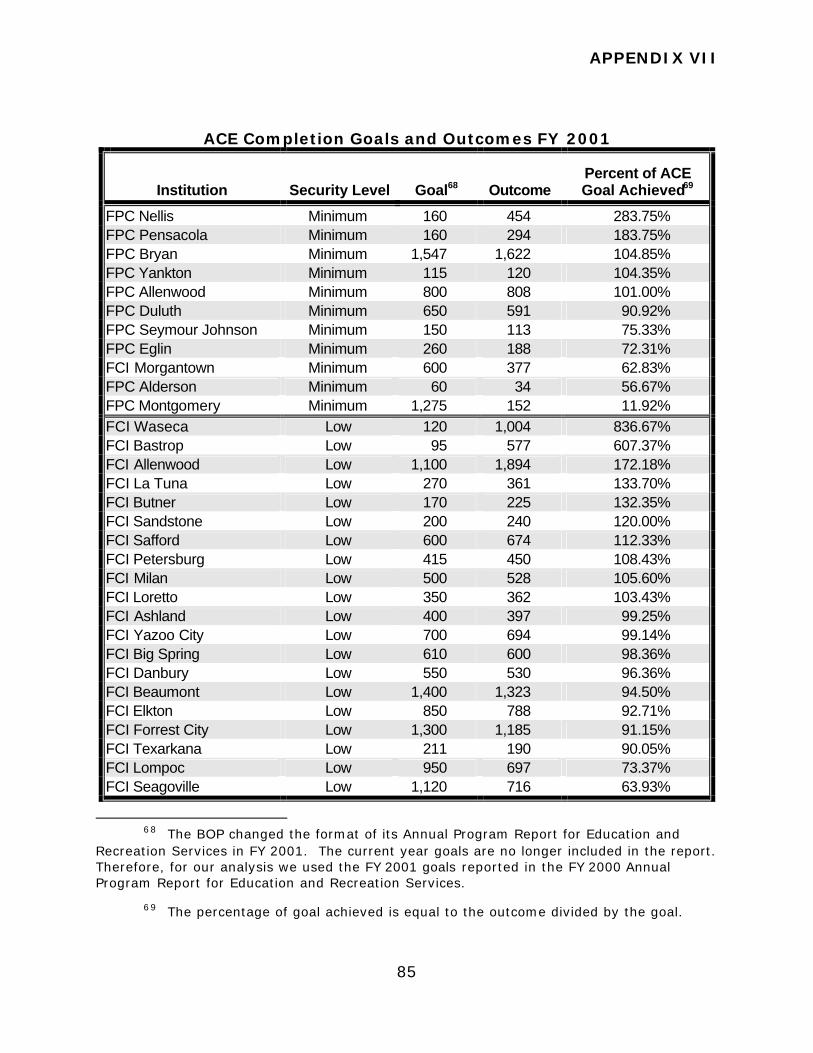
APPENDIX VII
85
ACE Completion Goals and Outcomes FY 2001
Institution Security Level Goal68 Outcome Percent of ACE Goal Achieved69
FPC Nellis Minimum 160 454 283.75% FPC Pensacola Minimum 160 294 183.75% FPC Bryan Minimum 1,547 1,622 104.85% FPC Yankton Minimum 115 120 104.35% FPC Allenwood Minimum 800 808 101.00% FPC Duluth Minimum 650 591 90.92% FPC Seymour Johnson Minimum 150 113 75.33% FPC Eglin Minimum 260 188 72.31% FCI Morgantown Minimum 600 377 62.83% FPC Alderson Minimum 60 34 56.67% FPC Montgomery Minimum 1,275 152 11.92% FCI Waseca Low 120 1,004 836.67% FCI Bastrop Low 95 577 607.37% FCI Allenwood Low 1,100 1,894 172.18% FCI La Tuna Low 270 361 133.70% FCI Butner Low 170 225 132.35% FCI Sandstone Low 200 240 120.00% FCI Safford Low 600 674 112.33% FCI Petersburg Low 415 450 108.43% FCI Milan Low 500 528 105.60% FCI Loretto Low 350 362 103.43% FCI Ashland Low 400 397 99.25% FCI Yazoo City Low 700 694 99.14% FCI Big Spring Low 610 600 98.36% FCI Danbury Low 550 530 96.36% FCI Beaumont Low 1,400 1,323 94.50% FCI Elkton Low 850 788 92.71% FCI Forrest City Low 1,300 1,185 91.15% FCI Texarkana Low 211 190 90.05% FCI Lompoc Low 950 697 73.37% FCI Seagoville Low 1,120 716 63.93%
68 The BOP changed the format of its Annual Program Report for Education and
Recreation Services in FY 2001. The current year goals are no longer included in the report. Therefore, for our analysis we used the FY 2001 goals reported in the FY 2000 Annual Program Report for Education and Recreation Services.
69 The percentage of goal achieved is equal to the outcome divided by the goal.
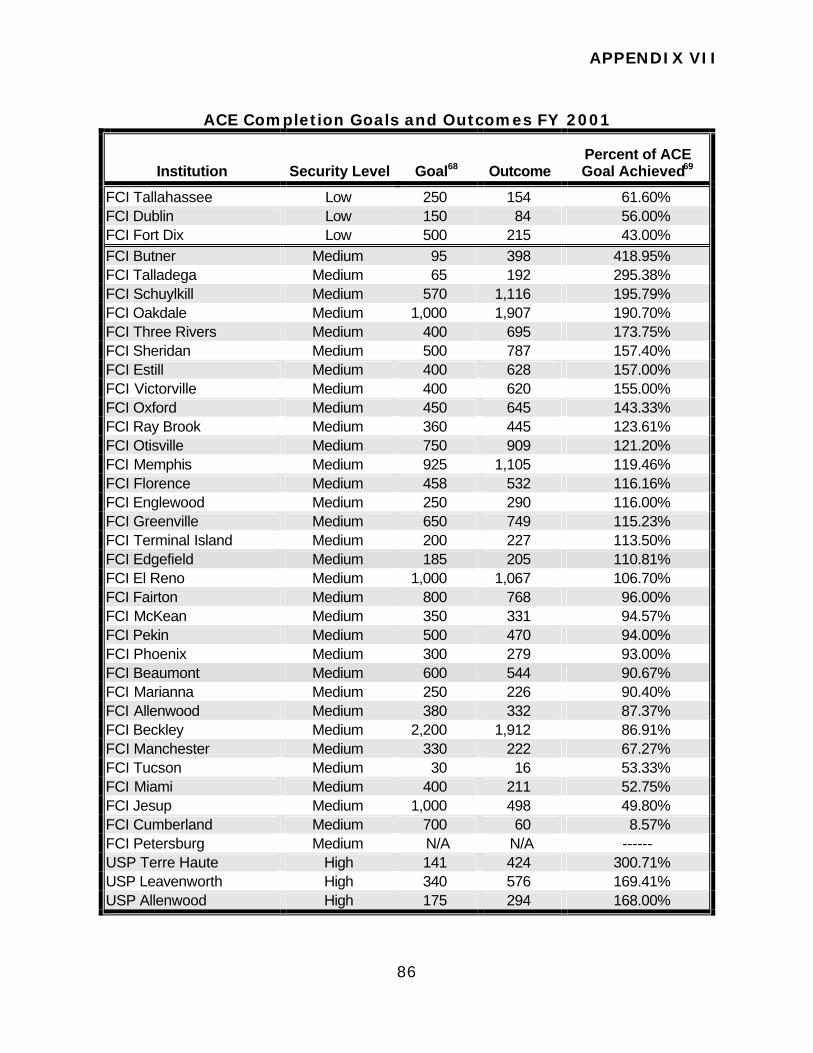
APPENDIX VII
86
ACE Completion Goals and Outcomes FY 2001
Institution Security Level Goal68 Outcome Percent of ACE Goal Achieved69
FCI Tallahassee Low 250 154 61.60% FCI Dublin Low 150 84 56.00% FCI Fort Dix Low 500 215 43.00% FCI Butner Medium 95 398 418.95% FCI Talladega Medium 65 192 295.38% FCI Schuylkill Medium 570 1,116 195.79% FCI Oakdale Medium 1,000 1,907 190.70% FCI Three Rivers Medium 400 695 173.75% FCI Sheridan Medium 500 787 157.40% FCI Estill Medium 400 628 157.00% FCI Victorville Medium 400 620 155.00% FCI Oxford Medium 450 645 143.33% FCI Ray Brook Medium 360 445 123.61% FCI Otisville Medium 750 909 121.20% FCI Memphis Medium 925 1,105 119.46% FCI Florence Medium 458 532 116.16% FCI Englewood Medium 250 290 116.00% FCI Greenville Medium 650 749 115.23% FCI Terminal Island Medium 200 227 113.50% FCI Edgefield Medium 185 205 110.81% FCI El Reno Medium 1,000 1,067 106.70% FCI Fairton Medium 800 768 96.00% FCI McKean Medium 350 331 94.57% FCI Pekin Medium 500 470 94.00% FCI Phoenix Medium 300 279 93.00% FCI Beaumont Medium 600 544 90.67% FCI Marianna Medium 250 226 90.40% FCI Allenwood Medium 380 332 87.37% FCI Beckley Medium 2,200 1,912 86.91% FCI Manchester Medium 330 222 67.27% FCI Tucson Medium 30 16 53.33% FCI Miami Medium 400 211 52.75% FCI Jesup Medium 1,000 498 49.80% FCI Cumberland Medium 700 60 8.57% FCI Petersburg Medium N/A N/A ------ USP Terre Haute High 141 424 300.71% USP Leavenworth High 340 576 169.41% USP Allenwood High 175 294 168.00%
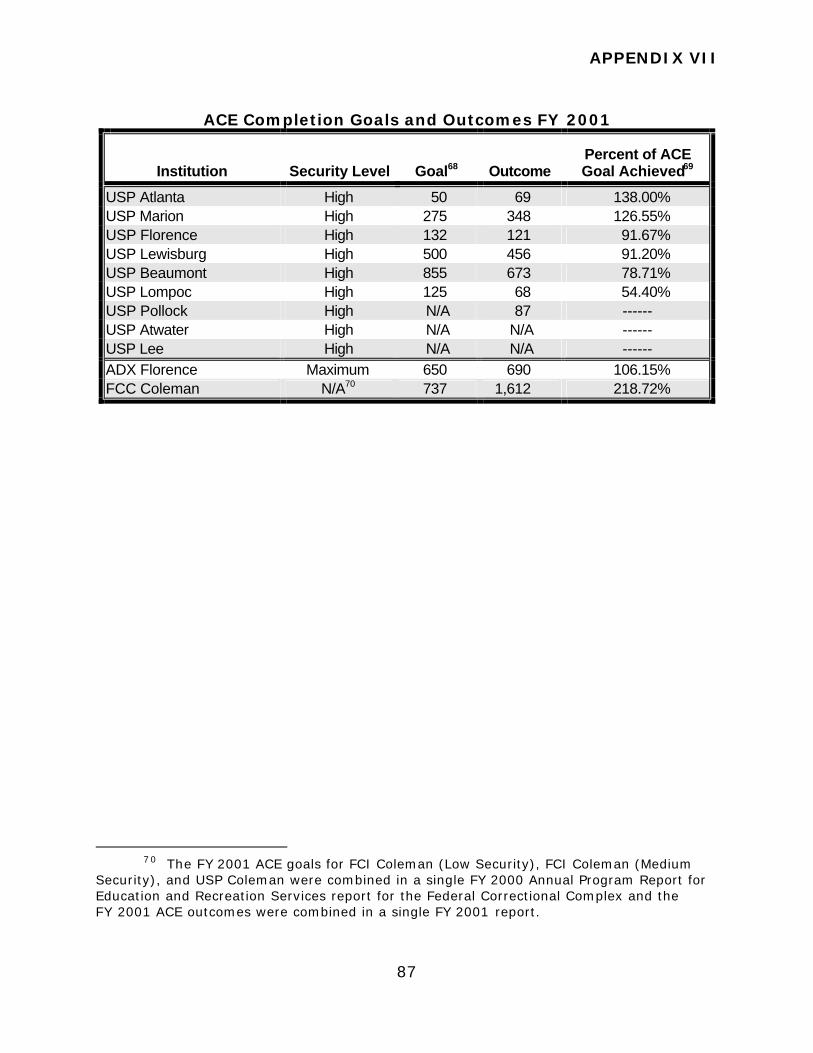
APPENDIX VII
87
ACE Completion Goals and Outcomes FY 2001
Institution Security Level Goal68 Outcome Percent of ACE Goal Achieved69
USP Atlanta High 50 69 138.00% USP Marion High 275 348 126.55% USP Florence High 132 121 91.67% USP Lewisburg High 500 456 91.20% USP Beaumont High 855 673 78.71% USP Lompoc High 125 68 54.40% USP Pollock High N/A 87 ------ USP Atwater High N/A N/A ------ USP Lee High N/A N/A ------ ADX Florence Maximum 650 690 106.15% FCC Coleman N/A70 737 1,612 218.72%
70 The FY 2001 ACE goals for FCI Coleman (Low Security), FCI Coleman (Medium
Security), and USP Coleman were combined in a single FY 2000 Annual Program Report for Education and Recreation Services report for the Federal Correctional Complex and the FY 2001 ACE outcomes were combined in a single FY 2001 report.
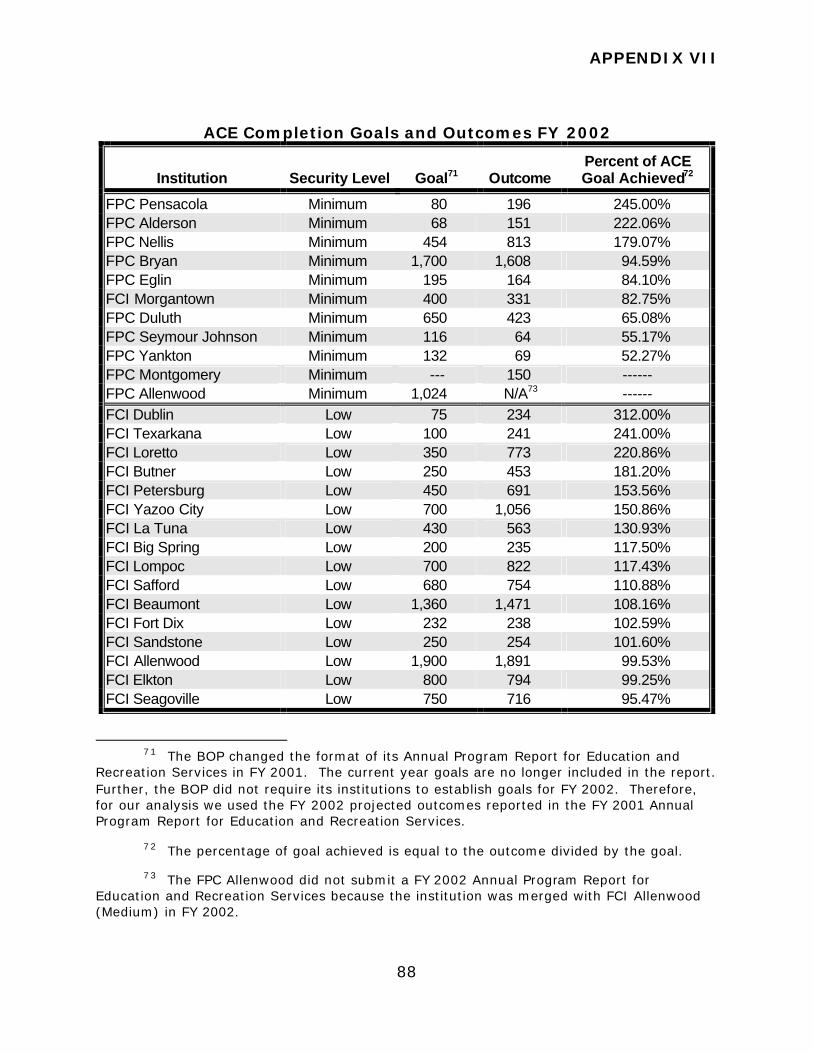
APPENDIX VII
88
ACE Completion Goals and Outcomes FY 2002
Institution Security Level Goal71 Outcome Percent of ACE Goal Achieved72
FPC Pensacola Minimum 80 196 245.00% FPC Alderson Minimum 68 151 222.06% FPC Nellis Minimum 454 813 179.07% FPC Bryan Minimum 1,700 1,608 94.59% FPC Eglin Minimum 195 164 84.10% FCI Morgantown Minimum 400 331 82.75% FPC Duluth Minimum 650 423 65.08% FPC Seymour Johnson Minimum 116 64 55.17% FPC Yankton Minimum 132 69 52.27% FPC Montgomery Minimum --- 150 ------ FPC Allenwood Minimum 1,024 N/A73 ------ FCI Dublin Low 75 234 312.00% FCI Texarkana Low 100 241 241.00% FCI Loretto Low 350 773 220.86% FCI Butner Low 250 453 181.20% FCI Petersburg Low 450 691 153.56% FCI Yazoo City Low 700 1,056 150.86% FCI La Tuna Low 430 563 130.93% FCI Big Spring Low 200 235 117.50% FCI Lompoc Low 700 822 117.43% FCI Safford Low 680 754 110.88% FCI Beaumont Low 1,360 1,471 108.16% FCI Fort Dix Low 232 238 102.59% FCI Sandstone Low 250 254 101.60% FCI Allenwood Low 1,900 1,891 99.53% FCI Elkton Low 800 794 99.25% FCI Seagoville Low 750 716 95.47%
71 The BOP changed the format of its Annual Program Report for Education and
Recreation Services in FY 2001. The current year goals are no longer included in the report. Further, the BOP did not require its institutions to establish goals for FY 2002. Therefore, for our analysis we used the FY 2002 projected outcomes reported in the FY 2001 Annual Program Report for Education and Recreation Services.
72 The percentage of goal achieved is equal to the outcome divided by the goal.
73 The FPC Allenwood did not submit a FY 2002 Annual Program Report for Education and Recreation Services because the institution was merged with FCI Allenwood (Medium) in FY 2002.
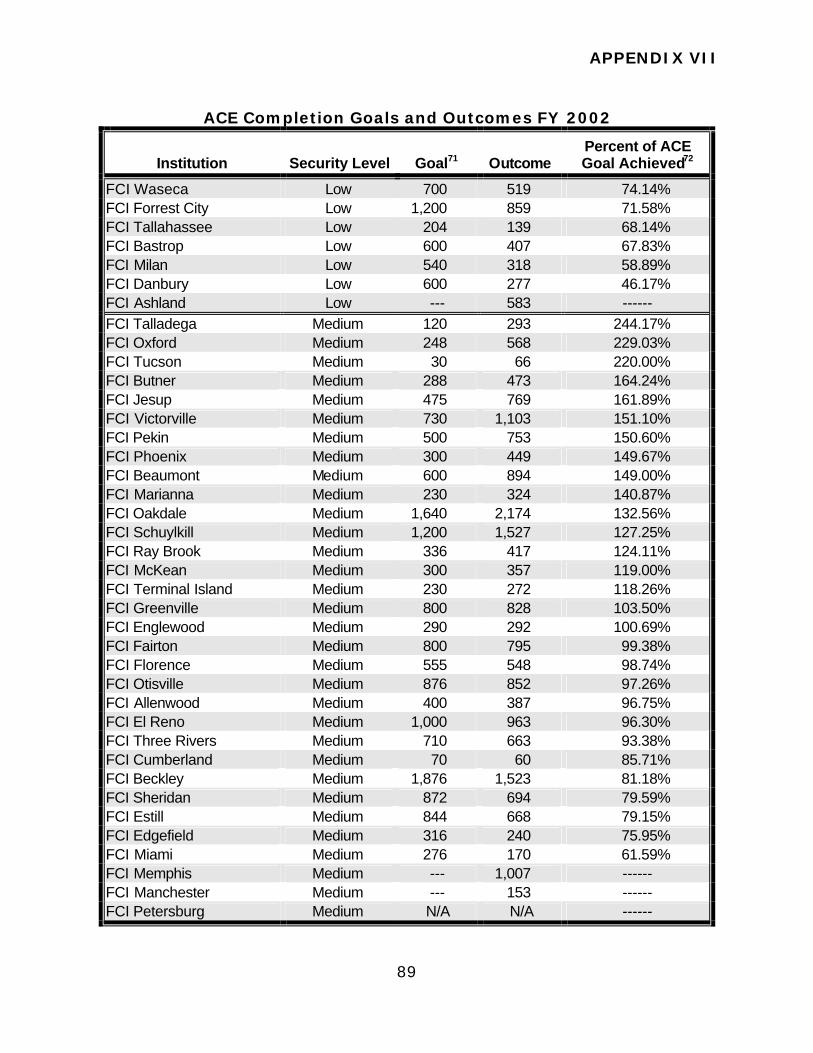
APPENDIX VII
89
ACE Completion Goals and Outcomes FY 2002
Institution Security Level Goal71 Outcome Percent of ACE Goal Achieved72
FCI Waseca Low 700 519 74.14% FCI Forrest City Low 1,200 859 71.58% FCI Tallahassee Low 204 139 68.14% FCI Bastrop Low 600 407 67.83% FCI Milan Low 540 318 58.89% FCI Danbury Low 600 277 46.17% FCI Ashland Low --- 583 ------ FCI Talladega Medium 120 293 244.17% FCI Oxford Medium 248 568 229.03% FCI Tucson Medium 30 66 220.00% FCI Butner Medium 288 473 164.24% FCI Jesup Medium 475 769 161.89% FCI Victorville Medium 730 1,103 151.10% FCI Pekin Medium 500 753 150.60% FCI Phoenix Medium 300 449 149.67% FCI Beaumont Medium 600 894 149.00% FCI Marianna Medium 230 324 140.87% FCI Oakdale Medium 1,640 2,174 132.56% FCI Schuylkill Medium 1,200 1,527 127.25% FCI Ray Brook Medium 336 417 124.11% FCI McKean Medium 300 357 119.00% FCI Terminal Island Medium 230 272 118.26% FCI Greenville Medium 800 828 103.50% FCI Englewood Medium 290 292 100.69% FCI Fairton Medium 800 795 99.38% FCI Florence Medium 555 548 98.74% FCI Otisville Medium 876 852 97.26% FCI Allenwood Medium 400 387 96.75% FCI El Reno Medium 1,000 963 96.30% FCI Three Rivers Medium 710 663 93.38% FCI Cumberland Medium 70 60 85.71% FCI Beckley Medium 1,876 1,523 81.18% FCI Sheridan Medium 872 694 79.59% FCI Estill Medium 844 668 79.15% FCI Edgefield Medium 316 240 75.95% FCI Miami Medium 276 170 61.59% FCI Memphis Medium --- 1,007 ------ FCI Manchester Medium --- 153 ------ FCI Petersburg Medium N/A N/A ------
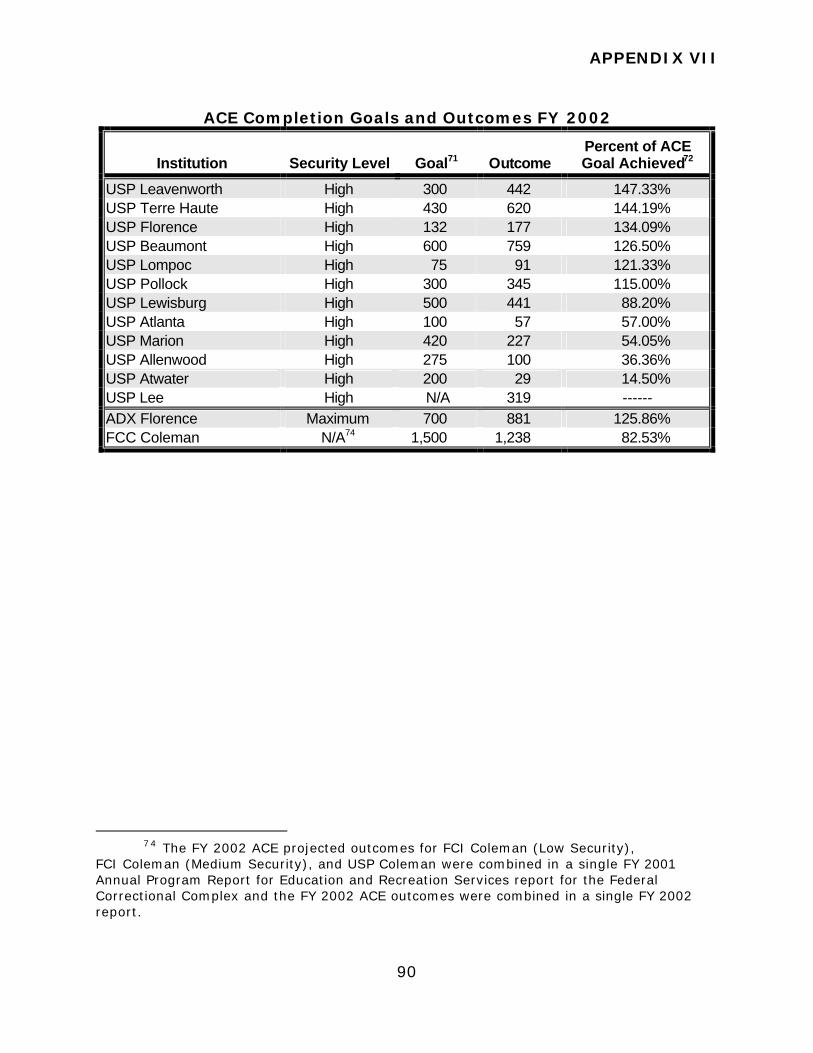
APPENDIX VII
90
ACE Completion Goals and Outcomes FY 2002
Institution Security Level Goal71 Outcome Percent of ACE Goal Achieved72
USP Leavenworth High 300 442 147.33% USP Terre Haute High 430 620 144.19% USP Florence High 132 177 134.09% USP Beaumont High 600 759 126.50% USP Lompoc High 75 91 121.33% USP Pollock High 300 345 115.00% USP Lewisburg High 500 441 88.20% USP Atlanta High 100 57 57.00% USP Marion High 420 227 54.05% USP Allenwood High 275 100 36.36% USP Atwater High 200 29 14.50% USP Lee High N/A 319 ------ ADX Florence Maximum 700 881 125.86% FCC Coleman N/A74 1,500 1,238 82.53%
74 The FY 2002 ACE projected outcomes for FCI Coleman (Low Security),
FCI Coleman (Medium Security), and USP Coleman were combined in a single FY 2001 Annual Program Report for Education and Recreation Services report for the Federal Correctional Complex and the FY 2002 ACE outcomes were combined in a single FY 2002 report.
APPENDIX VIII
91
ANALYSIS OF THE PARENTING GOALS AND OUTCOMES FY 2001 THROUGH FY 2002
For the institutions included in our audit, we reviewed the parenting goals and outcomes for FY 1999 through FY 2002 reported in each institution’s Annual Program Report for Education and Recreation Services. (The BOP did not require its institutions to establish parenting goals for FY 2002 because of a change in the format of the Annual Program Report for Education and Recreation Services; however, we used the FY 2002 parenting projected outcomes reported in the FY 2001 Annual Program Report for Education and Recreation Services as the FY 2002 parenting goals for our analysis.)
The following schedules provide the details of our analysis of the
parenting goals and outcomes reported by each institution in its Annual Program Report for Education and Recreation Services for FY 2001 through FY 2002. Those institutions for which the parenting goal and/or outcome is shown as “---“ in the following schedules did not include a goal and/or outcome in their Annual Program Report for Education and Recreation Services. Further, unless noted otherwise, those institutions for which the parenting goal and/or outcome is shown as “N/A“ did not submit an Program Report for Education and Recreation Services because the institution was not open and/or fully operational during the fiscal year.
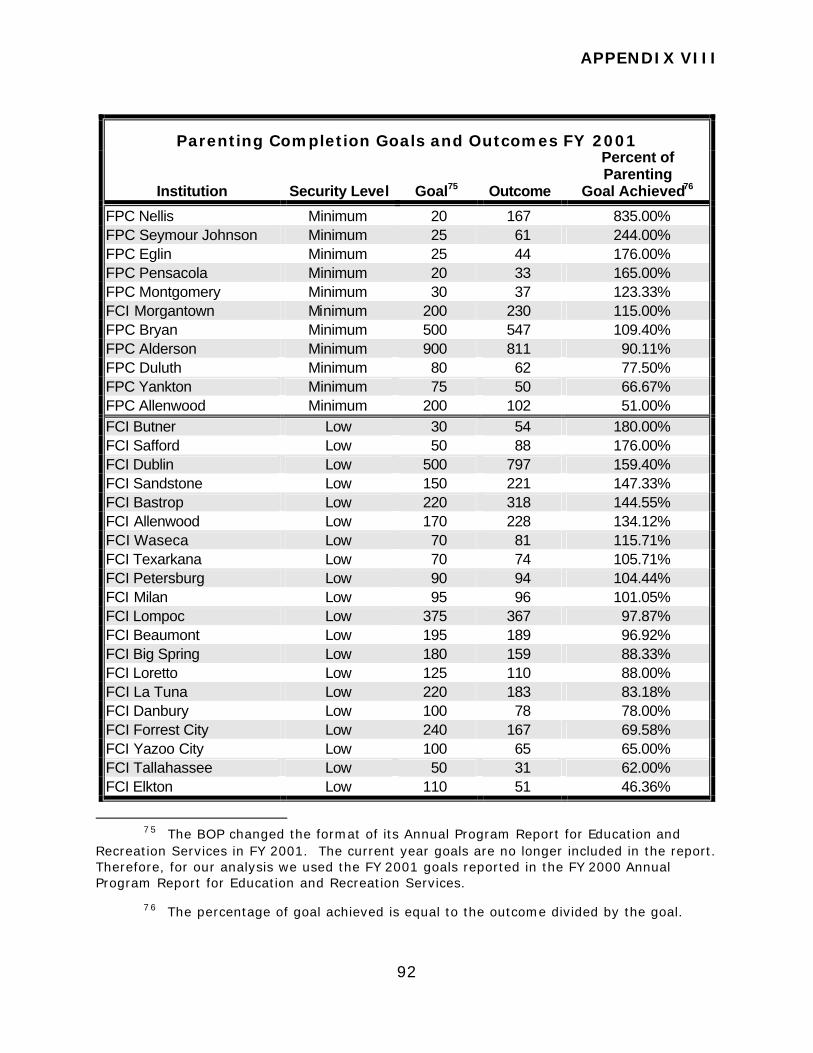
APPENDIX VIII
92
Parenting Completion Goals and Outcomes FY 2001
Institution Security Level Goal75 Outcome
Percent of Parenting
Goal Achieved76
FPC Nellis Minimum 20 167 835.00% FPC Seymour Johnson Minimum 25 61 244.00% FPC Eglin Minimum 25 44 176.00% FPC Pensacola Minimum 20 33 165.00% FPC Montgomery Minimum 30 37 123.33% FCI Morgantown Minimum 200 230 115.00% FPC Bryan Minimum 500 547 109.40% FPC Alderson Minimum 900 811 90.11% FPC Duluth Minimum 80 62 77.50% FPC Yankton Minimum 75 50 66.67% FPC Allenwood Minimum 200 102 51.00% FCI Butner Low 30 54 180.00% FCI Safford Low 50 88 176.00% FCI Dublin Low 500 797 159.40% FCI Sandstone Low 150 221 147.33% FCI Bastrop Low 220 318 144.55% FCI Allenwood Low 170 228 134.12% FCI Waseca Low 70 81 115.71% FCI Texarkana Low 70 74 105.71% FCI Petersburg Low 90 94 104.44% FCI Milan Low 95 96 101.05% FCI Lompoc Low 375 367 97.87% FCI Beaumont Low 195 189 96.92% FCI Big Spring Low 180 159 88.33% FCI Loretto Low 125 110 88.00% FCI La Tuna Low 220 183 83.18% FCI Danbury Low 100 78 78.00% FCI Forrest City Low 240 167 69.58% FCI Yazoo City Low 100 65 65.00% FCI Tallahassee Low 50 31 62.00% FCI Elkton Low 110 51 46.36%
75 The BOP changed the format of its Annual Program Report for Education and
Recreation Services in FY 2001. The current year goals are no longer included in the report. Therefore, for our analysis we used the FY 2001 goals reported in the FY 2000 Annual Program Report for Education and Recreation Services.
76 The percentage of goal achieved is equal to the outcome divided by the goal.
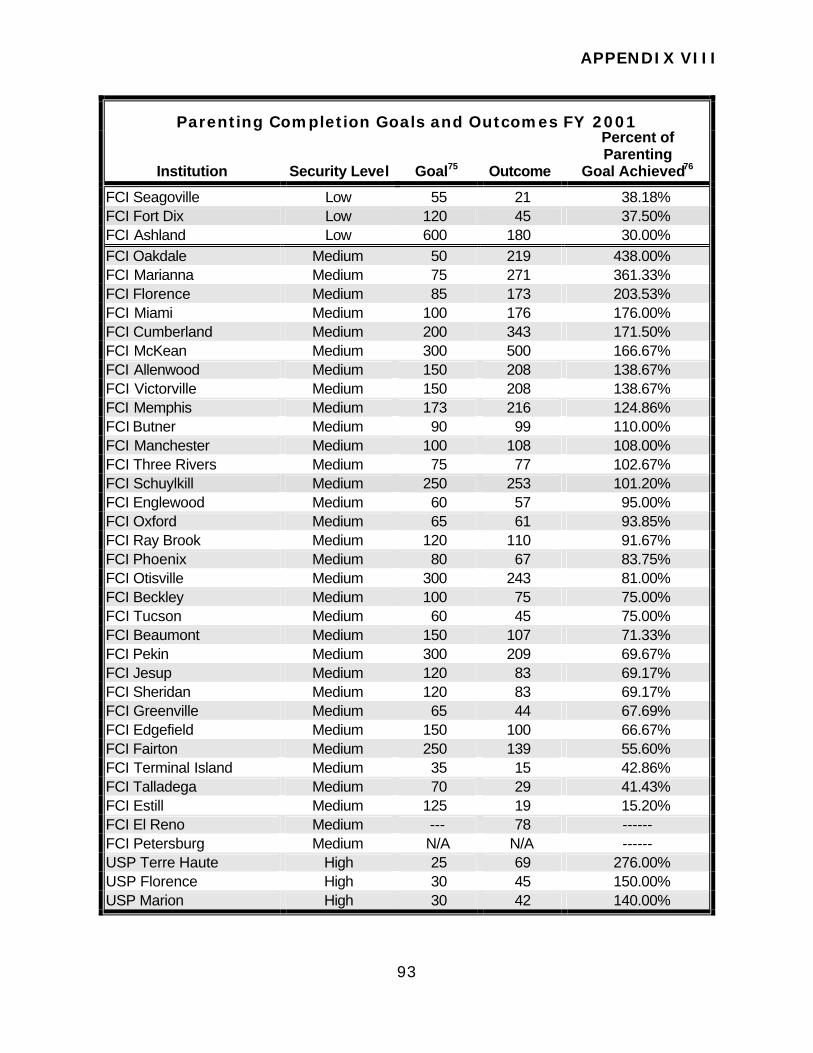
APPENDIX VIII
93
Parenting Completion Goals and Outcomes FY 2001
Institution Security Level Goal75 Outcome
Percent of Parenting
Goal Achieved76
FCI Seagoville Low 55 21 38.18% FCI Fort Dix Low 120 45 37.50% FCI Ashland Low 600 180 30.00% FCI Oakdale Medium 50 219 438.00% FCI Marianna Medium 75 271 361.33% FCI Florence Medium 85 173 203.53% FCI Miami Medium 100 176 176.00% FCI Cumberland Medium 200 343 171.50% FCI McKean Medium 300 500 166.67% FCI Allenwood Medium 150 208 138.67% FCI Victorville Medium 150 208 138.67% FCI Memphis Medium 173 216 124.86% FCI Butner Medium 90 99 110.00% FCI Manchester Medium 100 108 108.00% FCI Three Rivers Medium 75 77 102.67% FCI Schuylkill Medium 250 253 101.20% FCI Englewood Medium 60 57 95.00% FCI Oxford Medium 65 61 93.85% FCI Ray Brook Medium 120 110 91.67% FCI Phoenix Medium 80 67 83.75% FCI Otisville Medium 300 243 81.00% FCI Beckley Medium 100 75 75.00% FCI Tucson Medium 60 45 75.00% FCI Beaumont Medium 150 107 71.33% FCI Pekin Medium 300 209 69.67% FCI Jesup Medium 120 83 69.17% FCI Sheridan Medium 120 83 69.17% FCI Greenville Medium 65 44 67.69% FCI Edgefield Medium 150 100 66.67% FCI Fairton Medium 250 139 55.60% FCI Terminal Island Medium 35 15 42.86% FCI Talladega Medium 70 29 41.43% FCI Estill Medium 125 19 15.20% FCI El Reno Medium --- 78 ------ FCI Petersburg Medium N/A N/A ------ USP Terre Haute High 25 69 276.00% USP Florence High 30 45 150.00% USP Marion High 30 42 140.00%
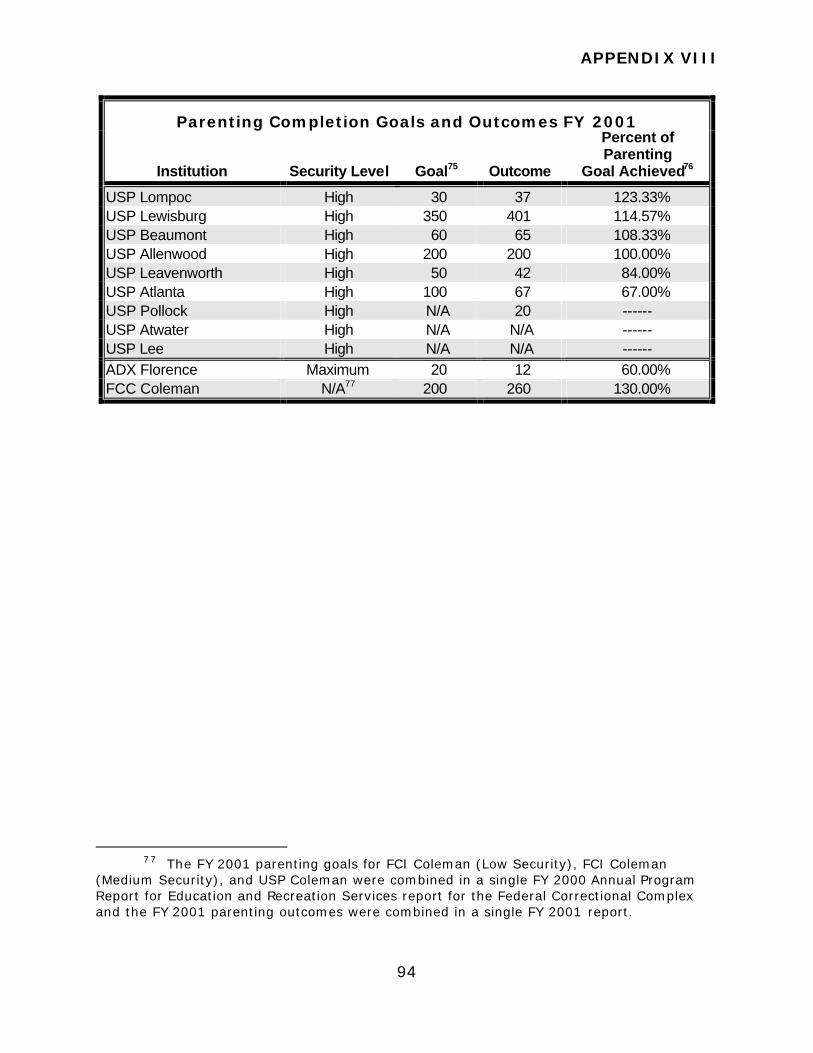
APPENDIX VIII
94
Parenting Completion Goals and Outcomes FY 2001
Institution Security Level Goal75 Outcome
Percent of Parenting
Goal Achieved76
USP Lompoc High 30 37 123.33% USP Lewisburg High 350 401 114.57% USP Beaumont High 60 65 108.33% USP Allenwood High 200 200 100.00% USP Leavenworth High 50 42 84.00% USP Atlanta High 100 67 67.00% USP Pollock High N/A 20 ------ USP Atwater High N/A N/A ------ USP Lee High N/A N/A ------ ADX Florence Maximum 20 12 60.00% FCC Coleman N/A77 200 260 130.00%
77 The FY 2001 parenting goals for FCI Coleman (Low Security), FCI Coleman
(Medium Security), and USP Coleman were combined in a single FY 2000 Annual Program Report for Education and Recreation Services report for the Federal Correctional Complex and the FY 2001 parenting outcomes were combined in a single FY 2001 report.
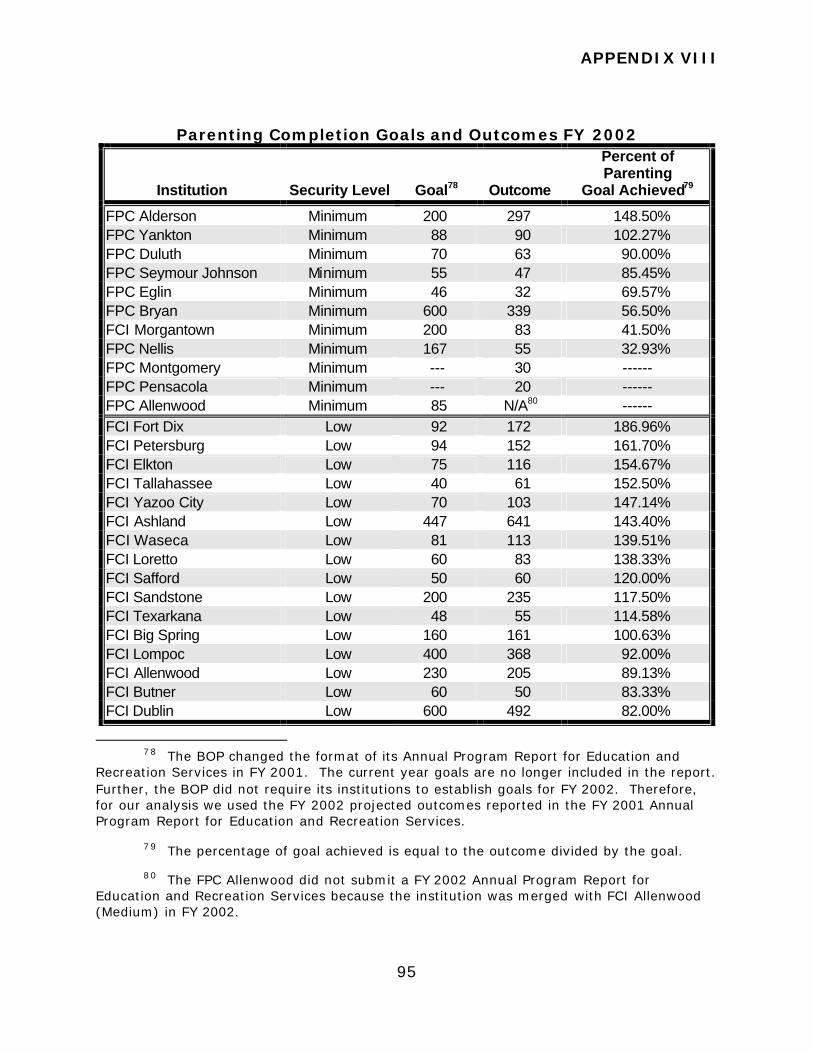
APPENDIX VIII
95
Parenting Completion Goals and Outcomes FY 2002
Institution Security Level Goal78 Outcome
Percent of Parenting
Goal Achieved79
FPC Alderson Minimum 200 297 148.50% FPC Yankton Minimum 88 90 102.27% FPC Duluth Minimum 70 63 90.00% FPC Seymour Johnson Minimum 55 47 85.45% FPC Eglin Minimum 46 32 69.57% FPC Bryan Minimum 600 339 56.50% FCI Morgantown Minimum 200 83 41.50% FPC Nellis Minimum 167 55 32.93% FPC Montgomery Minimum --- 30 ------ FPC Pensacola Minimum --- 20 ------ FPC Allenwood Minimum 85 N/A80 ------ FCI Fort Dix Low 92 172 186.96% FCI Petersburg Low 94 152 161.70% FCI Elkton Low 75 116 154.67% FCI Tallahassee Low 40 61 152.50% FCI Yazoo City Low 70 103 147.14% FCI Ashland Low 447 641 143.40% FCI Waseca Low 81 113 139.51% FCI Loretto Low 60 83 138.33% FCI Safford Low 50 60 120.00% FCI Sandstone Low 200 235 117.50% FCI Texarkana Low 48 55 114.58% FCI Big Spring Low 160 161 100.63% FCI Lompoc Low 400 368 92.00% FCI Allenwood Low 230 205 89.13% FCI Butner Low 60 50 83.33% FCI Dublin Low 600 492 82.00%
78 The BOP changed the format of its Annual Program Report for Education and
Recreation Services in FY 2001. The current year goals are no longer included in the report. Further, the BOP did not require its institutions to establish goals for FY 2002. Therefore, for our analysis we used the FY 2002 projected outcomes reported in the FY 2001 Annual Program Report for Education and Recreation Services.
79 The percentage of goal achieved is equal to the outcome divided by the goal.
80 The FPC Allenwood did not submit a FY 2002 Annual Program Report for Education and Recreation Services because the institution was merged with FCI Allenwood (Medium) in FY 2002.

APPENDIX VIII
96
Parenting Completion Goals and Outcomes FY 2002
Institution Security Level Goal78 Outcome
Percent of Parenting
Goal Achieved79
FCI Bastrop Low 330 252 76.36% FCI La Tuna Low 225 153 68.00% FCI Beaumont Low 200 129 64.50% FCI Danbury Low 80 47 58.75% FCI Milan Low 105 61 58.10% FCI Forrest City Low 180 104 57.78% FCI Seagoville Low 40 21 52.50% FCI Fairton Medium 150 905 603.33% FCI Otisville Medium 100 350 350.00% FCI Sheridan Medium 25 75 300.00% FCI El Reno Medium 125 353 282.40% FCI Jesup Medium 97 213 219.59% FCI Phoenix Medium 50 101 202.00% FCI Estill Medium 40 78 195.00% FCI Marianna Medium 125 226 180.80% FCI Ray Brook Medium 64 112 175.00% FCI Three Rivers Medium 120 206 171.67% FCI Greenville Medium 72 102 141.67% FCI Victorville Medium 180 247 137.22% FCI McKean Medium 364 408 112.09% FCI Allenwood Medium 125 131 104.80% FCI Florence Medium 160 165 103.13% FCI Oakdale Medium 96 96 100.00% FCI Beckley Medium 144 129 89.58% FCI Cumberland Medium 400 343 85.75% FCI Terminal Island Medium 30 25 83.33% FCI Schuylkill Medium 275 228 82.91% FCI Talladega Medium 60 43 71.67% FCI Butner Medium 196 139 70.92% FCI Beaumont Medium 115 80 69.57% FCI Englewood Medium 60 40 66.67% FCI Edgefield Medium 172 113 65.70% FCI Manchester Medium 110 71 64.55% FCI Miami Medium 150 37 24.67% FCI Tucson Medium 30 7 23.33% FCI Pekin Medium --- 197 ------ FCI Memphis Medium --- 144 ------ FCI Oxford Medium --- 66 ------
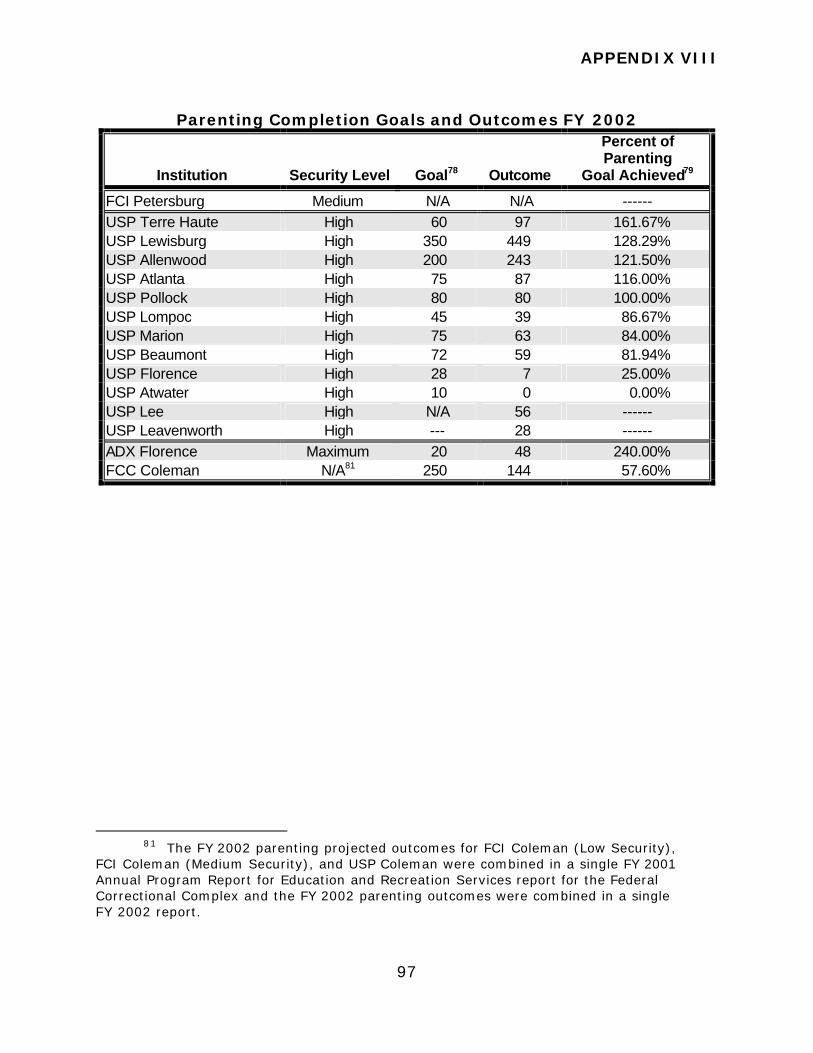
APPENDIX VIII
97
Parenting Completion Goals and Outcomes FY 2002
Institution Security Level Goal78 Outcome
Percent of Parenting
Goal Achieved79
FCI Petersburg Medium N/A N/A ------ USP Terre Haute High 60 97 161.67% USP Lewisburg High 350 449 128.29% USP Allenwood High 200 243 121.50% USP Atlanta High 75 87 116.00% USP Pollock High 80 80 100.00% USP Lompoc High 45 39 86.67% USP Marion High 75 63 84.00% USP Beaumont High 72 59 81.94% USP Florence High 28 7 25.00% USP Atwater High 10 0 0.00% USP Lee High N/A 56 ------ USP Leavenworth High --- 28 ------ ADX Florence Maximum 20 48 240.00% FCC Coleman N/A81 250 144 57.60%
81 The FY 2002 parenting projected outcomes for FCI Coleman (Low Security),
FCI Coleman (Medium Security), and USP Coleman were combined in a single FY 2001 Annual Program Report for Education and Recreation Services report for the Federal Correctional Complex and the FY 2002 parenting outcomes were combined in a single FY 2002 report.

APPENDIX IX
98
ANALYSIS OF THE PERCENT PARTICIPATION GOALS AND OUTCOMES
FY 2002
For the institutions included in our audit, we reviewed the percent of inmates enrolled in one or more education programs (percent participation) goals and outcomes for FY 2002, reported in each institution’s Annual Program Report for Education and Recreation Services.82 The institutions in conjunction with the regional offices establish their own percent participation goals.
The following schedule provides the details of our analysis of the percent participation goals and outcomes reported by each institution in its Annual Program Report for Education and Recreation Services for FY 2002. Those institutions for which the percent participation goal and/or outcome is shown as “---“ in the following schedule did not include a goal and/or outcome in their Annual Program Report for Education and Recreation Services. Further, unless noted otherwise, those institutions for which the percent participation goal and/or outcome is shown as “N/A“ did not submit an Annual Program Report for Education and Recreation Services because the institution was not open and/or fully operational during the fiscal year.
82 FY 2002 was the first year that the BOP institutions were required to report the
percent participation goals and outcomes in the Annual Program Report for Education and Recreation Services.
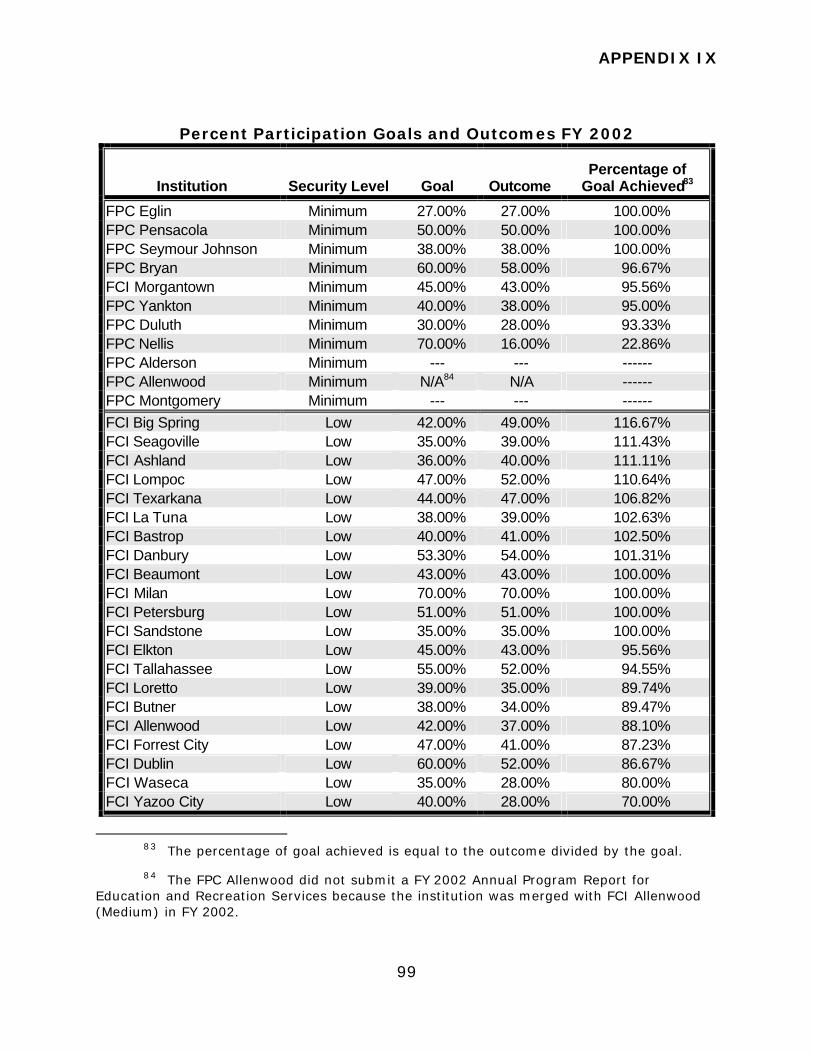
APPENDIX IX
99
Percent Participation Goals and Outcomes FY 2002
Institution Security Level Goal Outcome Percentage of
Goal Achieved83
FPC Eglin Minimum 27.00% 27.00% 100.00% FPC Pensacola Minimum 50.00% 50.00% 100.00% FPC Seymour Johnson Minimum 38.00% 38.00% 100.00% FPC Bryan Minimum 60.00% 58.00% 96.67% FCI Morgantown Minimum 45.00% 43.00% 95.56% FPC Yankton Minimum 40.00% 38.00% 95.00% FPC Duluth Minimum 30.00% 28.00% 93.33% FPC Nellis Minimum 70.00% 16.00% 22.86% FPC Alderson Minimum --- --- ------ FPC Allenwood Minimum N/A84 N/A ------ FPC Montgomery Minimum --- --- ------ FCI Big Spring Low 42.00% 49.00% 116.67% FCI Seagoville Low 35.00% 39.00% 111.43% FCI Ashland Low 36.00% 40.00% 111.11% FCI Lompoc Low 47.00% 52.00% 110.64% FCI Texarkana Low 44.00% 47.00% 106.82% FCI La Tuna Low 38.00% 39.00% 102.63% FCI Bastrop Low 40.00% 41.00% 102.50% FCI Danbury Low 53.30% 54.00% 101.31% FCI Beaumont Low 43.00% 43.00% 100.00% FCI Milan Low 70.00% 70.00% 100.00% FCI Petersburg Low 51.00% 51.00% 100.00% FCI Sandstone Low 35.00% 35.00% 100.00% FCI Elkton Low 45.00% 43.00% 95.56% FCI Tallahassee Low 55.00% 52.00% 94.55% FCI Loretto Low 39.00% 35.00% 89.74% FCI Butner Low 38.00% 34.00% 89.47% FCI Allenwood Low 42.00% 37.00% 88.10% FCI Forrest City Low 47.00% 41.00% 87.23% FCI Dublin Low 60.00% 52.00% 86.67% FCI Waseca Low 35.00% 28.00% 80.00% FCI Yazoo City Low 40.00% 28.00% 70.00%
83 The percentage of goal achieved is equal to the outcome divided by the goal.
84 The FPC Allenwood did not submit a FY 2002 Annual Program Report for Education and Recreation Services because the institution was merged with FCI Allenwood (Medium) in FY 2002.
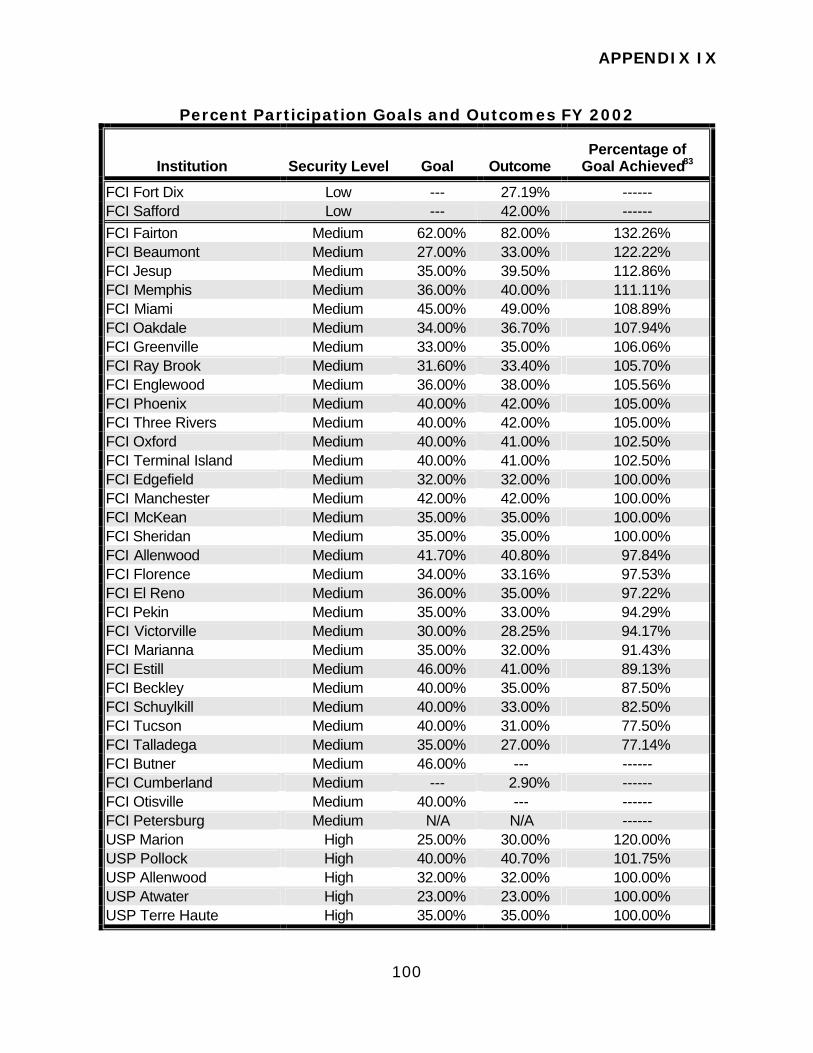
APPENDIX IX
100
Percent Participation Goals and Outcomes FY 2002
Institution Security Level Goal Outcome Percentage of
Goal Achieved83
FCI Fort Dix Low --- 27.19% ------ FCI Safford Low --- 42.00% ------ FCI Fairton Medium 62.00% 82.00% 132.26% FCI Beaumont Medium 27.00% 33.00% 122.22% FCI Jesup Medium 35.00% 39.50% 112.86% FCI Memphis Medium 36.00% 40.00% 111.11% FCI Miami Medium 45.00% 49.00% 108.89% FCI Oakdale Medium 34.00% 36.70% 107.94% FCI Greenville Medium 33.00% 35.00% 106.06% FCI Ray Brook Medium 31.60% 33.40% 105.70% FCI Englewood Medium 36.00% 38.00% 105.56% FCI Phoenix Medium 40.00% 42.00% 105.00% FCI Three Rivers Medium 40.00% 42.00% 105.00% FCI Oxford Medium 40.00% 41.00% 102.50% FCI Terminal Island Medium 40.00% 41.00% 102.50% FCI Edgefield Medium 32.00% 32.00% 100.00% FCI Manchester Medium 42.00% 42.00% 100.00% FCI McKean Medium 35.00% 35.00% 100.00% FCI Sheridan Medium 35.00% 35.00% 100.00% FCI Allenwood Medium 41.70% 40.80% 97.84% FCI Florence Medium 34.00% 33.16% 97.53% FCI El Reno Medium 36.00% 35.00% 97.22% FCI Pekin Medium 35.00% 33.00% 94.29% FCI Victorville Medium 30.00% 28.25% 94.17% FCI Marianna Medium 35.00% 32.00% 91.43% FCI Estill Medium 46.00% 41.00% 89.13% FCI Beckley Medium 40.00% 35.00% 87.50% FCI Schuylkill Medium 40.00% 33.00% 82.50% FCI Tucson Medium 40.00% 31.00% 77.50% FCI Talladega Medium 35.00% 27.00% 77.14% FCI Butner Medium 46.00% --- ------ FCI Cumberland Medium --- 2.90% ------ FCI Otisville Medium 40.00% --- ------ FCI Petersburg Medium N/A N/A ------ USP Marion High 25.00% 30.00% 120.00% USP Pollock High 40.00% 40.70% 101.75% USP Allenwood High 32.00% 32.00% 100.00% USP Atwater High 23.00% 23.00% 100.00% USP Terre Haute High 35.00% 35.00% 100.00%
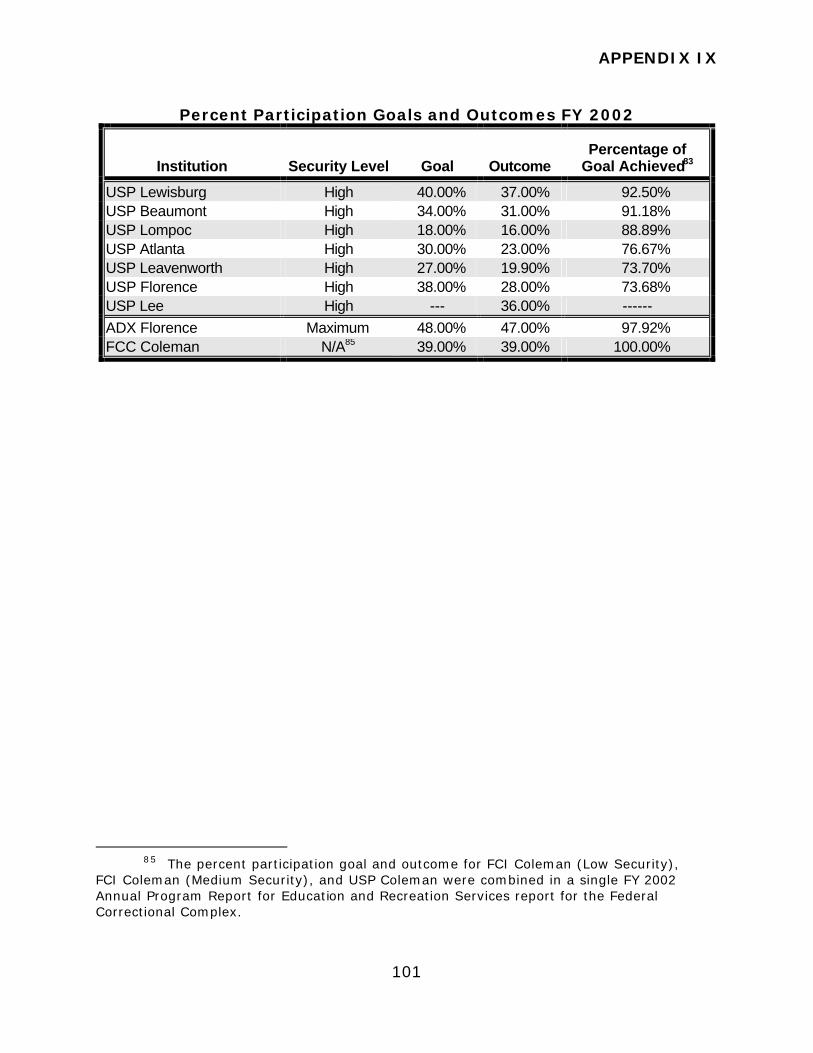
APPENDIX IX
101
Percent Participation Goals and Outcomes FY 2002
Institution Security Level Goal Outcome Percentage of
Goal Achieved83
USP Lewisburg High 40.00% 37.00% 92.50% USP Beaumont High 34.00% 31.00% 91.18% USP Lompoc High 18.00% 16.00% 88.89% USP Atlanta High 30.00% 23.00% 76.67% USP Leavenworth High 27.00% 19.90% 73.70% USP Florence High 38.00% 28.00% 73.68% USP Lee High --- 36.00% ------ ADX Florence Maximum 48.00% 47.00% 97.92% FCC Coleman N/A85 39.00% 39.00% 100.00%
85 The percent participation goal and outcome for FCI Coleman (Low Security),
FCI Coleman (Medium Security), and USP Coleman were combined in a single FY 2002 Annual Program Report for Education and Recreation Services report for the Federal Correctional Complex.
APPENDIX X
102
ANALYSIS OF THE OCCUPATIONAL TECHNICAL PERFORMANCE FACTORS FY 2001 THROUGH FY 2002
For the occupational technical programs at each institution, we calculated a program performance factor for FY 1999 through FY 2002, based on the number of completions divided by the number of completions plus total withdrawals for each fiscal year. (We used completion and withdrawal data that was reported in the BOP’s Key Indicators system for occupational technical programs to calculate the performance factor.) The performance factor measures the percentage of inmates who complete the occupational technical programs as compared to the percentage of inmates who withdraw from the programs.86
The following schedules provide the details of our calculations and
analysis of the occupational technical performance factor for FY 2001 through FY 2002. Unless noted otherwise, those institutions for which the completions and/or total withdrawals are shown as “N/A“ were not open and/or fully operational during the fiscal year.
86 The performance factors for the occupational technical programs included in the
BOP’s Key Indicators was calculated based on completions divided by completions plus total withdrawals for the fiscal year.
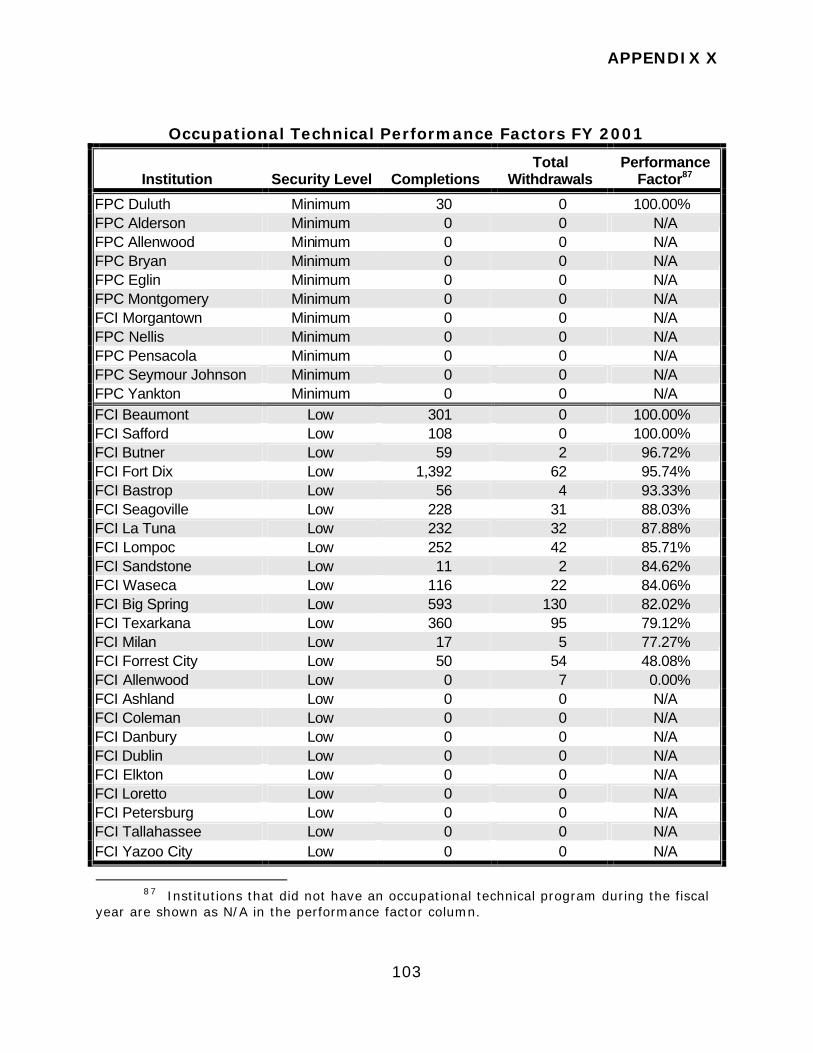
APPENDIX X
103
Occupational Technical Performance Factors FY 2001
Institution Security Level Completions Total
Withdrawals Performance
Factor87
FPC Duluth Minimum 30 0 100.00% FPC Alderson Minimum 0 0 N/A FPC Allenwood Minimum 0 0 N/A FPC Bryan Minimum 0 0 N/A FPC Eglin Minimum 0 0 N/A FPC Montgomery Minimum 0 0 N/A FCI Morgantown Minimum 0 0 N/A FPC Nellis Minimum 0 0 N/A FPC Pensacola Minimum 0 0 N/A FPC Seymour Johnson Minimum 0 0 N/A FPC Yankton Minimum 0 0 N/A FCI Beaumont Low 301 0 100.00% FCI Safford Low 108 0 100.00% FCI Butner Low 59 2 96.72% FCI Fort Dix Low 1,392 62 95.74% FCI Bastrop Low 56 4 93.33% FCI Seagoville Low 228 31 88.03% FCI La Tuna Low 232 32 87.88% FCI Lompoc Low 252 42 85.71% FCI Sandstone Low 11 2 84.62% FCI Waseca Low 116 22 84.06% FCI Big Spring Low 593 130 82.02% FCI Texarkana Low 360 95 79.12% FCI Milan Low 17 5 77.27% FCI Forrest City Low 50 54 48.08% FCI Allenwood Low 0 7 0.00% FCI Ashland Low 0 0 N/A FCI Coleman Low 0 0 N/A FCI Danbury Low 0 0 N/A FCI Dublin Low 0 0 N/A FCI Elkton Low 0 0 N/A FCI Loretto Low 0 0 N/A FCI Petersburg Low 0 0 N/A FCI Tallahassee Low 0 0 N/A FCI Yazoo City Low 0 0 N/A
87 Institutions that did not have an occupational technical program during the fiscal
year are shown as N/A in the performance factor column.
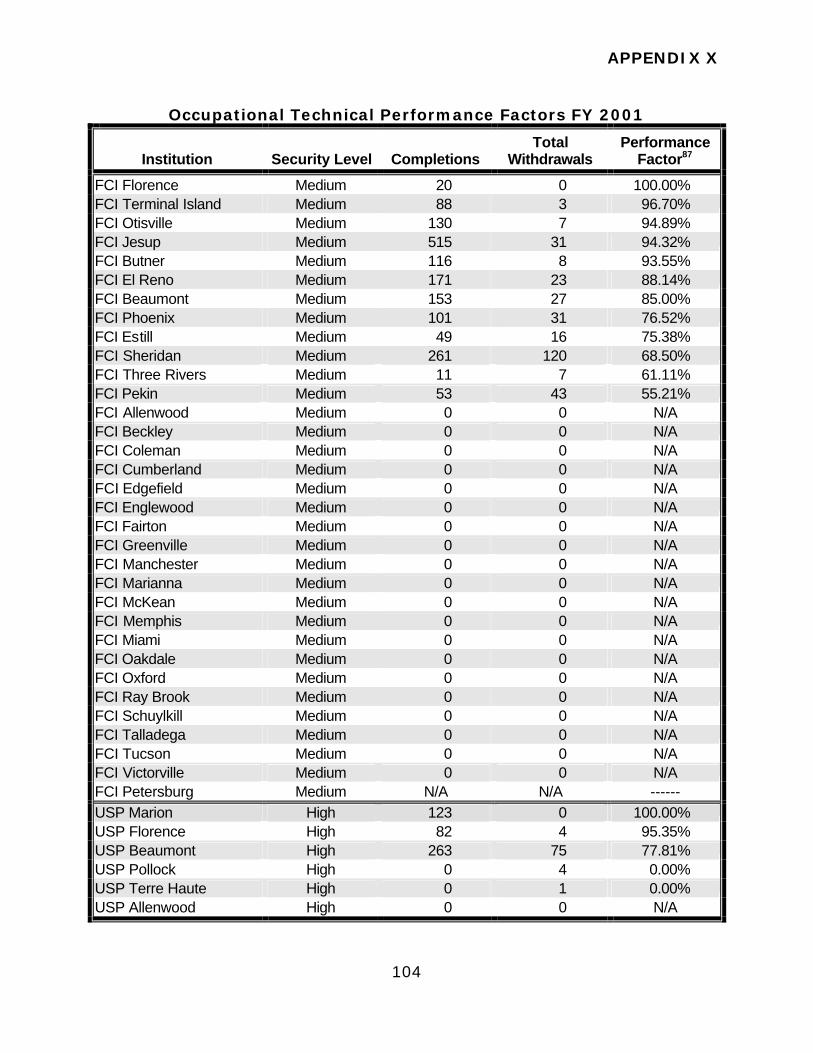
APPENDIX X
104
Occupational Technical Performance Factors FY 2001
Institution Security Level Completions Total
Withdrawals Performance
Factor87
FCI Florence Medium 20 0 100.00% FCI Terminal Island Medium 88 3 96.70% FCI Otisville Medium 130 7 94.89% FCI Jesup Medium 515 31 94.32% FCI Butner Medium 116 8 93.55% FCI El Reno Medium 171 23 88.14% FCI Beaumont Medium 153 27 85.00% FCI Phoenix Medium 101 31 76.52% FCI Estill Medium 49 16 75.38% FCI Sheridan Medium 261 120 68.50% FCI Three Rivers Medium 11 7 61.11% FCI Pekin Medium 53 43 55.21% FCI Allenwood Medium 0 0 N/A FCI Beckley Medium 0 0 N/A FCI Coleman Medium 0 0 N/A FCI Cumberland Medium 0 0 N/A FCI Edgefield Medium 0 0 N/A FCI Englewood Medium 0 0 N/A FCI Fairton Medium 0 0 N/A FCI Greenville Medium 0 0 N/A FCI Manchester Medium 0 0 N/A FCI Marianna Medium 0 0 N/A FCI McKean Medium 0 0 N/A FCI Memphis Medium 0 0 N/A FCI Miami Medium 0 0 N/A FCI Oakdale Medium 0 0 N/A FCI Oxford Medium 0 0 N/A FCI Ray Brook Medium 0 0 N/A FCI Schuylkill Medium 0 0 N/A FCI Talladega Medium 0 0 N/A FCI Tucson Medium 0 0 N/A FCI Victorville Medium 0 0 N/A FCI Petersburg Medium N/A N/A ------ USP Marion High 123 0 100.00% USP Florence High 82 4 95.35% USP Beaumont High 263 75 77.81% USP Pollock High 0 4 0.00% USP Terre Haute High 0 1 0.00% USP Allenwood High 0 0 N/A
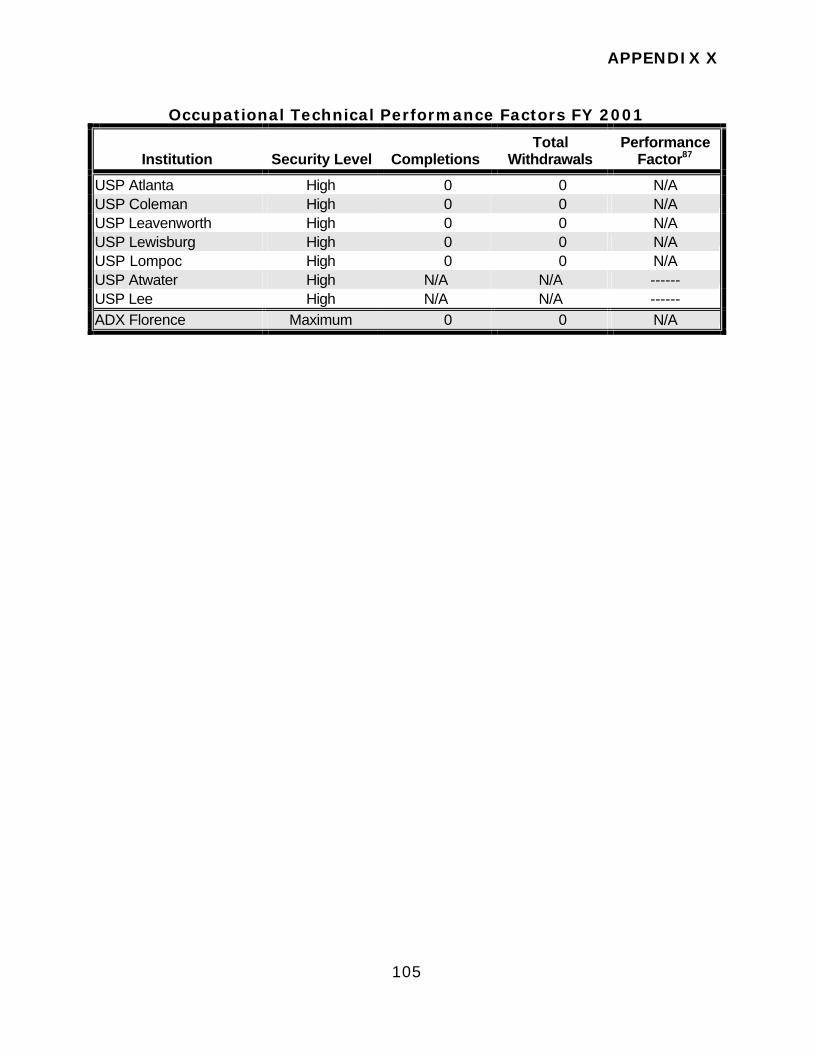
APPENDIX X
105
Occupational Technical Performance Factors FY 2001
Institution Security Level Completions Total
Withdrawals Performance
Factor87
USP Atlanta High 0 0 N/A USP Coleman High 0 0 N/A USP Leavenworth High 0 0 N/A USP Lewisburg High 0 0 N/A USP Lompoc High 0 0 N/A USP Atwater High N/A N/A ------ USP Lee High N/A N/A ------ ADX Florence Maximum 0 0 N/A
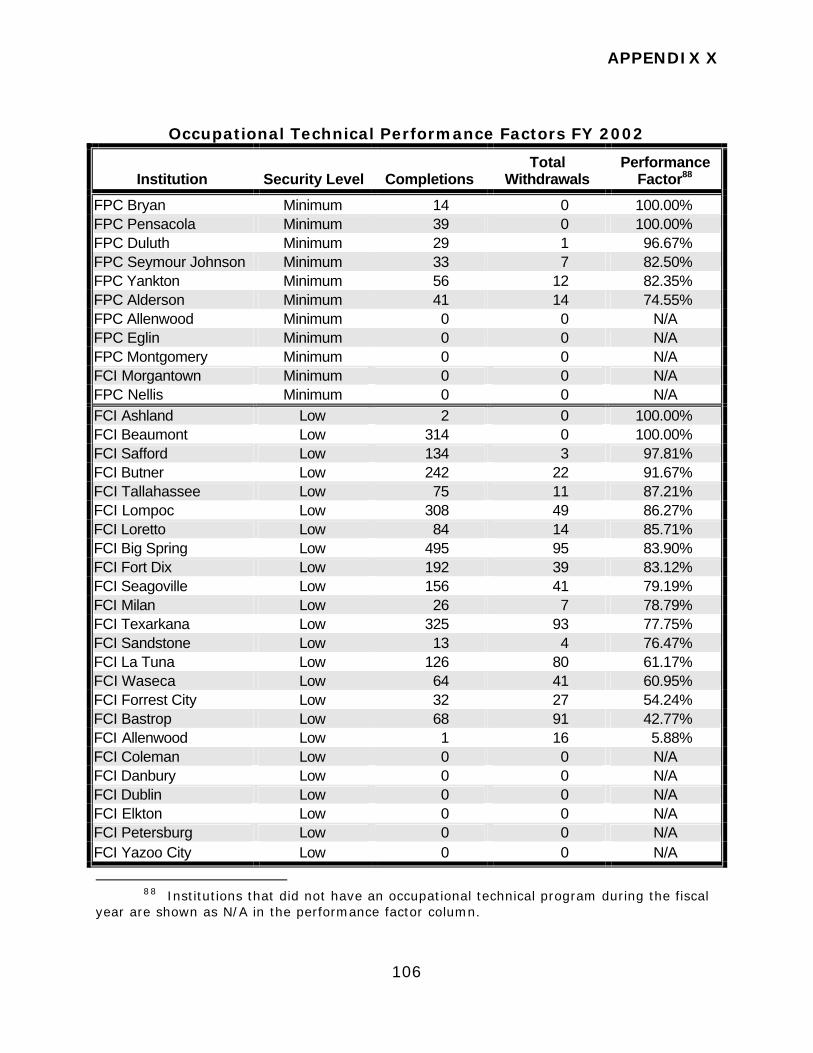
APPENDIX X
106
Occupational Technical Performance Factors FY 2002
Institution Security Level Completions Total
Withdrawals Performance
Factor88
FPC Bryan Minimum 14 0 100.00% FPC Pensacola Minimum 39 0 100.00% FPC Duluth Minimum 29 1 96.67% FPC Seymour Johnson Minimum 33 7 82.50% FPC Yankton Minimum 56 12 82.35% FPC Alderson Minimum 41 14 74.55% FPC Allenwood Minimum 0 0 N/A FPC Eglin Minimum 0 0 N/A FPC Montgomery Minimum 0 0 N/A FCI Morgantown Minimum 0 0 N/A FPC Nellis Minimum 0 0 N/A FCI Ashland Low 2 0 100.00% FCI Beaumont Low 314 0 100.00% FCI Safford Low 134 3 97.81% FCI Butner Low 242 22 91.67% FCI Tallahassee Low 75 11 87.21% FCI Lompoc Low 308 49 86.27% FCI Loretto Low 84 14 85.71% FCI Big Spring Low 495 95 83.90% FCI Fort Dix Low 192 39 83.12% FCI Seagoville Low 156 41 79.19% FCI Milan Low 26 7 78.79% FCI Texarkana Low 325 93 77.75% FCI Sandstone Low 13 4 76.47% FCI La Tuna Low 126 80 61.17% FCI Waseca Low 64 41 60.95% FCI Forrest City Low 32 27 54.24% FCI Bastrop Low 68 91 42.77% FCI Allenwood Low 1 16 5.88% FCI Coleman Low 0 0 N/A FCI Danbury Low 0 0 N/A FCI Dublin Low 0 0 N/A FCI Elkton Low 0 0 N/A FCI Petersburg Low 0 0 N/A FCI Yazoo City Low 0 0 N/A
88 Institutions that did not have an occupational technical program during the fiscal
year are shown as N/A in the performance factor column.
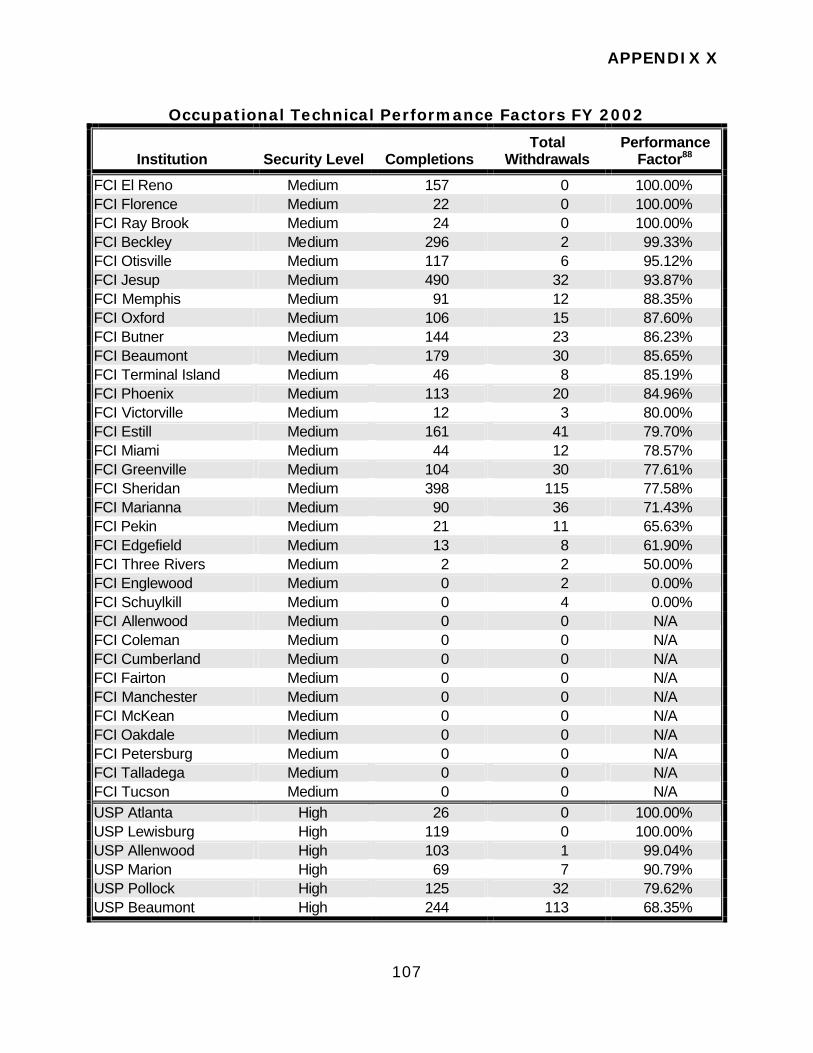
APPENDIX X
107
Occupational Technical Performance Factors FY 2002
Institution Security Level Completions Total
Withdrawals Performance
Factor88
FCI El Reno Medium 157 0 100.00% FCI Florence Medium 22 0 100.00% FCI Ray Brook Medium 24 0 100.00% FCI Beckley Medium 296 2 99.33% FCI Otisville Medium 117 6 95.12% FCI Jesup Medium 490 32 93.87% FCI Memphis Medium 91 12 88.35% FCI Oxford Medium 106 15 87.60% FCI Butner Medium 144 23 86.23% FCI Beaumont Medium 179 30 85.65% FCI Terminal Island Medium 46 8 85.19% FCI Phoenix Medium 113 20 84.96% FCI Victorville Medium 12 3 80.00% FCI Estill Medium 161 41 79.70% FCI Miami Medium 44 12 78.57% FCI Greenville Medium 104 30 77.61% FCI Sheridan Medium 398 115 77.58% FCI Marianna Medium 90 36 71.43% FCI Pekin Medium 21 11 65.63% FCI Edgefield Medium 13 8 61.90% FCI Three Rivers Medium 2 2 50.00% FCI Englewood Medium 0 2 0.00% FCI Schuylkill Medium 0 4 0.00% FCI Allenwood Medium 0 0 N/A FCI Coleman Medium 0 0 N/A FCI Cumberland Medium 0 0 N/A FCI Fairton Medium 0 0 N/A FCI Manchester Medium 0 0 N/A FCI McKean Medium 0 0 N/A FCI Oakdale Medium 0 0 N/A FCI Petersburg Medium 0 0 N/A FCI Talladega Medium 0 0 N/A FCI Tucson Medium 0 0 N/A USP Atlanta High 26 0 100.00% USP Lewisburg High 119 0 100.00% USP Allenwood High 103 1 99.04% USP Marion High 69 7 90.79% USP Pollock High 125 32 79.62% USP Beaumont High 244 113 68.35%
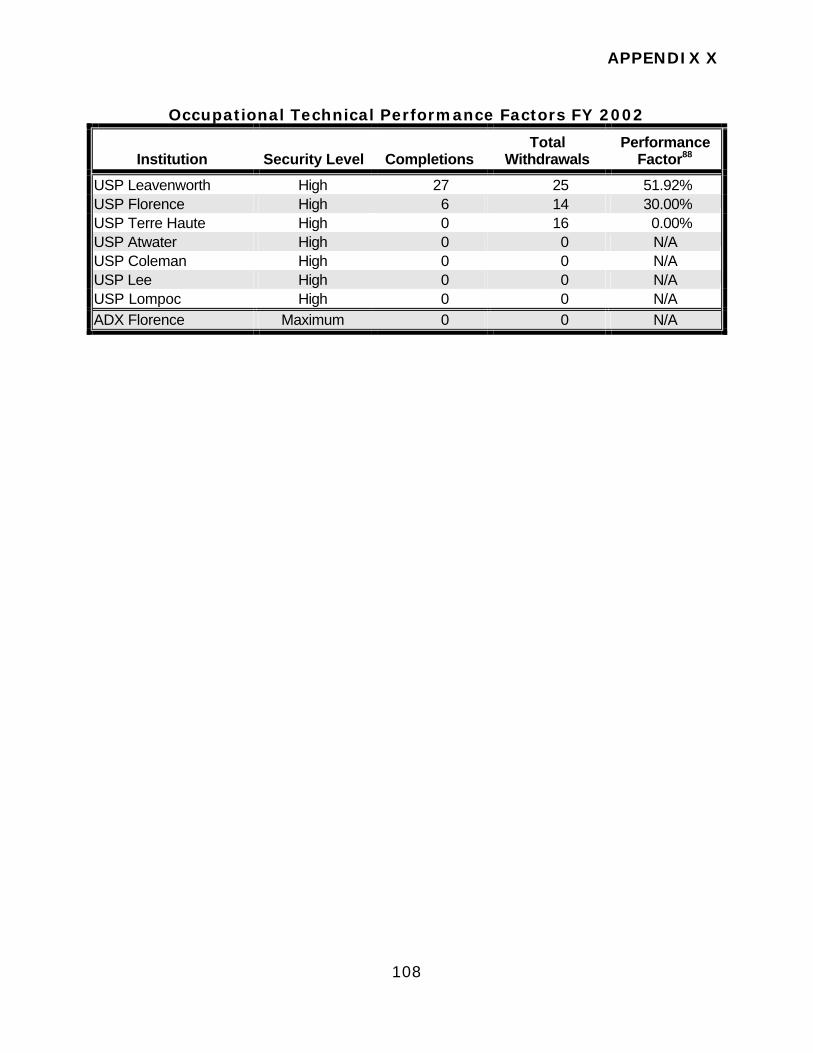
APPENDIX X
108
Occupational Technical Performance Factors FY 2002
Institution Security Level Completions Total
Withdrawals Performance
Factor88
USP Leavenworth High 27 25 51.92% USP Florence High 6 14 30.00% USP Terre Haute High 0 16 0.00% USP Atwater High 0 0 N/A USP Coleman High 0 0 N/A USP Lee High 0 0 N/A USP Lompoc High 0 0 N/A ADX Florence Maximum 0 0 N/A
APPENDIX XI
109
ANALYSIS OF THE OCCUPATIONAL VOCATIONAL PERFORMANCE FACTORS FY 2001 THROUGH FY 2002
For the occupational vocational programs at each institution, we calculated a program performance factor for FY 1999 through FY 2002, based on the number of completions divided by the number of completions plus total withdrawals for each fiscal year. (We used completion and withdrawal data that was reported in the BOP’s Key Indicators system for occupational vocational programs to calculate the performance factor.) The performance factor measures the percentage of inmates who complete the occupational vocational programs as compared to the percentage of inmates who withdraw from the programs.89
The following schedules provide the details of our analysis of the
occupational vocational performance factor for FY 2001 through FY 2002. Unless noted otherwise, those institutions for which the completions and/or total withdrawals are shown as “N/A“ were not open and/or fully operational during the fiscal year.
89 The performance factors for the occupational technical programs included in the
BOP’s Key Indicators was calculated based on completions divided by completions plus total withdrawals for the fiscal year.
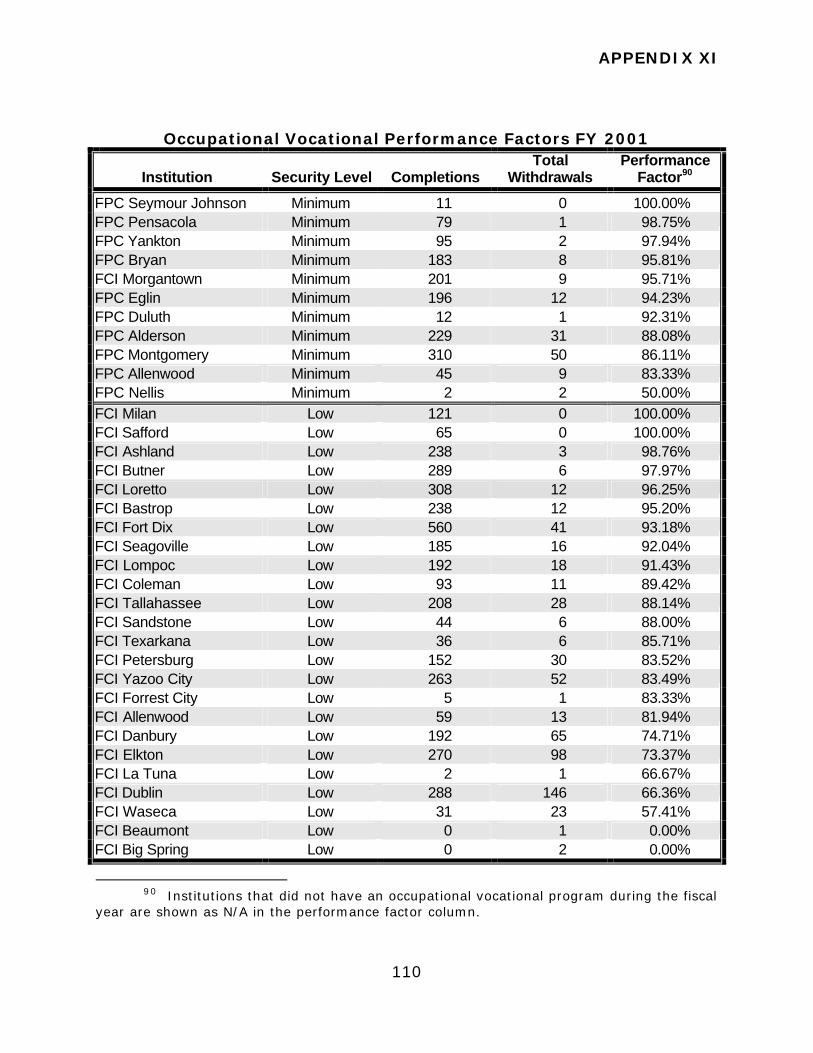
APPENDIX XI
110
Occupational Vocational Performance Factors FY 2001
Institution Security Level Completions Total
Withdrawals Performance
Factor90
FPC Seymour Johnson Minimum 11 0 100.00% FPC Pensacola Minimum 79 1 98.75% FPC Yankton Minimum 95 2 97.94% FPC Bryan Minimum 183 8 95.81% FCI Morgantown Minimum 201 9 95.71% FPC Eglin Minimum 196 12 94.23% FPC Duluth Minimum 12 1 92.31% FPC Alderson Minimum 229 31 88.08% FPC Montgomery Minimum 310 50 86.11% FPC Allenwood Minimum 45 9 83.33% FPC Nellis Minimum 2 2 50.00% FCI Milan Low 121 0 100.00% FCI Safford Low 65 0 100.00% FCI Ashland Low 238 3 98.76% FCI Butner Low 289 6 97.97% FCI Loretto Low 308 12 96.25% FCI Bastrop Low 238 12 95.20% FCI Fort Dix Low 560 41 93.18% FCI Seagoville Low 185 16 92.04% FCI Lompoc Low 192 18 91.43% FCI Coleman Low 93 11 89.42% FCI Tallahassee Low 208 28 88.14% FCI Sandstone Low 44 6 88.00% FCI Texarkana Low 36 6 85.71% FCI Petersburg Low 152 30 83.52% FCI Yazoo City Low 263 52 83.49% FCI Forrest City Low 5 1 83.33% FCI Allenwood Low 59 13 81.94% FCI Danbury Low 192 65 74.71% FCI Elkton Low 270 98 73.37% FCI La Tuna Low 2 1 66.67% FCI Dublin Low 288 146 66.36% FCI Waseca Low 31 23 57.41% FCI Beaumont Low 0 1 0.00% FCI Big Spring Low 0 2 0.00%
90 Institutions that did not have an occupational vocational program during the fiscal
year are shown as N/A in the performance factor column.
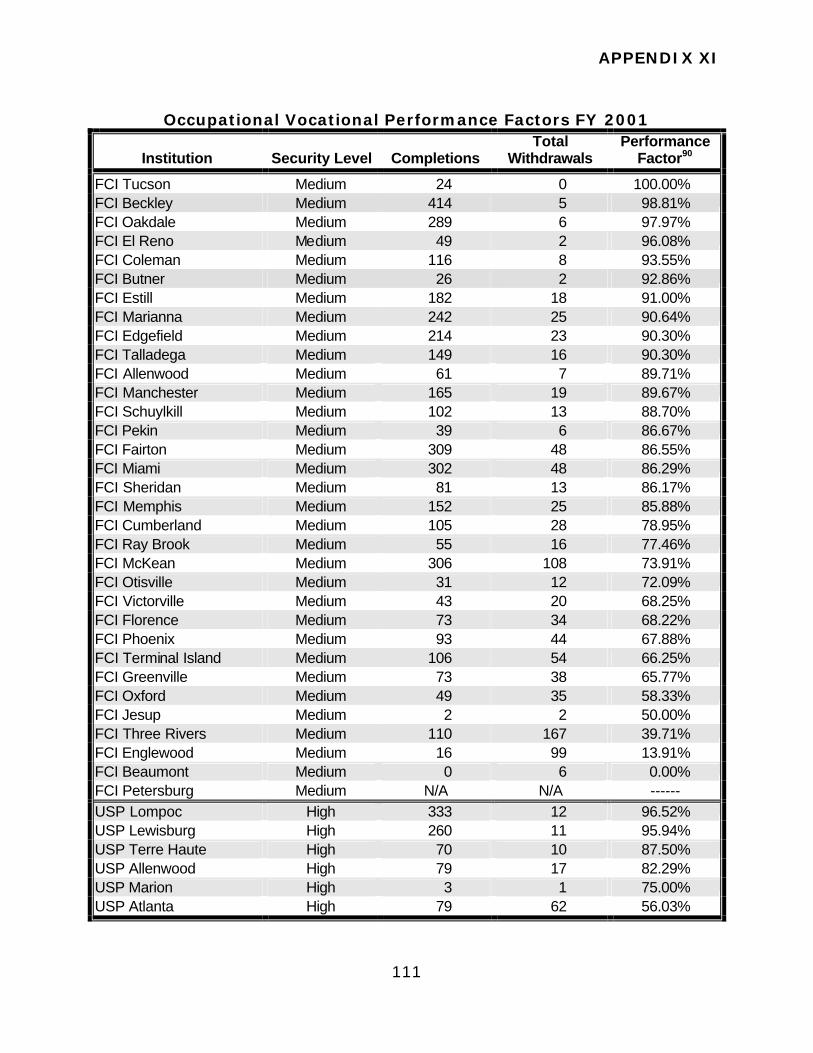
APPENDIX XI
111
Occupational Vocational Performance Factors FY 2001
Institution Security Level Completions Total
Withdrawals Performance
Factor90
FCI Tucson Medium 24 0 100.00% FCI Beckley Medium 414 5 98.81% FCI Oakdale Medium 289 6 97.97% FCI El Reno Medium 49 2 96.08% FCI Coleman Medium 116 8 93.55% FCI Butner Medium 26 2 92.86% FCI Estill Medium 182 18 91.00% FCI Marianna Medium 242 25 90.64% FCI Edgefield Medium 214 23 90.30% FCI Talladega Medium 149 16 90.30% FCI Allenwood Medium 61 7 89.71% FCI Manchester Medium 165 19 89.67% FCI Schuylkill Medium 102 13 88.70% FCI Pekin Medium 39 6 86.67% FCI Fairton Medium 309 48 86.55% FCI Miami Medium 302 48 86.29% FCI Sheridan Medium 81 13 86.17% FCI Memphis Medium 152 25 85.88% FCI Cumberland Medium 105 28 78.95% FCI Ray Brook Medium 55 16 77.46% FCI McKean Medium 306 108 73.91% FCI Otisville Medium 31 12 72.09% FCI Victorville Medium 43 20 68.25% FCI Florence Medium 73 34 68.22% FCI Phoenix Medium 93 44 67.88% FCI Terminal Island Medium 106 54 66.25% FCI Greenville Medium 73 38 65.77% FCI Oxford Medium 49 35 58.33% FCI Jesup Medium 2 2 50.00% FCI Three Rivers Medium 110 167 39.71% FCI Englewood Medium 16 99 13.91% FCI Beaumont Medium 0 6 0.00% FCI Petersburg Medium N/A N/A ------ USP Lompoc High 333 12 96.52% USP Lewisburg High 260 11 95.94% USP Terre Haute High 70 10 87.50% USP Allenwood High 79 17 82.29% USP Marion High 3 1 75.00% USP Atlanta High 79 62 56.03%
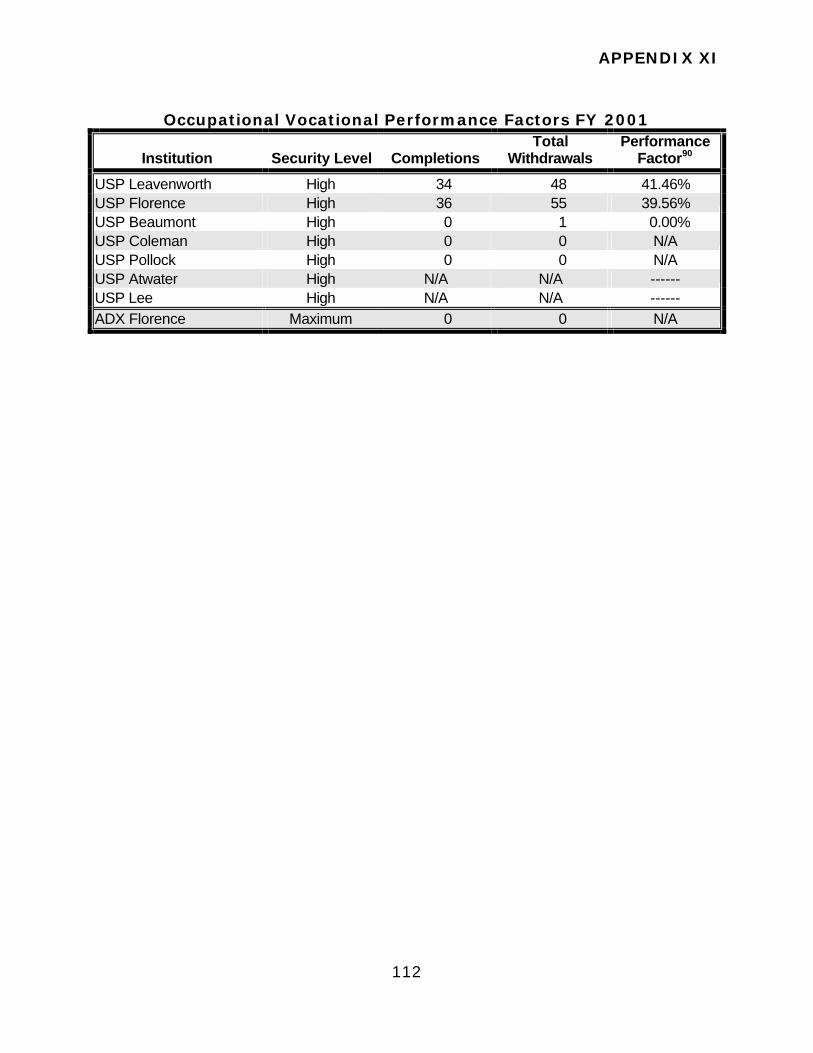
APPENDIX XI
112
Occupational Vocational Performance Factors FY 2001
Institution Security Level Completions Total
Withdrawals Performance
Factor90
USP Leavenworth High 34 48 41.46% USP Florence High 36 55 39.56% USP Beaumont High 0 1 0.00% USP Coleman High 0 0 N/A USP Pollock High 0 0 N/A USP Atwater High N/A N/A ------ USP Lee High N/A N/A ------ ADX Florence Maximum 0 0 N/A
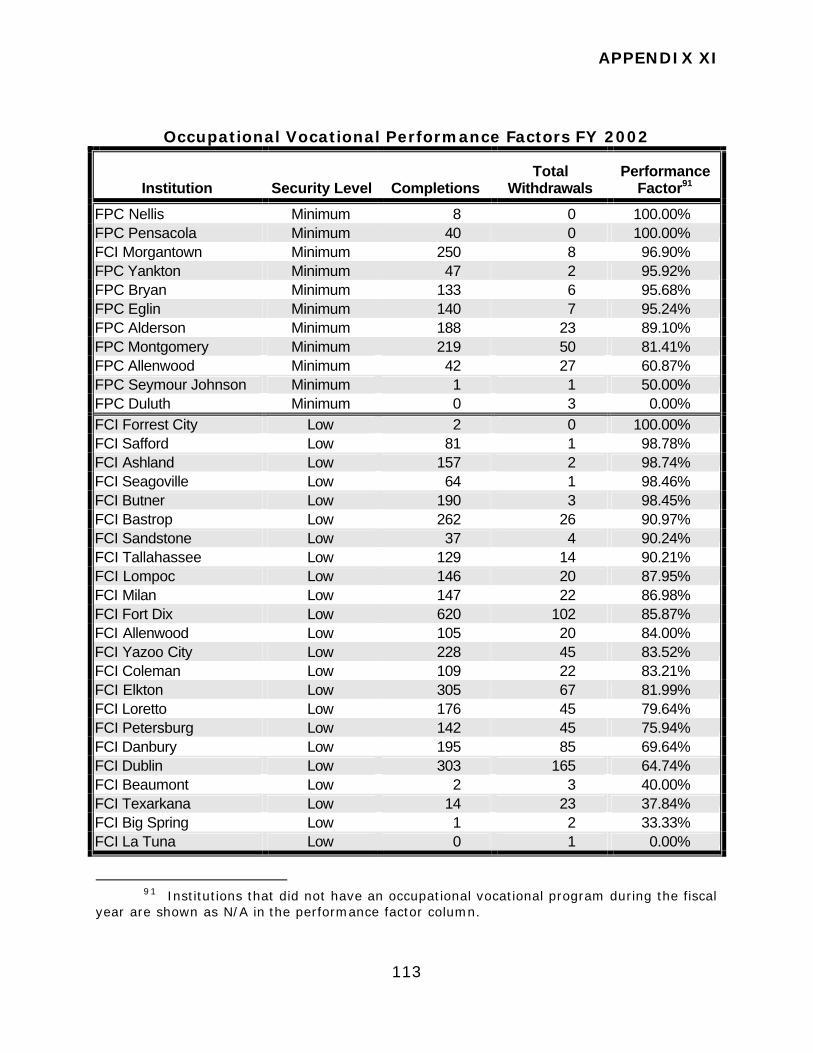
APPENDIX XI
113
Occupational Vocational Performance Factors FY 2002
Institution Security Level Completions Total
Withdrawals Performance
Factor91
FPC Nellis Minimum 8 0 100.00% FPC Pensacola Minimum 40 0 100.00% FCI Morgantown Minimum 250 8 96.90% FPC Yankton Minimum 47 2 95.92% FPC Bryan Minimum 133 6 95.68% FPC Eglin Minimum 140 7 95.24% FPC Alderson Minimum 188 23 89.10% FPC Montgomery Minimum 219 50 81.41% FPC Allenwood Minimum 42 27 60.87% FPC Seymour Johnson Minimum 1 1 50.00% FPC Duluth Minimum 0 3 0.00% FCI Forrest City Low 2 0 100.00% FCI Safford Low 81 1 98.78% FCI Ashland Low 157 2 98.74% FCI Seagoville Low 64 1 98.46% FCI Butner Low 190 3 98.45% FCI Bastrop Low 262 26 90.97% FCI Sandstone Low 37 4 90.24% FCI Tallahassee Low 129 14 90.21% FCI Lompoc Low 146 20 87.95% FCI Milan Low 147 22 86.98% FCI Fort Dix Low 620 102 85.87% FCI Allenwood Low 105 20 84.00% FCI Yazoo City Low 228 45 83.52% FCI Coleman Low 109 22 83.21% FCI Elkton Low 305 67 81.99% FCI Loretto Low 176 45 79.64% FCI Petersburg Low 142 45 75.94% FCI Danbury Low 195 85 69.64% FCI Dublin Low 303 165 64.74% FCI Beaumont Low 2 3 40.00% FCI Texarkana Low 14 23 37.84% FCI Big Spring Low 1 2 33.33% FCI La Tuna Low 0 1 0.00%
91 Institutions that did not have an occupational vocational program during the fiscal
year are shown as N/A in the performance factor column.
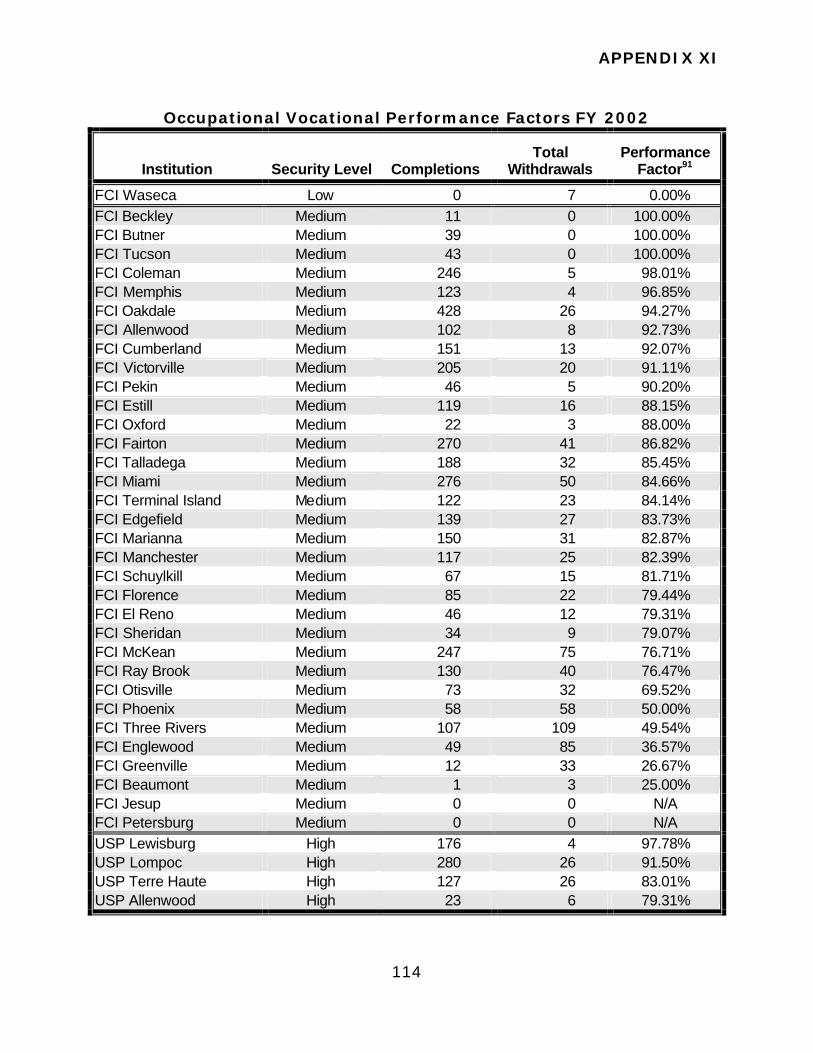
APPENDIX XI
114
Occupational Vocational Performance Factors FY 2002
Institution Security Level Completions Total
Withdrawals Performance
Factor91
FCI Waseca Low 0 7 0.00% FCI Beckley Medium 11 0 100.00% FCI Butner Medium 39 0 100.00% FCI Tucson Medium 43 0 100.00% FCI Coleman Medium 246 5 98.01% FCI Memphis Medium 123 4 96.85% FCI Oakdale Medium 428 26 94.27% FCI Allenwood Medium 102 8 92.73% FCI Cumberland Medium 151 13 92.07% FCI Victorville Medium 205 20 91.11% FCI Pekin Medium 46 5 90.20% FCI Estill Medium 119 16 88.15% FCI Oxford Medium 22 3 88.00% FCI Fairton Medium 270 41 86.82% FCI Talladega Medium 188 32 85.45% FCI Miami Medium 276 50 84.66% FCI Terminal Island Medium 122 23 84.14% FCI Edgefield Medium 139 27 83.73% FCI Marianna Medium 150 31 82.87% FCI Manchester Medium 117 25 82.39% FCI Schuylkill Medium 67 15 81.71% FCI Florence Medium 85 22 79.44% FCI El Reno Medium 46 12 79.31% FCI Sheridan Medium 34 9 79.07% FCI McKean Medium 247 75 76.71% FCI Ray Brook Medium 130 40 76.47% FCI Otisville Medium 73 32 69.52% FCI Phoenix Medium 58 58 50.00% FCI Three Rivers Medium 107 109 49.54% FCI Englewood Medium 49 85 36.57% FCI Greenville Medium 12 33 26.67% FCI Beaumont Medium 1 3 25.00% FCI Jesup Medium 0 0 N/A FCI Petersburg Medium 0 0 N/A USP Lewisburg High 176 4 97.78% USP Lompoc High 280 26 91.50% USP Terre Haute High 127 26 83.01% USP Allenwood High 23 6 79.31%
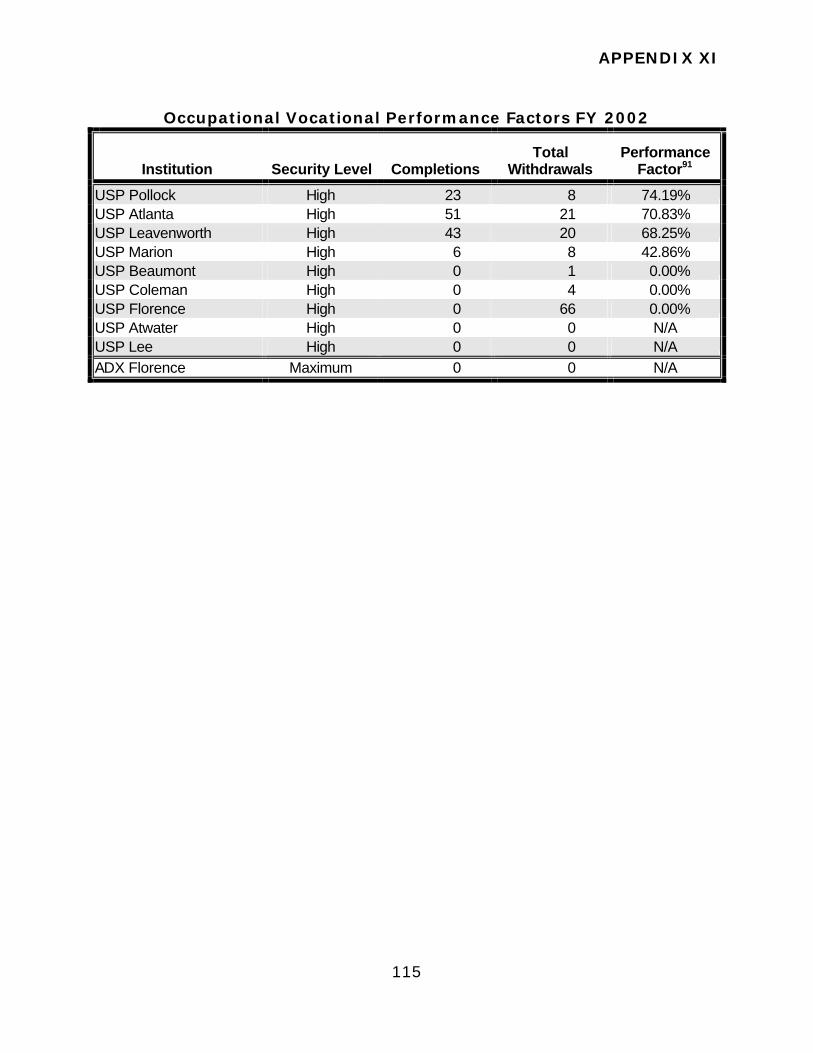
APPENDIX XI
115
Occupational Vocational Performance Factors FY 2002
Institution Security Level Completions Total
Withdrawals Performance
Factor91
USP Pollock High 23 8 74.19% USP Atlanta High 51 21 70.83% USP Leavenworth High 43 20 68.25% USP Marion High 6 8 42.86% USP Beaumont High 0 1 0.00% USP Coleman High 0 4 0.00% USP Florence High 0 66 0.00% USP Atwater High 0 0 N/A USP Lee High 0 0 N/A ADX Florence Maximum 0 0 N/A
APPENDIX XII
116
ANALYSIS OF THE PERCENTAGE OF CITIZEN GED DROPPED NON-PROMOTABLE INMATES
FY 2001 THROUGH FY 2002
For the institutions included in our audit, we reviewed the percentage of citizen inmates required to participate in the literacy program that have dropped out, and are therefore not promotable above the maintenance pay grade for work programs for FY 1999 through FY 2002. These inmates are designated as GED Dropped Non-promotable (GED DN) in the BOP’s Key Indicators.
The following schedules provide the details of our analysis of the
percentage of GED Dropped Non-promotable inmates as reported by the BOP in its Key Indicators for FY 2001 through FY 2002. Unless noted otherwise, those institutions for which the number of GED Dropped Non-promotable inmates is shown as “N/A“ were not open and/or fully operational during the fiscal year.

APPENDIX XII
117
GED Dropped Non-promotable FY 2001
Institution Security Level
Number of Inmates GED Dropped
Non-promotable
Percent of Inmates GED Dropped
Non-promotable
FPC Duluth Minimum 21 4.00% FPC Seymour Johnson Minimum 16 3.00% FPC Eglin Minimum 23 2.60% FPC Allenwood Minimum 18 2.40% FPC Montgomery Minimum 16 1.90% FPC Pensacola Minimum 10 1.90% FPC Nellis Minimum 9 1.60% FPC Alderson Minimum 10 1.20% FCI Morgantown Minimum 9 0.80% FPC Bryan Minimum 3 0.40% FPC Yankton Minimum 2 0.30% FCI Petersburg Low 65 4.10% FCI Butner Low 50 4.00% FCI Yazoo City Low 79 3.80% FCI Sandstone Low 29 3.60% FCI Ashland Low 42 3.00% FCI Bastrop Low 37 2.70% FCI Beaumont Low 50 2.60% FCI Forrest City Low 53 2.60% FCI Allenwood Low 33 2.50% FCI Milan Low 41 2.50% FCI Danbury Low 31 2.30% FCI Coleman Low 44 2.10% FCI Fort Dix Low 86 2.00% FCI Elkton Low 40 1.80% FCI Loretto Low 20 1.70% FCI Texarkana Low 25 1.60% FCI Waseca Low 16 1.50% FCI Seagoville Low 13 1.30% FCI Tallahassee Low 17 1.30% FCI Dublin Low 12 0.90% FCI Big Spring Low 7 0.80% FCI La Tuna Low 13 0.80% FCI Safford Low 6 0.70% FCI Lompoc Low 3 0.30% FCI Edgefield Medium 188 9.50% FCI Memphis Medium 126 8.60% FCI Fairton Medium 84 6.10%
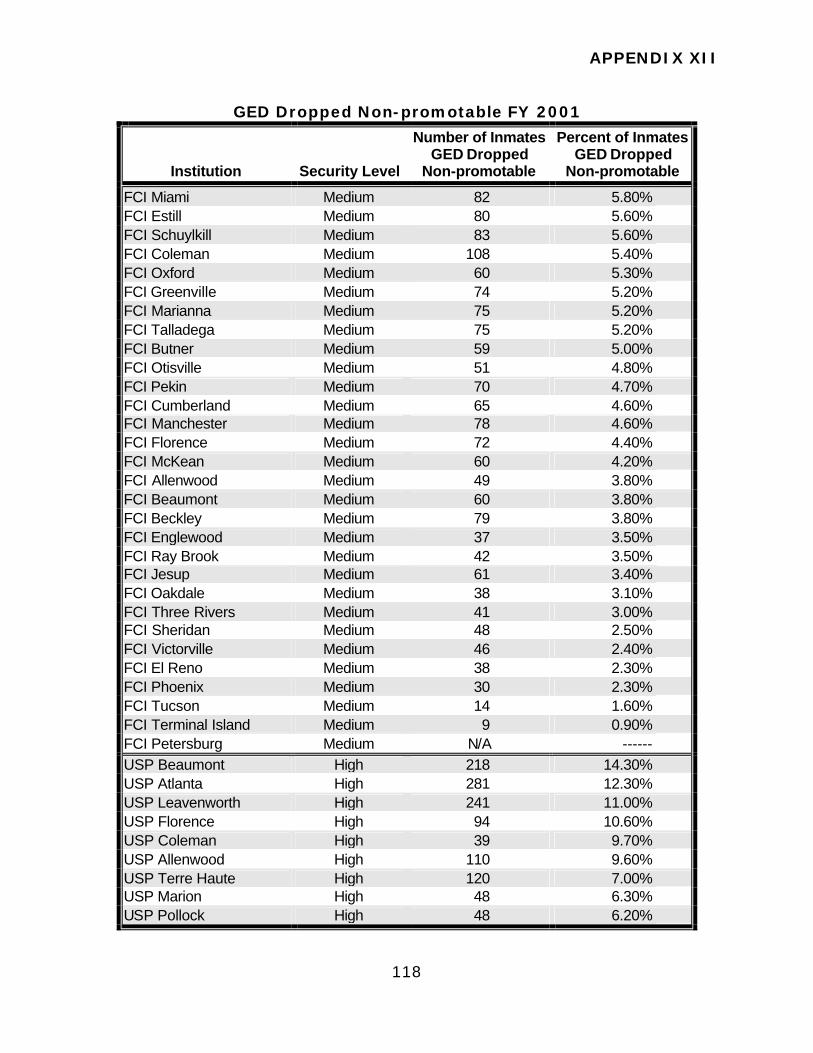
APPENDIX XII
118
GED Dropped Non-promotable FY 2001
Institution Security Level
Number of Inmates GED Dropped
Non-promotable
Percent of Inmates GED Dropped
Non-promotable
FCI Miami Medium 82 5.80% FCI Estill Medium 80 5.60% FCI Schuylkill Medium 83 5.60% FCI Coleman Medium 108 5.40% FCI Oxford Medium 60 5.30% FCI Greenville Medium 74 5.20% FCI Marianna Medium 75 5.20% FCI Talladega Medium 75 5.20% FCI Butner Medium 59 5.00% FCI Otisville Medium 51 4.80% FCI Pekin Medium 70 4.70% FCI Cumberland Medium 65 4.60% FCI Manchester Medium 78 4.60% FCI Florence Medium 72 4.40% FCI McKean Medium 60 4.20% FCI Allenwood Medium 49 3.80% FCI Beaumont Medium 60 3.80% FCI Beckley Medium 79 3.80% FCI Englewood Medium 37 3.50% FCI Ray Brook Medium 42 3.50% FCI Jesup Medium 61 3.40% FCI Oakdale Medium 38 3.10% FCI Three Rivers Medium 41 3.00% FCI Sheridan Medium 48 2.50% FCI Victorville Medium 46 2.40% FCI El Reno Medium 38 2.30% FCI Phoenix Medium 30 2.30% FCI Tucson Medium 14 1.60% FCI Terminal Island Medium 9 0.90% FCI Petersburg Medium N/A ------ USP Beaumont High 218 14.30% USP Atlanta High 281 12.30% USP Leavenworth High 241 11.00% USP Florence High 94 10.60% USP Coleman High 39 9.70% USP Allenwood High 110 9.60% USP Terre Haute High 120 7.00% USP Marion High 48 6.30% USP Pollock High 48 6.20%
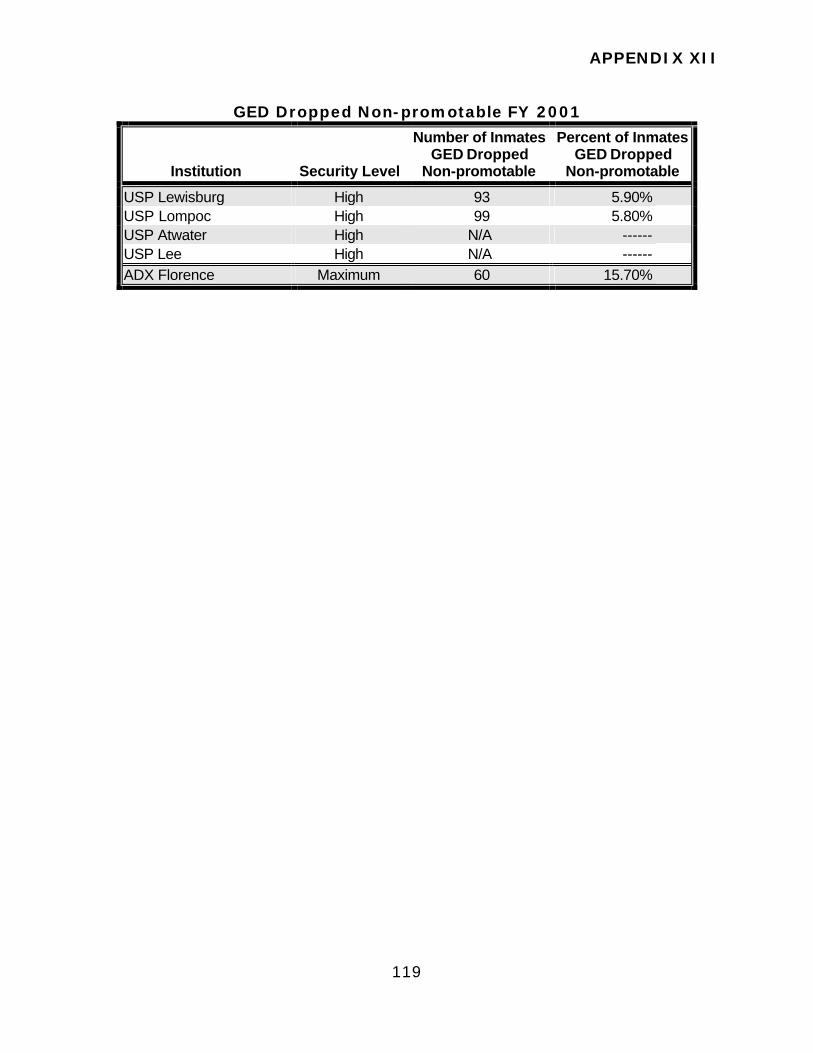
APPENDIX XII
119
GED Dropped Non-promotable FY 2001
Institution Security Level
Number of Inmates GED Dropped
Non-promotable
Percent of Inmates GED Dropped
Non-promotable
USP Lewisburg High 93 5.90% USP Lompoc High 99 5.80% USP Atwater High N/A ------ USP Lee High N/A ------ ADX Florence Maximum 60 15.70%
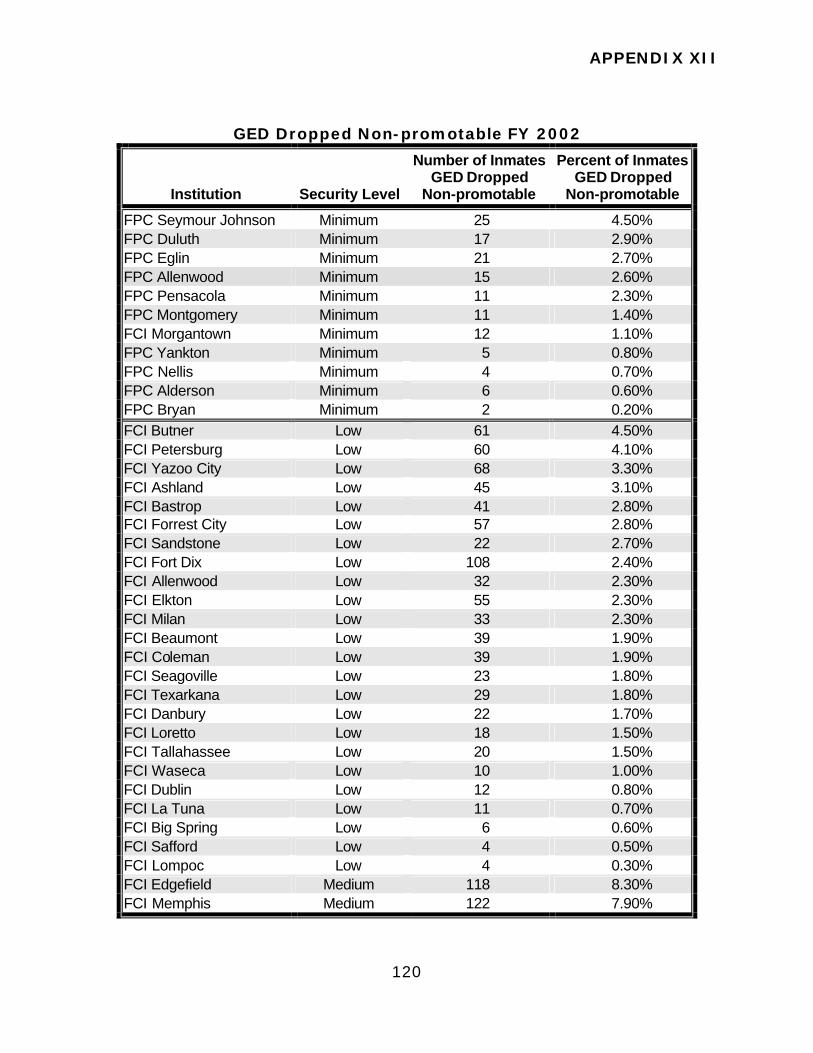
APPENDIX XII
120
GED Dropped Non-promotable FY 2002
Institution Security Level
Number of Inmates GED Dropped
Non-promotable
Percent of Inmates GED Dropped
Non-promotable
FPC Seymour Johnson Minimum 25 4.50% FPC Duluth Minimum 17 2.90% FPC Eglin Minimum 21 2.70% FPC Allenwood Minimum 15 2.60% FPC Pensacola Minimum 11 2.30% FPC Montgomery Minimum 11 1.40% FCI Morgantown Minimum 12 1.10% FPC Yankton Minimum 5 0.80% FPC Nellis Minimum 4 0.70% FPC Alderson Minimum 6 0.60% FPC Bryan Minimum 2 0.20% FCI Butner Low 61 4.50% FCI Petersburg Low 60 4.10% FCI Yazoo City Low 68 3.30% FCI Ashland Low 45 3.10% FCI Bastrop Low 41 2.80% FCI Forrest City Low 57 2.80% FCI Sandstone Low 22 2.70% FCI Fort Dix Low 108 2.40% FCI Allenwood Low 32 2.30% FCI Elkton Low 55 2.30% FCI Milan Low 33 2.30% FCI Beaumont Low 39 1.90% FCI Coleman Low 39 1.90% FCI Seagoville Low 23 1.80% FCI Texarkana Low 29 1.80% FCI Danbury Low 22 1.70% FCI Loretto Low 18 1.50% FCI Tallahassee Low 20 1.50% FCI Waseca Low 10 1.00% FCI Dublin Low 12 0.80% FCI La Tuna Low 11 0.70% FCI Big Spring Low 6 0.60% FCI Safford Low 4 0.50% FCI Lompoc Low 4 0.30% FCI Edgefield Medium 118 8.30% FCI Memphis Medium 122 7.90%
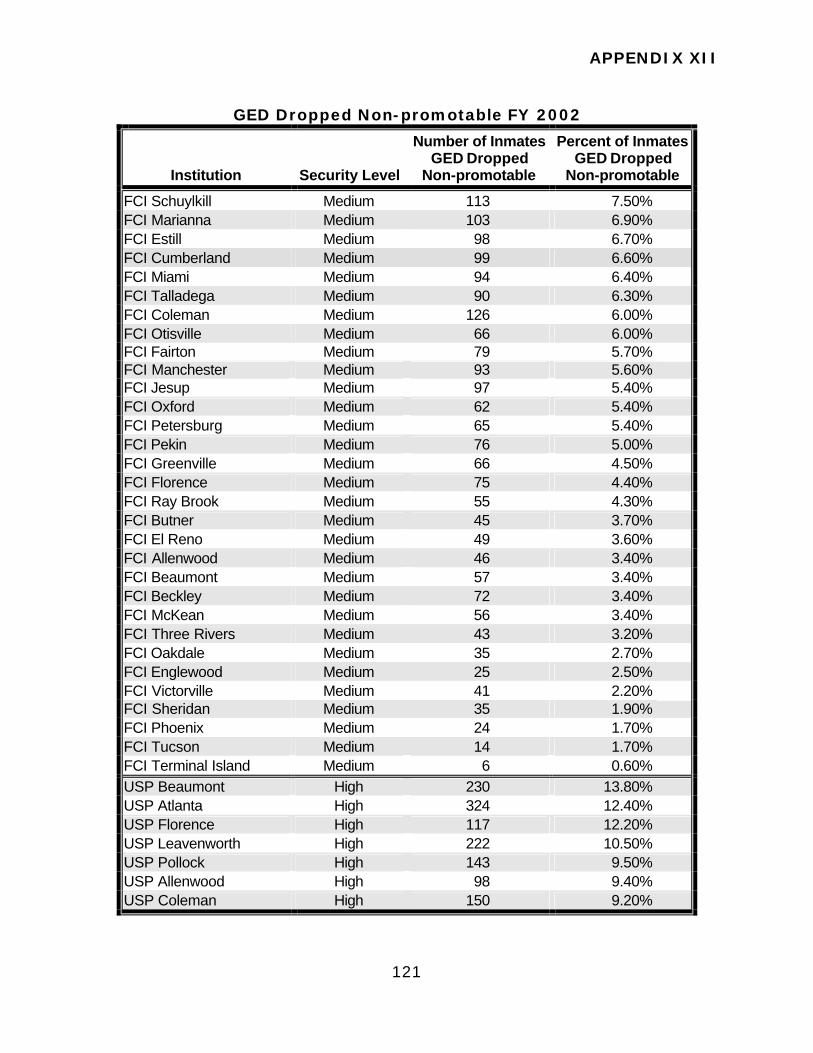
APPENDIX XII
121
GED Dropped Non-promotable FY 2002
Institution Security Level
Number of Inmates GED Dropped
Non-promotable
Percent of Inmates GED Dropped
Non-promotable
FCI Schuylkill Medium 113 7.50% FCI Marianna Medium 103 6.90% FCI Estill Medium 98 6.70% FCI Cumberland Medium 99 6.60% FCI Miami Medium 94 6.40% FCI Talladega Medium 90 6.30% FCI Coleman Medium 126 6.00% FCI Otisville Medium 66 6.00% FCI Fairton Medium 79 5.70% FCI Manchester Medium 93 5.60% FCI Jesup Medium 97 5.40% FCI Oxford Medium 62 5.40% FCI Petersburg Medium 65 5.40% FCI Pekin Medium 76 5.00% FCI Greenville Medium 66 4.50% FCI Florence Medium 75 4.40% FCI Ray Brook Medium 55 4.30% FCI Butner Medium 45 3.70% FCI El Reno Medium 49 3.60% FCI Allenwood Medium 46 3.40% FCI Beaumont Medium 57 3.40% FCI Beckley Medium 72 3.40% FCI McKean Medium 56 3.40% FCI Three Rivers Medium 43 3.20% FCI Oakdale Medium 35 2.70% FCI Englewood Medium 25 2.50% FCI Victorville Medium 41 2.20% FCI Sheridan Medium 35 1.90% FCI Phoenix Medium 24 1.70% FCI Tucson Medium 14 1.70% FCI Terminal Island Medium 6 0.60% USP Beaumont High 230 13.80% USP Atlanta High 324 12.40% USP Florence High 117 12.20% USP Leavenworth High 222 10.50% USP Pollock High 143 9.50% USP Allenwood High 98 9.40% USP Coleman High 150 9.20%
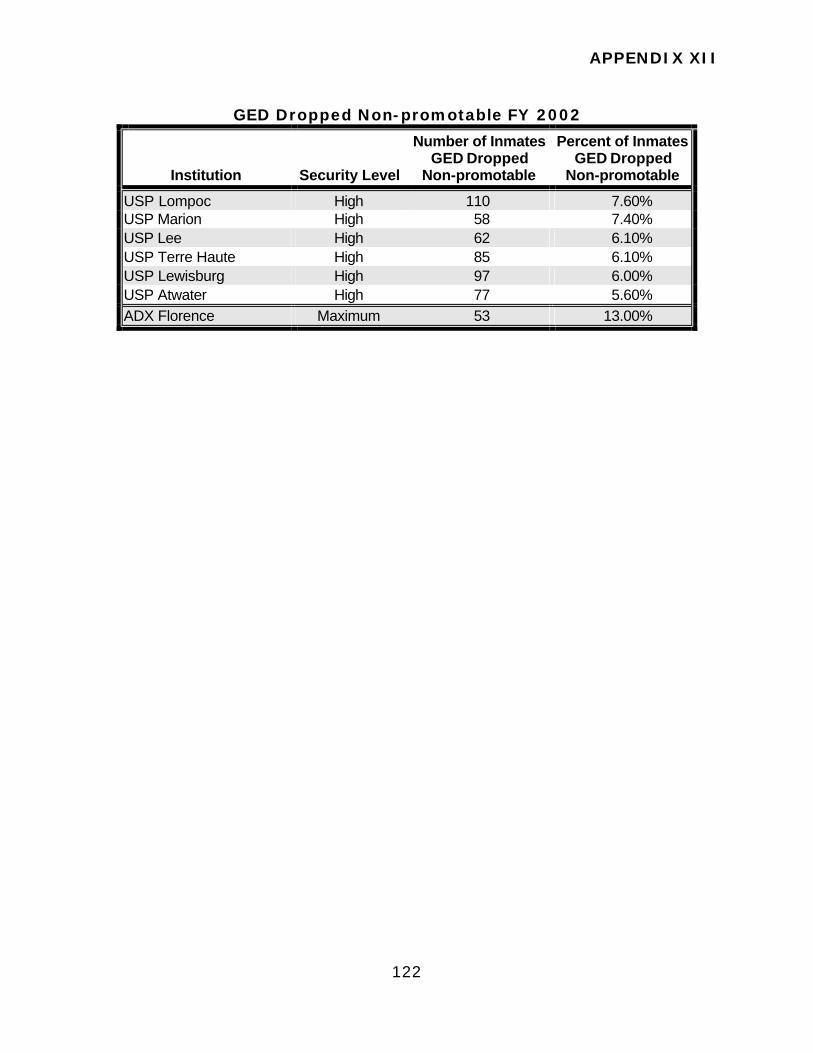
APPENDIX XII
122
GED Dropped Non-promotable FY 2002
Institution Security Level
Number of Inmates GED Dropped
Non-promotable
Percent of Inmates GED Dropped
Non-promotable
USP Lompoc High 110 7.60% USP Marion High 58 7.40% USP Lee High 62 6.10% USP Terre Haute High 85 6.10% USP Lewisburg High 97 6.00% USP Atwater High 77 5.60% ADX Florence Maximum 53 13.00%
APPENDIX XIII
123
ANALYSIS OF THE CCC UTILIZATION TARGETS AND OUTCOMES FY 2001 THROUGH 2002
For each institution included in our audit, we calculated the CCC utilization rate, for FY 2000 through FY 2002. To calculate the CCC utilization rate, we used the total number of inmates transferred to a CCC and total number of inmates released directly to the community as reported in the BOP’s Key Indicators.92 For the minimum, low and medium security institutions, we also compared the CCC utilization rate calculated for each institution to the CCC utilization target for the corresponding security level.
The following schedules provide the details of our calculations and
analysis of the CCC utilization rates for FY 2001 through FY 2002. Unless noted otherwise, those institutions for which the CCC utilization outcome is shown as “N/A“ did not submit an Program Report for Education and Recreation Services because the institution was not open and/or fully operational during the fiscal year.
92 The CCC utilization rate is equal to the total number of inmates placed in a CCC
prior to release divided by the total number of inmates released.
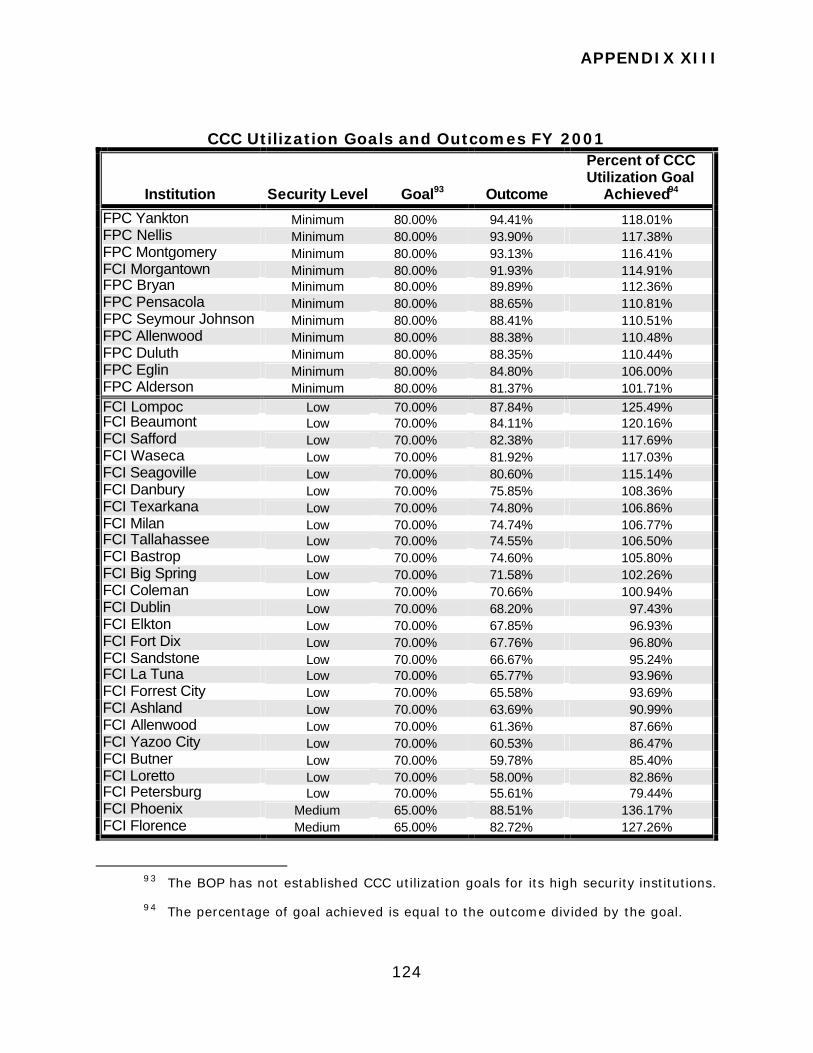
APPENDIX XIII
124
CCC Utilization Goals and Outcomes FY 2001
Institution Security Level Goal93 Outcome
Percent of CCC Utilization Goal
Achieved94
FPC Yankton Minimum 80.00% 94.41% 118.01% FPC Nellis Minimum 80.00% 93.90% 117.38% FPC Montgomery Minimum 80.00% 93.13% 116.41% FCI Morgantown Minimum 80.00% 91.93% 114.91% FPC Bryan Minimum 80.00% 89.89% 112.36% FPC Pensacola Minimum 80.00% 88.65% 110.81% FPC Seymour Johnson Minimum 80.00% 88.41% 110.51% FPC Allenwood Minimum 80.00% 88.38% 110.48% FPC Duluth Minimum 80.00% 88.35% 110.44% FPC Eglin Minimum 80.00% 84.80% 106.00% FPC Alderson Minimum 80.00% 81.37% 101.71% FCI Lompoc Low 70.00% 87.84% 125.49% FCI Beaumont Low 70.00% 84.11% 120.16% FCI Safford Low 70.00% 82.38% 117.69% FCI Waseca Low 70.00% 81.92% 117.03% FCI Seagoville Low 70.00% 80.60% 115.14% FCI Danbury Low 70.00% 75.85% 108.36% FCI Texarkana Low 70.00% 74.80% 106.86% FCI Milan Low 70.00% 74.74% 106.77% FCI Tallahassee Low 70.00% 74.55% 106.50% FCI Bastrop Low 70.00% 74.60% 105.80% FCI Big Spring Low 70.00% 71.58% 102.26% FCI Coleman Low 70.00% 70.66% 100.94% FCI Dublin Low 70.00% 68.20% 97.43% FCI Elkton Low 70.00% 67.85% 96.93% FCI Fort Dix Low 70.00% 67.76% 96.80% FCI Sandstone Low 70.00% 66.67% 95.24% FCI La Tuna Low 70.00% 65.77% 93.96% FCI Forrest City Low 70.00% 65.58% 93.69% FCI Ashland Low 70.00% 63.69% 90.99% FCI Allenwood Low 70.00% 61.36% 87.66% FCI Yazoo City Low 70.00% 60.53% 86.47% FCI Butner Low 70.00% 59.78% 85.40% FCI Loretto Low 70.00% 58.00% 82.86% FCI Petersburg Low 70.00% 55.61% 79.44% FCI Phoenix Medium 65.00% 88.51% 136.17% FCI Florence Medium 65.00% 82.72% 127.26%
93 The BOP has not established CCC utilization goals for its high security institutions.
94 The percentage of goal achieved is equal to the outcome divided by the goal.
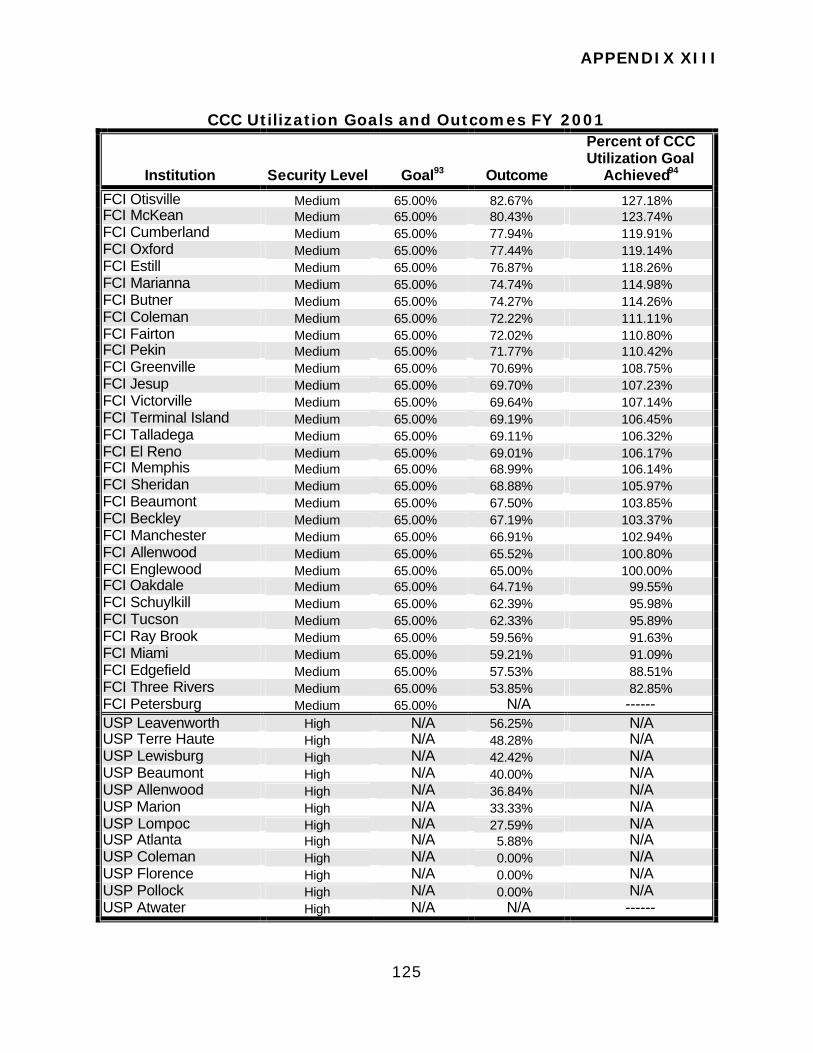
APPENDIX XIII
125
CCC Utilization Goals and Outcomes FY 2001
Institution Security Level Goal93 Outcome
Percent of CCC Utilization Goal
Achieved94
FCI Otisville Medium 65.00% 82.67% 127.18% FCI McKean Medium 65.00% 80.43% 123.74% FCI Cumberland Medium 65.00% 77.94% 119.91% FCI Oxford Medium 65.00% 77.44% 119.14% FCI Estill Medium 65.00% 76.87% 118.26% FCI Marianna Medium 65.00% 74.74% 114.98% FCI Butner Medium 65.00% 74.27% 114.26% FCI Coleman Medium 65.00% 72.22% 111.11% FCI Fairton Medium 65.00% 72.02% 110.80% FCI Pekin Medium 65.00% 71.77% 110.42% FCI Greenville Medium 65.00% 70.69% 108.75% FCI Jesup Medium 65.00% 69.70% 107.23% FCI Victorville Medium 65.00% 69.64% 107.14% FCI Terminal Island Medium 65.00% 69.19% 106.45% FCI Talladega Medium 65.00% 69.11% 106.32% FCI El Reno Medium 65.00% 69.01% 106.17% FCI Memphis Medium 65.00% 68.99% 106.14% FCI Sheridan Medium 65.00% 68.88% 105.97% FCI Beaumont Medium 65.00% 67.50% 103.85% FCI Beckley Medium 65.00% 67.19% 103.37% FCI Manchester Medium 65.00% 66.91% 102.94% FCI Allenwood Medium 65.00% 65.52% 100.80% FCI Englewood Medium 65.00% 65.00% 100.00% FCI Oakdale Medium 65.00% 64.71% 99.55% FCI Schuylkill Medium 65.00% 62.39% 95.98% FCI Tucson Medium 65.00% 62.33% 95.89% FCI Ray Brook Medium 65.00% 59.56% 91.63% FCI Miami Medium 65.00% 59.21% 91.09% FCI Edgefield Medium 65.00% 57.53% 88.51% FCI Three Rivers Medium 65.00% 53.85% 82.85% FCI Petersburg Medium 65.00% N/A ------ USP Leavenworth High N/A 56.25% N/A USP Terre Haute High N/A 48.28% N/A USP Lewisburg High N/A 42.42% N/A USP Beaumont High N/A 40.00% N/A USP Allenwood High N/A 36.84% N/A USP Marion High N/A 33.33% N/A USP Lompoc High N/A 27.59% N/A USP Atlanta High N/A 5.88% N/A USP Coleman High N/A 0.00% N/A USP Florence High N/A 0.00% N/A USP Pollock High N/A 0.00% N/A USP Atwater High N/A N/A ------

APPENDIX XIII
126
CCC Utilization Goals and Outcomes FY 2001
Institution Security Level Goal93 Outcome
Percent of CCC Utilization Goal
Achieved94
USP Lee High N/A N/A ------ ADX Florence Maximum N/A N/A95 ------
95 No inmates were released directly to the community from ADX Florence.
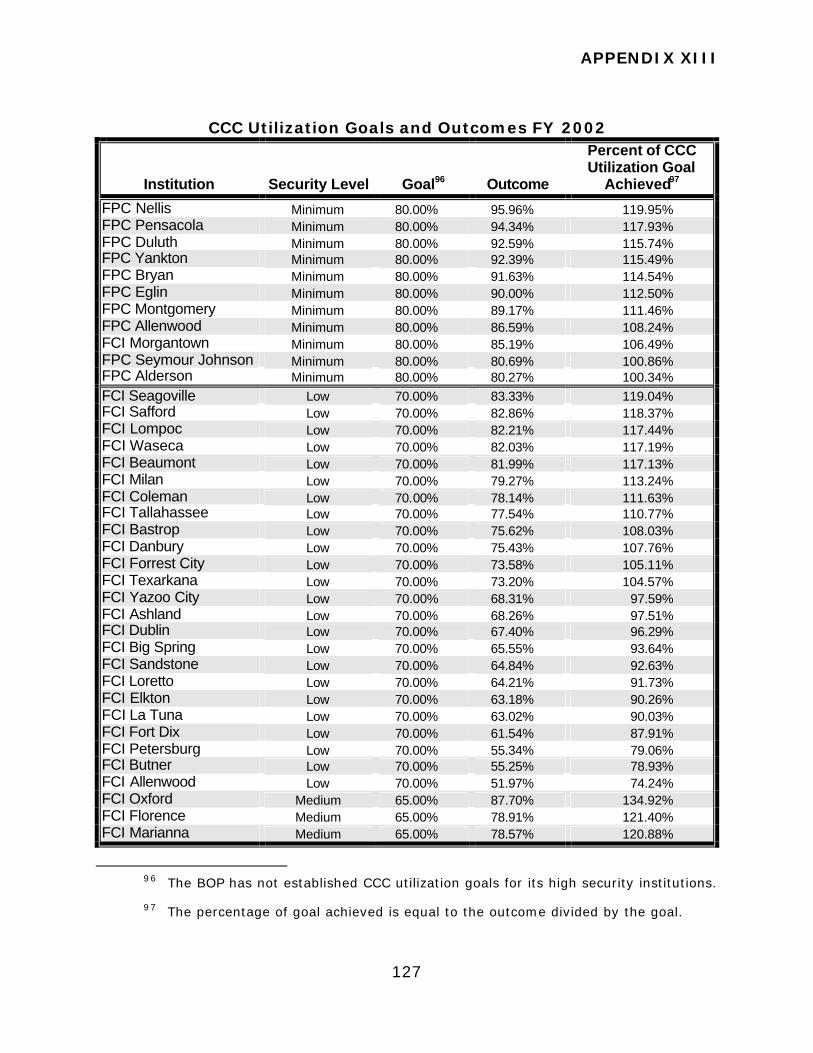
APPENDIX XIII
127
CCC Utilization Goals and Outcomes FY 2002
Institution Security Level Goal96 Outcome
Percent of CCC Utilization Goal
Achieved97
FPC Nellis Minimum 80.00% 95.96% 119.95% FPC Pensacola Minimum 80.00% 94.34% 117.93% FPC Duluth Minimum 80.00% 92.59% 115.74% FPC Yankton Minimum 80.00% 92.39% 115.49% FPC Bryan Minimum 80.00% 91.63% 114.54% FPC Eglin Minimum 80.00% 90.00% 112.50% FPC Montgomery Minimum 80.00% 89.17% 111.46% FPC Allenwood Minimum 80.00% 86.59% 108.24% FCI Morgantown Minimum 80.00% 85.19% 106.49% FPC Seymour Johnson Minimum 80.00% 80.69% 100.86% FPC Alderson Minimum 80.00% 80.27% 100.34% FCI Seagoville Low 70.00% 83.33% 119.04% FCI Safford Low 70.00% 82.86% 118.37% FCI Lompoc Low 70.00% 82.21% 117.44% FCI Waseca Low 70.00% 82.03% 117.19% FCI Beaumont Low 70.00% 81.99% 117.13% FCI Milan Low 70.00% 79.27% 113.24% FCI Coleman Low 70.00% 78.14% 111.63% FCI Tallahassee Low 70.00% 77.54% 110.77% FCI Bastrop Low 70.00% 75.62% 108.03% FCI Danbury Low 70.00% 75.43% 107.76% FCI Forrest City Low 70.00% 73.58% 105.11% FCI Texarkana Low 70.00% 73.20% 104.57% FCI Yazoo City Low 70.00% 68.31% 97.59% FCI Ashland Low 70.00% 68.26% 97.51% FCI Dublin Low 70.00% 67.40% 96.29% FCI Big Spring Low 70.00% 65.55% 93.64% FCI Sandstone Low 70.00% 64.84% 92.63% FCI Loretto Low 70.00% 64.21% 91.73% FCI Elkton Low 70.00% 63.18% 90.26% FCI La Tuna Low 70.00% 63.02% 90.03% FCI Fort Dix Low 70.00% 61.54% 87.91% FCI Petersburg Low 70.00% 55.34% 79.06% FCI Butner Low 70.00% 55.25% 78.93% FCI Allenwood Low 70.00% 51.97% 74.24% FCI Oxford Medium 65.00% 87.70% 134.92% FCI Florence Medium 65.00% 78.91% 121.40% FCI Marianna Medium 65.00% 78.57% 120.88%
96 The BOP has not established CCC utilization goals for its high security institutions.
97 The percentage of goal achieved is equal to the outcome divided by the goal.
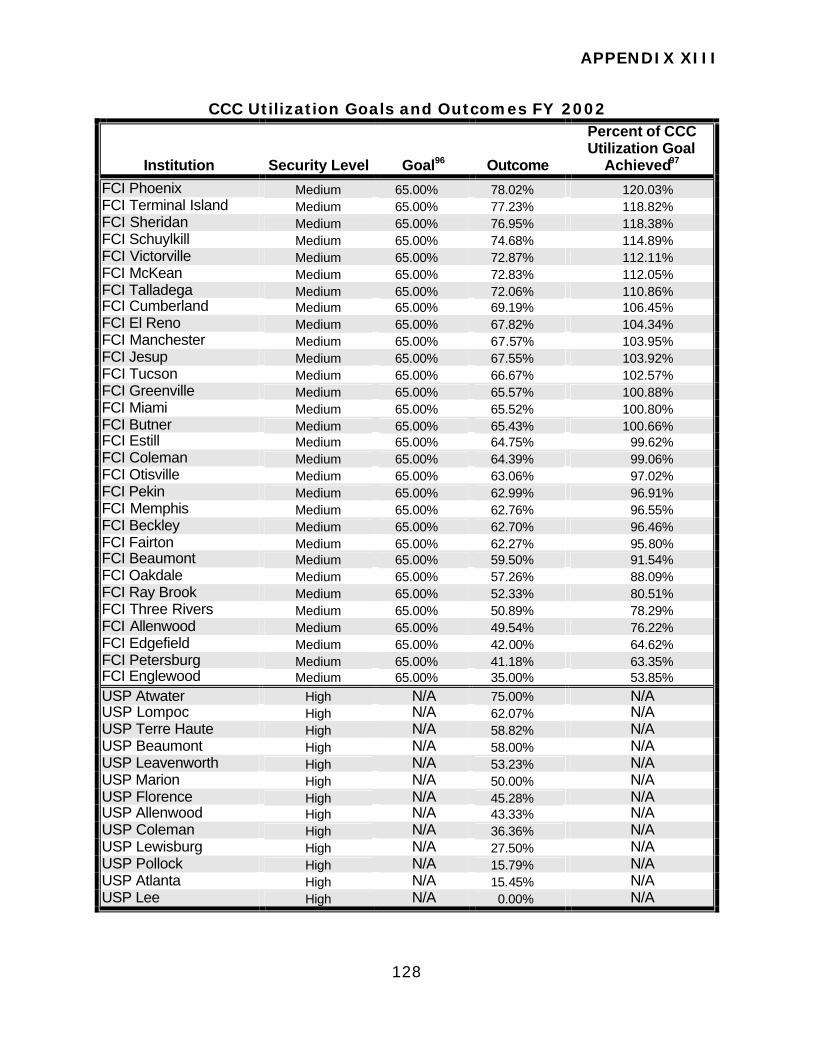
APPENDIX XIII
128
CCC Utilization Goals and Outcomes FY 2002
Institution Security Level Goal96 Outcome
Percent of CCC Utilization Goal
Achieved97
FCI Phoenix Medium 65.00% 78.02% 120.03% FCI Terminal Island Medium 65.00% 77.23% 118.82% FCI Sheridan Medium 65.00% 76.95% 118.38% FCI Schuylkill Medium 65.00% 74.68% 114.89% FCI Victorville Medium 65.00% 72.87% 112.11% FCI McKean Medium 65.00% 72.83% 112.05% FCI Talladega Medium 65.00% 72.06% 110.86% FCI Cumberland Medium 65.00% 69.19% 106.45% FCI El Reno Medium 65.00% 67.82% 104.34% FCI Manchester Medium 65.00% 67.57% 103.95% FCI Jesup Medium 65.00% 67.55% 103.92% FCI Tucson Medium 65.00% 66.67% 102.57% FCI Greenville Medium 65.00% 65.57% 100.88% FCI Miami Medium 65.00% 65.52% 100.80% FCI Butner Medium 65.00% 65.43% 100.66% FCI Estill Medium 65.00% 64.75% 99.62% FCI Coleman Medium 65.00% 64.39% 99.06% FCI Otisville Medium 65.00% 63.06% 97.02% FCI Pekin Medium 65.00% 62.99% 96.91% FCI Memphis Medium 65.00% 62.76% 96.55% FCI Beckley Medium 65.00% 62.70% 96.46% FCI Fairton Medium 65.00% 62.27% 95.80% FCI Beaumont Medium 65.00% 59.50% 91.54% FCI Oakdale Medium 65.00% 57.26% 88.09% FCI Ray Brook Medium 65.00% 52.33% 80.51% FCI Three Rivers Medium 65.00% 50.89% 78.29% FCI Allenwood Medium 65.00% 49.54% 76.22% FCI Edgefield Medium 65.00% 42.00% 64.62% FCI Petersburg Medium 65.00% 41.18% 63.35% FCI Englewood Medium 65.00% 35.00% 53.85% USP Atwater High N/A 75.00% N/A USP Lompoc High N/A 62.07% N/A USP Terre Haute High N/A 58.82% N/A USP Beaumont High N/A 58.00% N/A USP Leavenworth High N/A 53.23% N/A USP Marion High N/A 50.00% N/A USP Florence High N/A 45.28% N/A USP Allenwood High N/A 43.33% N/A USP Coleman High N/A 36.36% N/A USP Lewisburg High N/A 27.50% N/A USP Pollock High N/A 15.79% N/A USP Atlanta High N/A 15.45% N/A USP Lee High N/A 0.00% N/A

APPENDIX XIII
129
CCC Utilization Goals and Outcomes FY 2002
Institution Security Level Goal96 Outcome
Percent of CCC Utilization Goal
Achieved97
ADX Florence Maximum N/A N/A98 ------
98 No inmates were released directly to the community from ADX Florence.
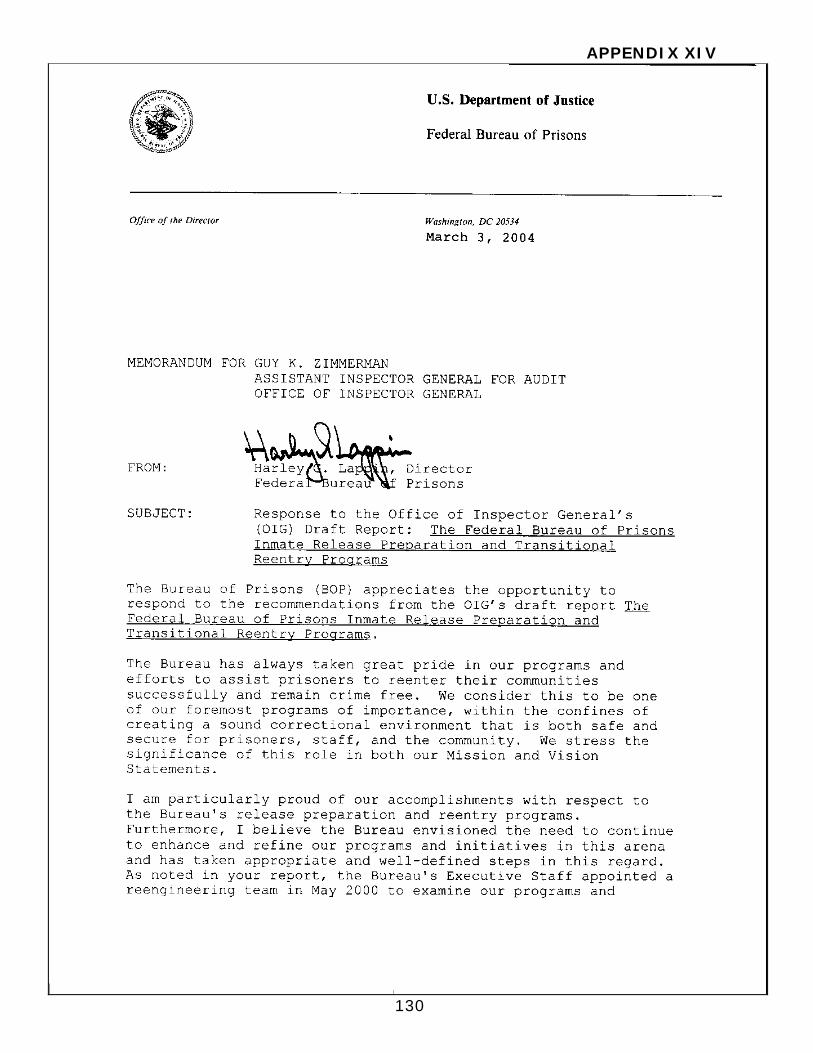
APPENDIX XIV
130

APPENDIX XIV
131

APPENDIX XIV
132
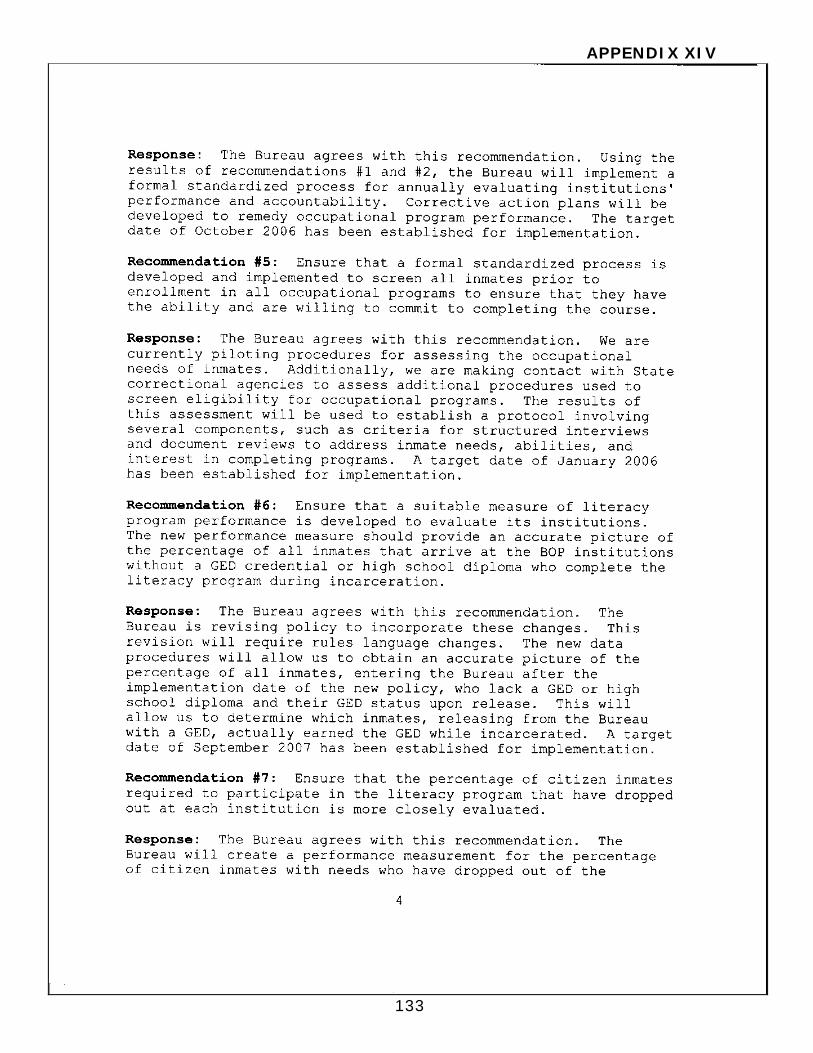
APPENDIX XIV
133
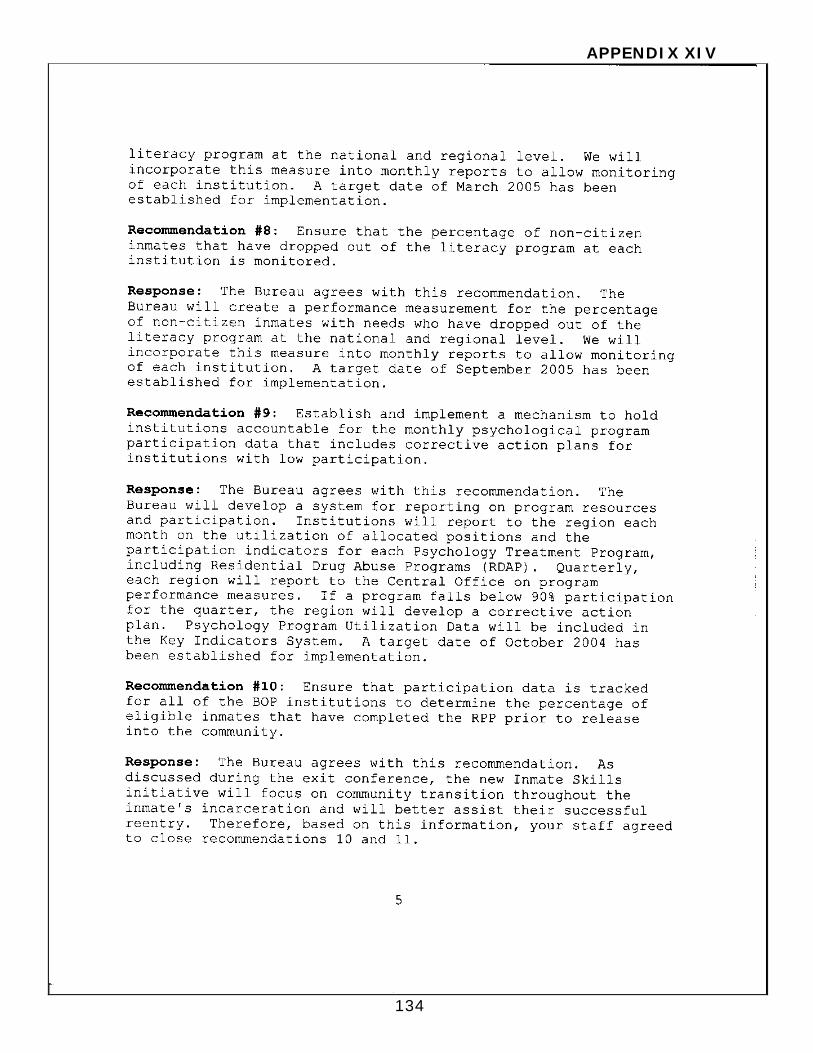
APPENDIX XIV
134
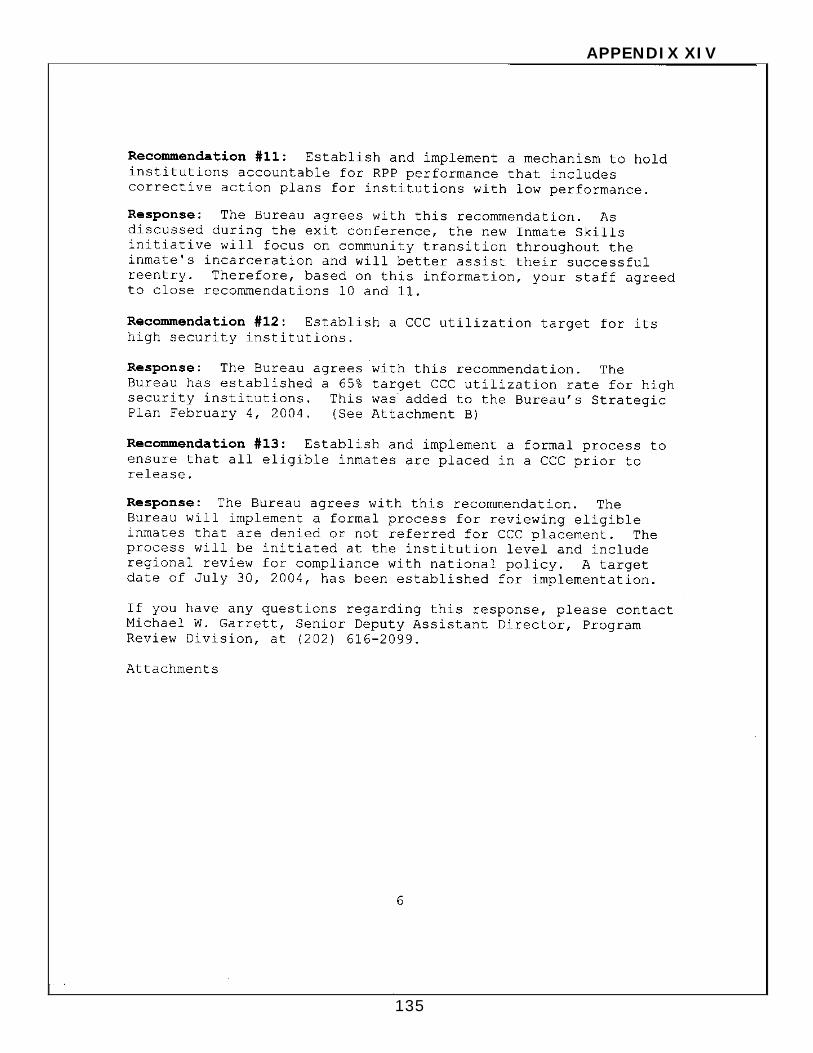
APPENDIX XIV
135
APPENDIX XV
136
ANALYSIS AND SUMMARY OF ACTIONS NECESSARY TO CLOSE THE REPORT
The BOP response to the audit (Appendix XIV) describes the actions taken or planned to implement our recommendations. Our analysis of the BOP’s response to specific recommendations is provided below. In addition to responding to the recommendations, the BOP made several claims in the program overview section of its response to which we first respond.
The BOP states in its response to the draft report that the
establishment of the Inmate Skills Development Branch in June 2003 is one of the most significant initiatives related to the preparation of inmates for successful transition into the community. As stated in the background section of our report, the mission of the Inmate Skills Development Branch is to “coordinate the [BOP’s] efforts to implement inmate skill development initiatives and provide a centralized point of liaison with external agencies to equip inmates with the necessary skills to succeed upon release.” However, it is important to note that, at this time, we are unable to determine what impact, if any, the initiative will have on the issues identified in this report because the Inmate Skills Development Branch is still in its developmental stage. The BOP also states in its response to the draft report that, “Many of your findings and recommendations were items we self-identified and reported to your auditors that we were actively addressing.” In our judgment, this statement is somewhat misleading. While it may be true that the BOP was aware of some of the findings included in our report, much of this information was not shared with the auditors until our preliminary findings were presented to BOP officials. 1. Resolved. This recommendation can be closed when we receive
documentation supporting that the BOP has implemented a formal process to set realistic occupational and educational program goals stated as a percentage of completions to account for total enrollments and the inmate population.
2. Resolved. This recommendation can be closed when we receive
documentation supporting that the BOP has implemented a formal process of accountability for institutions in meeting their occupational and educational program completion goals that includes corrective action plans, as necessary, to remedy performance issues.
APPENDIX XV
137
3. Closed. 4. Resolved. This recommendation can be closed when we receive
documentation supporting that the BOP has implemented a formal standard process for evaluating institutions’ occupational program performance and accountability annually that includes corrective action plans, as necessary, to remedy program performance.
5. Resolved. This recommendation can be closed when we receive
documentation supporting that the BOP has implemented procedures for assessing the occupational needs of inmates and a formal standard process for screening inmates prior to enrollment in an occupational program.
6. Resolved. This recommendation can be closed when we receive
documentation supporting that the BOP has implemented new data collection procedures that provide an accurate picture of the percentage of all inmates entering BOP institutions who lack a high school diploma or GED and the percentage of those inmates who actually earn a GED while incarcerated in a BOP institution.
7. Resolved. This recommendation can be closed when we receive
documentation supporting that the BOP has implemented a performance measurement for the percentage of citizen inmates with GED needs who have dropped out of the literacy program at the national and regional level and incorporated the measure into monthly reports for monitoring performance at each institution.
8. Resolved. This recommendation can be closed when we receive
documentation supporting that the BOP has implemented a performance measurement for the percentage of noncitizen inmates with GED needs who have dropped out of the literacy program at the national and regional level and incorporated the measure into monthly reports for monitoring performance at each institution.
9. Resolved. This recommendation can be closed when we receive
documentation supporting that the BOP has implemented a system for reporting on psychological program resources and participation that includes developing corrective action plans if program participation falls below 90 percent.
APPENDIX XV
138
10. Resolved. The BOP states in its response to the draft report that during the exit conference the auditors agreed to close recommendations 10 and 11 based on information provided during the exit conference related to the BOP’s plans to eliminate the RPP once the Inmate Skills initiative is fully implemented. Rather, the auditors stated that if the RPP was eliminated, recommendations 10 and 11 could be closed; however, we did not agree to close the recommendations at this time. This recommendation can be closed when we receive documentation supporting that the BOP has eliminated the RPP and fully implemented the Inmate Skills initiative which focuses on community transition throughout the inmate’s incarceration.
11. Resolved. This recommendation can be closed when we receive
documentation supporting that the BOP has eliminated the RPP and fully implemented the Inmate Skills initiative which focuses on community transition throughout the inmate’s incarceration.
12. Closed. 13. Resolved. This recommendation can be closed when we receive
documentation supporting that the BOP has implemented a formal process for reviewing eligible inmates that are denied or not referred for CCC placement that includes region review for compliance with national policy.