THIE FATE OF SUGAR IN THE ANIMAL BODY. Without an accurate ...
Upload
nguyenkhanhCategory
view
214download
0
THE FATE OF SUGAR IN THE ANIMAL BODY.
VIII. THE INFLUENCE OF INSULIN ON THE UTILIZATION OF GLUCOSE, FRUCTOSE, AND DIHYDROXYACETONE.
BY CARL F. CORI AND GERTY T. CORI.
(From the Stute Institute for the Study of Malignant Disease, Buffalo.)
(Received for publication, December 27, 1927.)
OONTENTS.
I. Introduction.. . . . . . . . . . . . . . . . . . . . . . . . . . . , . . . . . . . . ,..... 755 II. Methods. . . . . . . . . . . . . . . . . . . . . . . . . . . . . . . . . . . . . . . . . . . . . ,..... 7.57
III. Experiments with glucose.. . . . . . . . . . . . . . . . . . . . . . . . . . 763 IV. Experiments with fructose.. . . . . _. . . . . . . . . . . . . . . . . . 767
V. Experiments with dihydroxyacetone.. _. . . . . . . . . . . . . . . 772 VI. Comparison of glucose, fructose, and dihydroxyacetone, . . 770
VII. Influence of insulin on heat production.. . . . . . . . 779 VIII. Discussion............................................ . . 782
IX. summary............................................. 792
I.
INTRODUCTION.
A balance for ingested glucose, with and without the administra- tion of insulin, has been reported in a preceding paper (1). These experiments were made on rats fasted previously for 48 hours. A series of recovery experiments with fructose was then under- taken, on both 48 and 24 hour fasting rats (2). The use of animals fasted the shorter period was made possible by the fact that their preformed glycogen showed only a small individual variability, which is a necessary supposition in a determination of glycogen formation. The rats fasted a shorter period absorbed decidedly more fructose than those fasted a longer time. Subsequently, the same result was found to be true for glucose. This made it desirable to repeat the recovery experiments with glucose on 24 hour fasting rats. There was the possibility that the shorter fsst- ing period had not only an influence on the rate of absorption, but
755
by guest on August 23, 2018
http://ww
w.jbc.org/
Dow
nloaded from
756 Insulin and Sugar Utilization
also on the metabolic effect produced by insulin. This assump- tion proved to be correct, as is shown in the present paper.
Insulin decreases glycogen storage in the liver, after glucose feeding. In 48 hour fasting rats the surplus of sugar thus made available is disposed of, mainly, by increased oxidation; while in 24 hour fasting rats it is disposed of, mainly, by increased deposition of muscle glycogen.
Fructose diRers from glucose in this respect. In previous ex- periments, insulin injections plus fructose feeding resulted in an increase in sugar oxidation, not only in 48 hour fasting, but also in 24 hour fasting rats. For the 48 hour series, glycogen deter- minations in the liver were available, which showed that insulin inhibits glycogen storage in this organ after fructose feeding. However, in the 24 hour series, glycogen formation in the liver and in the rest of the body had not been determined separately. An increased deposition of muscle glycogen under the influence of insulin might, therefore, have escaped attention. It was not expected that this increase would be very marked, on account of the strong increase in sugar oxidation, which would leave a smaller surplus of sugar for storage in the muscles. Nevertheless, this point seemed to merit further investigation in view of the fact that increased deposition of muscle glycogen is such a prominent fea- ture after the administration of glucose plus insulin to 24 hour fasting rats.
Another reason for repeating the fructose experiments on 24 hour fasting rats, with separate determination of glycogen storage in the liver and the rest of the body, was that a fructose of higher purity was available for use at this time.
The fate of ingested dihydroxyacetone, with and without the injection of insulin, has also been investigated. This triose has received much attention recently. One group of investigators holds that dihydroxyacetone is converted into glucose by the liver. In this case, the fate of dihydroxyacetone should be the same a.~. that of glucose. Another group of workers believes that this triose is a true intermediary of glucose catabolism and that it is utilized directly in both the normal and diabetic organ- ism. The latter assumption presupposes that insulin has its point of attack before the triose stage is reached. In this case, insulin should be without influence on the fate of dihydroxyacetone in the animal body.
by guest on August 23, 2018
http://ww
w.jbc.org/
Dow
nloaded from

C. F. Cori and G. T. Cori 757
Methods.
The aim of the present experiments was the same as in previous papers of this series; namely, to present a complete balance sheet for ingested sugar. For this purpose, the nitrogen excretion,sugar absorption and oxidation, and the glycogen formation in the liver and the rest of the body were determined on the same animal.
Male rats, reared in the laboratory on a standard diet,’ were used. There wss a surplus of food in the cages at all times. At noon, animals weighing 135 to 155 gm. were isolated and allowed to remain without food until the next day. The urine from the 4th to the 21st hour of fasting was collected quantitatively for nitrogen determinations. As a preservative, copper sulfate was added to the urine. After 21 hours of fasting, a metabolism fore period of 2 to 3 hours duration was made in a Haldane type of metabolism apparatus. Enough of the sugar under investigation was then fed by stomach tube to allow the absorption to proceed for 5 to 6 hours. There are two groups of experiments for each sugar. In one group the sugar was fed alone; in the second group insulin was injected immediately after the sugar feeding. The dose of insulin injected was 15 units per 100 gm. of body weight in the case of glucose, and 5 units in the case of fructose and dihy- droxyacetone. The sugar feeding was followed immediately by a second metabolism period of 4 hours. The animals were then killed and worked up in the usual manner for the determination of sugar absorption and of glycogen content in liver and the rest of the body. For this purpose, the intestinal tract was removed as quickly as possible and the remainder of the carcass frozen with CO, delivered from a tank in order to reduce postmortem glycogenolysis. The liver was then removed and kept frozen until it could be analyzed separately for its glycogen content; in the meantime the rest of the body was cut into small pieces before being introduced into the boiling 66 per cent KOH for determina- tion of its glycogen content.
1 This diet consisted of whole wheat, 50 per cent; ground yellow corn, 20 per cent; skimmed milk powder, 10 per cent; ground fish and oasein, 7 per cent each; and butter fat, 6 per cent.
by guest on August 23, 2018
http://ww
w.jbc.org/
Dow
nloaded from
Insulin and Sugar Utilization
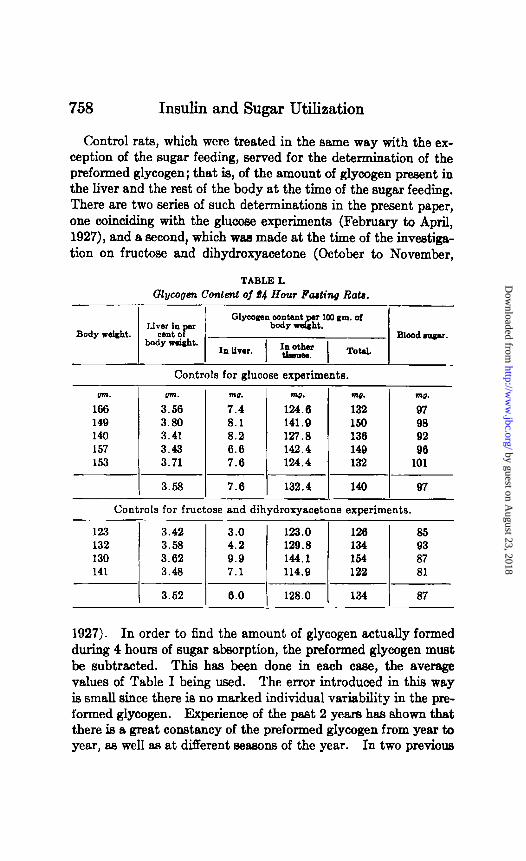
Control rats, which were treated in the same way with the ex- ception of the sugar feeding, served for the determination of the preformed glycogen; that is, of the amount of glycogen present in the liver and the rest of the body at the time of the sugar feeding. There are two series of such determinations in the present paper, one coinciding with the glucose experiments (February to April, 1927), and a second, which was made at the time of the inveatiga- tion on fructose and dihydroxyacetone (October to November,
TABLE L Qlycogen Content of 24 Hour Faaling Rats.
Glymgan content Ill0 mu. ot Liver in
p” body w&K
Body weight. cent 0 body weight.
Blood I-.
In llvor. I iT¶zbsr 1
T0t.d.
Controls for glucose experiments.
pm.
166 149 140 157 153
-
__
pm.
3.56 3.80 3.41 3.43 3.71
3.58
ml. ma.
124.6 132 8.1 141.9 150 8.2 127.8 130 6.6 142.4 149 7.0 124.4 132
7.6 132.4 140
ml.
97 98 92 80
101
87
Controls for fructose and dihydroxyacetone experiments.
123 3.42 132 3.58 130 3.62 141 3.48
3.52
3.0 123.0 126 85 4.2 129.8 134 93 9.9 144.1 164 87 7.1 114.D 122 81
6.0 1 128.0 1 134 87
1927). In order to find the amount of glycogen actually formed during 4 hours of sugar absorption, the preformed glycogen must be subtracted. This has been done in each case, the average values of Table I being used. The error introduced in this way is small since there is no marked individual variability in the pre- formed glycogen. Experience of the past 2 years has shown that there is a great constancy of the preformed glycogen from year to year, as well as at diBerent seasons of the year. In two previous
by guest on August 23, 2018
http://ww
w.jbc.org/
Dow
nloaded from
C. F. Cori and G. T. Cori
series on 24 hour fasting rats, averages of 0.150 and 0.141 per cent total glycogen have been found, as compared with 0.140 and 0.134 for the averages in Table I. It is of considerable interest that the preformed glycogen of 48 hour fasting rats is only slightly lower. In two different series values of 0.114 and 0.136 per cent have been obtained. The significance of this fact and its connec- tion with the problem of gluconeogenesis will be discussed in a later paper.
Calculations of the amount of sugar and fat oxidized have been made from the non-protcin R.Q. by the use of the Zuntz-Schum- burg-Lusk tables. In carrying out the metabolism determina- tion the temperature of the animal chamber was, as usual, kept between 28-29”. Temperature regulation offered no difficulty, since the whole metabolism outfit, including the analytical bal- ance, was set up in a room with automatic temperature regulation. In view of the insulin injections, special attention has been paid to muscular movements. Since the animal chamber is made of glass, the rats can be observed at all times. No difference was noted in the muscular activity of the rats receiving sugar alone and those receiving insulin in addition. This is ascribed to the fact that overdosage of insulin was avoided. During a metabolism period of 4 hours, muscular movements cannot be excluded altogether, but they are not a prominent feature with rats, since these animals are either asleep for most of the time or remain quiet when they are awake. As a rule, movements are confined to cleaning between periods of sleeping. The rats used were made tame and gentle by frequent handling. The absence of any fear reactions to ordinary procedures and the low degree of excitability make such animals especially suitable for work on carbohydrate metabolism. The sugar feeding, as practiced in this laboratory, does not cause any restlessness of the rats.
Previous metabolism work, including the glucose experiments of the present paper, has been made in a closed type of metabolism apparatus, which combines the Haldane principle with a direct O2 determination by means of a spirometer. This apparatus was constructed 2 years ago, in order to check the reliability of the Haldane method, and has been in continuous operation since that time. In over 200 metabolism experiments, the agreement be- tween the indirect 02 determination according to Haldane’s
by guest on August 23, 2018
http://ww
w.jbc.org/
Dow
nloaded from

760 Insulin and Sugar Utilization
method and the direct 0, determination was very satisfact.ory. Figures to this effect have been published in previous papers. The average difference between the two determinations of the pres- ent series was 1.2 f 0.7 per cent. These extensive control experi- ments have convinced us that the Haldane method is very reliable and accurate if it is properly executed and if the metabolism periods are of sufficient length. Therefore we felt that there was no need to continue work with the closed system which is very time-con- suming and rather cumbersome to handle. For this reason, the experiments with fructose and dihydroxyacetone have been made with the Haldane method plus the modifications described in our original paper (1). As an additional precaution a second soda-lime tower and sulfuric acid bottle have been added.
The dihydroxyacetone, as obtained from the Farbwerke vorm. Meister Lucius und Brtining, Hoe&&-am-Main, after drying over P,Oa, had a melting point of 75-76”. This agrees well with figures given in the literature (3). The substance was recrystallized from absolute alcohol and ether. To 10 gm. of the triose 30 cc. of absolute alcohol were added and, after cooling to 2”, 90 cc. of dry ether were added in small portions, The recrystallized prod- uct had a melting point of 80-Sl”, showing that probably a small amount of the polymeric form of the triose had been formed, which has a melting point of 155’. The product before and after recrystallization gave the same amount of reduction with Camp- bell’s molybdenum method (4). 1 cc. of 0.01 N KM&, was equiv- alent to 0.175 mg. of the t&se in both csses. However, with the Hagedorn and Jensen method and the Bertrand method the reduction increased after recrystallization. The reason for this change in reducing power has not been ascertained. AU metab- olism experiments were made with the non-recrystallized triose.
Dihydroxyacetone reduces the ferricyanide solution of Hagedorn and Jensen and the alkaline copper sulfate solution of Bertrand in the cold. The reduction is. not complete in either case, even on prolonged standing. In the case of the Bertrand solution the reduction in the cold reaches 92 per cent on 5 minutes standing as compared with the reduction after 3 minutes boiling. Standing up to 60 minutes in the cold did not increase the reduct.ion. It was hoped that reduction in the cold might be used as a basis for quantitative determination since this would allow separation from
by guest on August 23, 2018
http://ww
w.jbc.org/
Dow
nloaded from

C. F. Cori and G. T. Cori 761
glucose and other sugars. It was found, however, that filtrates from biological material contain substances which inhibit reduction in the cold. Due to varying degrees of inhibition, the results am very erratic. This was the case especially in filtrates from inks- tinal washings. For this reason reduction in the cold could not be used.
It was necessary to establish the copper equivalents of dihy- droxyacetone, since this sugar is not included in the Bertrand tables. To 20 cc. of the sugar solution, prepared from the unre- crystallized product, 20 cc. each of the two Bertrand solutions were added. The different samples were brought to the boiling point in the same length of time and the boiling was continued for exactly 3 minutes. The permanganate solution used for the
TABLE II.
Copper Equivalents of Dihydrozyavvtm (Bertrand Method).
mu. mu. 7 8.7
10 12.4 12 15.3 15 19.3 20 25.7 25 31.4
1.24
1.24
1.27 1.29 1.29 1.27
titration was standardized against C.P. glucose. Table II shows that between 7 and 25 mg., the reduction is proportional to the amount of triose present. The reduction beyond 25 mg. has not been investigated, but below 7 mg. the proportionality WBS less satiefactory.
Due to the great lability of dihydroxyacetone as compared with other sugars, the following control experiments have been per- formed in conjunction with the determination of absorption. Known amounts of the triose were added to the intestinal washings prior to the precipitation with colloidal iron. No loss occurred, which shows that the triose is not precipitated by the colloidal iron. The triose was added before extraction of the intestines with repeated portions of boiling water. This did not cause any loss of sugar.
by guest on August 23, 2018
http://ww
w.jbc.org/
Dow
nloaded from

762 Insulin and Sugar Utilization
In urine the triose was determined by both the Bertrand and the Campbell procedures. The agreement between the two methods was very good. This indicat.es that there was no glucose or other sugar excreted besides the triose, since glucose gives with the Campbell reagent only r&a of the reduction of dihydroxyace- tone, while glucose reduces the Bertrand solution nearly twice as much as an equivalent amount of triose. Normal rat urine gives a strong blank with the Campbell reagent. Due to the large amount of triose excreted by the rats, the urine was diluted ap- proximateIy 100 times, which obviated the use of a correction for the urine blank.
In blood the total sugar content was estimated by the Hagedorn and Jensen method (5), while the dihydroxyacetone was deter- mined by means of the Campbell titration method (4). With the former method 0.1 mg. of dihydroxyacetone corresponds to 0.134 mg. in terms of glucose. By subtracting the glucose equivalent of the triose from the total sugar content, the glucose content of the blood plus other reducing substances (the so called residual reduction) is found by difference. Normal rat blood, when analyzed by the Campbell method, was found to contain an aver- age of 12 mg. of reducing substances in terms of dihydroxyacetone. This blank was subtracted in all cases.
Fructose prepared from inulin, a C.P. product of the Pfanstiehl Company, was used for the present work. This sugar is of a high degree of purity and is only slightly colored when made up to 50 per cent solution. In previous experiments a C.P. fructose prepared from invert sugar was used. A 50 per cent solution of this sugar was highly colored which necessitated removal of the coloring matter with charcoal. It appeared later that different lots of that fructose were not absorbed by the rats at the same rate. Whether this was due to varying degrees of impurities present or to other factors inherent in the sugar, was unfortu- nately not established at that time. The same difficulty was en- countered with dihydroxyacetone. When the greater part of the experiments had been completed, a new sample had to be opened. The absorption was consistently lower with the new sample. The experiments (two each in the series with and without insulin) in which the new sample of dihydroxyacetone was employed, are indicated by a dagger in Table X
by guest on August 23, 2018
http://ww
w.jbc.org/
Dow
nloaded from
C. F. Cori and G. T. Cori 763
III.
Ezperimeds with Glucose.
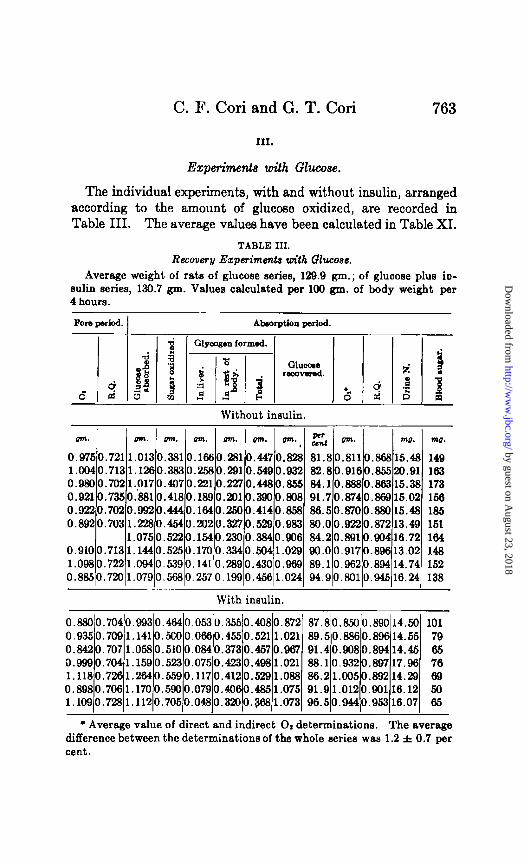
The individual experiments, with and without insulin, arranged according to the amount of glucose oxidized, are recorded in Table III. The average values have been calculated in Table XI.
TABLE III.
Recovery Ezperimmts with Glucose. Average weight of rats of glucose series, 129.9 gm.; of glucose plus io-
sulk series, 130.7 gm. Values calculated per 109 gm. of body weight per 4 hours.
Fore period. Akorption period.
a B
Glymgen formed. i
Without insulin.
m. m. m. a. ma. um. sm. g; m. mI7. mg.
0.9750.721 1.0130.3810.1660.2810.4470.828 81.80.8110.86815.48 149 1.0040.7131.1260.3830.2580.2910.5490.832 82.80.9160.85520.91 163 0.9890.7021.9170.4070.2210.2270.4480.855 84.10.8880.86315.38 173 0.9210.7350.8810.4180.1890.2010.3900.808 91.70.8740.86915.02 156 0.9220.7020.9920.4440.1640.2500.4140.858 86.50.8700.88015.48 185 0.8920.7031.2280.4540.2920.3270.5290.983 8O.OO.Q220.87213.49 161
1.0750.5220.1540.2300.3640.906 84.20.8QlO.QO4.16.72 164 0.9100.7131.1440.5250.1700.3340.5041.029 90.00.9170.89613.02 148 1.0980.7221.0940.5390.1410.2690.4390.989 89.10.9620.89414.74 162 0.8850.7201.0790.5680.2570.1990.4561.024 94.90.8010.94516.24 138
With insulin.
* Average value of direct and indirect 0, determinations. The average difference between the determinations of the whole series was 1.2 f 0.7 per cent.
by guest on August 23, 2018
http://ww
w.jbc.org/
Dow
nloaded from

764 Insulin and Sugar Utilization
There is a close agreement in the average O2 consumption and the R.Q. of the fore period of the two groups of rats. After a 24 hour fast, the R.Q. of the rat stands at the fat-protein level, while oxi- dation of preexisting carbohydrate reserves is absent. This agrees well with the observation, recorded in a previous section, that the total glycogen content of the rat undergoes only a slight dimi- nution between the 24th and 48th hour of fasting.
On an average, the animals receiving insulin absorbed 5.9 per cent more glucose than the rats without injections. In 24 hour fasting rats insulin seems to accelerate to a slight extent the rate of intestinal absorption since the same observation has also been made with dihydroxyacetone. The average amount of absorbed glucose accounted for was 86.5 per cent for the control and 90.2 per cent for the insulinized rats. This agrees well with the re- covery obtained on 48 hour fasting rats. If insulin would lead to the formation of some unknown intermediary substance, as Mac- leod is still inclined to believe, the recovery of absorbed glucose should be lower in the insulin experiments; this is, however, not the case. It will be investigated in the near future, whether or not the loss of 10 to 14 per cent of absorbed glucose is of any signifi- cance from the standpoint of metabolism, or is merely due to errors of methods used and a possible slight inaccuracy of the Zuntz-Schumburg formula. Recovery experiments extending over longer periods should give a satisfactory answer to this question.
The total amount of glycogen formed is practically the same in the two groups of rats, while glucose oxidation is 18.3 per cent higher in the insulinized group. However, these two factors do not fully reveal the changes in the disposal of sugar for which insulin is responsible. In order to appreciate the true nature of insulin action, glycogen formation in the liver and the rest of the body has to be compared in the two groups of rats. This is shown in Table XI. It will be noted that insulin suppresses glycogen formation in the liver, while it increases glycogen depo- sition in the rest of the body.
It is of interest to compare the utilization of glucose in 24 and 48 hour fasting rats. The disposal of ingested glucose in 24 hour fasting (non-insulin&d) rats differs in two respects from that of 43 hour fasting rats. In the first place, the rate of intestinal absorption is much greater in the former group; namely, 1.065 gm.
by guest on August 23, 2018
http://ww
w.jbc.org/
Dow
nloaded from

C. F. Cori and G. T. Cori 765
of glucose per 100 gm. of body weight per 4 hours, as against 0.750 gm. for the animals fasted the longer period. On account of the larger amount of glucose absorbed, both oxidation and glycogen formation are higher in animals fasted previously for a shorter period. The average values per 100 gm. of body weight per 4 hours are: 465 mg. oxidized and 455 mg. deposited as gly- cogen for the 24 hour fasting rats (Table XI), and 281 mg. oxidized and 388 mg. converted into glycogen for the 48 hour fasting rats (1). Secondly, for an equal percentage of absorbed glucose ac-
counted for by these two processes, the quotient glycogen formed glucose oxidized
is 1.00 for the former and 1.38 for the latter animals. It means that the 24 hour fasting rats oxidize relatively more glucose and deposit relatively less glycogen. This becomes evident if one
TABLE IV.
Sugar Ozidalion and Glycogen Formation Calculated in Parts per 100 Parts of Absorbed Qlucose.
Oxidized. “&Pgoy Deposited
aa body IIlYWP. glycogen.
48 hr. fasting... . . . . . . . . . . . . . . . . . 38 16 36 24 “ “ . . . . . . . . . . . . . . . . . . . . . . . 44 18 25 Difference............................... +6 +2 -11
calculates the respective values per JO0 parts of absorbed glucose, as is shown in Table IV. The chief difference is in the relative rate of sugar oxidation and glycogen deposition in the muscles, while there is no marked change in the relative amount of glycogen formed in the liver. It is of interest that longer fasting has a depressing effect on sugar oxidation and that this is counter- balanced by increased glycogen deposition in the muscles. Prob- ably for this reason insulin stimulates chiefly oxidation in 48 hour fasting rats.
The response to insulin of the 24 hour fasting rat differs only quantitatively from that of the 48 hour fasting rat. Due to the greater rate of absorption, the absolute values for glucose oxida- tion and glycogen formation are higher in the former animals; namely, 550 mg. oxidized and 467 mg. deposited as glycogen (Table XI) against 378 mg. oxidized and 324 mg. converted into
by guest on August 23, 2018
http://ww
w.jbc.org/
Dow
nloaded from

766 Insulin and Sugar Utilization
glycogen for the 48 hour fasting rata (1). However, the relative amounts of glucose oxidized and glycogen formed, remain the same
in both csses, as is evidenced by the quotients glycogen formed glucose oxidized
of 0.86 and 0.85 respectively (see Table V). It will be noted that the difference in the disposal of glucose between 24 and 48 hour fasting rats disappears when insulin is injected. How this is brought about is shown in Table VI by a rearrangement of Tables IV and V.
TABLB V.
Sugar Ozidation and Glycogen Formation Calculated in Parte per 100 Park of Absorbed Ghcoee.
48 hr. fading plus insulin.. . . . . . . . . . . . . . 50 24 “ “ “ “ . . . . . . . . . . 49 Difference............................... -1
4 38 38
+: -2
TABLE VI.
Sugar Oxidation and Glycogen Formation Calculated in Parts per 100 Parta of Absorbed Glucoee.
48 hr. fasting without ineulin ............. 48 1, “ with insulin .................. Difference ...............................
24 hr. fasting without insulin ............ 24 II L‘ with insulin .................. Difference ...............................
38 16 50 4
+12 -12
44 18 49 6
+5 -12
30 38
+2
25 30
+11
In 48 hour fasting rats, insulin increases sugar oxidation to the same extent as it decreases glycogen formation in the liver. That is $0 say, the 12 parts of absorbed glucose which are oxidized in excess correspond to the 12 parta which fail to be deposited as liver glycogen. There is no need to assume that the lessened deposition of liver glycogen is due to the release of epinephrine, since the same effect is observed on adrenalectomized rata receiv- ing glucose plus insulin (6). On the other hand, there is no marked change in glycogen deposition in the muscles, though there is evidence that the increased sugar oxidation occurs chiefly in them.
by guest on August 23, 2018
http://ww
w.jbc.org/
Dow
nloaded from

C. F. Cori and G. T. Cori 767
As has been pointed out in a previous paper, this has been difficult to reconcile with the view of Bissinger and Lesser (7) that sugar oxidation and glycogen formation in the muscle is a coupled reac- tion and that it is accelerated by insulin. However, in 24 hour fasting rats, an increased deposition of muscle glycogen takes place following insulin injections. Here the 12 parts of absorbed glucose, that fail to be deposited in the liver of the insulinized rats, are not entirely accounted for by increased oxidation, as is the case in 48 hour fasting rats. It will be noted that only 5 parts of the absorbed glucose are oxidized in excess, the remaining parts being accounted for by increased glycogen deposition in the rest of the body (chiefly muscles).
A surplus of insulin is therefore seen to promote both oxidation and storage of sugar in glucose-fed rats and it depends on the relative rates of these two processes in the non-insulinized animal as to which of the two will be influenced most when insulin is in- jected. In 48 hour fasting rats, in which glucose oxidation is relatively low and glycogen formation in the muscles relatively high, insulin is seen to influence mainly the former process. In 24 hour fasting rats, where the conditions are reversed, that is where glucose oxidation is perhaps close to its maximum rate, while glycogen deposition in the muscles is relatively low, insulin accelerates mainly the latter process. Insulin may also promote glycogen storage in the liver, but this cannot be readily demon- strated experimentally in the normal animal because the injection of even a small dose creates an excess of insulin in the body; and this leads to a shift in the disposal of sugar from the liver to the muscles, with the result that less sugar is available for glycogen deposition in the liver. In order to demonstrate glycogen syn- thesis in the liver under the influence of insulin, one has to choose different experimental conditions. Thus it has been shown by one of the authors that insulin injections lead to an accumulation of liver glycogen in fasting depancreatized cats and dogs (8).
IV.
Experiments with Fructose.
The present experiments with this sugar (Table VII) confirm the results obtained in a previous paper (2), though the absolute values differ to a slight extent because absorption was 10.3 per
by guest on August 23, 2018
http://ww
w.jbc.org/
Dow
nloaded from

768 Insulin and Sugar Utilization
cent higher in the former series. In contrast to glucose and dihy- droxyacetone, insulin causes a marked increase in fructose oxidation in 24 hour fasting rats. The average values recorded in Table XI show a difference in fructose oxidation between the control and the insulinized group of 93.2 per cent, while the differ- ence for glucose and dihydroxyacetone is only 18.3 and 8.7 per cent respectively. In previous experiments the difference in fructose
TABLE VII.
Recovery Ezperimenta with Fructose. Average weight. of rats of fructose series, 132.4 gm.; of fructose plus
insulin series, 135.2 gm. Values calculated per 100 gm. of body weight per 4 hours.
Fore period. Abaorptfon period.
Clycogen formed.
Without insulin.
With insulin.
oxidation was 79 per cent in favor of the insulinized rats. How- ever, glycogen formation in the liver and in the body had not been determined separately. An influence of insulin on glycogen stor- age in the muscles could, therefore, not be detected. The present experiments reveal that there is also an increased deposition of muscle glycogen when fructose is fed to insulinized rats. Table XI indicates how profoundly insulin affects the distribution of fructose between liver and muscles.
by guest on August 23, 2018
http://ww
w.jbc.org/
Dow
nloaded from
C. F. Cori and G. T. Cori 769
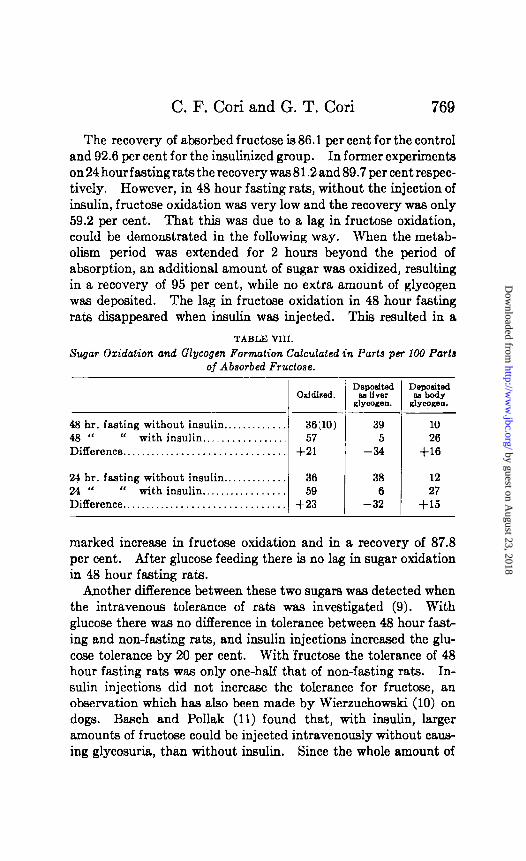
The recovery of absorbed fructose is 86.1 per cent for the control and 92.6 per cent for the insulinized group. In former experiments on24hourfastingratstherecoverywas81.2and89.7percentrespec- tively. However, in 48 hour fasting rats, without the injection of insulin, fructose oxidation was very low and the recovery was only 59.2 per cent. That this was due to a lag in fructose oxidation, could be demonstrated in the following way. When the metab- olism period was extended for 2 hours beyond the period of absorption, an additional amount of sugar was oxidized, resulting in a recovery of 95 per cent, while no extra amount of glycogen was deposited. The lag in fructose oxidation in 48 hour fasting rats disappeared when insulin was injected. This resulted in a
TABLE VIII.
Sugar Oxidation and Glycogen Formation Calculated in Parts per 100 Parts of Absorbed Fructose.
48 hr. fasting without insulin.. ........... 36;lO) 48 “ ‘( with insulin ................. 57 Difference ................................ +21
24 hr. fasting without insulin ............. 36 24 “ “ with insulin ................. 59 Difference ................................ +23
39 5
-34
38 6
-32
10
+::
12 27
+15
marked increase in fructose oxidation and in a recovery of 87.8 per cent. After glucose feeding there is no lag in sugar oxidation in 48 hour fasting rats.
Another difference between these two sugars was detected when the intravenous tolerance of rats was investigated (9). With glucose there was no difference in tolerance between 48 hour fast- ing and non-fasting rats, and insulin injections increased the glu- cose tolerance by 20 per cent. With fructose the tolerance of 48 hour fasting rats was only one-half that of non-fasting rats. In- sulin injections did not increase the tolerance for fructose, an observation which has also been made by Wierzuchowski (10) on dogs. Bssch and Pollak (11) found that, with insulin, larger amounts of fructose could be injected intravenously without caus- ing glycosuria, than without insulin. Since the whole amount of
by guest on August 23, 2018
http://ww
w.jbc.org/
Dow
nloaded from

770 Insulin and Sugar Utilization
fructose was injected within a few minutes, the experimental pro- cedure is not comparable to an intravenous infusion at a constant rate. This may account for the different results obtained.
As in the case of glucose, longer fasting reduces the rate of absorption of fructose. Since 48 and 24 hour fasting rats do not absorb the same amount of fructose, a comparison must be made on the basis of 100 parts of absorbed sugar (see Table VIII). The values for the 48 hour fasting rats have been calculated from a previous paper (2). Since there is a lag in fructose oxidation in 48 hour fasting rats, two values are recorded. The value in parentheses corresponds to what is actually observed in a 4 hour absorption period; the second value has been calculated from the experiments in which the lag was compensated by extending the metabolism period beyond the period of absorption. It will be noted that the disposal of absorbed fructose is the same in 43 and 24 hour fasting rats, in spite of the fact that the rate of absorption is different in the two csses. Furthermore, when insulii is injected, the same type of changes are produced in the two groups of rats. There is an increase in glycogen deposi- tion in t.he muscles and a still greater increase in sugar oxidation. 7%~ leaves almost no sugar for glycogen deposition in the liver, so that 33 parts of absorbed fructose fail to appear as liver glycogen.
The importance of the liver for the disposal of fructose as com- pared with other sugars, is shown by the following figures. Per 100 parts of absorbed sugar, 38 parts of liver glycogen are formed from fructose, but only 18 parts from glucose, and 21 parts from dihydroxyacetone.
In a determination of the intravenous tolerance of fructose, the low kidney threshold for this sugar must be taken into considera- tion. This is illustrated by the following experiments. In non- fasting rats the tolerance for fructose is 4 times lower than for glucose. However, when glucose or fructose is infused markedly above the tolerance rate (4.5 gm. per kilo in each case), a proce- dure which makes the difference in the kidney threshold less significant, there is no marked difference in the rate of utilization of these two sugars (9).
The reduced intravenous fructose tolerance of 48 hour fasting rats as compared with non-fasting rats is ascribed to the lag in
by guest on August 23, 2018
http://ww
w.jbc.org/
Dow
nloaded from

C. F. Cori and G. T. Cori 771
sugar oxidation which occurs in the former animals. Reinhold and Karr (12) found recently that a 4 day fasting period reduces the fructose tolerance of rabbits very markedly. There is no indi- cation that glycogen formation in the liver or in the muscles is affected by longer fasting. During fructose absorption liver and body glycogen were formed at the same relative rate in 48 and 24 hour fasting rats, as Table VIII has shown. During intra- venous infusion into a peripheral vein, the fructose passes directly into the general circulation and is carried past the kidneys before it reaches the liver. This is an additional factor which tends to lower the tolerance, because the liver is of special importance for the removal of fructose from the blood stream. That this is actually so has been demonstrated in the following way. When intestinal absorption was imitated by infusing fructose into a mesenteric vein, the intravenous tolerance of 48 hour fasting rats was doubled. The fructose tolerance of non-fasting rats (for an infusion into a peripheral vein) is higher than that of 48 hour fasting rats, because no lag occuw in sugar oxidation. The factors discussed above do not apply to glucose, because the kidney threshold for this sugar is high and because glucose oxidation in the rat is not reduced by fasting.
Since insulin accelerates the disposal of fructose in the peripheral tissues, one should expect an increase in intravenous fructose tolerance when insulin is injected. This is, however, not the case. The tolerance is a measure of the maximum capacity of the tissues to withdraw sugar. In the case of fructose, the withdrawal has to be very rapid, in order to avoid glyccsuria, because the kidney threshold for this sugar is very low. During fructose absorption, insulin accelerates both sugar oxidation and glycogen formation in the muscles, but this does not lead to the disappearance of more sugar, because the same amount of sugar is absorbed by the non- insulinized and insulinized animals; it merely results in a corre- sponding decrease in glycogen formation in the liver. This shift of sugar from the liver to the peripheral tissues involves 33 per cent of the absorbed sugar in the case of fructose, but only 16 per cent in the case of glucose. Consequently, the peripheral tissues have a smaller range for the disposal of an additional amount of fructose than of glucose. This might be one of the reasons why insulin increases the intravenous tolerance for glucose but not for
by guest on August 23, 2018
http://ww
w.jbc.org/
Dow
nloaded from

772 Insulin and Sugar Utilization
fructose. Insulin does not reduce the dihydroxyacetone content of the blood of rats. It is not known whether the same is true for fructose.
TABLE IX.
Amount of Dihydroxyacetone Ezcreted during 4 Hours of Absorption. The urine values have been calculated per 100 gm. of body weight per
4 hours.
Body weight. Total blood mlgar.
m. 130 134 135 162 161 162
Without insulin.
nu7. 112 157
106 116 111
120
mu. 28.0
9.8
4.0 8.8 9.3
11.6
With insulin.
mu. mu. 93 15.6
150 44.3
103 27.0 109 23.3 104 28.9
112 27.8
130 109 46.5 74 40.8 136 162 16.9 149 57.0 140 152 70.2 100 64.9 127 130 7.6 124 36.3 161 58 6.2 53 39.9
122 29.6 100 45.8
l Total blood sugar minus dihydroxyacetone in terms of glucose.
V.
Experiments with Dihydrozyacetone.
1. Dihydroxyacetone Conten.! of Blood and Urine.-The rate of absorption of the triose is intermediate between that of glucose and that of fructose. In contrast to glucose and fructose, glycosuria occurs when the triose is fed to rats. The sugar appearing in the urine is dihydroxyacetone. No evidence has been obtained that glucose is excreted in addition to the triose (see under “Methods”).
The amount excreted per 100 gm. of body weight per 4 hours has been determined in a separate series of experiments (Table
by guest on August 23, 2018
http://ww
w.jbc.org/
Dow
nloaded from

TABL
E X.
Rm
ary
Ezpe
riman
ts
with
Di
hydr
ozya
wton
e.
Aver
age
weigh
t of
rat
e of
trio
m
eerie
a,
135.
6 gm
.; of
trio
sa
plus
in
sulin
ee
riea,
13
6.6
gm.
Vslu
ee
calcu
late
d pe
r 10
0 gm
. of
bo
dy
weigh
t pe
r 4
hour
s.
F0m
M.
Abm
orpt
ion
perio
d.
01
1 RQ
. ;&
%.I
2%.
/ In
u~‘i~
~dsw
. )
T~ra
ovd.
)
OS
) RQ
. /m
-N.
lT$$
j T$
$’
With
out
insu
lin.
~
om.
m.
o.zl
0.72
6 0.
584t
0.
315
0%3
b.&
0.23
0.
23
Pera
* gm
. no
. w.
w.
c)
89.4
0.
847
0.83
5 14
.06
199
15
8.
0.88
0 0.
723
0.78
6 0.
330
0.16
4 0.
147
0.31
1 0.
641
81.6
0.
871
0.83
8 14
.53
163
36
0.86
0 0.
735
0.6l
Ot
0.35
5 0.
135
0.06
9 0.
204
0.55
9 91
.4
0.79
2 0.
859
11.9
7 E
0.89
9 0.
726
0.73
8 0.
371
0.17
3 0.
077
0.25
0 0.
621
84.2
0.
866
0.85
1 12
.01
0.92
0 0.
719
0.73
9 0.
385
0.12
9 0.
115
0.24
4 0.
629
85.1
0.
889
0.85
5 14
.39
144
2 :
0.86
4 0.
712
0.70
4 0.
388
0.12
9 0.
112
0.24
1 0.
629
a9.3
0.
817
0.87
0 15
.43
154
6
0.88
5 0.
711
0.59
ot
0.86
9 0.
732
0.80
1 0.
923
0.71
3 0.
803
0.94
3 0.
709
0.69
5t
0.04
4 0.
724
0.72
3 0.
919
0.72
1 0.
817
0.33
1 0.
025
0.36
7 0.
044
0.38
3 0.
014
0.38
5 0.
027
0.40
5 :0
.003
0.
457
0.00
5
0.19
5 0.
262
0.27
1 0.
246
0.24
2 0.
243
With
in
sulin
. - 0.
2#)
0.30
8 0.
285
0.27
3 0.
239
0.24
8
0.55
1 93
.3
0.88
2 0.
838
15.6
7 0.
673
84.0
0.
980
0.83
5 14
.43
0.66
8 83
.2
0.94
5 0.
845
-14.
39
0.65
8 64
.7
0.60
2 0.
854
15.8
8 0.
624
89.1
0.
903
0.85
8 13
.26
0.70
5 86
.3
0.93
0 0.
874
13.9
9
l To
tal
blood
su
gar
min
us
dihy
$rox
yace
tone
in
ter
ma
of g
luco
ee.
-t O
ther
sa
mpl
e of
dih
ydro
xyac
eton
e.
138 74
96
99
6 3.
14
34
37
65
by guest on August 23, 2018
http://ww
w.jbc.org/
Dow
nloaded from

774 Insulin and Sugar Utilization
IX). Insulin injections did not abolish the excretion. On the contrary, the insulinized rats eliminated an average of 46 mg., while the control rats excreted only 28 mg. This difference in excretion is also reflected in the t&se content of the blood which was, as an average, 29.5 mg. per cent for the insulinized rats and 11.6 mg. per cent for the control rats. It is peculiar that the triose content of blood shows such a wide fluctuation; namely, from 6.2 to 70.2 mg. in the insulin&d rats, and from 4.0 to 26 mg. in the control rats. This would seem to make the average values of little significance. However, a similar difference has been ob- served in the metabolism rats, the average- triose content of the blood being 37.3 mg. per cent for the insulinized and 14.9 mg. per cent for the control rats (Table X). The true blood sugar (e.g. total blood sugar minus dihydroxyacetone in terms of glu- cose) was 112 mg. per cent for the control and 199 mg. per cent for the insulinized rats (Table IX). The respective values for the metabolism rats were 146 and 102 mg. per cent. In spite of the large dose of insulin injected, which produced marked meta- bolic changes, an actual hypoglycemia was missing. The same dose of insulin produced marked hypoglycemia during fructose absorption. The true blood sugar (glucose plus residual reduction) is slightly increased during dihydroxyacetone absorption in the non-insulin&d rats. There are several points in connection with the dihydroxyacetone content of the blood and the influence of insulin thereon, which need further elucidation, but this was beyond the scope of the present paper.
It was not possible to determine the amount of triose excreted by the metabolism rats, because complete urine samples could not be obtained in all cases. On account of the sugar excretion, diuresis wss larger than during glucose or fructose absorption, and some of the rats voided during the metabolism period. It wss observed that the rata licked up the urine and it was necessary to increase the air current in order to dry the chamber. Complete absorption of CO, and water was ascertained for these conditions. Only such metabolism experiments are here reported in which the animal chamber was dry at the end of the period. The urine contained in the bladder was added to the intestinal washings. Since the amount of sugar absorbed is represented by the differ- ence between the amount fed and the amount recovered from the intestine, the average absorption values for dihydroxyacetone,
by guest on August 23, 2018
http://ww
w.jbc.org/
Dow
nloaded from

C. F. Cm-i and G. T. Cori 775
recorded ih Table XI, are slightly too low. They can be cor- rected by means of the average values of Table IX, by the addi- tion of 29.0 mg. to the value for the control and of 46 mg. to that of the i.nAinkd rats. Obviously, it is irrelevant for the calcu- lation of the recovery of the absorbed sugar whether or not the triose excretion in the urine is determined separately.
TABLE XI.
Averages Calculatd from Tables 111, VZZ, and X. All valuea per 100 gm. of body weight per 4 houre.
-- -- Fore period.
01, gm.. ........................ 0.954 0.969 0.962 0.w R.Q ............................. 0.7l5 0.712 0.714 0.71: Totalcaloriee.. ................ 3.09 3.15 3.13 3.10
Sugar absorption period. Sugar abeorbed, gm.. ........... 1.055 1.123 0.542 0.53!
‘* oxidized, gm.. .............. 0.455 0.550 0.198 0.3% Clycogen formed in liver, gm ... 0.192 0.075 0.200 0.031
“ u 1, rest of body, gm.. ................... 0.263 0.392 0.005 0.14
Total glycogen, gm ............. 0.455 0.467 0.271 0.17! Sugar recovered, gm ............ 0.919 1.017 0.467 0.4Q!
“ “ per cent ........ 85.5 90.2 80.1 82.6 “ lost, gm .................. 0.145 0.111 0.075 0.03!
Glycogen formed Sugar oxidked
............... 1.00 0.86 1.38 0.58
Blood sugar, mg ................ 158 72 138 72 OI,~...................... ..... 0.885 0.934 0.878 0.961 a.0 ............................. 0.884 0.903 0.787 0.82 Urine N, mg.. .................. 15.55 15.42 11.85 11.77 Non-protein OS, gm ............. 0.752 0.803 0.777 0.85
.. E.Q.. ............... 0.m 0.921 0.785 0.82 Proteinoxidised, gm.. .......... O.OQ5 O.OQ5 0.073 0.071 Fat oxidised, gm.. .............. 0.090 0.076 0.198 0.18 Calorie6 from proteint .......... 0.39 0.38 0.30 0.29
‘4 “ fatj.. ............. 0.85 0.71 1.87 1.70 “ “ augar~. ............ 1.74 2.06 0.73 1.20
Totaloalories.. ................ 2.98 3.15 2.90 3.19
l Total blood sugar. t Heat from protein (urine N X 24.98 calories). 1 Heat value for animal fat 9.4 oalories. 0 Heat value for sugar 3.74 calories.
0.8X 0.724 2.89
0.694 0.357 0.142
O.lOc 0.24 O.iKU 98.7 0.094
0.68
140+ 0.M 0.861
13.74 0.7x 0.8lU O.O& O.lZ 0.34 1.15 1.34 2.83
D.897 0.718 2.90
cl.738 0.388 0.019
0.243 0.252 0.650 8.3 0.088
0.68
121* 0.924 0.850 4.58 0.799 0.859 0.089 0.134 0.30 1.27 1.45 3.08
by guest on August 23, 2018
http://ww
w.jbc.org/
Dow
nloaded from

776 Insulin md Sugar Utilization
2. Metabolism Ezperimenta .-The individual experiments with dihydroxyacetone, recorded in Table X, need no special discussion. Four experiments (two without and two with insulin) marked with a dagger in Table X Were made with a Werent sample of dihydroxyacetone. This hss already been referred to under “Methods.” The average values in Table XI show a close agree- ment in 01 consumption and R.Q. of the fore period, which indi- cates that animals of a uniform character have been used for the two groups of experiments. On an average, the insulinized rats absorbed 6.3 per cent more dihydroxyacetone than the control rats. The recovery of the absorbed triose was 88.3 per cent for the insulinized and 86.7 per cent for the control group. This agrees well with the values obtained for glucose and fructose.
The average non-protein R.Q. of the sugar absorption period is the same in the two groups of rats. In comparison to the fore period the 01 consumption shows a slight fall in the non-insulinized group and a slight rise in the insulin&d group, the difference in sugar oxidation amounting to 8.7 per cent in favor of the latter group. A determination of the respiratory metabolism alone might have led to the erroneous conclusion that insulin has no effect on the disposal of dihydroxyacetone. The same fallacy would have been met with if only the total glycogen formation of the rata had been determined, which is within 7 per cent the ssme in the two groups. As in the case of glucose and fructose, the effect of insulin lies in the distribution of absorbed sugar between the liver and the rest of the body. Under conditions of intestinal absorption, insulin cannot lead to the disappearance of larger amounts of sugar, since the amount of sugar available to the tCo group is practically the same. The shift in the dispcsal of dihy- droxyacetone from the liver into the muscles, ss the result of insulin injections, is shown in nble XII, where the respective values have been calculated per 100 parts of absorbed sugar.
VI.
Comparison of Glucose, Fructose, and Dihydroylacetona.
The ratio in the rate of absorption of these three sugars in 24 hour fasting rats, is of the order 100 :51:65. In 48 hour fasting rats, the ratio between glucose and fructose is of the order 100:43.
by guest on August 23, 2018
http://ww
w.jbc.org/
Dow
nloaded from

C. F. Cori and G. T. Cori 777
Since each sugar is absorbed at a different rate, a factor which has either been disregarded or minimized in previous experiments on men and animals, a comparison must be made for an equal amount of absorbed sugar. For absolute values, Table XI has to be consulted. It would, indeed, be misleading to compare the total amount of glucose and dihydroxyacetone oxidized in 4 hours, which is 0.465 and 0.357 gm., and to conclude from this that glu- cose is more easily oxidized in the animal body than the triose. Such a comparison gains an entirely different meaning, if it is based on 100 parts of absorbed sugar. The same applies to glyco- gen formation in the liver and the rest of the body.
In Table XIII, all values are based on 100 parts of absorbed sugar and are, therefore, expressed in per cent.
Each sugar has its own characteristic utilization in the animal body. This utilization is determined by the percentage of
TABLE XII.
Sugar Oxidation and Glycogen Formation Calculated in Park pet 100 Parts of Absorbed Dihydroxyacelone.
chidised. Deposited no Depdted IU liver glycogen. body glycogen.
Without insulin.. . . . . . . . . . . . . . . . . . . 51 21 15 With insulin.. . . . . . . . . . . . . . . . . . . . . . 53 2 33 Difference.. . . . . . . . . . . . . . . . . . . . . . . . i-2 -19 +I’3
absorbed sugar which is oxidized, deposited as liver glycogen, and deposited as body glycogen. These three processes are interde- pendent. An increase in one process necessarily means a decrease in one or two of the others. It is important to know which of the three processes is the determining factor in each case. With dihydroxyacetone, the larger percentage of sugar oxidation may leave less sugar for glycogen deposition in the muscles, but the opposite may also be true. With fructose, either increased glyco- gen formation in the liver or decreased glycogen formation in the body may be the determining factor for the characteristic utiliza- tion. As long as this is not definitely known, it is perhaps best to refrain from saying that one sugar is more easily oxidized in the body than another or that one sugar is a better glycogen former than another. The statement often occurs in the litera-
by guest on August 23, 2018
http://ww
w.jbc.org/
Dow
nloaded from

778 Insulin and Sugar Utilization
ture that one sugar is more easily oxidized and is a better glyco- gen former at the same time. This is obviously an impossibility.
The different rate of absorption of each sugar is not the deter- mining factor for the different utilization. When the same sugar is absorbed at different rates, as for instance, glucose or fructose in 48 and 24 hour fasting rats, the utilization remains unchanged in the case of fructose and is not materially affected in the case of glucose. Though the rates of absorption of fructose and dihy-
TABLE XIII.
Percentage of Sugar Oxidation and Glycogen Formation per 100 Porte of Absorbed Sugar.
P-m w-d P-ml
Oxidation. Normal rats.. . . . . . . . . . . . . . . . . . . . 44 36 51 Insulinited rats.. . . . . . . . . . . . . . . . . 48 69 53
Glycogen formation in liver. Normal rats.. . . . . . . . . . . . . . . . . . . . 18 38 21 Insulinized rats.. . . . . . . . . . . . . . . . . 6 6 2
Glycogen formation in body. Normal rats..................... 25 12 15 In&inked rats.. . . . . . . . . . . . . . 36 27 33
Oxidation plus glycogen formation in body weruua glycogen formation in liver.
Normal rats,body .................. 69 48 60 6‘ “ liver ................... 18 38 21
Ineulinieed rats, body .............. 85 86 86 .‘ “ liver .............. 6 6 2
droxyacetone are not so widely different (22 per cent), the two sugars are utilized in an entirely different way.
The different disposal of each sugar is not in harmony with the conception that fructose and dihydroxyacetone are converted into glucose by the liver before they are utilized by the tissues. If such a conversion would take place to any large extent in the normal organism (in contrast to the diabetic organism), the same percentage of the three sugars should be oxidized, converted into liver glycogen, and into body glycogen. Mann (13) has shown
by guest on August 23, 2018
http://ww
w.jbc.org/
Dow
nloaded from

C. F. Cori and G. T. Cori 779
recently that fructose forms muscle glycogen in hepatectomized dogs, and this supports the idea that fructose is utilized directly by the tissues.
The utilization of absorbed sugar in the body is powerfully influenced by the two hormones, insulin and epinephrine. The characteristic change brought about by an excess of insulin is an increased disposal of t,he sugars in the peripheral tissues, paid for by a decreased deposition of glycogen in the liver. The diminished glycogen store in the liver is common to all three sugars, but in the peripheral tissues the disposal of the surplus sugar is ditrerent in each case; with glucose and dihydroxyacetone, it is mainly increased deposition of muscle glycogen; with fructose, it is, to a large extent, oxidation.
This raises the important question whether there is an ephemeral glycogen deposition in the liver during insulin action. If this occurs the surplus of sugar available to the peripheral tissues is glucose in each case and not fructose or dihydroxyacetone. In- sulin would then cause a conversion of fructose and dihydroxyace- tone into glucose in an indirect way. If no ephemeral glycogen deposition occurs in the liver, an excess of insulin would inhibit glycogen formation in this organ. This question must be left open until experiments have been performed to test the two possi- bilities.
An excess of epinephrine has the opposite effect on the distribu- tion of sugar in the animal body. It diminishes the disposal of absorbed sugar in the peripheral tissues and leads to an increased glycogen deposition in the liver (14). This will be discussed in a later paper.
VII.
Influence of Insulin on Heat Pro&don.
Before discussing the influence of insulin on heat production, the effect of sugar feeding alone must be examined. The average Oa consumption, R.Q., and calorie production of 24 hour fasting rats is shown in Table XI. In each of the six groups of rats the R.Q. of the fore period indicated that sugar derived from glycogen stores was not being oxidized. The average calorie output of the first four groups of rats is 3.09, 3.15, 3.13, and 3.10 per 100 gm. of
by guest on August 23, 2018
http://ww
w.jbc.org/
Dow
nloaded from

Insulin and Sugar Utilization
body weight per 4 houn, which is a good agreement, since the maximum difference is only 1.9 per cent. In former experiments on 24 hour fasting rats the average calorie output of eleven animals was 3.01 (2). Groups 5 and 6 of the present series show somewhat lower calorie output, namely 2.89 and 2.90.
When sugar is fed to 24 hour fasting rats, the metabolism is shifted from a combustion of oxygen-poor fat to that of oxygen- rich carbohydrates and this shift is accompanied by a fall in 0, consumption and a slight decrease in heat production. After glucose feeding the heat production diminished 3.5, after fructose 7.3, and after dihydroxyacetone 0.2 per cent,. In previous experi- ments with fructose the calories diminished 5 per cent (2). The lower heat production in the sugar absorption period as compnred with the fore period may be due in part to the effect of caging. Presumably, a specific dynamic action of carbohydrates is not observed in rats fasted previously for 24 hours, because the animals st,art with an R.Q. of 0.71 and because the glycogen stores are low. Consequently, a condition of carbohydrate plethora (Lusk (15)) is not established until the glycogen stores have been replenished. This is supported by recent observations made in this laboratory, which show that a specific dynamic action is observed in 24 hour fasting rats when the glucose absorption has proceeded for 5 to 6 hours, at which time the R.Q. approaches unity. In the first 4 hours, equal parts of absorbed glucose are oxidized and stored as glycogen. In later periods of absorption, more sugar is oxidized than stored as glycogen and this is associated with a rise in 0~ consumption and heat production.
After sugar feeding plus insulin, the calories are equal to those in the fore period in the case of glucose and slightly higher than in the fore period in the csse of fructose and dihydroxyacetone. The heat production in the experiments with sugar plus insulin is higher than in those with sugar alone. The increase amounts to 5.7 per cent with glucose, to 10.0 per cent with fructose, and to 8.8 per cent with dihydroxyacetone.
While Chaikoff and Macleod (16) found no reduction of 0s con- sumption in insulinized rabbits and dogs, they regard the experi- ments of Dudley, Laidlaw, Trevan, and Boock (17) as evidence that Oz consumption is reduced in mice after insulin. Dudley and collaborators injected convulsive doses of insulin into fasted mice
by guest on August 23, 2018
http://ww
w.jbc.org/
Dow
nloaded from

C. F. Cori and G. T. Cori
and noted ah enormous fall in 02 intake. In our experiments on rats, where hypoglycemic symptoms are prevented by sugar feeding, insulin does not have this effect. It will be shown in a later paper that the same is true for fasting rats, if they are rich in glycogen and if a non-convulsive dose is injected. On the other hand, the results of Dudley and collaborators were con- firmed on fasting rats with poor carbohydrate reserves, when large doses of insulin were given (unpublished experiments). A de- cressed ot consumption and fall in body temperature has also been recorded in large laboratory animals after insulin convulsions. We find, therefore, no b&s for the assumption of Chaikoff and Macleod that insulin has a different effect on the O2 consumption of small laboratory animals as compared with large ones. In both types of animals the changes in Or intake are small if non-convul- sive doses of insulin are injected.
Chaikoff and Macleod found that insulin has only a slight effect on the rate of carbohydrate oxidation of well fed rabbits. The same is observed in our present experiments on glucose-fed rats. However, their conclusion that “the sugar which insulin caused to disappear” may either have been depoeited as glycogen or converted into some intermediary substance and the dismissal of the former possibility as unlikely, are open to criticism. The question is, what is meant by ‘%ie sugar which insulin caused to disappear.” In order to be of significance, this must have a quantitative meaning. Obviously, the sugar available for con- version into glycogen or into an unknown substance will be repre- sented by the difference between the amount of sugar absorbed and the amount of sugar oxidized. This presupposes that at least two factors must be determined in order to draw conclusions as to changes in the third. However, the amount of sugar absorbed or changes in glycogen have not been determined in these experi- ments. The animals were well fed for some days previously and food was also placed in the respiratory cabinet for the 6 hours that the experiment lasted. Under these conditions there is no means of telling how much sugar wss available to the insulin&d rabbits in comparison to the untreated ones. The experiments merely show that both groups of animals oxidized the same amount of sugar but it is impossible to know how much sugar was left over in the two groups, for other metabolic processes. Without
by guest on August 23, 2018
http://ww
w.jbc.org/
Dow
nloaded from

Insulin and Sugar Utilization
this knowledge a discussion of the fate of disappearing sugar is without significance.
In order to understand the standpoint taken by Macleod and collaborators, it will be necessary to refer to another publication. Barbour, Chaikoff, Macleod, and Orr (18), investigating the influence of insulin on glycogen deposition in the liver and muscles of rats after carbohydrate feeding, have been able to con&m our previous results. These workers also found that insulin retards glycogen formation in the liver, and noted that large doses of insulin cause an increase in glycogen deposition in the muscles. Here again the amount of sugar absorbed from the intestine was not determined. Nevertheless, the statement occurs that “it is certain that glycogen formation cannot account for more than a part of the disappearing glucose,” as if the amount of “disappear- ing glucose” were known. Proceeding from-this statement these authors refer to metabolism experiments of their own, on rabbits, in which insulin caused an increase in carbohydrate oxidation of 0.1 gm. of glucose per kilo, and they conclude that “it seems clear that increased combustion of carbohydrates is not as a rule ade- quate in intact animals, to account for all that portion of the disap- pearing sugar which is not deposited as glycogen,” as if it were permissible to apply observations on the rate of sugar oxidation in rabbits to rats. The last statement of Macleod and collahom tors is contradicted by previous work of B&singer and Lesser (7), Best, Dale, Hoet, and Marks (19), and Cori and Cori (l), who have not only been able to determine quantitatively how much sugar disappears but who have also succeeded in accounting for the disappearing sugar by determining glycogen formation and sugar oxidation on the same animal.
VIII.
DISCUSSION.
Lesser (20) found increased glycogen deposition in mice which were analyzed in toto after intraperitoneal injection of glucose plus insulin. The determination of the respiratory quotient revealed a greater rate of sugar oxidation. Dale and collaborators (19) have shown that intravenous infusion of glucose does not lead to glycogen deposition in the muscles of the eviscerated spinal prep
by guest on August 23, 2018
http://ww
w.jbc.org/
Dow
nloaded from

C. F. Cori and G. T. Cori
aration of the cat. However, when insulin is injected, more glucose has to be infused in order to prevent the blood sugar from falling and there is a marked deposition of muscle glycogen. At the same time, sugar oxidation is also increased. Both Lesser and Dale conclude that insulin promotes sugar oxidation and storage in the muscles. In our previous experiments with glucose on 48 hour fasting rats, increased sugar oxidation was the most prominent feature after the insulin injection, and was accom- panied by an almost complete suppression of glycogen formation in the liver. Under conditions of intestinal absorption, the amount of sugar available is the same in the normal and insulinized animals. In the latter, the increased sugar oxidation and de- creased glycogen formation in the liver balanced each other. These experiments were repeated on 24 hour fasting rats because they absorb sugar at a much greater rate than the 48 hour fasted rats. Here again the insulinized animals have no more sugar available than the control animals and insulin is therefore unable to cause more sugar to “disappear.” It can merely affect the mode of utilization of glucose in the body. The diminished glycogen store in the liver was equally marked, but, in contrast to 48 hour fasting rats, there was a considerable increase in muscle glycogen, while increased sugar oxidation was less prominent. Incressed deposition of muscle glycogen and a suppression of glycogen for- mation in the liver have also been obtained with fructose and dihydroxyacetone when insulin was injected. In contrast to fructose and glucose, insulin hardly affected the rate of oxidation of dihydroxyacetone.
How far do these experiments, in which insulin is present in excess, help to explain the function of this hormone under normal conditions? The utilization of ingested sugar in the normal animal shows us what insulin does when it is released by the pan- creas according to physiological needs of the body. With glucose 44 per cent of the absorbed sugar is oxidized, 18 per cent is de- posited as liver glycogen, and 25 per cent is converted into body glycogen. Fructose and dihydroxyacetone show a different utili- zation in the normal organism; a larger percentage of the former sugar is converted into liver glycogen, while a larger percentage of the latter sugar is oxidized.
If insulin is lacking, owing to the removal of the pancreas,
by guest on August 23, 2018
http://ww
w.jbc.org/
Dow
nloaded from

784 Inmlin and Sugar Utilization
ingested sugar can neither be stored as glycogen, nor can it be oxidized. The processes of sugar disposal may not be suppressed entirely in the diabetic organism, but they must occur at an infi- nitely slower rate than in the normal animal. Insulin would’then act as an accelerator of these processes. The other extreme, repre- sented by an excess of insulin, shows us which of the processes of sugar disposal are accelerated by the pancreatic hormone. As we have seen, the acceleration occurs mainly in the peripheral tissues and involves both glycogen formation and sugar oxidation. An acceleration of glycogen formation in the liver cannot occur under conditions of intestinal absorption, because the peripheral tissues, which form the largest mass of the body, appropriate most of the absorbed sugar.
The influence of insulin on glycogen formation in the liver is still an open question. Under normal conditions, both the ab- sorbed sugar and the insulin given off by the pancreas pass through the liver before they reach the peripheral tissues. The liver has, therefore, the first choice. But insulinis alsoneededforthedisposal of sugar in the peripheral tissues. The supply of insulin by the pan- creas must be so adjusted that the sugar disposal in the peripheral tissues does not gain the preponderance over that in the liver. Indeed, the slight alimentary hyperglycemia is an indication that, under normal conditions, the peripheral tissues do not work to their full capacity. On the other hand, if the peripheral tissues gain the preponderance on account of an insulin injection, the liver is either forced to give up its glycogen or does not form gly- cogen at all. In the former case, one is dealing with an ephemeral glycogen formation; in the latter case, glycogen formation in the liver is inhibited. No decision has been reached as to the merit of either of these possibilities. The absence of glycogen in the diabetic liver does not necessarily mean that insulin is needed for the synthetic process in the normal liver, since secondary influences may account for the loss of liver glycogen after the removal of the pancreas. However, when insulin is injected into fasting, de- pancreatized dogs and cats, liver glycogen reappears in consid- erable amounts (8). In normal fasting animals, the majority of investigators observed a decrease in liver glycogen after insulin injections, but Frank, Hartmann, and Nothmann (21) claim
by guest on August 23, 2018
http://ww
w.jbc.org/
Dow
nloaded from

C. F. Cori and G. T. Cori 785
to have found an increase in liver glycogen in fa.&ing rabbits after the injection of small doses of insulin.
The conception is not without merit that the mode of utilization of sugar in the normal organism is controlled (among other factors) by the opposing influence of the internal secretion of the pancreas and the adrenal medulla. It must, however, not be lost sight of, that the actual point of attack of insulin and epinephrine in the process of carbohydrate disposal remains still a mystery. The end effects produced by these hormones are known, but the actual mechanism involved has not been ascertained.
The r81e of absorption in metabolism experiments needs a special discussion. The intestines of the animals investigated in this respect (dog, Nagano (22); cat, Hewitt (23); rat, Cori (24)) are posessed of a high degree of selective permeability for sugars of a very similar configuration. To give an example: In the rat, glucose is absorbed 5 times as fast as its isomer mannose and twice as fast as the keto sugar fructose. The order in the rate of absorp- tion of four hexoses and two pentoses was the same in the dog and in the rat, while in the cat, which has been tested for only three sugars, galactose held another position than in the dog and rat, being absorbed more slowly than glucose. In contrast to the intestine, various hexoses and pentoses are absorbed at the same rate from the peritoneal cavity (25). Selective permeability is, therefore, a characteristic of the epithelial lining of the intestine, a property which is also exhibited in the most striking manner by the tubular epithelium of the kidney (Hamburger (26)). It seems unlikely that selective permeability is an exclusive property of the intestine of the dog, cat, and rat; it is more probable that one is dealing here with a general biological law which applies to other species and to man as well. To he sure, one cannot, apply quanti- tative obseNations made on one species to another. It would not he fitting to say that because the rat absorbs glucose twice aa fast as fructose, the same must hold true for man. Indeed, there are indications that the opposite may he the case. The order in the rate of absorption of hexoses might .vary in the diBerent species. The argument that is put forward here is this: If selective per- meability is a property of the intestine of all mammals, everything speaks against the assumption that different hexoses are absorbed at the same rate in man. Since it is not known at what rate each
by guest on August 23, 2018
http://ww
w.jbc.org/
Dow
nloaded from

786 Insulin and Sugar Utilization
particular sugar is absorbed from the human intestine,* an in- terpretation of metabolism experiments, in which different sugars are fed, is very difhcult.
Another factor which we believe to be true, not only for the rat but also for other species, is absorption of sugar at a constant rate. Ingestion of 200 gm. of glucose instead of 100 gm. does not lead to an increase in the rate of absorption, as one might believe; it merely doubles the length of time until absorption is completed. Absorption is, therefore, comparable to an intravenous infusion of sugar at a constant rate, provided such an infusion is made into the portal circulation.
A third factor, which is of special significance, is the inhibition in absorption which occurs when two Merent sugars (28) or sugars and amino acids (29) are fed simultaneously. For instance, galac- tose is absorbed by 48 hour fasting rats at a rate of I .96 gm. per kilo per hour. However, galactose is absorbed from a glucose- galactose mixture of equal parts at a rate of only 0.74 gm. per kilo per hour. A similar reduction occurs in the rate of absorp- tion of glucose when galactose is being absorbed at the same time, the inhibition being mutual. The total amount of sugar absorbed from a glucose-galactose mixture is, therefore, not greater than if glucose or galactose are being absorbed alone.
Finally, the length of time of fasting and other bodily conditions such aa adrenalectomy in the rat (6), have a profound influence on the rate of intestinal absorption. No doubt, as more attention is paid to intestinal absorption, several other factors beside those here enumerated will be discovered.
If these absorption factors are taken into consideration, many results, difIicult of explanation, published in the literature, are amenable to a different and often more simple interpretation than the one given by the authors. This contention is illustrated by the following example. Fohn and Berglund (30) found on the same subject that the excretion of galactose in the urine after the ingestion of 100 gm. of glucose plus 100 gm. oi galactose is less than one-tenth as great as the excretion obtained from 100 gm.
* Wiercuchowski (27) found that glucose and fructose leave the stom- ach at the same rate. Since absorption of sugars from the stomach is in- significant, this beare no relation to the rate of absorption from the intestines.
by guest on August 23, 2018
http://ww
w.jbc.org/
Dow
nloaded from

C. F. Cori and G. T. Cori 787
of galactose when taken alone. A similar difference has been observed by Bodansky (31) on dogs, and by Corley3 on rabbits. The same is true for rats (unpublished experiments), but here the simultaneous determination of absorption reveals that the basis for this phenomenon is the mutual inhibition in absorption which has been described above.
Benedict and Carpenter (32) confirmed and enlarged upon the original observation of Togel, Brezina, and Durig (33), that in men, ingestion of fructose causes a more rapid and sustained rise in R.Q. than an equal quantity of glucose. This has also been found by a number of other investigators. It is of importance that Carpenter (34) failed to find the characteristic rise in R.Q.
when fructose was administered by rectum. He explains this difference by the hypothesis that sub-stances injected into the rectum are metabolized without the aid of hormones elaborated when the material is ingested by mouth. Differences in rate of absorption might afford a simpler explanation, since it is known that the absorbing capacity of the large intestine is inferior to that of the small intestine. The higher R.Q.'S after fructose than after glucose ingestion might be due to a greater rate of absorption of the former sugar or they may be the result of the structural differ- ence between these two sugars. In order to decide between these two alternatives, it is proposed to infuse these sugars intravenously at the same rate into normal men and to determine the respira- tory metabolism at the same time. This has the advantage that the amount of sugar supplied during the metabolism period is known. After the ingestion of sugar the time at which absorption comes to an end remains unknown and the metabolism cannot, therefore, be correlated with the period of active absorption.
In men, under basal conditions, sugar derived from the glyco- gen stores is being oxidized. Since it is not known to what extent fructose replaces the glycogen metabolism, the higher R.Q. curve after fructose ingestion might also be due to the fact that fructose is less effective in reducing glycogen utilization than an equal quantity of glucose. The same consideration applies to dihy- droxyacetone.
In the experiments on rats all these difficulties are absent. The
aCorley, R. C., J. Biot. Chtm., 1928, lxxvi, 31.
by guest on August 23, 2018
http://ww
w.jbc.org/
Dow
nloaded from

788 Insulin and Sugar Utilization
24 hour fasting animal has an R.Q. of 0.71 at the time of the sugar ieeding. Comparisons are based not merely on the R.Q. curve, but ‘on the actual amount of sugar oxidized. By determining glycogen formation and sugar oxidation simultaneously, 90 per cent of the absorbed sugar is accounted for. This indicates that the Zuntz-Schumburg formula, which is based on the validity of the non-protein R.Q. as a true combustion quotient of a mixture of fat and carbohydrates, is not far off under the conditions of our experiments. The amount of sugar absorbed is also known in the rat experiments. Owing to the difference in rate of absorption of various sugam, a comparison of the absolute values for sugar oxidation and glycogen formation in the liver and the body has little significance. In order to see how various sugars are utilized in the body, a comparison has to be made for an equal quantity of absorbed sugar. Under the’= conditions, each of the three sugars was found to be utilized in a different way. Per 100 parts of absorbed sugar, a larger percentage oi dihydroxyacetune was oxidized than of glucose and fructose. Glycogen formation in the liver was highest with fructose, and lowest with glucose, while the opposite was true for glycogen formation in the body. It is concluded that the configuration of the sugar molecule determines not only the rate of intestinal absorption but also the mode of utilization in the tissues.
The statement is often found in the literature that the blood sugar curve after the ingestion of sugar is an index of the rate of absorption. This is not correct, because the blood sugar level does not depend on absorption alone but on the ratio:
rate of absorption rate of removal in tissues
. Calculations have been given in a
previous paper (24), which show that even a slight disproportional- ity between these two rates hssamarked effect on the sugar concen- tration in the blood. Two sugars which are absorbed at the same rate will give a different blood sugar curve, if the rate of removal in the tissues is different. Glucose and gala&se are absorbed at nearly equal rates in the rat. . The higher blood sugar curve during absorption of the latter sugar is due to its slower utiliza- tion by the tissues. On the other hand, two sugars or the same sugar, when absorbed at different rates, will give an identical blood sugar curve if the above ratio remains unchanged. Glucose
by guest on August 23, 2018
http://ww
w.jbc.org/
Dow
nloaded from

C. F. Cori and G. T. Cori
as well as fructose is absorbed much faster in 24 hour fasting than in 48 hour fasting rats, but the almost identical blood sugar curves do not reveal this difference in absorption.
Cathcart and Markowitz (35) found recently, in men, that glu- cose causes a leisurely rise in the R.Q., whereas other sugars (sucrose, galactose, levulose, and dihydroxyacetone) bring about a rapid rise in the R.Q. to unity. They state that “these differ- ences cannot be attributed to differences in the rate of absorption as shown by blood sugar estimations.” If the blood sugar curve is regarded as an index of absorption, it would seem logical also to regard the R.Q. curve as an index of absorption. A more rapid rise in the R.Q. might then signify a more rapid absorption. The conflicting evidence, thus obtained, reveals the impossibility of such conclusions. Most authors prefer to attribute differences in the R.Q.. curve to a different utilization of the various sugars in the body. Those sugars which give a more rapid rise in R.Q. are said to be utilized better than those which give a slow rise. It has already been pointed out that the utiliz’ation of a sugar does not only depend on its oxidation but also on its conversion into liver and body glycogen and that these three processes of sugar dis- posal are interdependent. A larger oxidation necessarily means less glycogen formation with no possibility for deciding which of the two is the primary process.
The 6rst investigation of the fate of dihydroxyacetone in the body was,made by Mbstowski (36), who found that feeding the triose to fasting chickens leads to an increase in liver and muscle glycogen. No other work on glycogen formation from dihydroxy- acetone could be found in the literature, except a casual statement by Isaac and Adler (37) that the triose is a better glycogen former in the liver than glucose. In the rat 21 per cent of the absorbed triose and 18 per cent of the absorbed glucose are converted into liver glycogen. In the muscles of the rat glycogen formation from the triose amounts to 15 per cent and from glucose to 25 per cent.
Conversion of the triose into glucose has been observed by Embden, Schmidt, and Wittenberg (38) in perfusion experiments on livers of phlorhizinized dogs. Ringer and Frankel (39) were able to account for a large percentage of dihydroxyacetone fed to phlorhizinized dogs by the excretion of extra sugar (glucose). A similar observation has been made by Campbell and Markowitz
by guest on August 23, 2018
http://ww
w.jbc.org/
Dow
nloaded from

790 Insulin and Sugar Utilization
(40) on depancreatized dogs. The conversion of the triose into glucose in the diabetic organism does not necessarily prove that such a conversion is a necessary step in the utilization of the triose in the normal organism.
In another paper the last named authors (41) kept depan- creatized dogs on a diet containing glucose. Only small doses of insulin were injected, so that a considerable glycosuria persisted. Sugar excretion remained practically unchanged when dihydroxy- acetone or fructose was substituted for glucose in the diet. The authors conclude that in the diabetic organism there is no prefer- ential utilization of dihydroxyacetone and fructose over glucose, and they explain this by a conversion of the triose and of fructose into glucose prior to utilization in the tissues. Determinations of R. Q. (Mason (42), Lambie and Redhead (43)), of blood sugar (Isaac and Adler (37), Rabinowitch (44)), of blood phosphates (Lambie and Redhead (43)) Rabinowitch (45)), in mild and severe diabetics have been interpreted in an opposite way; namely, that the triose is utilized directly in the tissues of the diabetic organism and that this sugar is disposed of without the aid of insulin. In diabetic patients the R. Q. showed a steeper rise after dihydroxy- acetone than after glucose ingestion. The same has been shown by Joslin (46) for fructose. These experiments show that there exist differences in the utilization of the triose, of fructose, and of glucose in the human diabetic, but they offer no proof that these sugars are utilized better than glucose, since the greater rate of oxidation of the triose and of fructose may be counterbalanced by a decreased rate of glycogen formation.
In normal men (Mason (47), Lambie and Redhead (43), Cath- cart and Markowitz (35)) and in dogs (Himwich, Rose, and Malev (48)) dihydroxyacetone also leads to a steeper rise in the R. Q. than glucose. In the rat 51 per cent of the absorbed triose and 44 per cent of the absorbed glucose are oxidized. The fact that dihydroxyacetone is an effective remedy against insulin convulsions is interpreted by Campbell and Hepburn (49) as proof that the triose is converted into glucose ; while Kermack, Lambie, and Slater (50) assume that a direct utilization of the triose relieves the symptoms. In hepatectomized animals the evidence is also conflicting. Markowitz and Campbell (51) find no utilization of the triose,, while Kermack, Lambie, and Slater
by guest on August 23, 2018
http://ww
w.jbc.org/
Dow
nloaded from
C. F. Cori and G. T. Cori 791
(50) believe that the triose is utilized. Loebel (52) and Meyerhof and Lohmann (53) found no indication that dihydroxyacetone is changed into lactic acid or oxidized by surviving tissues. This was true not only for brain and muscle tissue but also for the liver (53, 54). On the other hand, fructose and glucose were oxidized by these tissues. These experiments on isolated tissues offer no clue as to the mode of utilization of the triosc in the intact organism.
The discussion of the literature shows that there is disagreement on two questions. The first question deals with the preferential utilization of the triose in the diabetic organism. The substitu- tion experiments of Campbell and Markowitz (41) have offered definite proof that in the depancreatiied dog dihydroxyacetone and fructose are not utilized better than glucose. The second questions deals with the mode of utilization of the triose in the normal organism; namely, whether the triose can be utilized di- rectly or whether it has to be converted into glucose by the liver in order to be utilized. In normal men and in dogs the rate of oxidation of dihydroxyacetone differs from that of glucose. The same is true for the incomplete human diabetes. In the normal rat dihydroxyacetone is also utilized in a different way than glucose, being oxidized to a larger extent and forming less glycogen than glucose, which suggests, but does not prove, a direct utiliza- tion of the triose in the peripheral tissues.
Insulin has a marked effect on the utilization of the triose in the rat, since it leads to a strong increase in deposition of muscle glycogen. It has already been pointed out that the sugar made available for increased glycogen deposition in the muscles is paid for by a decreased glycogen formation in the liver. The question yet to be investigated is whether glycogen formation in the liver is inhibited by an excess of insulin or whether there is an ephem- eral glycogen deposition in the liver. In the latter case the sugar made available for increased glycogen deposition in the muscles would be glucose and not dihydroxyacetone. The fact that insu- lin leads to an increase in the dihydroxyacetone content of the blood and to a larger excretion of the triose in the urine seems to speak against an ephemeral glycogen deposition in the liver. In this case the sugar made available for increased glycogen deposi- tion in the muscles would be dihydroxyacetone. Definite proof to
by guest on August 23, 2018
http://ww
w.jbc.org/
Dow
nloaded from

792 Insulin and Sugar Utilization
this effect would be of some importance, because it would indicate that insulin is still able to produce its characteristic effect when the triose stage of the sugar molecule has been reached.
IX.
SUMMARY.
1. The ratio in the rate of absorption of glucose, fructose, and dihydroxyacetone is of the order 100:51:65. 44 per cent of the glucose absorbed in 4 hours is oxidized, 18 per cent is converted into liver glycogen, and 25 per cent into body glycogen, corre- sponding to a recovery of absorbed sugar of 87 per cent. The values obtained for fructose are, 36 per cent oxidized, 38 per cent converted into liver glycogen, and 12 per cent into body glycogen. Of dihydroxyacetone 51 per cent is oxidized, 21 per cent deposited as liver glycogen, and 15 per cent as body glycogen. The config- uration of the sugar molecule determines not only the rate of absorption but also the mode of utilization of the sugar in the body.
2. During sugar absorption, insulin injections cannot lead to the disappearance of more sugar, because the animals with and without insulin have the same quantity of sugar available on account of nearly equal absorption. After insulin injections 49 per cent of the glucose absorbed in 4 hours is oxidized, only 6 per cent is converted into liver glycogen, and 36 per cent is converted into body glycogen, corresponding to a recovery of absorbed sugar of 91 per cent. The values obtained for fructose are, 59 per cent oxidized, 6 per cent converted into Iiver glycogen, and 27 per cent into body glycogen. Of dihydroxyacetone 53 per cent is oxidized, 2 per cent deposited as liver glycogen, and 33 per cent as body glycogen.
3. After insulin injections, the utilization of absorbed sugar in the peripheral tissues (mainly muscles) is increased to such an extent that there is almost no sugar available for glycogen deposi- tion in the liver. The diminished glycogen storage in the liver corresponds to 12 per cent of the absorbed sugar in the case of glucose, to 32 per cent in the case of fructose, and to 19 per cent in the case of dihydroxyacetone. The surplus of sugar available to the peripheral tissues during insulin action is disposed of in a different way, depending on the sugar which is fed. With glucose
by guest on August 23, 2018
http://ww
w.jbc.org/
Dow
nloaded from

C. F. Cori and G. T. Cori 793
and the triose it is largely increased glycogen deposition and to a smaller extent oxidation; with fructose it is mainly increased oxidation and to a lesser degree glycogen formation. A surplus of insulin accelerates oxidation and storage of sugar in the periph- eral tissues. On the other hand, when insulin is secreted according to physiological needs, the insulin production of the pancreas is so adjusted that the utilization of sugar in peripheral tissues does not gain preponderance over that in the liver.
4. The heat production in the experiments with sugar plus insulin is slightly higher than in those with sugar alone. There ia no basis for the assumption that insulin has a different effect on the 0% intake of small laboratory animals as compared with large ones. In both types of animals the changes in O2 consumption are small if non-convulsive doses of insulin are injected.
5. The r&le of absorption is discussed. It is believed that the following factors apply to all mammals: (a) selective permeability of the intestine, resulting in a different rate of absorption of isomeric hexoses and pentoses; (b) absorption of each sugar at a constant rate; (c) mutual inhibition in absorption when two different sugars or sugars and amino acids are ingested simultaneously; (d) reduced rate of absorption after prolonged fasting and influence of other bodily conditions on the rate of absorption; (e) the blood sugar curve cannot be used as an index of the rate of absorption.
The authors wish to thank Miss Hilda IA. Goltz for valuable assistance in this work and Dr. Fred R. Griffith, Jr., for reading the manuscript.
BIBLIOGRAPHY.
1. Cori, C. F., andCori, G. T., J. Biol. Chm., 1926, lxx, 557. 2. Cori, G. T., andCori, C. F., J. Biol. Chem., 1927, lxxiii, 555. 3. Neuberg, C., Der Ham, Berlin, 1911, i, 369. 4. Campbell, W. R., J. Biol. Chem., 1928, lxvii, 59. 5. Hagedorn, H. C., and Jensen, B. N., Biochem. Z., 1923, cxxxv, 46. 6. Cori, C. F., and Cori, G. T., J. Biol. Chem., 1927, lxxiv, 473. 7. Bieeinger, E., and Lesser, E. J., Biochem. Z., 1926, clxviii, 398. 8. Cori, C. F., J. Pharmacd. and Ezp. Therap., 1925, xxv, 1. 9. Cori, C. F., andcori, G. T., J. Biol. Chm., 1928, Ixxii, 597.
10. Wierzuchowski, M., J. Biol. Chcm., 1926, lxviii, 631. 11. Batch, F., and Pollak, L., Arch. Ezp. Path. u. Pharmakd., 1927, cxxv,
89.
by guest on August 23, 2018
http://ww
w.jbc.org/
Dow
nloaded from

Insulin and Sugar Utilization
12. Reinhold, J. G., and Karr, W. G., 1. B&Z. Chum., lQZ7, hii, 345. 13. Mann, F. C., J. Am. Med. Awn., 1925, lxxxv, 1472. 14. Cori, C. F., and Cori, G. T., Proc. Sot. Exp. Biol. and Med., 1927, xxv,
66. 15. Luck, G., The elements of the science of nutrition, Philadelphia and
London, 3rd edition, 1923. 16. Chaikoff, I. L., andMacleod, J. J. R., J. Biol. Chum., lm, lxxiii, 725. 17. Dudley, H. W., Laidlaw, P. P., Trevan, J. W., and Boook, E. M., J.
Physiol., 1923, lvii, p. xlvii. 18. Barbour, A. D., Chaikoff, I. L., Macleod, J. J. R., and Orr, M. D.,
Am. J. Physiol., 1927, lxxx, 243. 19. Beat, C. H., Dale, H. H., Hoet, J. P., endMarks, H. P., Proc. Roy. Sot.
London, Series B, 1926, c, 56. 20. Lenaer, E. J., Die innere Sekretion des Pankreaa, Jena, 1924. 21. Frank, E., Hartmann, E., and Nothmann, M., Klin. Woch., 1926, iv, 1067. 22. Nagano, J., Arch. ges. Physiol., 1902, xc, 339. 23. Hewitt, J. A., Biochum. J., 1924, xvii, 101. 24. Cori, C. F., J. Biol. Chem., 1925, lxvi, 691. 25. Cori, C. F., and Golts, H. L., Proc. Sot. Ezp. Biol. and Msd., 1926, xxii,
122. 26. Hamburger, H. J., Ergebn. Phyuiol., 1924, xxiii, 77. 27. Wierzuchowaki, M., quoted from Deuel, H. J., Jr., J. Biol. Chem., 1927,
lxxv, 387. 28. Cori, C. F., Proc. Sot. Ezp. Biol. and Mod., 1928, xxiii, 290. 29. Cori, C. F., Proc. Sot. Ezp. Biol. and Med., 1928, xxiv, 125. a0. Folin, O., and Berglund, H., J. Biol. Chcm., 1922, li, 213. 81. Bodamky, M., J. Biol. Chcm., 1923, lvi, 337. 32. Benedict, F. G., and Carpenter, T. M., Carnegie Znutitution of Waah-
ington, Pub. No. df?f, 1918. 33. T(lge1, O., Brezina, E., and Durig, A., Biochem. Z., 1913,1,2Q6. 34. Carpenter, T. M., Cam+e Institution of Washington, Pub. No. 360,
1926. 35. Cathcart, E. P., andMarkowits, J., J. Physiol., 192’7, lxiii, 309. 30. Mostowski, S., Compt. rend. Acad., 1911, clii, 1276. 37. Isaac, S., and Adler, E., Klin. Woch., 1924, iii, 1208. 38. Embden, G., Schmidt, E., and Wittenberg, M., Z. physiol. Chem., 1913,
lxxxviii, 210. 39. Ringer, A. I., and Frankel, E.M., J. Biol. Chem., 1914, xviii, 233. 40. Campbell, W. R., andMarkowitz, J., Am. J. Physiol., 1927, lxxx, 501. 41. Campbell, W. R., andMarkowitz, J.; J. Clin. Znu., 1927, iv, 37. 42. Mason, E. H., J. CZin. Znv., 1920, ii, 533. 43. Lambie, C. G., and Redhead, F. A., Biochar. J., lQ!Z’, xxi, 649. 44. Rabinowitch, I. M., J. Biol. Chem., 1925, lxv, 55. 45. Rabinowitch, I. M., J. Biol. Chem., 1927, lxxv, 45. 46. Joslin, E. P., CarnegieInstitution of Washington, Pub. No. 383, 1923. 47. Mason, E. H., J. Clin. Znv., 1920, ii, 521.
by guest on August 23, 2018
http://ww
w.jbc.org/
Dow
nloaded from

C. F. Cori and G. T. Cori
48. Himwich, H. E., Rose, M. I., and M&v, hf. R., Proc. Sot. Ezp. Biol. and Mad., lQ27, xxiv, 238.
49. Campbc$l, W. It., and Hepburn, J., J. Biol. Chtm., lQ28, lxviii, 575. 50. Kenneck, W. O., Lambie, C. G., and Slater, R. H., B&hem. J., lQ25,
xx, 4!M. 61. Markowitq J., and Campbell, W. It., Am. J. Physiol., lQ27, lxxx, 546. 52. Loebel, R. O., B&ham. Z., 1925, clxi, 219. 53. Meyerhof, O., and Lohmann, K., Biochem. Z., lQ28, &xi, 581. 54. Meyerhof, O., Lohmann, K., and Meier, R., Biochmm. Z., lQ25, olvii,4SQ.
by guest on August 23, 2018
http://ww
w.jbc.org/
Dow
nloaded from

Carl F. Cori and Gerty T. CoriDIHYDROXYACETONE
GLUCOSE, FRUCTOSE, AND INSULIN ON THE UTILIZATION OF
BODY: VIII. THE INFLUENCE OF THE FATE OF SUGAR IN THE ANIMAL
1928, 76:755-795.J. Biol. Chem.
http://www.jbc.org/content/76/3/755.citation
Access the most updated version of this article at
Alerts:
When a correction for this article is posted•
When this article is cited•
alerts to choose from all of JBC's e-mailClick here
ml#ref-list-1
http://www.jbc.org/content/76/3/755.citation.full.htaccessed free atThis article cites 0 references, 0 of which can be
by guest on August 23, 2018
http://ww
w.jbc.org/
Dow
nloaded from