The factor analysis of obstacles in energy consumption ...1).pdf · The factor analysis of...
16
International Journal of Renewable Energy, Vol. 11, No. 2, July - December 2016 1 The factor analysis of obstacles in energy consumption reduction using reverse logistics of Tier 1 auto-parts industry in Thailand Anuwat Charoensuk a , Amnuay Boonratmaitree b , Wipawadee Wongsuwan c Rattanakosin College for Sustainable Energy and Environment, Rajamangala University of Technology Rattanakosin Bangkok, Thailand E-mail: [email protected] a E-mail: [email protected] b E-mail: [email protected] c Abstract The purpose of this study was to analyze the factors that became obstacles in using reverse logistics to reduce energy consumption of Tier 1 auto-parts industry in Thailand. Purposive random sampling was used to select the 335 samples from workers of Tier 1 auto-parts industry. The research instrument was a 5-point rating scale questionnaire. The data were analyzed by a statistical analysis software program for percentage, mean, standard deviation, and factor analysis. The results showed that the most important obstacle was the relationship between workers and their organization, the second was the organization structure, and the third was the organization’s atmosphere. From factor analysis, it was found that there were seven factors or obstacles that obstructed the use of reverse logistics to reduce energy reduction of Tier 1 auto-parts industry in Thailand. Those obstacles included; 1) organizational climate and relationship in organizations; 2) organizational structure and management; 3) workers’ efficiency; 4) organizational culture; 5) workers’ devotion; 6) technology and data communication for operation; and 7) employee attachment. Keywords: Reverse logistics, Tier 1, auto-part industry, energy consumption, factor analysis, Thailand 1. Introduction One expected change that would happen to Thailand after joining the ASEAN Economic Community (AEC) in 2015 is that Thailand being located in the center will become an ASEAN hub for various activities such as tourism and airline. Thus, Thailand has opportunities to become a distribution center and a center of medical and public health management further supporting the growth in tourism industry. Thailand also has a strength point on transportation, especially land transportation because roads are provided all over the country. The other strength point is the industries that mainly rely on labor force, especially the industries owned by Japanese such as auto-parts industry and electronic industry [1]. That means, now and in the future, Thailand still needs to consume large amount of energy. Table 1 demonstrates the information of energy consumption of economic sectors.
-
Upload
trinhquynh -
Category
Documents
-
view
217 -
download
1
Transcript of The factor analysis of obstacles in energy consumption ...1).pdf · The factor analysis of...

International Journal of Renewable Energy, Vol. 11, No. 2, July - December 2016
1
The factor analysis of obstacles in energy consumption reduction using
reverse logistics of Tier 1 auto-parts industry in Thailand
Anuwat Charoensuk a, Amnuay Boonratmaitree b, Wipawadee Wongsuwan c
Rattanakosin College for Sustainable Energy and Environment, Rajamangala University of
Technology Rattanakosin
Bangkok, Thailand
E-mail: [email protected] a
E-mail: [email protected] b
E-mail: [email protected] c
Abstract
The purpose of this study was to analyze the factors that became obstacles in using reverse
logistics to reduce energy consumption of Tier 1 auto-parts industry in Thailand. Purposive
random sampling was used to select the 335 samples from workers of Tier 1 auto-parts
industry. The research instrument was a 5-point rating scale questionnaire. The data were
analyzed by a statistical analysis software program for percentage, mean, standard deviation,
and factor analysis. The results showed that the most important obstacle was the relationship
between workers and their organization, the second was the organization structure, and the
third was the organization’s atmosphere. From factor analysis, it was found that there were
seven factors or obstacles that obstructed the use of reverse logistics to reduce energy
reduction of Tier 1 auto-parts industry in Thailand. Those obstacles included; 1)
organizational climate and relationship in organizations; 2) organizational structure and
management; 3) workers’ efficiency; 4) organizational culture; 5) workers’ devotion; 6)
technology and data communication for operation; and 7) employee attachment.
Keywords: Reverse logistics, Tier 1, auto-part industry, energy consumption, factor analysis,
Thailand
1. Introduction
One expected change that would happen to Thailand after joining the ASEAN Economic
Community (AEC) in 2015 is that Thailand being located in the center will become an
ASEAN hub for various activities such as tourism and airline. Thus, Thailand has
opportunities to become a distribution center and a center of medical and public health
management further supporting the growth in tourism industry. Thailand also has a strength
point on transportation, especially land transportation because roads are provided all over the
country. The other strength point is the industries that mainly rely on labor force, especially
the industries owned by Japanese such as auto-parts industry and electronic industry [1]. That
means, now and in the future, Thailand still needs to consume large amount of energy. Table
1 demonstrates the information of energy consumption of economic sectors.
International Journal of Renewable Energy, Vol. 11, No. 2, July - December 2016
2
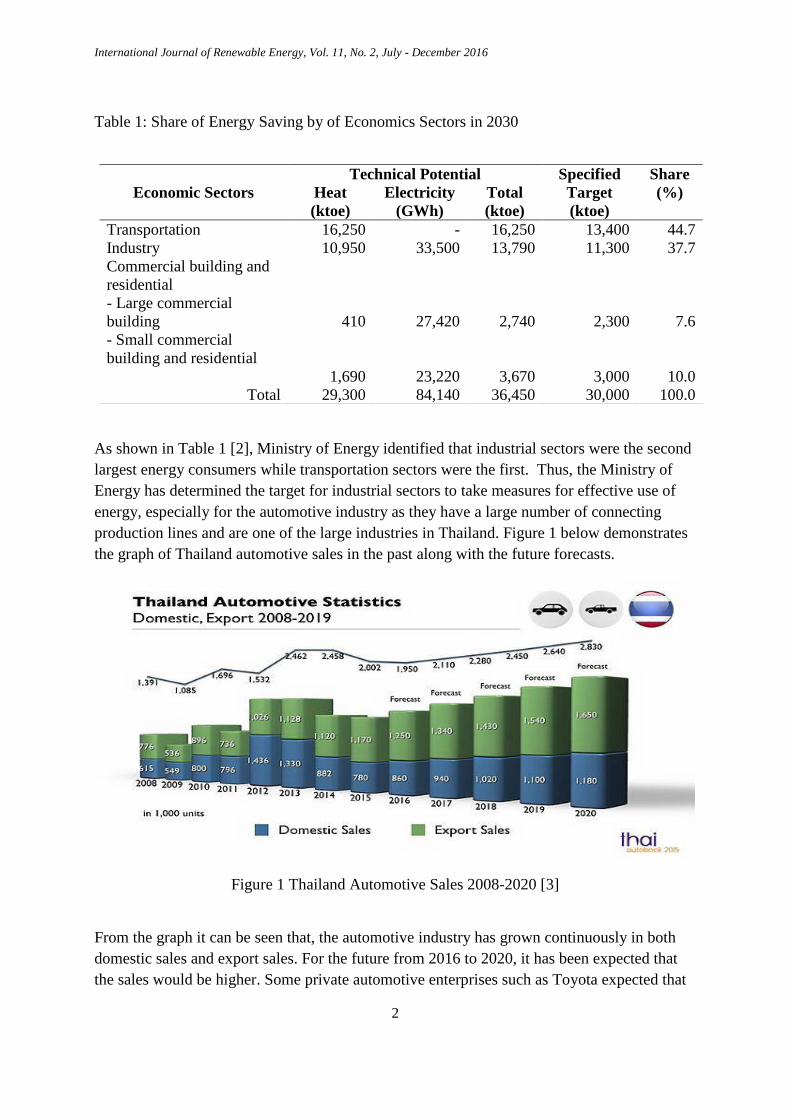
Table 1: Share of Energy Saving by of Economics Sectors in 2030
As shown in Table 1 [2], Ministry of Energy identified that industrial sectors were the second
largest energy consumers while transportation sectors were the first. Thus, the Ministry of
Energy has determined the target for industrial sectors to take measures for effective use of
energy, especially for the automotive industry as they have a large number of connecting
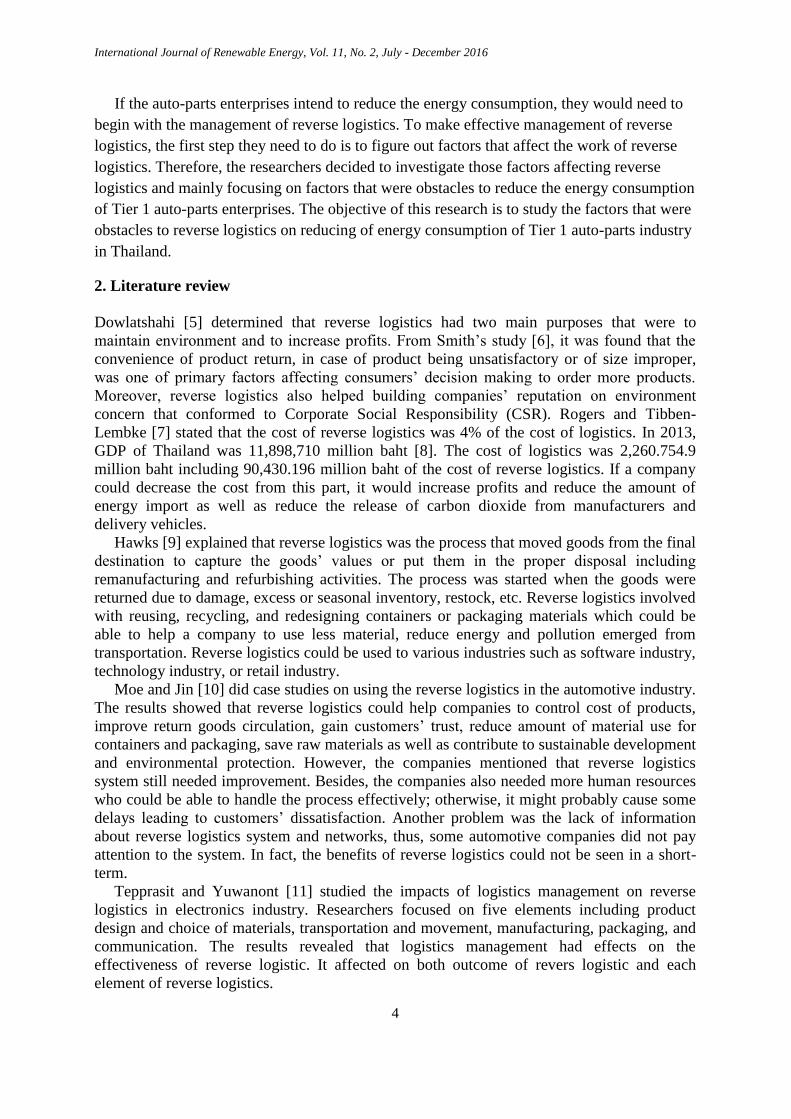
production lines and are one of the large industries in Thailand. Figure 1 below demonstrates
the graph of Thailand automotive sales in the past along with the future forecasts.
Figure 1 Thailand Automotive Sales 2008-2020 [3]
From the graph it can be seen that, the automotive industry has grown continuously in both
domestic sales and export sales. For the future from 2016 to 2020, it has been expected that
the sales would be higher. Some private automotive enterprises such as Toyota expected that
Economic Sectors
Technical Potential Specified
Target
(ktoe)
Share
(%) Heat
(ktoe)
Electricity
(GWh)
Total
(ktoe)
Transportation
Industry
Commercial building and
residential
- Large commercial
building
- Small commercial
building and residential
16,250
10,950
410
1,690
-
33,500
27,420
23,220
16,250
13,790
2,740
3,670
13,400
11,300
2,300
3,000
44.7
37.7
7.6
10.0
Total 29,300 84,140 36,450 30,000 100.0

International Journal of Renewable Energy, Vol. 11, No. 2, July - December 2016
3
in 2017, the total automotive production of Thailand would increase up to 50% or to
3,000,000 units as they had planned for production expansion. Since 2015, three automotive
manufacturers had been built and increased production power up to 500,000 units per year
including Ford, Suzuki, and Mitsubishi. Ford mainly produced sedan cars while Suzuki and
Mitsubishi aimed to produce economy cars. Table 2 [4] demonstrates the numbers of auto-
parts enterprises in Thailand.
Table 2: Numbers of auto-parts enterprises in Thailand
Numbers of Enterprises Numbers of
Employees
Enterprises Motorcycle enterprises
-7 companies
-7 manufacturers
Sedan and truck
enterprises
-19 companies
-19 manufacturers
Automotive
enterprises
-50,000
Dealers and
Service
centers
- 2000,000
Tier 1 auto-parts
manufacturers
Auto-parts
manufacturers
-396 companies
Motorcycle
parts and
Auto-parts
Manufacturers
-122 companies
Motorcycle
parts
manufacturers
-201 companies
Auto-parts
manufactures
-350,000
Support
industries
-100,000 Tier 2 & 3 auto-parts
manufacturers
Small and medium auto-parts manufacturers
-1,100 companies
In Table 2, manufacturers were divided into two groups including Tier 1 and Tier 2 & 3
according to the size of the companies. The size of Tier 1 manufacturers was larger than Tier
2 & 3 and generally had higher production potential than Tier 2 & 3 due to their tools, office
supplies, and high technology machines. With the large number of production, the large
amount of energy would be consumed. That means they would spent high cost for the energy
consumption. Therefore, it would be better for them if they could have effective management
in energy consumption which would help them to reduce the use of energy as well as reduce
the production cost. Consequently, in this study, the researchers had decided to study the
energy consumption of Tier 1 manufacturers, especially auto-parts manufacturers since they
were one of the main enterprises of Thailand.
In order to control the production cost of an enterprise or an organization, the energy
consumption control would be one important key as mentioned. One way to control the
energy consumption is to have effective management on logistics activities. In fact, logistics
management is an effective tool for organization management because it purposes to reduce
cost and satisfy customers. One of logistics management activities that is important to current
business management is reverse logistics. A process does not always end at completely
delivering products to customers’ hands. Reverse logistics is the next process that supply
chains have begun to pay more and more attention as some products may be returned to their
stores, manufacturers, or suppliers. Those products may not be sold or less popular in one
place, but suitable for other places. Some of them may be damaged or wrongly delivered. It
could also involve environment and consumers’ safety issues that causes the return of a
product.
International Journal of Renewable Energy, Vol. 11, No. 2, July - December 2016
4
If the auto-parts enterprises intend to reduce the energy consumption, they would need to
begin with the management of reverse logistics. To make effective management of reverse
logistics, the first step they need to do is to figure out factors that affect the work of reverse
logistics. Therefore, the researchers decided to investigate those factors affecting reverse
logistics and mainly focusing on factors that were obstacles to reduce the energy consumption
of Tier 1 auto-parts enterprises. The objective of this research is to study the factors that were
obstacles to reverse logistics on reducing of energy consumption of Tier 1 auto-parts industry
in Thailand.
2. Literature review
Dowlatshahi [5] determined that reverse logistics had two main purposes that were to
maintain environment and to increase profits. From Smith’s study [6], it was found that the
convenience of product return, in case of product being unsatisfactory or of size improper,
was one of primary factors affecting consumers’ decision making to order more products.
Moreover, reverse logistics also helped building companies’ reputation on environment
concern that conformed to Corporate Social Responsibility (CSR). Rogers and Tibben-
Lembke [7] stated that the cost of reverse logistics was 4% of the cost of logistics. In 2013,
GDP of Thailand was 11,898,710 million baht [8]. The cost of logistics was 2,260.754.9
million baht including 90,430.196 million baht of the cost of reverse logistics. If a company
could decrease the cost from this part, it would increase profits and reduce the amount of
energy import as well as reduce the release of carbon dioxide from manufacturers and
delivery vehicles.
Hawks [9] explained that reverse logistics was the process that moved goods from the final
destination to capture the goods’ values or put them in the proper disposal including
remanufacturing and refurbishing activities. The process was started when the goods were
returned due to damage, excess or seasonal inventory, restock, etc. Reverse logistics involved
with reusing, recycling, and redesigning containers or packaging materials which could be
able to help a company to use less material, reduce energy and pollution emerged from
transportation. Reverse logistics could be used to various industries such as software industry,
technology industry, or retail industry.
Moe and Jin [10] did case studies on using the reverse logistics in the automotive industry.
The results showed that reverse logistics could help companies to control cost of products,
improve return goods circulation, gain customers’ trust, reduce amount of material use for
containers and packaging, save raw materials as well as contribute to sustainable development
and environmental protection. However, the companies mentioned that reverse logistics
system still needed improvement. Besides, the companies also needed more human resources
who could be able to handle the process effectively; otherwise, it might probably cause some
delays leading to customers’ dissatisfaction. Another problem was the lack of information
about reverse logistics system and networks, thus, some automotive companies did not pay
attention to the system. In fact, the benefits of reverse logistics could not be seen in a short-
term.
Tepprasit and Yuwanont [11] studied the impacts of logistics management on reverse
logistics in electronics industry. Researchers focused on five elements including product
design and choice of materials, transportation and movement, manufacturing, packaging, and
communication. The results revealed that logistics management had effects on the
effectiveness of reverse logistic. It affected on both outcome of revers logistic and each
element of reverse logistics.

International Journal of Renewable Energy, Vol. 11, No. 2, July - December 2016
5
Ramerez and Morales [12] studied the effect of reverse logistics on flexibility of
information distribution and organizational performance. They found that the proactive
attitude toward reverse logistics could increase the importance of reverse logistics which
could increase the importance of flexibility of information distribution. Then, finally, they
could improve organizational performance.
It seems that reverse logistics is a good process that could provide various benefits to a
company as mentioned. However, some problems also exist from the use of reverse logistics.
Companies need to find out what could cause a problem to the use of reverse logistics in their
company. The companies should start with the organization management as a basis that could
support the use of revers logistics in their organization so that they could see more clearly for
the direction they need to go first. Therefore, in this study, the researcher had decided to use
the Steer’s organizational effectiveness as the research framework.
From Steer’s organizational effectiveness, he [13] indicated that there were six main
organizational factors that affected the effective management of an organization. The six
factors included organizational structures, technology, organizational culture, organizational
climate, employee attachment, and scholar. Many researches were conducted on
organizational effectiveness based on Steer’s organizational effectiveness model. For
example, Robbins [14], Hall [15], and Owens [16] agreed that organizational structure was
one important factor for organization management. Scott [17], Hodge and Anthony [18], and
Rothwell and Kazanas [19] supported that technology was another factor that affected the
organization management. Chung and Megginson [20], Schwartz and Davis [21], and
Cherrington [22] confirmed that organizational climate affected the organization
management. Therefore, it would be able to consider Steer’s organizational effectiveness
model as an effective tool for organizational management.
3. Research methodology
A. Participants
The population of this study was workers from Tier 1 auto-parts companies in the industrial
estates of Bangkok, Samut Prakarn, and Eastern Thailand areas. To ensure that the samples
could be able to represent the Thailand auto-parts industry, the sample size was calculated
based on Yamane’s Formula [23]. The result came up with 370 workers from the whole
workers’ population. Purposive random sampling was used to select the samples from
workers of Tier 1 auto-parts manufacturers in the three different main areas. 400 sets of
questionnaire were distributed in different manufacturers and the total of 335 sets were
returned (around 83.75% of all).
B. Research instrument
This research was a survey research using a 5-point Likert scales questionnaire including
three parts. The first part focused on general information of participants. The second part, as a
main part, aimed at the obstacles of using reverse logistics to reduce energy consumption of
Tier 1 auto-parts manufacturers in Thailand. The last part was an open-ended question for
participants to comment and give suggestion.
The instrument was validated by three experts and revised before using with the main
study. After revision, the main part of the questionnaire consisted of 23 items of organization
structure, 9 items of tools, 15 items of organizational culture, 21 items of organization
atmosphere, 13 items of employee engagement, and 15 items of specializing.
The instrument was tried out with 30 employees that had similar characteristic with the
main sampling group. Then to measure the instrument’s reliability, Cronbach’s alpha
International Journal of Renewable Energy, Vol. 11, No. 2, July - December 2016
6
coefficient was used to calculate the internal consistency. The alpha coefficient for the items
of the questions was 0.95 depicting high internal consistency.
C. Data collection and data analysis
The questionnaire was distributed to 400 participants. When the questionnaires were
returned, only 335 were completed and usable. Then the data were analyzed using an instant
program for descriptive analysis and factor analysis.
4. Research findings
From the data analysis, the results were the following:
In order to gain more insight on obstacles of using reverse logistics to reduce energy
consumption of Tier 1 auto-parts manufacturers, the basic information of participants was
needed to analyze first.
Table 3: General information of participants
Participants’ Characteristic Total No. of
Participants
%
Genders
Males
Females
163
172
48.7
51.3
Education Lower than Bachelor’s Degree
Bachelor’s Degree
Higher than Bachelor’s Degree
165
145
25
49.3
43.3
7.5
Years of
Experiences
Less than 5-10 years
5 – 10 years
11 years and above
108
134
93
32.2
40.0
27.8
Position
Executives
Operators
Supporters
33
233
69
9.9
69.9
20.6
Numbers of
Employees
Not more than 50
51-200
201 or more
7
54
275
2.1
16.1
81.8
Investors Thai only
Thai and Foreigners
44
292
13.1
86.9
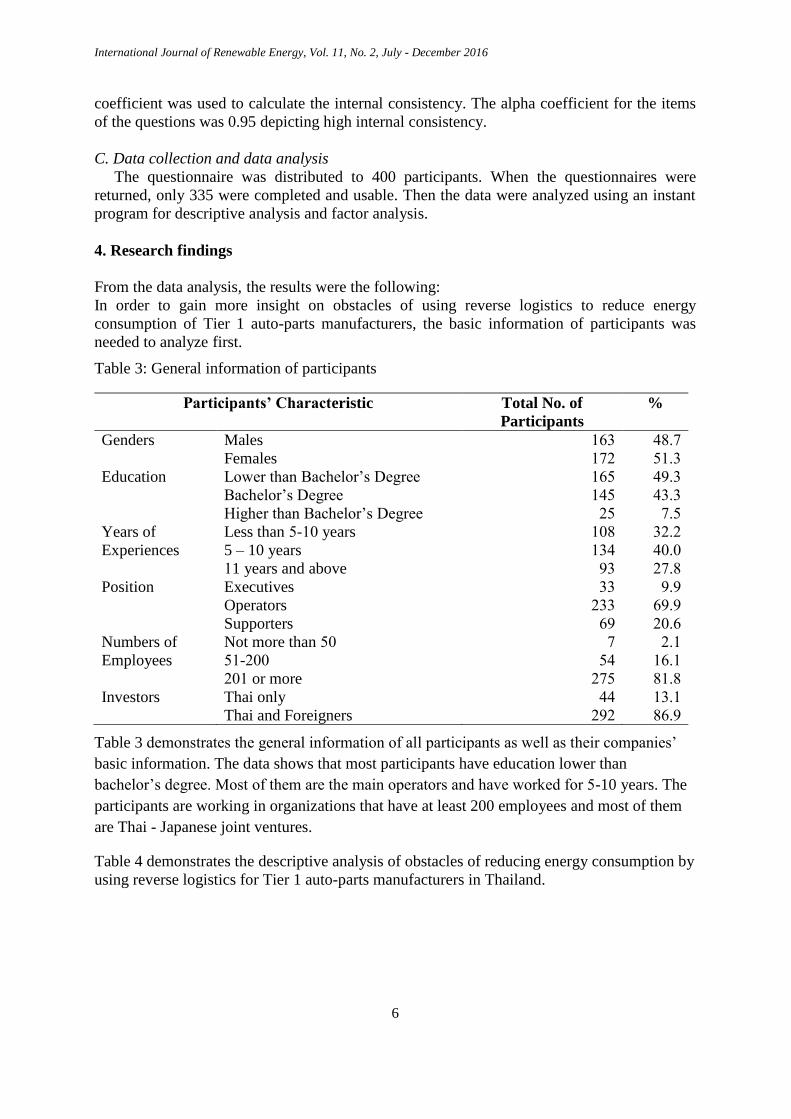
Table 3 demonstrates the general information of all participants as well as their companies’
basic information. The data shows that most participants have education lower than
bachelor’s degree. Most of them are the main operators and have worked for 5-10 years. The
participants are working in organizations that have at least 200 employees and most of them
are Thai - Japanese joint ventures.
Table 4 demonstrates the descriptive analysis of obstacles of reducing energy consumption by
using reverse logistics for Tier 1 auto-parts manufacturers in Thailand.

International Journal of Renewable Energy, Vol. 11, No. 2, July - December 2016
7
Table 4: Mean and standard deviation of obstacles of using reverse logistics to reduce energy
consumption
Obstacles N Mean Std. Deviation
Organizational Structure
Technology
Organizational Culture
Organizational Climate
Employee Attachment
Scholar
336
336
336
336
336
336
3.9139
3.8095
3.7827
3.8601
4.1845
3.8304
.60962
.60793
.64447
.67454
.62160
.61651
The results in Table 4 show that the three most important obstacles are employee
attachment (4.1845), organizational structure (3.9139), and organizational climate (3.8601)
respectively.
The data were also analyzed with factor analysis for obstacles of using reverse logistic to
reduce energy consumption. First, Kaiser-Meyer-Olkin (KMO) and Bartlett’s test of
sphericity were used to analyze the appropriateness of data for factor analysis. The result
showed that KMO of data valued 0.955 which was greater than 0.5. Also, Bartlett’s test of
sphericity showed that the result from the data rejected H0. It meant that all variables were
from population with equal variances. Therefore, the data were appropriated with factor
analysis.
Furthermore, the relationships among participants’ general information and obstacles were
analyzed. The result showed that the values of correlation coefficient were between 0.0032 –
0.072. It could be interpreted that the associations between participants’ general information
and obstacles were very low.
Principal component analysis was used for factor extraction and to find Eigen values,
variance, and the sum of cumulative variance. The result revealed 7 obstacles that contained
the Eigen values higher than 1.00 and the sum of cumulative variance was 52.091%. The
result is presented in Table 5.

International Journal of Renewable Energy, Vol. 11, No. 2, July - December 2016
8
Table 5: Numbers of factors, eigen values, variance, and cumulative variance
Obstacles Eigen Value % of Variance % of Cumulative
Variance
1
2
3
4
5
6
7
13.491
9.857
7.217
5.941
5.823
4.494
2.663
14.201
10.376
7.597
6.254
6.130
4.731
2.803
14.201
24.578
32.174
38.428
44.558
49.288
52.091
Moreover, to make the interpretation more reliable, the orthogonal rotation was used with
Varimax method to find an association between obstacles and variables. Kline [24] stated that
when conducting the factor analysis, one main concern was factor loadings of variables. He
explained that the factor loadings of greater than 0.60 were considered as high while the
loading of greater than 0.30 were considered as moderately high. Then other loadings that
were lower than 0.30 could be ignored which meant they did not have any effects on the
factors. Therefore, from the analysis, the result of this study revealed seven obstacles
consisted of variables with factor loadings of more than 0.30. It could be interpreted that
variables with factor loading of greater than 0.30 would affect the use of reverse logistics in
energy consumption reduction. Table 6 – Table 12 demonstrate each obstacle and its
variables.
International Journal of Renewable Energy, Vol. 11, No. 2, July - December 2016
9
Table 6: Obstacle 1: Organizational climate and relationship in organization
Item
No.
Variables Factor Loading
4.10
4.19
4.20
4.13
4.15
4.9
4.11
4.8
4.12
4.14
4.4
4.16
4.2
4.5
3.15
4.3
4.18
4.6
3.14
4.7
4.1
3.13
3.11
5.1
The relationship between personnel in all levels is good.
Executives give an opportunity to all employees to be
involved with decision making based on accurate
information
Executives create stimulated atmosphere to challenge
employees.
Work environment promotes good atmosphere for
employees who have different personality.
Organizations show an employee’s works or best works
to other employees.
Executives accept employees’ decision making on their
own works.
Work environment promotes a good atmosphere in
working.
Organizations create an atmosphere that stimulates
employees to be aware of their own responsibility.
Work environment promotes an atmosphere that is
appropriated with employees’ different needs.
Organizations give honor or reward employees who have
well perform.
Employees have freedom to be creative in work pre-
forming, not only stick with the traditional ways.
All employees give respect to each other.
Rules and regulations are associated with present
situations and be able to follow.
The top-down communication is used in the organization.
Organizations provide knowledge transfer to employees
in order to shape up a new paradigm to be ready for
upcoming changes.
Employees perform well with full potential in order to
complete their work.
Executives accept their employees’ potential.
The bottom-up communication is used in the
organization.
Regulations can respond to important changes such as
budgets or humans resource.
Employees have confidence in their executives.
Working is flow because organizations are flexible and
reasonable with the use of rules and regulations.
Organizations provides activities that allow employees to
present their ideas and the ways to perform their work
that can go along with organizations’ strategies
Action plans are unofficially announced to employees in
order to reach the organizations’ goals.
Employees are unity.
.705
.684
.682
.681
.673
.666
.660
.651
.651
.646
.644
.634
.624
.622
.620
.611
.601
.599
.592
.579
.553
.487
.453
.439
Eigen value =13.491, % of Variance =14.201

International Journal of Renewable Energy, Vol. 11, No. 2, July - December 2016
10
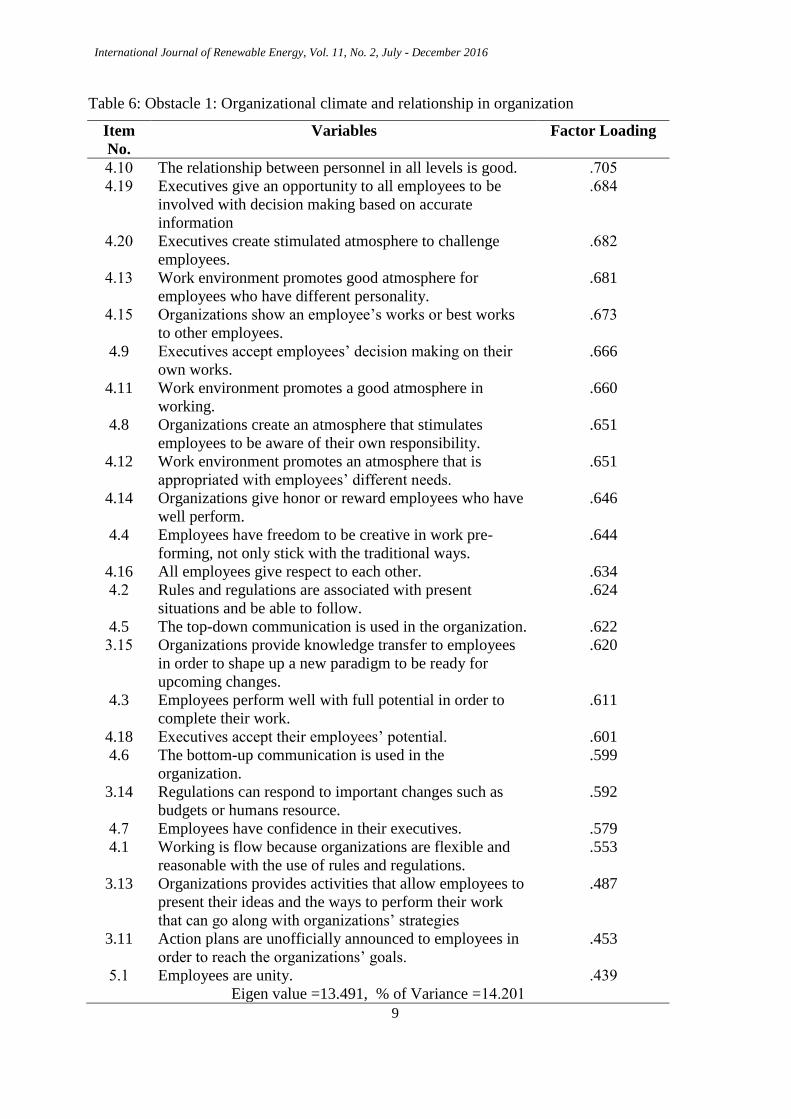
Table 6 presents obstacle 1, organizational climate and relationship in organization. It
includes 24 variables. The factor loading is between .439 - .705 with the Eigen value at
13.491. The highest factor loading is item no. 4.10, “The relationship between personnel in all
levels is good” (.705).
Table 7: Obstacle 2: Organizational structure and management
Item
No.
Variables Factor
Loading
1.3
1.5
1.6
1.19
1.4
1.20
1.2
1.12
1.14
1.16
1.18
1.15
1.17
1.10
1.1
1.7
1.8
1.13
1.22
Departments are divided regarding the numbers
of employees.
The chain of command creates convenient
contact in working.
The chain of command creates flow
communication for working.
Organizations give supports to employees in
training.
Departments or working teams are divided based
on the operation in order to complete the mission.
Organizations give supports to employees to
develop different skills.
Organization structure contributes to work in
cross-functional teams.
Employees are placed in a position that is
appropriated to their skills.
Employees’ jobs and responsibilities are clearly
specified and written.
Rules and regulations are seriously followed.
There is a supporting system that helps with
coordinating in the organization.
Job Description is flexible.
A job rotation system is implemented.
There is no overlap in working processes.
Organizations are flexible and able to adjust
themselves to all changes.
Different departments and working teams can
coordinate with each other quickly.
Organizational structures contribute to flow
coordinate between different departments or
working teams.
The management of operators accords with
supporters.
Each project manager has his/her own power to
manage the project budget.
.669
.663
.641
.636
.630
.608
.590
.574
.573
.555
.550
.540
.533
.525
.519
.519
.510
.454
.335
Eigen value =9.857, % of Variance =10.376
Table 7 demonstrates obstacle 2, organizational structure and management, including 19
variables. The factor loading is between .335 - .669 with the Eigen value at 9.857. The
International Journal of Renewable Energy, Vol. 11, No. 2, July - December 2016
11
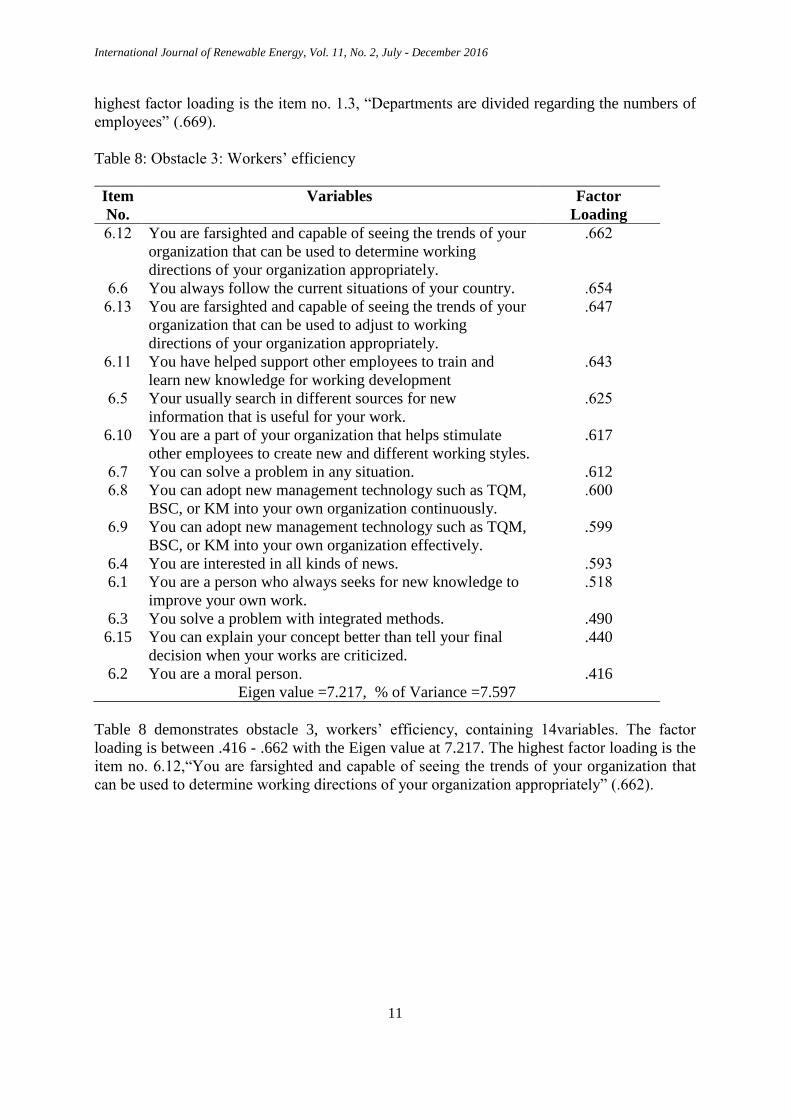
highest factor loading is the item no. 1.3, “Departments are divided regarding the numbers of
employees” (.669).
Table 8: Obstacle 3: Workers’ efficiency
Item
No.
Variables Factor
Loading
6.12
6.6
6.13
6.11
6.5
6.10
6.7
6.8
6.9
6.4
6.1
6.3
6.15
6.2
You are farsighted and capable of seeing the trends of your
organization that can be used to determine working
directions of your organization appropriately.
You always follow the current situations of your country.
You are farsighted and capable of seeing the trends of your
organization that can be used to adjust to working
directions of your organization appropriately.
You have helped support other employees to train and
learn new knowledge for working development
Your usually search in different sources for new
information that is useful for your work.
You are a part of your organization that helps stimulate
other employees to create new and different working styles.
You can solve a problem in any situation.
You can adopt new management technology such as TQM,
BSC, or KM into your own organization continuously.
You can adopt new management technology such as TQM,
BSC, or KM into your own organization effectively.
You are interested in all kinds of news.
You are a person who always seeks for new knowledge to
improve your own work.
You solve a problem with integrated methods.
You can explain your concept better than tell your final
decision when your works are criticized.
You are a moral person.
.662
.654
.647
.643
.625
.617
.612
.600
.599
.593
.518
.490
.440
.416
Eigen value =7.217, % of Variance =7.597
Table 8 demonstrates obstacle 3, workers’ efficiency, containing 14variables. The factor
loading is between .416 - .662 with the Eigen value at 7.217. The highest factor loading is the
item no. 6.12,“You are farsighted and capable of seeing the trends of your organization that
can be used to determine working directions of your organization appropriately” (.662).

International Journal of Renewable Energy, Vol. 11, No. 2, July - December 2016
12
Table 9: Obstacle 4: Organizational culture
Item
No.
Variables Factor
Loading
3.2
3.4
3.3
3.1
3.5
3.11
3.8
3.10
3.6
3.9
Organizations build the atmosphere that allows employees to
be involved with the goal setting.
Organizations give opportunities to employees to be
involved with the goal setting.
Organizations give opportunities to employees to be
involved with vision setting.
Organizations create an atmosphere that allows employees to
be involved with vision setting.
A commitment is created together with employees in order
to pursue the organization’s goal and vision.
Action plans are unofficially distributed to the entire
organizations in order to complete the goal.
Organizations promote team working and emphasize on
getting employees involved with evaluation.
Organizations give support in employees’ behavior check
regularly, especially for morality.
Organizations promote team working and emphasize on
brainstorming.
Employees’ goal is associated with organizations’ goal.
.683
.651
.643
.635
.553
.464
.462
.460
.416
.388
Eigen value =5.941, % of Variance =6.254
Table 9 demonstrates obstacle 3, organizational culture, which consists of 10 variables. The
factor loading is between .388 - .683 with the Eigen value at 5.941. The highest factor loading
is the item no.3.2 “Organizations build the atmosphere that allows employees to be involved
with the goal setting” (.683).
Table 10: Obstacle 5: Workers’ devotion
Item
No.
Variables Factor
Loading
5.10
5.9
5.8
5.11
5.7
5.13
5.6
You are willing to devote your intelligence to the organization.
You are willing to devote our strength to the organization.
Your work responsibility is important for your organization’s
goal.
Personnel work for the success of their organization more than
their own success.
You have devoted yourself to complete the work’s goal.
Personnel accept the limitation of their organizations and do not
decrease their intention.
You accept your organization’s vision and goal.
.810
.781
.721
.720
.626
.516
.511
Eigen value =5.823, % of Variance =6.130
International Journal of Renewable Energy, Vol. 11, No. 2, July - December 2016
13
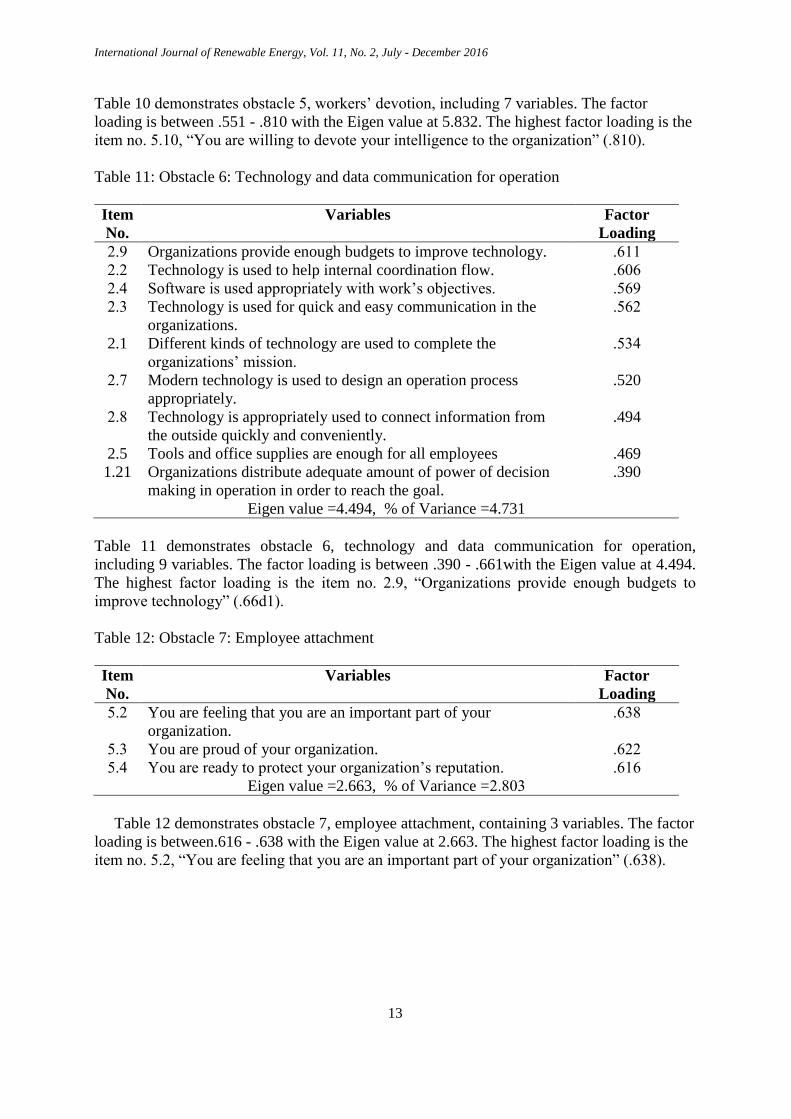
Table 10 demonstrates obstacle 5, workers’ devotion, including 7 variables. The factor
loading is between .551 - .810 with the Eigen value at 5.832. The highest factor loading is the
item no. 5.10, “You are willing to devote your intelligence to the organization” (.810).
Table 11: Obstacle 6: Technology and data communication for operation
Item
No.
Variables Factor
Loading
2.9 2.2
2.4
2.3
2.1
2.7
2.8
2.5
1.21
Organizations provide enough budgets to improve technology.
Technology is used to help internal coordination flow.
Software is used appropriately with work’s objectives.
Technology is used for quick and easy communication in the
organizations.
Different kinds of technology are used to complete the
organizations’ mission.
Modern technology is used to design an operation process
appropriately.
Technology is appropriately used to connect information from
the outside quickly and conveniently.
Tools and office supplies are enough for all employees
Organizations distribute adequate amount of power of decision
making in operation in order to reach the goal.
.611
.606
.569
.562
.534
.520
.494
.469
.390
Eigen value =4.494, % of Variance =4.731
Table 11 demonstrates obstacle 6, technology and data communication for operation,
including 9 variables. The factor loading is between .390 - .661with the Eigen value at 4.494.
The highest factor loading is the item no. 2.9, “Organizations provide enough budgets to
improve technology” (.66d1).
Table 12: Obstacle 7: Employee attachment
Item
No.
Variables Factor
Loading
5.2
5.3
5.4
You are feeling that you are an important part of your
organization.
You are proud of your organization.
You are ready to protect your organization’s reputation.
.638
.622
.616
Eigen value =2.663, % of Variance =2.803
Table 12 demonstrates obstacle 7, employee attachment, containing 3 variables. The factor
loading is between.616 - .638 with the Eigen value at 2.663. The highest factor loading is the
item no. 5.2, “You are feeling that you are an important part of your organization” (.638).

International Journal of Renewable Energy, Vol. 11, No. 2, July - December 2016
14
5. Conclusion
The result of the study revealed that the most important obstacle of using reverse logistics
to reduce energy consumption was the relationship between employees and their
organizations. The second was organizational structure, and the third important one was
organizational atmosphere.
When analyzed with the factor analysis, the obstacles to reduce energy consumption by
using reverse logistics turned to be seven obstacles. The obstacle that had highest factor
loading was the organizational climate and relationship in the organization. Each variable of
the first obstacle was analyzed. It was found that creating a positive relationship between
personnel in all levels was the most concerning factor. Moreover, executives should give an
opportunity to employees in decision making based on accurate information. Organizational
climate should be one key to stimulate challenging work. Working environment should
promote a positive atmosphere for team works and daily working. Employees should have
freedom in creating their working style by not holding on only a traditional style. Besides, the
unity between all personnel was important.
The obstacle 2 was the organizational structure and management. The main factor was the
appropriateness of dividing departments or teams based on the numbers of employees. That
mean in a department or a team, the organization should place an adequate number of
personnel to work in that particular department or team. The next factor was the chain of
command that could contribute to employees to be able to coordinate easily. Organizations
should support employees’ training to develop themselves in different skills. Job description
should be clear and in a written form. Moreover, job rotation should be flexible and managed
systematically.
Obstacle 3 was workers’ efficiency. The main factor was the employees themselves. They
needed to be a person who was farsighted and able to predict the trend of their own
organization. Then they could be able to determine their working direction that could go
along well with the change of the organization. They should be a person who was eager to
learn and brought their new knowledge to improve their work as well as took a part to help
stimulate others to be creative in their working style. Furthermore, they should be able to deal
with all problems and be able to use new management technology effectively with their work.
The last important factor was the employee should be a moral person.
The obstacle 4 was the organizational culture. The main factor was culture participation.
Employees concerned with if they could be able to participate in some decision making.
Therefore, organizations should give them an opportunity to set goals, work in teams, and
brainstorm. It would help employees to have their own goal to accomplish their work that was
associated with the organizations’ goals.
The obstacle 5 was the workers’ devotion. The main factors were employees devoted
themselves both from brain power and physical strength to take responsibility in their work.
Besides, they accepted in limitation and visions or goals of their organizations in all cases.
The obstacle 6 was technology and data communication for operation. The main factor was
the sufficient budgets. Budgets were the key to improve technology to be up-to-date all the
time as well as to provide enough numbers of technology devices to the employees. Modern
and adequate numbers of technology devices could help in coordination and communication
both inside and outside organizations. It would help the organizations to easily accomplish in
their works. Sharma, Panda, Mahapatra, and Sahu [25] stated that information and technology
systems were a key that support reverse logistics in many stages. They were necessary in
completing the product life cycle.

International Journal of Renewable Energy, Vol. 11, No. 2, July - December 2016
15
The obstacle 7 was employee attachment. The main factor was that employees felt that they
were a part of an important organization. They were proud to work with their organization and
delighted to protect their organization’s reputation.
Finally, this research mainly focused on the workers’ view as they were the main operators
of the organization. The results would reveal some important information for a policy person
or an owner to help with the organizational management. The result would reflect some
problems and needs from their own workers and find a right solution, especially when they
needed their workers to support them with the energy consumption reductions.
6. Suggestions
In order to use the reverse logistics effectively, organizations could not choose to deal with
only one obstacle at a time. They need to handle all obstacles simultaneously because some of
them may relate to one another. However, organizations need to pay more attention on the
factors and variables that have more effect on operation, and then they could later handle the
less ones.
For the future research, to gain more insight on the obstacle of using reverse logistics, a
study could examine the relationship between each variable in the same factor if they would be
related to each other, especially the ones that have the closed value of factor loading.
Moreover, a study could be conducted on different industries or on different sample groups
like policy person or owners of the organization.
References
[1] Office of Small and Medium Enterprises Promotion (2012).โครงการการศกษาสถานภาพและแนวโนมการยายฐานธรกจของบรษทสญชาตญปนมายงประเทศไทย [A project for a study of status and trend
of Japanese company relocation to Thailand]. Available:
http://www.sme.go.th/SiteCollectionDocuments
[2] Ministry of Energy (2011). Thailand 20-year energy efficiency development plan
(2011-2030).Available: http://www.enconfund.go.th/pdf/index/EEDP_Eng.pdf
[3] Kaiser, U. (2015). Thailand Automotive Sales 2008-2020. Thai Auto book 2015.
[4] Thailand Automotive Institute (2012). Master plan for automotive industry 2012-
2016. Available: http://www.thaiauto.or.th/2012/
[5] Dowlatshahi, S. (2000). Theory of reverse logistics. Interfaces, 30(3), pp. 143-155.
[6] Smith, A. D. (2005). Reverse logistics programs: gauging their effects on CRM and
online behavior. Vine, 35(3), pp. 166-181.
[7] Rogers, D. S., &Tibben-Lembke, R. S. (1998). Going backward: Reverse logistics
trends and practice. Available:
http://www.abrelpe.org.br/imagens_intranet/files/logistica_reversa.pdf
[8] Office of Small and Medium Enterprises Promotion (2014). บทสรปผบรหารรายงานสถานการณวสาหกจขนาดกลางและขนาดยอม (SMEs) ป 2557[Executive summary: A report of small and
medium enterprises in 2014]Available:
http://www.sme.go.th/th/images/data/SR/download/ 2014/07july
[9] Hawks, K. (2006). What is reverse logistics. Reverse Logistics Magazine. Available:
http://www.rlmagazine.com/edition01p12.php

International Journal of Renewable Energy, Vol. 11, No. 2, July - December 2016
16
[10] Moe, Z, & Jin, Y. (2014). Reverse logistics in automotive industry: A multiple case
study in automotive industry (Master thesis). Available:
http://hig.diva-portal.org/smash/get/diva2:725973/FULLTEXT01.pdf
[11] Tepprasit, P., & Yuwanont, P. (2015). The impact of logistics management on reverse
logistics in Thailand’s electronics industry. International Journal of Business and
Information, 10(2), pp. 257-271.
[12] Ramerez, A. M., & Morales, V. J. G. (2011). Effect of reverse logistics and flexibility
on organizational performance. Economics and Management, 16, pp. 873-881.
[13] Steer, R. M. (1977). Organizational effectiveness: A behavior view. Santa Monica,
CA: Goodyear Publishing Company, Inc.
[14] Robbins, S. P. (1990). Organizational theory: Structure, design, and application
(3rd ed.). Englewood Cliffs, NJ: Prentice Hall.
[15] Hall, R. H. (1996). Organizations: Structure and press (6th ed.). Englewood Cliffs,
NJ: Prentice-Hall.
[16] Owens, R. G. (1996). Organizational behavior in education. Boston, MA: Allyn &
Bacon.
[17] Scott, Scott, W. R. (1992). Organizations rational, natural and open system (3rd ed.).
NJ: Prentice-Hall.
[18] Hodge, B. J., & Anthony, W. P. (1994). Organization theory (4th ed.) Boston, MA:
Allyn & Bacon.
[19] Rothwell, W. J., & Kazanas, H. C. (1998). Mastering the instructional design process
(2nd ed.). San Francisco,CA: Jossey- Bass Pfeiffer & Wiley.
[20] Chung, K. H., & Megginson, L. C. (1981). Organizational behavior: Developing
managerial skills.NY: Harper & Row.
[21] Schwartz, R., & Davis, S. (1981). Matching corporate culture and business strategy.
Organizational Dynamics, 10, pp. 30-48.
[22] Cherrington, D. J. (1989). Organizational behavior: The management of individual
and organizational performance. Boston, MN: Allyn & Bacon.
[23] Yamane, T. (1967). Statistics: An introductory analysis. New York, NY: Harper and
Row.
[24] Kline, P. 9(1994). An easy guide to factor analysis. London: Routledge.
[25] Sharma, S. K., Panda, B. N., Mahapatra, S. S., &Sahu, S. (2011). Analysis of Barriers
for reverse logistics: An Indian perspective. International Journal of Modeling and
Optimization, 1(2), pp. 101-106.