The Experimental Political Scientist - Harvard...
31
Newsletter of the APSA Experimental Section 2012 Volume 3 Issue 2 The Experimental Political Scientist In this issue • Ryan and Broockman: Facebook • Redlawsk: Process Tracing • Kramon and Weghorst: List experiments in the field • Anand: Review of Sinclair • Woon: Review of Clarke and Primo • Announcements From the Editor Welcome to the next issue of the Experimental Political Sci- entist. Leading off is a discussion by Ryan and Broockman on how to use Facebook for field experiments. Next Red- lawsk takes us through the history and innovations of the Dynamic Process Tracing platform. Kramon and Weghorst deliver a fascinating analysis of asking sensitive survey questions using list experiments in developing countries. Fi- nally, we have two excellent book reviews. Jonathan Woon takes on the controversial book by Clarke and Primo and Anand reviews the pathbreaking book “The Social Citizen” by Sinclair. Thanks to all the contributors. Special thanks to the “field” editors: Dan Myers, Jonathan Renshon, and Kristin Michelitch. PLEASE send contributions (or ideas) for the spring newsletter, deadline April 15th. Happy ex- perimentation! Information on Joining or Contributing The Experimental Political Scientist is the official newsletter of APSA Organized Experiments section 42. To receive the newsletters register for the section ($8/yr!) at http://www.apsanet.org and visit us at http://ps- experiments.ucr.edu/group. Previous issues available. Send submissions to the editor. In the discipline Sadly Hurricane Irene disrupted APSA. There was lots of great stuff on tap due to the hard work by con- ference section chair Ken Williams (who has a new game theory book out, Introduction to Game Theory: A Behavioral Approach!). We’ll look forward to the upcoming experi- mental conferences (NYU and West Coast), and everyone can expect to see some great experimental papers at Midwest and other conferences. APSA has approved our journal and Rebecca Morton and Joshua Tucker will soon be circulating a call for pa- pers. The journal will be an exciting place for path breaking experimen- tal work across the sub-fields. Stay tuned for this and other announce- ments from our Section leadership. The May 2013 issue will be my last as editor, I’m hoping to get some really great submissions! I particu- larly invite submissions on best prac- tice in teaching experimental meth- ods but also on the ways experi- ments are being brought into the classroom. Dustin Tingley, Editor Harvard University Government Department 1
Transcript of The Experimental Political Scientist - Harvard...

Newsletter of the APSA Experimental Section 2012 Volume 3 Issue 2
The Experimental Political Scientist
In this issue
• Ryan and Broockman: Facebook
• Redlawsk: Process Tracing
• Kramon and Weghorst: List experiments in the field
• Anand: Review of Sinclair
• Woon: Review of Clarke and Primo
• Announcements
From the EditorWelcome to the next issue of the Experimental Political Sci-entist. Leading off is a discussion by Ryan and Broockmanon how to use Facebook for field experiments. Next Red-lawsk takes us through the history and innovations of theDynamic Process Tracing platform. Kramon and Weghorstdeliver a fascinating analysis of asking sensitive surveyquestions using list experiments in developing countries. Fi-nally, we have two excellent book reviews. Jonathan Woontakes on the controversial book by Clarke and Primo andAnand reviews the pathbreaking book “The Social Citizen”by Sinclair. Thanks to all the contributors. Special thanksto the “field” editors: Dan Myers, Jonathan Renshon, andKristin Michelitch. PLEASE send contributions (or ideas)for the spring newsletter, deadline April 15th. Happy ex-perimentation!Information on Joining or ContributingThe Experimental Political Scientist is the official newsletterof APSA Organized Experiments section 42.To receive the newsletters register for the section ($8/yr!)at http://www.apsanet.org and visit us at http://ps-experiments.ucr.edu/group. Previous issues available.Send submissions to the editor.
In the discipline
Sadly Hurricane Irene disruptedAPSA. There was lots of great stuffon tap due to the hard work by con-ference section chair Ken Williams(who has a new game theory bookout, Introduction to Game Theory:A Behavioral Approach!). We’ll lookforward to the upcoming experi-mental conferences (NYU and WestCoast), and everyone can expect tosee some great experimental papersat Midwest and other conferences.APSA has approved our journal andRebecca Morton and Joshua Tuckerwill soon be circulating a call for pa-pers. The journal will be an excitingplace for path breaking experimen-tal work across the sub-fields. Staytuned for this and other announce-ments from our Section leadership.The May 2013 issue will be my lastas editor, I’m hoping to get somereally great submissions! I particu-larly invite submissions on best prac-tice in teaching experimental meth-ods but also on the ways experi-ments are being brought into theclassroom.Dustin Tingley, EditorHarvard UniversityGovernment Department
1

Newsletter of the APSA Experimental Section 2012 Volume 3 Issue 2
Facebook: A New Frontier for Field Experiments
Timothy Ryan and David E. BroockmanUniversity of Michigan and University of California, Berkeley
[email protected]@berkeley.edu
On September 14th, 2012, someone (we know not who) became the one-billionth member of theonline social network Facebook (Facebook 2012a). As this figure suggests, online networks in general -and Facebook in particular - have rapidly become central to American social life. More than half of theUnited States’ approximately 154 million Facebook users visit the website every day (Hampton et al.2011); and for many of these users, Facebook has become the default platform to share photos,communicate with friends near and far, and announce life developments both mundane and profound.The social network is also becoming ubiquitous in new ways: more than half of Facebook’s users nowconnect to the site with mobile devices, meaning that millions of individuals carry the network’sinfluence with them as they go about their lives (Facebook 2012a).
Just as Facebook is becoming ever more central to American social life, the network is also playing agrowing role in the nation’s politics. Two-thirds of Americans on social networks use them to engage inpolitical activity such as sharing thoughts about issues and following the activities of candidates (Raineet al. 2012).1 For their part, political elites also see social media as an important tool forcommunicating with the public. At least four fifths of members of Congress now have official Facebookpages, and many maintain a separate page for campaign purposes (Congressional ManagementFoundation 2011a). Majorities of congressional staffers likewise report using social media to gaugetheir constituents’ views and to spread messages to people they typically have difficulty reaching(Congressional Management Foundation 2011b). Mitt Romney’s Digital Director Zac Moffat recentlyechoed this perception, remarking, ”[Y]ou can’t reach everyone by just television alone anymore. . . . Ifyou don’t try and have conversations [over social media], you will just miss people” (quoted in Simon2012). See Figure 1 for an example of some of these efforts in the form of politicians’ Facebookadvertising.
Students of American politics have two compelling reasons to take an interest in social media ingeneral, and Facebook in particular. First, Facebook’s ever-expanding size and reach clearly make it ofinterest in and of itself as a new political phenomenon. How will the new community, with its newways to follow and participate in politics, impact the broader political system? Second, the technologythat Facebook incorporates gives researchers new leverage on classic questions about political behavior:what makes people attend to politics, remember political information, and participate in politicalconversations? We expand on both these themes below, giving particular attention to the possibility ofusing Facebook as a new environment for conducting field experiments.
A Distinctive Political Community1Indeed, such political activity is so common on Facebook that enterprising software engineers have even developed
applications that allow users to block their friends’ apparently irksome political activity from view.
2

Newsletter of the APSA Experimental Section 2012 Volume 3 Issue 2
As a forum for political interactions, Facebook is unique in several important ways. Consider, first,the staggering volume of potentially analyzable data. Users log 3.2 billion ”likes” and comments on thesite each day (Facebook 2012b), all of which are catalogued by Facebook’s software. Of course, theprimary reason this information is recorded (other than for users to see) is for marketing purposes. As abyproduct of these efforts, however, the website is generating a vast chronicle of opinion - what peoplearound the world find interesting, motivating, attention grabbing, objectionable - that has no historicalanalogue.
Aside from being plentiful, the data have special characteristics. First, the typical Facebook user paysscant attention to the fact that nearly every click and keystroke could be analyzed for research. In lightof perennial concerns that self-reports about political participation and information exposure aresystematically biased and that individuals change their behavior when they are aware of being studied,this high level of naturalism could address measurement problems that have long vexed the study ofpolitical behavior (e.g., Sears and Freedman 1967).
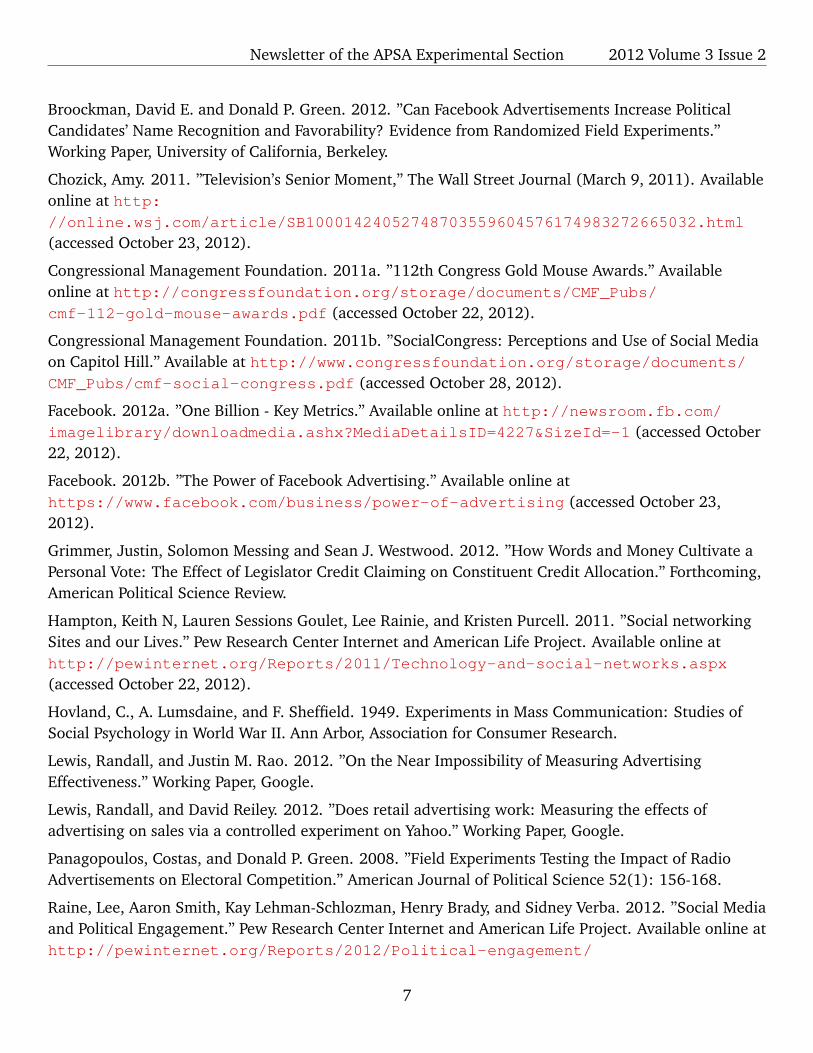
Facebook also presents researchers and practitioners with a fresh opportunity to focus an analyticalspotlight on the young. As most readers will be aware, the attitudes and behavior of youngerAmericans have become increasingly difficult to measure as they forgo (in disproportionate numbers)the land-based telephone lines that survey researchers habitually target (Blumberg and Luke 2010).Researchers also might need to give separate attention to the information streams that reach youngcitizens, as young people are much less likely to attend to traditional forms of media, such as television(Chozick 2011). Facebook’s demographic makeup is skewed in a way that countervails this deficiency,with about 40% of its U.S. users under the age of 30 (see Table 1).
Conducting Experiments on FacebookWith all the political activity being logged on Facebook, the network seems ripe for study. A
particularly enticing possibility is that Facebook might serve as an engine to continue the estimabletradition of leveraging the power of random assignment to study political communication (e.g.,Hovland, Lumsdaine, and Sheffield 1949).
With so much activity being recorded, and with advertising space readily available to purchase, itwould seem that randomized trials would be straightforward to conduct. Our explorations into thepossibility find that it is indeed possible to conduct randomized trials on Facebook, but doing sorequires the navigation of some obstacles.
The biggest complication concerns the mechanism of random assignment. Of course, perhaps themost intuitive way to assign any treatment is the individual level. This is the approach used by Bondand colleagues in their recent study of voter turnout messages on Facebook. On Election Day in 2010,each U.S. Facebook user who logged in to his or her account was randomly assigned to one of threeconditions: viewing a large banner at the top of the site with a ”social message” that encouraged votingand showed which friends had voted already, an ”informational message” that was largely the same butomitted the details about friends’ behavior, or no message at all (Bond et al. 2012).
Though such individual-level assignment is typically ideal, this avenue is not open to mostresearchers: Bond and colleagues closely collaborated with Facebook researchers and programmed a
3

Newsletter of the APSA Experimental Section 2012 Volume 3 Issue 2
highly visible intervention into Facebook’s own core infrastructure.2
Happily, implementing well-powered field experiments on Facebook does not require randomizing atthe individual user level. Rather, experimenters can apply a time-honored field experimental technique:randomly assigning clusters of individuals (cf. Arceneaux 2005). Many experiments on educationpolicy randomize at the level of schools or classrooms, rather than students; get-out-the-vote canvassesare typically randomized at the level of households or neighborhoods, not voters; and television andradio ads must be randomized at the level of media markets, not individual devices (e.g. Panagopoulosand Green 2008). With some creativity, Facebook’s advertising interface permits a clusteredrandomization of this same kind.
The approach we devised makes use of Facebook’s ability to target ads at particular userdemographics. Using Facebook’s interface, one can limit who will see an ad based on traits that nearlyall members report in their profiles, the chief ones being age, gender, and geographic location (country,state, city, or zip code). Furthermore, Facebook allows users to easily purchase many (thousands) ofads and target each separately. It is thus possible for a researcher to ”slice up” a population into manyclusters defined along demographic characteristics, randomly assigning each cluster to a particularexperimental condition.
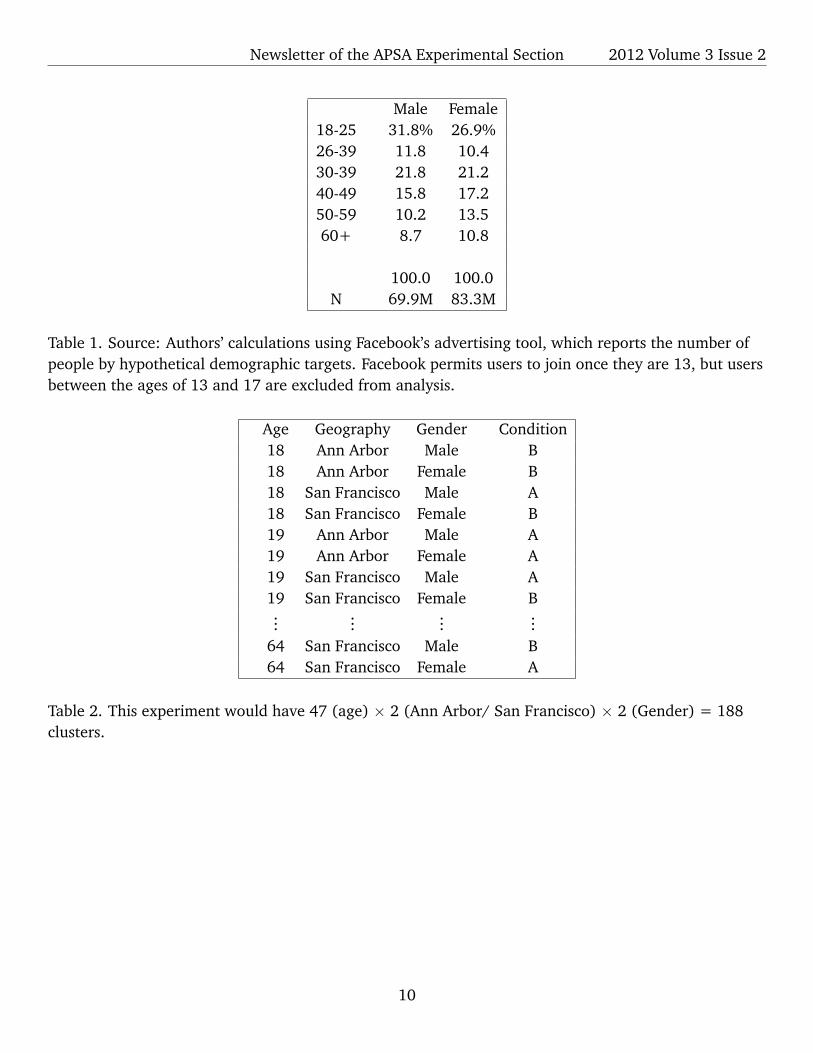
Our preferred approach for doing so is to use mutually exclusive characteristics to create disjointclusters, ensuring no crossover with respect to which users could be exposed to a particular ad (seeTable 2). For instance, in one study, 23-year-old males living in San Francisco might be assigned to viewone ad, but 23-year-old females in the city another. With several targeting dimensions available todistinguish users, and with some dimensions taking on a large number of discrete values (age andgeography in particular), it is quite easy to generate a large number of such clusters even among arelatively small population. For example, the San Francisco Bay Area alone contains 101 municipalities.Combined with 53 discrete, targetable ages (13 year olds, 14 year olds, 63 year olds, 64 year olds, 65+year olds) and two genders, its Facebook users could be cleanly divided into over 10,000 clusters basedon these categories alone. Randomizing the delivery of some treatment at the level of these ¿10,000clusters would yield an experiment less well-powered than randomizing at the level of all 7 millioninhabitants of the area, but still one that could boast ample statistical power for most applications.3
It is also possible to target advertisements on the basis of affiliations and interests members list intheir profiles (e.g., ”Democratic Party” or ”sailing”). Though these targeting criteria are less attractivefor the purposes of randomization (as they are not mutually exclusive in the way gender and age are),researchers interested in investigating how particular characteristics moderate treatment effects coulduse them to compare treatment effects among different populations.
Aside from lower statistical power, another limitation of randomizing advertisements is that, because
2See also Grimmer et al. (2012), who randomize the delivery of messages at the individual level with the help of a user-installed application, though thereby alert participants that their Facebook accounts are under study. Some researchers alsouse Facebook advertisements as a tool for subject recruitment (see Samuels and Zucco [2012] for further discussion).
3One issue with this process is that individuals may log into the site in multiple locations, so in practice researchers shouldtake care to use geographies that individuals are unlikely to cross in the course of their daily lives.
4

Newsletter of the APSA Experimental Section 2012 Volume 3 Issue 2
these treatments are woven into Facebook’s existing architecture, they preclude such novel and potentinterventions as Bond et al. employ. We see this limitation as very slight. Field experimenters often(and rightly) point to a high level of realism as a chief virtue of their approach. The limitation thusamounts to little more than a commitment by researchers to work within the same framework - its toolsand constraints - that political actors themselves do as we examine the implications of their behavior.
Measuring OutcomesHaving conducted clustered random assignment of advertisements, there are a number of possible
dependent measures that might be of interest. One class of measures concerns individuals’ activity onthe social network itself, many features of which Facebook reports to advertisers. For instance, one ofus recently reported the results of an experiment that exposed Facebook users to emotionally evocativepolitical advertisements, finding anger-inducing ads (relative to anxiety-inducing and emotionallyneutral ads) to double the likelihood that Internet users would click the ad to learn more informationon a political topic (Ryan 2012). For this study, the click-through percentage in each cluster served as anaturalistic measure of information seeking.
The set of questions for which clicks would be a sufficient dependent variable is large - we areconducting further studies of partisan selective exposure and the effect of negativity - but there are alsoopportunities for more sophisticated designs. For instance, Facebook allows users to createindividualized pages, events, and applications, each of which could in principle include a rich set ofdependent measures (e.g. donations, event RSVPs, public comments, and so forth). Political actors usethese very same tools in distributing their messages on the platform, and with the approach describedabove, researchers can employ fully randomized designs to study them.
There is no need to limit dependent measures to online behavior. By employing the randomizationprocess described above, researchers can pair online trials with tried and true research methods in anexciting synthesis. As Broockman and Green (2012) describe, the age, gender, and location measuresthat form the basis for online-only randomizations appear in most American voter files right alongsideindividuals’ telephone numbers. By pairing the clustered randomization algorithm described abovewith publicly available information on individuals in voter files, researchers can match participants intelephone polls to their treatment condition on the social network. In one study, for example,Broockman and Green thus partner with a candidate for state legislature and find Facebook adsdesigned to boost the candidate’s name recognition appear to have minimal impact: follow-uptelephone surveys found subjects in a treatment group that was targeted for an inundating advertisingcampaign were no more likely to know the candidate’s name than subjects in a control group who wereexposed to no advertisements. However, results from a second experiment also suggest that treatedvoters do recall seeing the ads at higher rates. As online advertising continues to mature, researchersthus may be able to employ this online cluster randomized design to experimentally investigate theimpacts of mass communication with much greater ease than can be done with television, newspaper,and radio advertisements.
CostNot only can Facebook advertisements be randomized with ease, they are also surprisingly cheap:
5

Newsletter of the APSA Experimental Section 2012 Volume 3 Issue 2
ads often cost less than ten cents per 1,000 ”impressions” (unique displays of the ad), or $0.0001 perexposure. This means that reasonably powered experiments can be conducted with a quite modestresearch budget: the three experiments reported by Ryan (2012), for instance, cost less than $1, 000 intotal.
We leave it to future researchers to determine whether such a strikingly low price reflects a bargainfor advertisers or a true reflection of the product’s value.4 (It may be diagnostic that advertisers arewilling to pay thousands of dollars to expose individuals to television ads, but only pennies onFacebook ads with the same reach.) The most likely possibility, we suspect, is simply that Facebook adsare good at some things and not others. Perhaps, for example, they can engender spontaneousinformation search but are not likely to cause the kind of elaboration necessary to leave a lastingimprint on memory. Or, alternatively, perhaps the advertisements only pack a punch when they contain”social stimuli”, such as in Bond and colleagues’ most effective treatment. More work is clearlynecessary to understand the impacts of this new presence in American political life, and with the toolsdescribed above researchers have many opportunities to explore its contours.
Conclusion: A Promising New Tool for ResearchersIt is an exciting time to study political communication. Just as the ways that citizens engage in
politics have exploded in number, so too have the approaches available to scholars who want tounderstand them. Along with other new resources such as Amazon.com’s Mechanical Turk service (e.g.,Berinsky, Huber, and Lenz 2012), we see social networking experiments as part of a rapidly expandingtoolkit the promises to enrich our understanding of political participation and communication inmyriad ways. Moreover, with so many Americans engaging in political deliberation online and beingexposed to political messages, the medium itself should capture scholarly interest. We look forward toseeing how creative researchers will put these tools to use.5
References
Arceneaux, Kevin. 2005. ”Using Cluster Randomized Field Experiments to Study Voting Behavior.”Annals of the American Academy of Political and Social Science 601: 169-179.
Berinsky, Adam, Gregory Huber, and Gabriel Lenz. 2012. ”Evaluating Online Labor Markets forExperimental Research: Amazon.com’s Mechanical Turk.” Political Analysis 20(3): 351-368.
Blumberg, Stephen J. and Julian V. Luke. 2010. ”Wireless Substitution: Early Release of EstimatesFrom the National Health Interview Survey, July-December 2010.” Available online athttp://www.cdc.gov/nchs/data/nhis/earlyrelease/wireless201106.pdf (accessedOctober 22, 2012).
Bond, Robert M., Christopher J. Fariss, Jason J. Jones, Adam D. I. Kramer, Cameron Marlow, Jaime E.Settle, and James H. Fowler. 2012. ”A 61-million-person experiment in social influence and politicalmobilization.” Nature 489: 295-298.
4Readers interested in learning more about online advertising’s impacts and pricing are directed to field experimentalwork by Lewis and Reiley (2012) and Lewis and Rao (2012).
5Both authors invite queries about the technical specifics of implementing randomized Facebook advertisements.
6
Newsletter of the APSA Experimental Section 2012 Volume 3 Issue 2
Broockman, David E. and Donald P. Green. 2012. ”Can Facebook Advertisements Increase PoliticalCandidates’ Name Recognition and Favorability? Evidence from Randomized Field Experiments.”Working Paper, University of California, Berkeley.
Chozick, Amy. 2011. ”Television’s Senior Moment,” The Wall Street Journal (March 9, 2011). Availableonline at http://online.wsj.com/article/SB10001424052748703559604576174983272665032.html
(accessed October 23, 2012).
Congressional Management Foundation. 2011a. ”112th Congress Gold Mouse Awards.” Availableonline at http://congressfoundation.org/storage/documents/CMF_Pubs/cmf-112-gold-mouse-awards.pdf (accessed October 22, 2012).
Congressional Management Foundation. 2011b. ”SocialCongress: Perceptions and Use of Social Mediaon Capitol Hill.” Available at http://www.congressfoundation.org/storage/documents/CMF_Pubs/cmf-social-congress.pdf (accessed October 28, 2012).
Facebook. 2012a. ”One Billion - Key Metrics.” Available online at http://newsroom.fb.com/imagelibrary/downloadmedia.ashx?MediaDetailsID=4227&SizeId=-1 (accessed October22, 2012).
Facebook. 2012b. ”The Power of Facebook Advertising.” Available online athttps://www.facebook.com/business/power-of-advertising (accessed October 23,2012).
Grimmer, Justin, Solomon Messing and Sean J. Westwood. 2012. ”How Words and Money Cultivate aPersonal Vote: The Effect of Legislator Credit Claiming on Constituent Credit Allocation.” Forthcoming,American Political Science Review.
Hampton, Keith N, Lauren Sessions Goulet, Lee Rainie, and Kristen Purcell. 2011. ”Social networkingSites and our Lives.” Pew Research Center Internet and American Life Project. Available online athttp://pewinternet.org/Reports/2011/Technology-and-social-networks.aspx
(accessed October 22, 2012).
Hovland, C., A. Lumsdaine, and F. Sheffield. 1949. Experiments in Mass Communication: Studies ofSocial Psychology in World War II. Ann Arbor, Association for Consumer Research.
Lewis, Randall, and Justin M. Rao. 2012. ”On the Near Impossibility of Measuring AdvertisingEffectiveness.” Working Paper, Google.
Lewis, Randall, and David Reiley. 2012. ”Does retail advertising work: Measuring the effects ofadvertising on sales via a controlled experiment on Yahoo.” Working Paper, Google.
Panagopoulos, Costas, and Donald P. Green. 2008. ”Field Experiments Testing the Impact of RadioAdvertisements on Electoral Competition.” American Journal of Political Science 52(1): 156-168.
Raine, Lee, Aaron Smith, Kay Lehman-Schlozman, Henry Brady, and Sidney Verba. 2012. ”Social Mediaand Political Engagement.” Pew Research Center Internet and American Life Project. Available online athttp://pewinternet.org/Reports/2012/Political-engagement/
7

Newsletter of the APSA Experimental Section 2012 Volume 3 Issue 2
Summary-of-Findings/Overview.aspx (accessed October 22, 2012).
Ryan, Timothy J. 2012. ”What Makes Us Click? Demonstrating Incentives for Angry Discourse withDigital-Age Field Experiments.” Journal of Politics 74(4): 1138-1152.
Samuels, David J. and Cesar Zucco Jr. 2012. ”Using Facebook as a Subject Recruitment Tool forSurvey-Experimental Research.” Working Paper, SSRN.
Sears, David O, and Jonathan Freedman. 1967. ”Selective Exposure to Information: A Critical Review.”The Public Opinion Quarterly 31(2): 194-213.
Simon, Scott. 2012. ”Social Media A New Layer for Campaign Advertising” NPR.org: Weekend EditionSaturday. Available online at http://www.npr.org/2012/10/20/163296365/social-media-a-new-layer-for-campaign-messaging?sc=17&f=7 (accessed October 23,2012).
8

Newsletter of the APSA Experimental Section 2012 Volume 3 Issue 2
Figure 1. Some political ads observed on Facebook by Ryan in October of 2012. The ads seem to reflectbroad targeting strategies on the part of candidates, since they come from both Republican andDemocrat sources, as well as from both inside and outside of Michigan (Ryan’s state of residence).
9
Newsletter of the APSA Experimental Section 2012 Volume 3 Issue 2
Male Female18-25 31.8% 26.9%26-39 11.8 10.430-39 21.8 21.240-49 15.8 17.250-59 10.2 13.560+ 8.7 10.8
100.0 100.0N 69.9M 83.3M
Table 1. Source: Authors’ calculations using Facebook’s advertising tool, which reports the number ofpeople by hypothetical demographic targets. Facebook permits users to join once they are 13, but usersbetween the ages of 13 and 17 are excluded from analysis.
Age Geography Gender Condition18 Ann Arbor Male B18 Ann Arbor Female B18 San Francisco Male A18 San Francisco Female B19 Ann Arbor Male A19 Ann Arbor Female A19 San Francisco Male A19 San Francisco Female B...
......
...64 San Francisco Male B64 San Francisco Female A
Table 2. This experiment would have 47 (age) × 2 (Ann Arbor/ San Francisco) × 2 (Gender) = 188clusters.
10

Newsletter of the APSA Experimental Section 2012 Volume 3 Issue 2
Using Dynamic Process Tracing to Study Decision Making: ALaboratory Research Tool for the Scholarly Community
David P. RedlawskDepartment of Political Science and Eagleton Institute of Politics, Rutgers University
Over the years, Rick Lau and I have argued that the dynamics of decision making cannot be studiedeffectively with static approaches, such as cross sectional survey research. Instead, what is needed is amethodology designed from the start to follow decision makers as they make their evaluations andchoices. It’s all well and good to ask people to recall what they looked at, or how they felt about theinformation they acquired prior to a decision, but human beings are notoriously unable to recall manyof the specifics they encounter on the way to a decision. As is now well-established, evaluations ofsocial objects - like candidates - often proceed online, with the details that informed the evaluationdiscarded or at least relatively inaccessible after the fact (Lodge, McGraw, and Stroh, 1989, Kunda,1987, Redlawsk, 2001.) This is not to say that memory plays no role (Lau and Redlawsk, 2006;Civettini and Redlawsk, 2009), but even to the extent that it does, memory recall is rarely, if ever, aperfect representation of the information that informed the decision. Whether evaluation and choiceare online processes, memory processes, or some hybrid of the two, the best way to study the dynamicsof a decision is as it happens. Obviously that position suggests that laboratory studies are an importanttool in decision making research.
This perspective on decision making generally, and voter decision making specifically, led Lau and Ito develop the Dynamic Process Tracing Environment (DPTE) used by us in a wide range ofexperimental studies on voter decision making. The initial DPTE research, summarized in our 2006book, How Voter Decide (Cambridge University Press) and a number of papers on cognitive heuristics,online processing, and motivated reasoning, opened new perspectives on limited informationprocessing versus rational decision making models, the role of affect in driving motivated reasoning,and of course, the concept of ”Voting Correctly” (Lau and Redlawsk, 1997). This short report brieflydescribes some of my own and colleagues’ research that has been stimulated by the availability of thistool, and describes how researchers can get access to this tool which is now available online.
Much of my decision making research beyond the initial information processing studies has focusedon emotional responses to candidates, using DPTE experiments to understand the interplay betweenemotional and cognitive processing as voters encounter a campaign. Early on I was intrigued by thefindings of Milt Lodge and his colleagues on online processing (Lodge, McGraw, and Stroh, 1989;Lodge, Steenbergen, and Brau, 1995) and motivated skepticism (Taber and Lodge, 2006; also see anew issue of Critical Review 24(2): 2012, devoted to their theory) but also unsure of how they mightapply to the dynamics of a political campaign, which are always changing and involve multiple players.At the same time, George Marcus and his colleagues (Marcus, Neuman, and MacKuen, 2000) developeda theory of affective intelligence, which argued that emotions - anxiety in particular - could lead tobetter voter decision making. Together these theories suggested that affect could both improve voter
11
Newsletter of the APSA Experimental Section 2012 Volume 3 Issue 2
decision making (AI) or lead it astray (motivated skepticism).
Both theories provide important insights into decision making and pushed the field to go beyond thepurely information processing paradigm that had developed in the 1980’s and 1990s. But both weredeveloped using static techniques, either survey research via ANES data for Marcus or relatively simplelaboratory studies of a single candidate outside of an election context (Lodge and colleagues’ onlineprocessing studies.) Having a new tool at hand - the earliest version of Dynamic Process Tracing - Isought to understand if there were contexts in which the two approaches could be reconciled, if nottheoretically, at least empirically. In particular, it seemed necessary to test online versus memoryprocessing, and the idea that rising anxiety would lead to increased information search and potentiallybetter decisions, in the complex context of a campaign with competing candidates.
In brief, DPTE has been used to confirm that online processing is a default processing mode forvoters in a campaign environment but that memory plays an important role in the process of making achoice, as opposed to simply developing an evaluation (Redlawsk, 2001, Redlawsk, 2006; Lau andRedlawsk, 2006.) Given the presence of online processing, Lodge and Taber (2000) argued that votersmight be motivated reasoners, something a DPTE study confirmed (Redlawsk, 2002.) But at the sametime, evidence appeared in our process tracing data for a process that looked like affective intelligence,under conditions of increasing threat to pre-conceived preferences (Redlawsk, Civettini, and Lau,2007). Are these contradictory? That is, can voters simultaneously become more careful processors,and more knowledgeable about their choices, and yet be motivated to maintain an existing evaluationeven when that evaluation is no longer supported by the facts? One possibility is that there is in factwhat we call an ”affective tipping point”, a point at which even the strongest motivated reasonerrecognizes reality and rather than continuing to strengthen a positive evaluation in the face of negativeinformation, finally begins to update more accurately for the remainder of the campaign (Redlawsk,Civettini, and Emmerson, 2010). Motivated reasoning may initially be triggered when unexpected(negative) information about a liked candidate is encountered. But if more negative informationaccumulates, maintaining a positive evaluation appears to be anxiety-provoking, leading to thepotential for reassessment and a readjustment.
What all of these studies have in common is their methodology, unabashedly laboratory studies, butdesigned in a complex environment that can mimic the potential chaos of a campaign environment. Byconceiving of evaluation and choice as a process, rather than a static thing, we can better account forhow candidate evaluations are developed and updated and the joint role of emotion and cognition.
During the past few years my primary focus has been on the development of DPTE as a flexibleresearch tool for laboratory and online studies of decision making processes. The National ScienceFoundation has funded this software development effort, which has resulted in a system now availableto the research community as a whole. The basic paradigm is that the system can be programmed topresent information in video, image, or text formats, which subjects may choose to examine as theymove towards making evaluations and choosing between alternatives. The experimenter has a widerange of options to create a flexible process-tracing experiment, where every action taken by the subjectis recorded, enhancing our ability to understand decision-making as it happens. Moreover, recently
12

Newsletter of the APSA Experimental Section 2012 Volume 3 Issue 2
added features allow the development of social experiments, where participants can choose to share,like, dislike, or comment on the information they see during an experiment.
While Rick Lau, our students and early adopter colleagues, and I have mostly applied it to votingstudies, DPTE can be used to study any type of decision-making process in which information flowsover time. Examples include studies of decision making in times of crisis, studies of the effects ofinformation sources and credibility, studies of public policy debates and referenda, and many others.This tool provides an experimental environment in which decision makers encounter information thatcomes and goes over time, make active choices of what information to examine and what to ignore, arepossibly exposed information they did not select, and ultimately choose between alternatives, orperhaps make no choice at all. Our hope is that this new methodology will enhance the ability of thosedoing behavioral decision making research to test hypotheses about how people process information -cognitively and emotionally - over time.
Any researcher wishing to use the software may acquire a user ID by navigating to the site:http://www.processtracing.org and clicking on the ”Request Researcher ID” link. You will be asked toprovide some information and upon approval a link will be sent to allow you to set up your account.The user guide for the software is also available at this location, by clicking on the ”Help” link. We haverecently begun a blog to describe how the system is being used and to provide tips and techniques fordesigning experiments, which can be accessed at http://dynamicprocesstracing.wordpress.com.
Ultimately, our goal is to make a new research tool available to the scholarly community that allowsbehavioral researchers to conduct sophisticated computer-based experiments on human decisionmaking and social behavior in dynamic settings without devoting years to acquiring the requisiteprogramming skills. It is our belief that while we began this project focused on how voters useinformation to evaluate candidates and make a voting decision; a much wider array of studies can becarried out using the DPTE methodology. Examples include studies of decision making in times of crisis,studies of the effects of information sources and credibility, studies of public policy debates andreferenda, and many others. The key point of this methodology is to provide an experimentalenvironment in which decision makers encounter information that comes and goes over time, makeactive choices of what information to examine and what to ignore, and ultimately choose betweenalternatives, or perhaps make no choice at all. Our hope is that this new methodology will enhance theability of those doing behavioral decision making research to test hypotheses about how people processinformation - cognitively and emotionally - over time.
References
Civettini, Andrew and David P. Redlawsk. 2009. Voters, Emotions, and Memory. Political Psychology30(1): 125-151.Kunda, Z. 1990. The Case for Motivated Reasoning. Psychological Bulletin, 1083: 480 - 498.Lau, Richard R. and David P. Redlawsk. 1997. Voting Correctly. American Political Science Review, 91(September): 585-598.
13

Newsletter of the APSA Experimental Section 2012 Volume 3 Issue 2
Lau Richard R. and David P. Redlawsk. 2001. Advantages and Disadvantages of Cognitive Heuristics inPolitical Decision Making. American Journal of Political Science 45(October): 951-971.Lau, Richard R. and David P. Redlawsk. 2006. How Voters Decide: Information Processing during anElection Campaign. New York: Cambridge University Press.Lodge, Milton, McGraw, Kathleen., and Stroh, Patrick 1989. An impression driven model of candidateevaluation. American Political Science Review 83:399-419.Lodge, Milton, Marco R. Steenbergen, and Shawn Brau. 1995. The Responsive Voter: CampaignInformation and the Dynamics of Candidate Evaluation. American Political Science Review, 89(June):309-326.Marcus, George, W. Russell Neuman, and Michael McKuen. 2000. Affective Intelligence and PoliticalJudgment. Chicago: University of Chicago Press.Redlawsk, David P. 2001. You Must Remember This: A Test of the On-line Model of Voting. Journal ofPolitics, 63(February): 29-58.Redlawsk, David P. 2002. Hot Cognition or Cool Consideration? Testing the Effects of MotivatedReasoning on Political Decision Making. Journal of Politics 64(November): 1021-1044.Redlawsk, David P. 2006. Motivated Reasoning, Affect, and the Role of Memory in VoterDecision-Making. In David Redlawsk (Ed.) Feeling Politics: Emotion in Political Information Processing.New York: Palgrave Macmillan.Redlawsk, David P., Andrew Civettini, and Karen Emmerson. 2010. The Affective Tipping Point: DoMotivated Reasoners ever ”Get It”? Political Psychology 31(4): 563-593.Redlawsk, David, Andrew Civettini, and Richard R. Lau. 2007. Affective Intelligence and VoterInformation. In W. Russell Neuman, George Marcus, Michael MacKuen and Ann Crigler (Eds.) TheAffect Effect: Dynamics of Emotion in Political Thinking and Behavior. Chicago: University of ChicagoPress.Taber, C. S. and Lodge, M. 2006. Motivated Skepticism in the Evaluation of Political Beliefs. AmericanJournal of Political Science 50: 755-769.
Measuring Sensitive Attitudes in Developing Countries: Lessonsfrom Implementing the List Experiment
Eric Kramon and Keith R. [email protected] and [email protected]
UCLA/Stanford University and University of Florida
Lessons on using the List Experiment in Developing CountriesWith the spread of elections to new democracies and undemocratic regimes has risen attention
towards electoral violence, fraud, and clientelism. The corresponding growth in related scholarship isstriking, as shown in figure 1. Conventional tools for collecting citizens’ viewpoints about thesephenomena, however, are woefully inadequate. In sub-saharan Africa, where up to 45% of respondents
14

Newsletter of the APSA Experimental Section 2012 Volume 3 Issue 2
suspect public opinion surveys are carried out by the government,6 incentives to lie about selling votesfor cash or engaging in political violence are often too great to gather reliable public opinion data.
Figure 1: Increasing Popularity of Hard to Measure Topics
Figure 1 shows the percentage of books in the English-languagecorpus from 1950 to 2008 that contain the bigrams “electionviolence,” “election fraud,” and and “vote buying.” Created withGoogle’s nGram Viewer.
The “list experiment” is an increasingly popular alternative to direct question formats that offersrespondents more anonymity, but at the cost of additional complexity. What remains to be seen iswhether assumptions about the steps individuals take to answer such questions are valid in low-incomeenvironments, where both respondent literacy and numeracy rates are low and sensitivity biases aboutthese topics abound. In what follows, we discuss our attempts to validate these assumptions indeveloping countries. We offer evidence of a central problem with list experiments in these settings:respondents satisfice by skipping key steps in the response process, steps that are key to collecting validlist experimental data. We then discuss two modifications of the list experiment that address theproblem of satisficing and offer a general set of lessons for carrying out list experiments in developingcountry settings.
What are list experiments?The list experiment (alternately called the “item count technique”) combines elements of
randomization and aggregation to draw inference about sensitive attitudes and behaviors in a way thatcannot later be directly linked to respondents. In its simplest form, the list experiment randomlyassigns respondents into treatment and control groups. Control group respondents are given a list ofstatements about non-sensitive attitudes or activities that are not subject to response bias (typicallythree or four items). Treatment group respondents receive a list with the same non-sensitive items andthe sensitive item of interest. All respondents are instructed to respond with the total number ofapplicable items. Random assignment implies that the number of applicable non-sensitive items will bethe same for treatment and control groups. Provided that the addition of the sensitive item does not
6Based on Afrobarometer’s 2008 survey in 20 countries in the sub-continent, with an additional 15% suspecting politicalinstitutions like the parliament and political parties.
15

Newsletter of the APSA Experimental Section 2012 Volume 3 Issue 2
impact how respondents consider the non-sensitive ones (“no design effects”) and respondents aretruthful (“no liars”) the difference of means between treatment and control groups provides anunbiased estimate of the proportion of the population to whom the sensitive item applies (Blair andImai, 2012). The technique is evidenced to successfully reduce downward biases about sensitivepolitical behaviors and attitudes, from voter turnout (Holbrook and Krosnick, 2010), the influence ofracism and sexism on candidate preferences (Kane et al., 2004; Kuklinski et al., 1997; Martinez andCraig, 2010; Rayburn et al., 2003; Streb et al., 2008) views on political violence (Weghorst, 2012) andexperience with vote-buying (Gonzalez-Ocantos et al., 2011). In spite of these encouragingdevelopments in the use of list experiments, there remain many unresolved questions about their abilityto provide unbiased estimates of sensitive behaviors.
Learning by experience with list experiments in sub-Saharan AfricaWe have carried out a total of eleven list experiments in Kenya and Tanzania from 2009-2012. They
have been in different regions of the countries with distinctive population subgroups (citizens andlegislators) and in diverse environments, including face-to-face interviews in household and publicsettings and self-administered instruments in classroom and “take-home” settings.7 To date, we havefound that the list experiment can effectively reduce sensitivity biases about vote-buying and views onelectoral fraud, political violence, and government repression. Our research has also allowed us toexplore many empirical properties of the list experiment in developing country settings, where thepopularity of the technique has increased greatly over recent years.
An important lesson from these projects has been that the list experiment obliges respondents toexpend more cognitive effort to accurately provide answers than do conventional question formats. Wehave further observed that the additional necessary effort is much greater in environments with lowlevels of education, literacy, and numeracy. Like all survey questions, each list experiment item requirescareful consideration of its meaning, recalling all information necessary to evaluate it, and synthesizingthe information into a summary judgment used to provide a response (Tourangeau, 1984). Unlikedirect questions, list experiments also introduce unfamiliar instructions and ask respondents to hideindividual item evaluations and instead internally aggregate judgments across many statements into anumerical value. If respondents view these tasks together as too burdensome or taxing, the listexperiment can induce response effects. Our research has culminated into an exploration of a specificresponse effect known as “satisficing.” Satisficing occurs when an interviewee skips one or more steprequired to fully answer a survey question and only puts forth enough effort to provide a response he orshe deems acceptable or satisfactory (Krosnick, 1991). For list experiments, satisficing could occur if,instead of extensively evaluating each item and counting in their heads, respondents simply report anumerical value they think is reasonable.
Satisficing should be observable when responses to direct questions about list items do not match theinformation provided about those items in a list experiment format. Detecting satisficing with listexperimental data, however, is difficult due to the sensitivity biases of direct questions and potentialcomplexity of control items. In our most recent round of data collection, we developed a test of
7More information on these list experiments can be found at www.ericjkramon.com and www.keithweghorst.com
16

Newsletter of the APSA Experimental Section 2012 Volume 3 Issue 2
satsificing using simple items that facilitated easy recall and would not be subject to sensitivity biases.We generated two lists of entirely non-sensitive activities which respondents readily remember. Thefirst asked how many of five foods were consumed in the week prior and the second how many of fivenumeracy related activities were performed in the last month. The latter included things like sendingmoney over mobile phone (mPESA) and selling goods for profit. Enumerators administered these itemsin the conventional list experiment format and then, about five minutes later in the survey, askedrespondents about each of the items as direct “Yes/No” questions. The results suggested that listexperiments in this setting—urban slums in Kenya—are rife with satisficing. For both lists, more than40% of respondents’ list experiment responses did not match the true value identified through directquestions. Figure 2 illustrates the prevalence of satisficing, measured as the difference in the number ofapplicable items elicited through the two formats. Zero represents a match. Negative values showunder-predictions of the list experiment and positive values over-predictions.
Figure 2: Testing for Satisficing with non-sensitive list experiments
0.6
5.1
18.7
54.7
14.7
4.8
0.8 0.2 0.2 0.2 0.22.7
19.2
58.5
16.2
2.50.4
05
10
15
20
25
30
35
40
45
50
55
60
05
10
15
20
25
30
35
40
45
50
55
60
-4 -3 -2 -1 0 1 2 3 4 5 -4 -3 -2 -1 0 1 2 3 4 5
Food List Activity List
Perc
ent
of
Res
ponden
ts
[List Response - Total Individual Items]Graphs by food_vs_activity
Comparing Responses to List Experiment and Direct Question Formats
Figure 2 shows the frequency distribution of the difference between thenumber of foods and activities indicated by respondents for the list ex-periment format and direct questions. Instances of of non-matches wereslightly skewed towards under-reporting, with 24% and 22%of intervie-wees reporting a lower number of items for the list experiment than forthe direct question, respectively.
Analysis of what determines non-matches revealed that each additional level of educationalattainment is associated with a 20% higher probability of matches between the two formats for both
17

Newsletter of the APSA Experimental Section 2012 Volume 3 Issue 2
the food and activity lists. We want to be very clear that we do not think these list experiments failedfor lower education subgroups because of respondent intelligence, particularly because educationalattainment in developing countries is frequently determined by societal factors—gender, birth order,family income, etc. Rather, we view education as a crude indicator of experience with higher ordercognitive tasks and the cognitive sophistication required to optimally answer list experiment questions.When respondents lack experience using these skills, the effort a respondent must put forth appearssimply too great to obtain accurate answers. The same holds for numerical literacy: using the totalnumber of numeracy related activities as an indicators of this, we find respondents who engage in fewernumerical activities are less likely to match between list experiments and direct questions for the food.
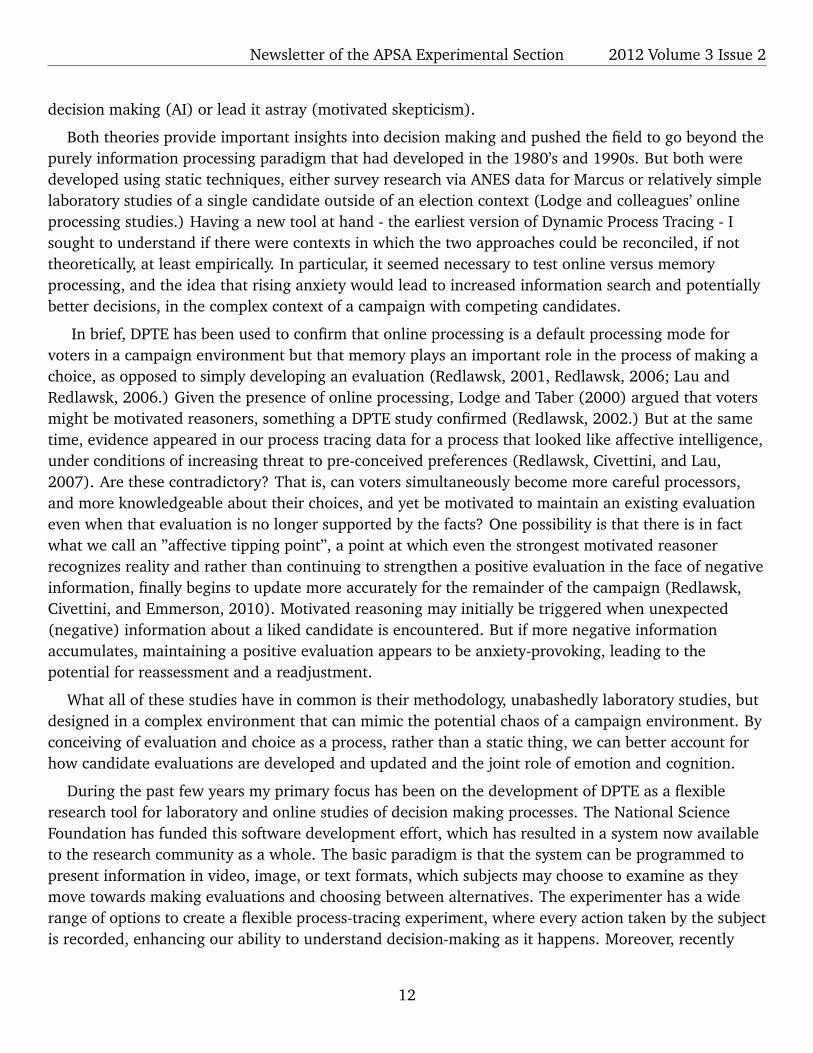
To address the satisficing problem, we modified list experiments procedures in two ways. Ourmodifications aimed to (1) make each item’s meaning quickly clear to respondents, (2) easeaggregation by allowing private visual cues and note-taking, (3) build on familiar tools used tocommunicate about politics, and (4) encourage full effort by making list experiments more active andengaging for respondents. The first modification provided respondents with a laminated copy of the listand a dry erase marker. Enumerators showed respondents how to use a dry erase marker on thelaminate—ticking the sheet and erasing marks with a fingertip—handed the materials over, turned 90degrees away, and read the lists. Our second innovation also provided respondent handouts and hadthe enumerator turn 90 degrees away from the respondent. The second set of handouts containedcartoons we commissioned that corresponded with each item on the list. Cartoons are commonly usedby NGOs and development agencies—including for public campaigns to reduce political violence andfraud—in settings of low literacy and educational attainment, where we expect satisficing to be mostprevalent. They are also captivating and more familiar to respondents than the list experiment. Figure3 is one such cartoon we used in Kenya, corresponding with the statement “If another tribe tries to stealan election, it is justified to use violence to try to stop them” and shows a thief attempting tomanipulate presidential election results, while others look on.8
We presented respondents with the list experiment in its standard form and at a different part of thesurvey as one of the modifications to test their efficacy.9 For the full sample, respondents reported thatviolence was justified at lower rates with the conventional list experiment format than they did thedirect question, the opposite of what we would expect given the downward sensitivity biases presentwith direct questions. By comparison, the tick and cartoon modifications yielded higher prevalencerates than the conventional list experiment and the direct question. We interpret this as themodifications enhancing the performance of the list experiment. The improvements for the cartoonmodification were most pronounced for low education and low numeracy respondents, while those forthe tick procedure occurred more broadly across education and numeracy subgroups.
We also think we have addressed the issue of satisficing, which is supported by figure 4. This figurepresents results for the “satisficers,” whose list experiment and direct question responses did not match
8In order to ensure using cartoons did not somehow trivialize violence—an ethically troubling issue that also could reducesensitivity biases—we used the word “Mwizi,” a very serious Kiswahili term for “thief” which is rarely, if ever, used with levity.
9We randomized whether a respondent received the standard or modified form first and distracted respondents withadditional and unrelated questions in-between, including the food and activity lists.
18

Newsletter of the APSA Experimental Section 2012 Volume 3 Issue 2
Figure 3: Cartoon Corresponding with Violence Statement
for both the food and activity lists. It provides evidence of satisficing (that the standard list experimentunder-predicts the sensitive behavior) but that the cartoon and tick modifications show higherprevalence of the sensitive attitude.
Lessons for Carrying Out List ExperimentsWe now offer suggestions for designing and implementing list experiments. We do not discuss
growth in analytical tools for list experimental data, but laud contributions that include double-listexperiment designs that reduce inefficiency of group-level comparisons (Droitcur et al., 1990; Glynn,2010), ways to detect violations of certain list experiment assumptions (Blair and Imai, 2012) andstatistical packages that allow multivariate (Corstange, 2009) and individual-level analyses (Blair andImai, 2012).1. Low-cost, seasoned tools over high-tech, unfamiliar solutions
Our modifications were very low cost—dry erase markers, printing and laminating handouts, and afew hundred dollars in cartoon commissions. Instructing enumerators to use them was easy and theyresonated with respondents. The cartoon modification built on NGOs and development agenciessuccess in communicating complex and unfamiliar topics. We believe an alternative like electronicdevices that allow respondents to privately enter responses would have dramatically increased projectcosts without actually addressing the underlying factors contributing to list experiment breakdown. Fora technique already difficult enough to induce satisficing, new technologies can exacerbate theunfamiliarity of list experiments.2. Make privacy more credible
In face-to-face interviews, offering respondents a way to privately tabulate items may reducesatisficing. However, potential fears that a pen-stroke or other more subtle physical responses aredetectable when listening to items must be addressed by making privacy real to respondents. In our
19

Newsletter of the APSA Experimental Section 2012 Volume 3 Issue 2
Figure 4: Estimates of Agreement with the Sensitive Item Among “Satisficers”
Direct Standard Cartoon Tick
Question Mode
Pro
porti
on W
ho A
gree
Tha
t Vio
lenc
e Is
Jus
tifie
d
0.0
0.1
0.2
0.3
0.4
0.5
0.6
0.7
Figure 4 shows the estimated agreement with the statement“If anothertribe tries to steal an election, it is justified to use violence to try to stopthem” for the 108 individuals who did failed to match on both the foodor activity lists presented in figure 2. It compares the direct question,standard list experiment design, and our cartoon and tick modifications.
experience, the combination of visual aids with and enumerators turning 90 degrees away worked.Creating a secure environment requires understanding privacy concerns of respondents have andcarries a strong ethical obligation to ensure the technique hides an individuals view on the sensitiveitem.3. Find instructions that work
Respondent instructions for introducing the list experiment are extremely important, as they musteffectively discourage respondents from identifying which specific items apply to them. Firstly, workcarefully with enumerators to develop simple instructions that interviewees easily internalize. Secondly,pre-test instructions with respondents from the target population. You may find first administering anartificial list is necessary for respondents to understand how the list experiment works. Thirdly, inaddition to a survey’s standard definitions and feedback manuals, develop enumerator protocols forwhen respondents need additional instructions to understand the list experiment. In our experience,enumerators who try to explain the list experiment to respondents without guided instructionsfrequently point to the secrecy the technique provides (e.g., “A special kind of question that hides yourindividual answers about vote-buying but lets us see much there is in Kenya in general”). We caution
20

Newsletter of the APSA Experimental Section 2012 Volume 3 Issue 2
against enumerator protocols that specifically note how secrecy should lead to higher reporting rates ofthe sensitive attitude, as it could induce Hawthorne effects where treatment group respondents reporthigher numbers of items as an artifact of how they think the technique “should work.”4. Keep control list items short and punchy
The effort list experiments require to optimally answer can lead to satisficing. Keeping control itemsbrief and easily interpretable can reduce this effort substantially. Using items (including the sensitiveone) in similar topical and temporal areas of respondents’ memories can make recall less laborious.Successful list experiments we have carried-out employed non-sensitive items that were only a fewwords and were accessible enough to elicit quick, “knee-jerk” reactions from respondents.5. Field test non-sensitive items
Learn a lot about people’s views towards non-sensitive items before using them on list experiments.It may be possible to start with pre-existing data—we consulted Afrobarometer surveys to anticipateresponse patterns about prospective non-sensitive items. Selecting items with predictable responsepatterns can reduce variance of control lists and, by extension, the non-sensitive items in the treatmentgroup. Well documented field tests of non-sensitive items are also important to determine what items“work” and “don’t work” for researchers who want to carry out list experiments about similar topics orin similar settings. To our knowledge, the most extensive annotation of list experiment designs,including control and treatment list items can be found at Kosuke Imai’s website.6. Standards for list experiment design are growing
• 6.1 Avoid Ceiling and Floor Effects
A control list where zero or all items could plausibly apply to a respondent cannot ensure theanonymity the design attempts to provide respondents. Known as “floor” and “ceiling” effects(Glynn, 2010), consequent advice is to include on control lists at least one item that very fewrespondents will find applicable and one that nearly all find applicable.
• 6.2 Whenever possible, ask the direct question
Asking a direct question allows us to assess how well the list experiment reduces sensitivitybiases. Because list experiments are less computationally efficient than direct questions, doing sobetter elucidates trade-offs of using one over the other. Direct questions also help us identify“smoking gun” failures, when the list experiment under-estimates the prevalence of a sensitiveattitude compared to a direct question. The most comparable direct questions will use a singlestatement with “Yes/No” response options, with a question prompt matching the list experimentinstructions (comparing “Is the following true for you? I agree that [sensitive statement]” with“How many of the statements do you agree with...?”) Ethical considerations may prohibit askingthe direction question, but we echo Blair and Imai (2012) in reiterating the importance of doingso when at all possible.
• 6.3 Consider other techniques to triangulate list experiments
There are many experimental and non-experimental techniques designed to reduce sensitivitybiases present with self-reported behaviors and attitudes. Each approach has certain trade-offs.
21

Newsletter of the APSA Experimental Section 2012 Volume 3 Issue 2
Comparing list experiment results to other alternatives can inform for what topics and in whichsettings it is most effective. In a study we carried out in Tanzania, we learned that the listexperiment was far preferable to the more complex randomized response technique (see: Warner,1965) and that the latter approach performed poorly even amongst university educatedpopulations there (Weghorst, 2012). Others have compared list experiments to endorsementexperiments and found similar results through the two techniques, lending greater confidence tothe list experiment findings (Blair, Imai, and Lyall 2012).
7. Many puzzles still remain
• 7.1: Are there item order effects?
Item order and placement may matter for several reasons. Firstly, if respondents satisfice, theymay pay closer attention to certain items simply based on their position in a list. A sensitive itemplaced at the beginning of a list might change how respondents consider subsequent items.Randomizing order can help detect ordering effects, but we recommend against randomizing bothcontrol and treatment lists. We suggest randomizing control list order and randomizing theposition of the treatment item amongst the fixed control list order to keep control and treatmentlists as similar as possible. Potential list order and sensitive item placement effects offer apromising avenue for future research.
• 7.3: Open or Closed Control Lists?
Asking respondents to elaborate which control items are applicable can improve inference(Corstange, 2009) but not if interviewees respond differently when elaborating versusaggregating themselves (Flavin and Keane, 2009; Tsuchiya and Hirai, 2010). Differentaggregation instructions for control group could mean the treatment group is simultaneouslytreated with the sensitive item and an alternative aggregation procedure, but this needs to beaddressed more extensively in future work.
• 7.2: How many non-sensitive items?
Control list length may impact the aggregated number respondents of items report, regardless ofthe applicability of non-sensitive items (Nickerson and de Jonge, 2012; Tsuchiya et al., 2007).Reasons why may lie in satisficing. Studying possible list-length effects is important for designingcontrol lists of ideal length and for list experiment inference because control and treatment listsare different lengths.
ConclusionList experiments present a promising way to elicit sensitive attitudes without suffering from biases of
self-censorships. As their appeal for studying political phenomena in the developing world, weencourage scholars to further evaluate their performance in these settings and to continue developingdesign and analysis tools that improve inferences we make from list experiment data.
22

Newsletter of the APSA Experimental Section 2012 Volume 3 Issue 2
References
Blair, Graeme and Kosuke Imai. 2012. Staistical Analysis of List Experiments. Political Analysis 20(1):47- 77.Blair, Graeme, Kosuke Imai and Jason Lyall. 2012. Comparing and Combining List and EndorsementExperiments: Evidence from Afghanistan. Under Review.Corstange, D. 2009. Sensitive questions, truthful answers? Modeling the list experiment with LISTIT.Political Analysis 17(1): 45-63. Droitcour, J., Rachel A. Caspar, Michael L. Hubbard, Teresa L. Parsley,Wendy Visscher and Tena M. Ezzati. 1991. The item count technique as a method of indirectquestioning: A review of its development and a case study application. Measurement Errors in Surveyspp. 185-210. Flavin, P. and M. Keane. 2009. How angry am I? Let me count the ways: Question formatbias in list experiments. Unpublished Manuscript.Glynn, Adam N. 2010. What Can We Learn With Statistical Truth Serum?: Design and Analysis of theList Experiment. Unpublished Manuscript.Gonzalez-Ocantos, E., Chad Kiewet de Jonge, Carlos Melendez, Javier Osorio and David W. Nickerson.2011. Vote buying and social desirability bias: Experimental evidence from Nicaragua. AmericanJournal of Political Science 56(1): 202-17.Holbrook, Allyson L. and Jon A. Krosnick. 2010. Social Desirability Bias in Voter Turnout Reports: TestsUsing the Item Count Technique. Public opinion quarterly 74(1): 37-67.Kane, James G, Stephen C Craig and Kenneth D. Wald. 2004. Religion and Presidential Politics inFlorida: A List Experiment. Social Science Quarterly 85(2): 281-93.Krosnick, Jon A. 1991. Response strategies for coping with the cognitive demands of attitude measuresin surveys. Journal of Cognitive Psychology 5: 213-36.Kuklinski, James H., Michael .D. Cobb and Martin Gilens. 1997. Racial attitudes and the New South.Journal of Politics 59: 323-349.Martinez, Michael D. and Stephen C Craig. 2010. Race and 2008 Presidential Politics in Florida: AList-Experiment. The Forum 8(2): 1-14.Nickerson, David W. and Chad Kiewet de Jonge. 2012. Artificial Inflation or Deflation? Assessing theItem Count Technique in Comparative Surveys. Under Review.Rayburn, Nadine Recker, Mitchell Earleywine and Gerald C. Davison. 2003. An Investigation of BaseRates of Anti-Gay Hate Crimes Using the Unmatched-Count Technique. Journal of Aggression,Maltreatment and Trauma 62(2): 137-53.Streb, Matthew J., Barbara Burrell, Brian Fredrick and Michael A Genovese. 2008. Social DesirabilityEffects and Support for a Female Presidential Candidate. Public Opinion Quarterly 72(1): 76-89.Tourangeau, Robert. 1984. Cognitive Sciences and Survey Methods. In T. Jabine, M. Straf, J. Tanur andRobert Tourangeau (Eds.) Cognitive aspects of survey methodology: building a bridge betweendisciplines. Washington, DC: National Academy Press pp. 73-199.Tsuchiya, Takahiro and Yoko Hirai. 2010. Elaborate Item Count Questioning: Why Do PeopleUnderreport Item Count Responses? Survey Research Methods 4(3): 139-49.Tsuchiya, Takahiro, Yoko Hirai and Shigeru Ono. 2007. A study of the properties of the item counttechnique. Public Opinion Quarterly 71(2): 253-272.
23
Newsletter of the APSA Experimental Section 2012 Volume 3 Issue 2
Warner, Stanley L. 1965. Randomize Response: A Survey Technique for Eliminating Evasive AnswerBias. Journal of the American Statistical Association 60(309): 63-9. Weghorst, Keith R. 2012.Uncovering Sensitive Political Attitudes with List Experiments and Randomized Response: A SurveyExperiment Assessing Data Quality in Tanzania. Working paper.
Review of The Social Citizen By Betsy SinclairAnand Edward Sokhey
University of Colorado at [email protected]
Over the last 30 years, our understanding of how interpersonal networks affect politics in the masspublic has been advanced time and again by Huckfeldt and colleagues (e.g., Huckfeldt and Sprague1995); the question of how our friends, family and acquaintances shape our opinions and behaviorsremains a topic of scholarly debate, as it has varied implications for democratic functioning (e.g., Mutz2006).
Of course, research on social influence has also been pestered by problems, and chief among thesehas been the thorny issue of self-selection. When individuals choose others that mirror them on variouscharacteristics (homophily), should we believe causal claims about influence? For decades, scholarshave had to address this concern through less than optimal designs, resulting in skepticism andlingering questions.
Enter The Social Citizen. Building on recent efforts using temporal (e.g., Klofstad 2011) andexperimental approaches (e.g., Nickerson 2008), Betsy Sinclair systematically addresses the threats toinference that have long plagued the literature. Bringing together field experiments, original surveydata, and careful analytic techniques, Sinclair demonstrates that social factors sway turnout,participation (political contributions), candidate choice, and even party identification. After situatingthe broader effort in the existing literature (and providing a theoretical overview), chapter two presentsthe results from two original field experiments on turnout. These two ”cuts” at social influence provideevidence for the ”social component of voting” (32), one of which emerges via an innovative, multi-levelfield experiment designed to gauge spillover effects (Sinclair, McConnell and Green 2010). Individualsare more likely to turnout when a local canvasser delivers a mobilization message; they are moreresponsive to mobilization treatments when they reside with others who have internalized participatorynorms (by voting consistently).
In chapter three, Sinclair shifts her attention to a different form of participation - donating tocampaigns. Focusing on an Illinois congressional district, she uses publicly available data on politicalcontributions to ”back out” a (whole) network, connecting individuals by their common giving tocampaigns or organizations. With this network in place, she then calculates centrality scores forindividuals, and links these - which gauge public visibility - to dollar amounts. The idea presented isthat giving is a social act that is fundamentally about the observance of and adherence to norms. Thispoint is further underscored via an original survey of donors and a number of in-person interviews.
24

Newsletter of the APSA Experimental Section 2012 Volume 3 Issue 2
In the final two empirical chapters, Sinclair turns to original and established survey data, looking atcandidate choice (chapter four) and that most fundamental of behavioral concepts, party identification(Campbell et al. 1960) (chapter five). Leveraging temporal information (in the form of panel data) andcareful modeling strategies, she demonstrates that social networks - measured via ego-centric data -exert influence on these preferences. A variety of robustness checks are presented, and theconstellation of results provides compelling evidence for causal inferences.
The Social Citizen makes a contribution by demonstrating - definitively - that network effects arereal. On this point alone the book should (and will be) cited heavily. That said, there is anothercontribution lurking behind the presentation of clean designs and ”teched-up” methodological tools.Across chapters and dependent variables, Sinclair conceptualizes networks and social influence in avariety of ways. However, the idea is not just to demonstrate that networks matter, but to demonstratehow they matter. All analyses are united by a focus on mechanisms, and specifically, on a sustainedeffort to adjudicate whether social influence operates via explicit information transmission, or socialpressures (that is, the expression, acknowledgement, and adherence to behavioral norms). Theaccumulation of evidence points to pressure rather than information as the mechanism of influence.This is an important finding, and one that will spur additional scholarly inquiry.
While The Social Citizen offers many advances and insights, it will leave readers with a fewquestions. Some of the evidence provided is more suggestive than conclusive (e.g., a portion of theexperimental results in chapters two; parts of chapter three). Likewise, one wonders about therobustness of the findings to alternative measurement strategies. For example, in the survey-basedresults, would different conceptualizations and operationalizations of disagreement (e.g., Klofstad,Sokhey and McClurg 2012) yield similar results? Would better measures of sophistication still yield nullresults for information-based theories of social influence? Finally, and most broadly, what are thedownsides to a social citizenry? Sinclair begins to address this (and related ”big picture” points), butthe narrative is less-developed on this front.
Still, The Social Citizen emerges as a thorough and thoughtful effort. The book is simultaneouslyaccessible and technical; it responds to an established literature at the same time that it leads it in newdirections. It may be premature to say that Sinclair has put the ”causal effects fight” to rest when itcomes to the study of social influence. However, she has certainly landed some blows, and in doing so,has urged us to consider some critical questions.
References
Berelson, Bernard R., Paul F. Lazarsfeld, and William N. McPhee. 1954. Voting. Chicago: University ofChicago Press.Campbell, Angus, Phil Converse, Warren Miller, and Donald Stokes. 1960. The American Voter. NewYork: Wiley.Huckfeldt, Robert and John Sprague. 1995. Citizens, Politics, and Social Communication. New York:Cambridge University Press.
25

Newsletter of the APSA Experimental Section 2012 Volume 3 Issue 2
Klofstad, Casey A. 2011. Civic Talk: Peers, Politics and the Future of Democracy. Philadelphia,PA:Temple University Press.Mutz, Diana. 2006. Hearing the Other Side: Deliberative Versus Participatory Democracy. Cambridge:Cambridge University Press.Nickerson, David W. 2008. Is Voting Contagious? Evidence from Two Field Experiments. AmericanPolitical Science Review. 102(1):4957.Sinclair, Betsy, Margaret A. McConnell, and Donald P. Green. 2010. Detecting Social Networks: Designand Analysis of Multi-level Experiments. Paper presented at the Third Annual CESS NYU ExperimentalPolitical Science Conference, February 5-6, 2010.
Review of A Model Discipline: Political Science and The Logic ofRepresentations By Kevin Clarke and David Primo
Jonathan WoonUniversity of Pittsburgh
Is political science really science? We hear this question from physicists, chemists, and evencomputer scientists. We also hear it from politicians, the media, and the general public, who frequentlychallenge the scientific legitimacy of our discipline. Formulating a coherent answer provides us a meansnot only to respond to our discipline’s critics (at least on a principled, intellectual level), but also topotentially reshape and improve the practice of political science itself.
One common understanding of scientific knowledge is that it develops from proposing and testingtheories. That is, science is defined chiefly by its commitment to subject explanations and hypotheses toempirical tests. This is the view of science summarized by Richard Feynman in the epigraph. Againstthis conventional wisdom, Clarke and Primo argue in A Model Discipline that political scientists shouldadopt the position that the central feature of science is instead its use of models. In their view, testingtheoretical models is also unnecessary and even illogical. Their book is a forceful, extended argumentin support of these claims.
While the book is not aimed directly at experimentalists-indeed, they explicitly avoid any extendeddiscussion of how experimentation relates to their model-based view-and is perhaps most obviously ofinterest to experimentalists in the game theoretic tradition, I expect that experimentalists of all stripeswill be interested in much of what Clarke and Primo have to say. Their work will surely be incorporatedinto first-year graduate scope and methods or research design syllabi and will influence the way thatnew generations of political scientists think about their research. I also expect that their book willgenerate substantial discussion as scholars react to their provocative thesis and this dialogue plays out,directly and indirectly, in the pages of our discipline’s leading journals.
Clarke and Primo set out to articulate a clear framework for thinking about what models are and forunderstanding the many roles that they play. On this front, they are entirely successful. Their mantra isthat ”Models are seen as objects, thus neither true nor false, and are judged by their usefulness for aparticular purpose” (p. 1). Their classification scheme divides models into theoretical and empirical
26

Newsletter of the APSA Experimental Section 2012 Volume 3 Issue 2
varieties. The purposes of theoretical models (discussed in chapter 4) are to provide foundations, toorganize known facts, to explore mechanisms, or to predict (that is, to generate testable implications).The purposes of empirical models (discussed in chapter 5) are to predict, to measure, to characterize,or to test theories. While the book-length argument builds on their Perspectives on Politics article(Clarke and Primo 2007), there is also good deal of new material (notably, the chapter 5 on empiricalmodels and chapter 6 on explanation); their stance against conventional theory testing also intensifies.
Not content with enhancing our understanding of science by providing a thorough definition of whata model is and a useful typology for the variety of intended purposes, Clarke and Primo embark on amore ambitious, radical mission: to break the ”spell that theoretical model testing holds over thediscipline” (p. 181). In this way, they stake out an alternative methodological position to the EITMmovement’s response to Green and Shapiro’s Pathologies of Rational Choice. Where the EITMmovement embraced the charge to test the implications of theoretical models, Clarke and Primo insteadcontend that doing so is mostly unnecessary and, furthermore, that it makes no sense at all.
The entire book can thus be seen as a sustained effort to undermine the central place thattheory-testing has in the way that political scientists approach their research. In chapter 2, they drawfrom a variety of prominent publications throughout political science to show that the dominant viewof science within the discipline is indeed a form of Hypothetico-Deductivism (H-D): propose a theory,deduce hypotheses, and test the hypotheses with data. They discuss the many ways in which H-D isflawed, not just to show that H-D lacks a legitimate claim as the universal foundation for science, but todiscredit it entirely as a valid model of the scientific process. In chapter 3, they discuss the analogy of amodel as a map and elaborate the key characteristics of models, drawing heavily on developments inthe philosophy of science (and the semantic view of theories) to support their contention that modelsshould be treated as objects and are neither true nor false. In chapter 4, they argue that mosttheoretical models should be evaluated not in terms of their empirical verisimilitude but in terms of thenumber and importance of the insights they generate. In chapter 5, in discussing the ”illogic” oftheory-testing, they stress that this is the purpose for which empirical models are least suited because”pairing a theoretical model with an empirical model, regardless of the method of inference, cannotovercome the problems generated by H-D” (p. 117)-doing so amounts to committing the logical fallacyof affirming the consequent and therefore cannot be justified as a logical foundation for scientificpractice.
Clarke and Primo are entirely right about the flaws of H-D. It is indisputable that it fails to provide auniversal foundation for scientific inquiry, either in its verificationist form (due to the problem ofinduction) or its nave falsificationist form (due to the problem of auxiliary hypotheses, as embodied inthe Duhem-Quine Thesis). Consequently, slavish adherence to H-D as the model of science along withany insistence, in journals and elsewhere, that all good research must adhere to this formula undulylimits what we can discover and understand about the political world. Progress comes in many forms:the identification of empirical regularities may come from the investigation of casual hunches or it maycome from subsequent experimental analyses that probe why the data failed to support a strongtheoretical hypothesis, new insights may be generated from sparse theoretical models or complexcomputational models that appear far removed from reality, and new measures or statistical methods
27

Newsletter of the APSA Experimental Section 2012 Volume 3 Issue 2
may provide new ways of interpreting old data. Science is a big tent, and Clarke and Primo rightlyemphasize the necessity of bringing models to bear on each of these purposes.
But their case against theory testing is overstated. Some form of H-D remains a useful model ofscience even if it is, like all models, only partially accurate. Like the five-paragraph essay, it is a usefulway to teach students about important features of scientific inquiry and it provides a useful structurefor many kinds of research activities. The problem occurs when this useful model is anointed as theone, true model.
The basic goal of theory testing also remains justified in their framework, provided that the nature oftheory testing is properly understood. If we accept their view that models are neither true nor false,have limited accuracy, and are purpose-relative, then of course it makes no sense to ”test” a model todetermine whether it is ”true” or ”false.” Clarke and Primo’s insistence that this is what is normallymeant by ”theory testing” is therefore a bit puzzling. But if, in their framework, a model is intended tohave limited accuracy, it is natural to ask: how accurate is it for its intended purpose? In other words,theory testing is intended not to establish whether a model is true or false, but the degree to which itcorresponds to the features of the real world necessary to explain it.
Theory testing for the purposes of assessing this correspondence is necessary because of ourignorance about the world. Such ignorance is absent in the case of their favorite subway map analogy.The subway map does not need to be tested because its makers already know that it is an accuraterepresentation of the order of subway stops and where different lines meet. But what if this is notknown? The more typical case is one where the modeler has limited or partial information. Supposeinstead that you are making a subway map and remember the names of only a few stops, but neithertheir relation to one another nor the stops where different lines meet. You make your best guess as towhat the subway map should look like. But you have no way of knowing whether your map is accurate(for its intended purpose) unless you check it against real-world experience (or another map). As you”test” your map, you learn the respects in which your map was accurate and gather new information todetermine the ways in which your map needs to be revised. So too with models or theories, which arebest guesses about the relevant features of the social and political world that are needed to explain aparticular phenomenon, but because they are constructed with partial information must be checkedagainst observation and experiment.
The ”theory first, data second” approach just described is one way to develop a theory, but the lackof information with which to construct (even partially) accurate models in the first place suggests that a”data first, theory second” approach can be useful as well. This is essentially what Clarke and Primoadvocate in chapter 6. They argue that empirical models can and should be used for characterizationand measurement; such models allow us to make better sense of available data and to see a clearerpicture of reality, but in and of themselves cannot provide explanations. For Clarke and Primo, the onlysensible way to join theoretical and empirical models is to use theoretical models to provideexplanations for empirical findings, either in the form of a unifying framework or in explicating acausal mechanism. Here, they explicitly challenge experimentalists to not be content with identifyingcausal effects.
28

Newsletter of the APSA Experimental Section 2012 Volume 3 Issue 2
But no matter how many empirical regularities we might establish and no matter how well atheoretical model seems to provide an explanation, our remaining ingorance still implies an importantrole for theory testing. Theoretical models must necessarily posit assumptions that cannot be known apriori to be accurate. For example, in game theoretic or rational choice models we cannot completelyknow whether preferences in a model correspond to agents’ preferences in the real world, and wecannot completely know whether real world agents make decisions in the ways prescribed orapproximated by such models. Because these unobserved features are often critical to the results oftheoretical analyses and because their degree of accuracy remains uncertain, it is necessary to checkboth assumptions and implications against observation or experiment-that is, to test them.
The ”theory first” and ”data first” approaches are not incompatible. Choosing between them isunnecessary, as both are vital parts of the scientific research process. We need empirical models tointerpret increasingly complex data and to establish empirical regularities, thereby increasing ourknowledge of what the world looks like. We can then explain these regularities with theoretical models,but a substantial amount of work must be done to explore and develop the theoretical machinerybefore it is sufficiently useful to apply it to a specific phenomenon. We must still check theories againstnew data. Testing the empirical implications of theoretical models will lead to the discovery of newregularities that may or may not fit previous theoretical models. This constant interplay between theoryand data is what game theorist Roger Myerson refers to as a ”modeling dialoguea process in whichtheorists and empiricists work together interactively on the difficult task of finding tractable modelsthat capture and clarify the important aspects of real situations” (1992, p. 64, emphasis original). I donot know whether anything resembling the notion of a modeling dialogue is endorsed by philosophersof science, but it seems like an appropriate middle ground (embraced by at least a few politicalscientists, e.g., Powell 1999, Slantchev 2012) upon which to base an understanding of the relationshipbetween theory and data.
On the whole, Clarke and Primo’s call to broaden what political scientists consider ”good work” orwhat we consider to be ”scientific” will resonate clearly with a wide variety of scholars. A ModelDiscipline provides an expansive framework for thinking about the role of models and how we shouldevaluate them. It makes a compelling case that models are invaluable tools for scientific inquiry andthat theoretical models need not be tested to be useful. Even though experimentation does not playdirectly into their discussion, it would be intriguing to think of an experiment as a kind of model and toconsider how this experiment-as-model would fit in their framework. The book raises importantepistemological issues regarding the foundations of knowledge and challenges political scientists tothink critically about how such foundations shape our work, whether that work is experimental,observational, methodological, or theoretical.
References
Clarke, Kevin and David Primo. 2007. ”Modernizing Political Science: A Model-Based Approach.”Perspectives on Politics 5(4):741-753Myerson, Roger B. 1992. ”On the Value of Game Theory in Social Science.” Rationality and Society4(1):62-73.
29

Newsletter of the APSA Experimental Section 2012 Volume 3 Issue 2
Powell, Robert. 1999. In the Shadow of Power: States and Strategies in International Politics. PrincetonUniversity PressSlantchev, Branislav. 2012. ”Audience Cost Theory and Its Audiences.” Security Studies 21: 376-382.
Section News and Announcements
• WCE 2013
From Kevin Esterling
WCE.2013, Stanford: The sixth annual meeting of the West Coast Experiments Conference will be heldat Stanford on Friday, May 10, 2013. We encourage anyone with an interest in experiments to attend;graduate students are especially welcome, as well as those who are new to experimental research. TheWCE conference is organized more as a methods ”workshop” than as a venue to engage in subfielddebates. Instead of standard conference presentations, presenters focus in depth on one or twomethodological take away points of their experimental work. The goal is to give the audience membersapplied, practical advice on methods and design in a way that will help them improve their ownexperimental research. The WCE meeting is a single day meeting, starting at 9 and ending after dinner.Although we do not have the money to cover travel or lodging expenses, we will provide all meals onthat day and we promise a good conversation.
• Study registry conference
From Kevin Esterling
Conference at UC Berkeley on Dec. 7, on designing a study registry for social science.http://cega.berkeley.edu/events/Pre-analysisPlans/
• Existing Newsletter Sections Need Authors
I need future authors!! Book reviews (nominate your own book and reviewer too!), theme sections(e.g., the bio-politics and GOTV sections), co-author/inter-disciplinary experiences....Submit! Nextissue is May 2013.
• Call for book proposals
Call for Proposals: Routledge Studies in Political Psychology www.routledge.com/politics
Series Editors: Howard Lavine (University of Minnesota)
Advisory Board: Ted Brader, University of Michigan; Eugene Borgida, University of Minne-sota; MarcRoss, Bryn Mawr College and Linda Skitka, University of Illinois, Chicago
30

Newsletter of the APSA Experimental Section 2012 Volume 3 Issue 2
Political psychology is dedicated to the analysis of the interrelationships between psycho-logical andpolitical processes. The field is interdisciplinary in nature, bidirectional in influence (the psycheinfluences political orientation and the polity leaves its mark on who we are), and draws on a broadrange of disciplinary sources, including cultural anthropology, history, economics, neuroscience,behavioral genetics, sociology, and organizational be-havior. From a psychological perspective, politicsis not only about who gets what in the material sense; it is also about how psychologicalpredispositions, social identities and bounded information processing capacities fundamentally shapeand constrain how individuals interact with their government and society at large. The RoutledgeStudies in Political Psychology was developed to publish books representing the widest range oftheoretical, methodological and epistemological approaches in political psychology. The series isintended to expand awareness of the creative application of psychological theory within the domain ofpolitics and foster deeper appreciation of the psychological roots of political behavior. We areparticularly interested in scholarly mono-graphs, but proposals for edited volumes will also beconsidered. If you have a book proposal or idea in mind that you would like to discuss or any questionsabout the series, please do not hesitate to contact:
Series Editor Howard Lavine: [email protected]
Acquisitions Editor Natalja Mortensen, Political Science Research:[email protected]
31