The evolution of export unit values: Some stylised … · The evolution of export unit values: Some...
28
DP2009/XX The evolution of export unit values: Some stylised facts DRAFT PRESENTED AT NZAE’09 Richard Fabling, Sophie Joyce and Lynda Sanderson July 2009 JEL classification: F10, F31, L11 www.rbnz.govt.nz/research/discusspapers/ Discussion Paper Series ISSN 1177-7567
-
Upload
nguyenkien -
Category
Documents
-
view
220 -
download
0
Transcript of The evolution of export unit values: Some stylised … · The evolution of export unit values: Some...
DP2009/XX
The evolution of export unit values:
Some stylised facts
DRAFT PRESENTED AT NZAE’09
Richard Fabling, Sophie Joyce and Lynda
Sanderson
July 2009
JEL classification: F10, F31, L11
www.rbnz.govt.nz/research/discusspapers/
Discussion Paper Series
ISSN 1177-7567

DP2009/XX
The evolution of export unit values:Some stylised facts
DRAFT PRESENTED AT NZAE’09∗
Richard Fabling, Sophie Joyce and Lynda Sanderson†
Abstract
Using detailed Customs data, we examine changes in unit values for mer-chandise trade. We observe these values for narrowly defined goods accord-ing to the exporting firm, destination and currency of invoice. This detaileddefinition gives us some ability to distinguish between real changes in pricesand compositional changes in products and destinations. Such controls areimportant, since we show that firms often trade the “same” product to multi-ple countries at very different unit values – differences that are only partiallyexplainable by common proxies for trade costs.
We find that unit values of export goods tend to be reasonably flexible overtime and that changes in unit values are similar across New Zealand Dollar(NZD)- and foreign currency-denominated contracts. However, NZD tradestend to be smaller and more likely to be one-off so that, on a trade-weightedbasis, contracts written in foreign currencies are dominant. Focussing on thissub-population, we reject the possibility that NZ firms negotiate the foreign(contracted) value of their goods in order to completely smooth the (realised)NZD value – that is, we reject complete exchange rate pass through. As aconsequence, the NZD-converted income from foreign trades is impacted bycurrency appreciations and depreciations. These results are consistent withearlier research (Fabling and Grimes 2008) showing that New Zealand firmsactively manage foreign exchange risk in ways that suggest short-run currencymovements have implications for their bottom line.
∗ The views expressed in this paper are those of the authors and do not necessarily reflectthe views of the Reserve Bank of New Zealand. The authors wish to thank StatisticsNew Zealand for access to the data.† Richard Fabling: RBNZ ([email protected]); Motu Economic and Public
Policy Research. Sophie Joyce: RBNZ summer intern. Lynda Sanderson: RBNZ([email protected]); University of Waikato.ISSN 1177-7567 c©Reserve Bank of New Zealand
Disclaimer
This research uses data that was accessed while the authors were on second-ment to Statistics New Zealand in accordance with security and confidential-ity provisions of the Statistics Act 1975. Only people authorised by the Actare allowed to see data about a particular business or organisation. The re-sults of this work have been confidentialised to protect individual businessesfrom identification. The analysis and interpretation of these results were un-dertaken while the authors were at the Reserve Bank of New Zealand. Theopinions, findings, recommendations and conclusions expressed in this reportare those of the authors. Statistics New Zealand, the Reserve Bank of NewZealand, and Motu take no responsibility for any omissions or errors in theinformation contained here.
The results are based in part on tax data supplied by Inland Revenue toStatistics New Zealand under the Tax Administration Act 1994. This taxdata must be used only for statistical purposes, and no individual informationis published or disclosed in any other form, or provided back to Inland Rev-enue for administrative or regulatory purposes. Any person who had accessto the unit-record data has certified that they have been shown, have readand have understood section 81 of the Tax Administration Act 1994, whichrelates to privacy and confidentiality. Any discussion of data limitations orweaknesses is not related to the data’s ability to support Inland Revenue’score operational requirements.
Statistics New Zealand protocols were applied to the data sourced from theNew Zealand Customs Service. Any discussion of data limitations is notrelated to the data’s ability to support that agency’s core operational re-quirements.
1 Introduction
We present analysis on the dispersion and evolution of unit values in NewZealand merchandise trade. The analysis is descriptive, examining the rela-tionship between export unit values, the currency of invoice, and exchangerate movements. Our work is motivated, in part, by the importance thattraded goods’ prices often play in small open macro-economy models, partic-ularly the central role these prices play in the transmission of shocks and thedetermination of optimal monetary policy (eg, Obstfeld and Rogoff (1995)and Betts and Devereux (2000)).
We calculate the proportion of “sticky” (ie, unchanged) export unit valuesand the distribution of the magnitude of unit value changes, as measuredin the currency of invoice. We then estimate an exchange rate pass-through(ERPT) relationship at the firm-level, since responses to currency movementare a prime candidate for explaining unit value changes.
When considering the ERPT relationship over the short run, it is unlikelythat the bilateral exchange rate is the relevant currency for understandingchanges in the unit value received by New Zealand firms. Instead, we use thecurrency of invoice to estimate the ERPT relationship – using this datasetit is clear that most trade contracts are not denominated in the destinationcurrency, implying that use of the bilateral exchange rate is not likely to bea good proxy for the short-term risk faced by exporters.1
Most earlier studies have estimated this relationship at the product-countrylevel. Our primary unit of observation is the month-on-month change in unitvalues indexed on firm, detailed good, destination market, and currency ofinvoice. To provide context for the importance of a disaggregated unit ofobservation, we also present evidence of significant dispersion in export unitvalues across firms trading the same good, controlling for destination marketand currency of invoice. In addition, we document significant dispersion inthe export unit values of firms trading the same good, in the same currency, tothree or more destination markets. Furthermore, we find that for these firms,GDP per capita and distance of destination market are positively related toexport unit values. These facts suggest that results from aggregate and mostfirm-level studies of price stickiness are likely to be affected by changingexport composition over time. Indexing over a firm, product, destinationmarket, and currency of invoice helps isolate a constant good over time,reducing these concerns as much as practicable given the available data.
1 See Fabling, Sanderson, and Taglioni 2009 for a fuller exposition of this argument.
2

Our results suggest that only a small proportion of export unit values aresticky (ie, unchanging over consecutive trades), and that the proportion ofsticky trades is quite similar for the subsets of contracts written in NewZealand Dollars (NZD) and foreign currencies. However, weighted by value,most trade is not contracted in NZD. For foreign invoiced trade, we find asignificant, though incomplete, exchange rate pass through mechanism ap-plying.2 As a consequence, the NZD-converted value of that trade is sub-stantially impacted by currency movements.
Section 2 outlines two literatures that our paper contributes to. Section 3explains the data that we use and presents the export unit value dispersionresults that motivate our detailed level of disaggregation. Section 4 examinesthe distribution of unit value changes over time and presents simple statisticson the proportion of “sticky” unit values, drawing a distinction between con-tracts denominated in NZD and foreign currencies, and the NZD-convertedvalue of foreign-denominated contracts. Section 5 relates unit value changesto movements in the bilateral exchange rate with the currency of invoice,while section 6 summarises our findings.
2 Literature Review
Our paper relates to both the trade literature – studying the dispersion ofprices within product categories and across destination and origin markets –and the literature on the stickiness of traded goods’ prices and the currencyof invoice (including the empirical estimation of ERPT). This section reviewsthese two literatures.
2.1 Trade
Dispersion of export unit values within disaggregate product categories, acrossdestination and origin markets, has been widely documented and studied.3
2 We do not estimate the ERPT relationship on the import side. Because ERPT forimports prices has been linked to domestic inflation, this relationship is traditionallyof more interest to central bankers. The contribution of our paper is in controlling forfirms when estimating pricing to market behaviour. Given we lack firm-level controlsfor foreign exporters in the import data, we believe such estimates are subject to ourcomposition critique. Estimates of ERPT into New Zealand’s import prices are left tofuture work.
3 See, eg, Hallak (2006), Hummels and Klenow (2005), and Hallak and Schott (2008).
3

On the supply side, Schott (2004) finds a positive relationship between importunit values, and exporter country GDP per capita and factor endowments.Schott suggests this is evidence of specialisation by countries within products(“new trade theory”), rather than across products (“old trade theory”).
The observed dispersion in export unit values across countries has led someto suggest differences in product quality explain the dispersion in unit values.Furthermore, several authors have studied the role of product quality in tradeflows. In particular, Hallak (2006) suggests countries with a higher GDP percapita demand higher quality products. He produces an index of qualityfor each sector and country. This is an export price index based on cross-country differences in export unit values. Fontagne et al (2008) are similarlymotivated by different unit values within a product category, but focus onthe distinction between advanced/high-income (“North”) and less developed(“South”) countries. They consider indicators of export similarity acrosscountries at the level of sector, HS64 product and varieties.5 While theyfind that there are large similarities between North-South countries at thesectoral level, there is much greater distinction between varieties suggestingcountries specialise within products.
Co (2007) tests whether US exporters charge different prices depending ondestination. Thus, instead of linking differences in good quality within prod-uct categories with unit value dispersion, her method groups destinationcountries together if they share similar characteristics, and tests whether ex-port price differentials increase or decrease. Using aggregate trade data, Cogroups countries on the basis of income, common language, and currencybehaviour, to see if price differentials are reduced when controlling for thesefactors.6 Since price differentials decline when countries are grouped accord-ing to currency behaviour, Co takes this evidence as suggesting “pricing tomarket” behaviour.7
Our paper, in particular our estimate of the dispersion in unit values withinfirms, across destinations, relates to Heterogeneous Firms Trade (HFT) mod-els like those proposed by Melitz (2003). More recently, variants of the HFTmodel place a central role on quality, rather than price, competitiveness offirms. In Quality Heterogeneous Firms Trade (QHFT) models (proposed by
4 HS is the Harmonised System classification system for trade goods, with HS6 beingthe six-digit disaggregation. We make use of the 10-digit version of this system in ourempirical analysis.
5 Varieties refer to products shipped at different unit values.6 Currency behaviour refers to a currency appreciation or depreciation of the destination
market.7 Pricing to market is formally defined on page 7.
4

Baldwin and Harrigan 2007) firms send more “expensive” goods to marketswith higher trade costs. Thus unit values are positively related with distanceif trade costs rise with distance of the market. By contrast, under the HFTmodel increasing distance lowers unit values. Baldwin and Ito (2008) empiri-cally test both of the HFT and QHFT models by estimating a distance-priceequation using prices at the HS6 level indexed by country of destination andtime. Results suggest that for a majority of EU countries a large share of ex-ports are “quality” competition goods, that is, higher distances of destinationmarket are associated with higher prices.
Another trade paper studying the dispersion in export unit values acrosscountries of destination is Hummels and Skiba (2004). They test the Alchian-Allen hypothesis which posits that an increase in per unit transport costslowers the relative price of quality and, as a result, high quality goods areexported and low quality goods are sold domestically. Hummels and Skiba(2004) find that increasing transportation cost are associated with increas-ing demand for high “quality” goods (ie, higher unit values), relative to lowquality goods. Implicit in their result is the assumption that goods withhigher unit values reflect higher quality goods. Hummels and Skiba (2004)firstly provide evidence that transport costs are per unit rather than “ice-berg”.8 They use cross-section data for six importing countries and relateaverage prices for a HS6 good indexed by an exporter and importer countryto freight and tariff costs to test the Alchian-Allen hypothesis. They findempirical confirmation for Alchian-Allen effects in the form of a positive co-efficient on the apportioned freight rate; higher freight costs are associatedwith higher free-on-board (FOB) prices, and higher tariffs with lower FOBprices.
2.2 Export Prices and Exchange Rates
If prices are sticky (fixed) in the currency of invoice, there are potentiallyconsequences for both trading parties when there are fluctuations in theexchange rate. In this paper, we adopt the convention of describing apparentproducer currency (local currency) pricing when prices appear to be stickier(more stable) in the currency of the exporter (importer). A recent study byGopinath and Rigobon (2008) documents significant stickiness in the pricesof US imports and exports (the median price duration for export goods isslightly over a year). The authors use firm-level survey data on import and
8 The iceberg transport costs assumption is common in theoretical models and assumescosts are proportionate to the unit value of the goods shipped.
5
export product prices collected by the Bureau of Labor Statistic. In Gopinathand Rigobon (2008), because most transactions for imports and exports areinvoiced in US dollars (USD),9 and import and export prices are sticky, theyconclude US exporters exhibit producer currency pricing, and US importerslocal currency pricing.
A recent paper by Friberg and Wilander (2008) uses survey data and set-tlement reports for Swedish firms to present evidence on Swedish importers’and exporters’ currency of invoice practices. This includes evidence suggest-ing Swedish firms do not convert foreign currency transactions into SwedishKronas immediately after a sale, that the same currency is often used forprice-setting, invoicing, and payment.10 In addition, they find rigidity inprices and that the majority of exports are invoiced in a foreign currency,suggesting local currency pricing by Swedish firms. Across a broad range of24 countries, Goldberg and Tille (2008) a sizeable share of trade is invoicedin USD rather than the producer or importer currency.
Related to export unit values and the currency of invoice, is the extent ofpass through of changes in the exchange rate into traded goods’ prices. Therelationship between exchange rates and traded goods’ prices is known as theexchange rate pass-through relationship. Specifically, the ERPT relationshipis defined as the “percentage change in local currency import prices resultingfrom a one percent change in the exchange rate between the exporting andimporting countries” (Goldberg and Knetter 1997, p 1248).11
Goldberg and Knetter (1997) and Goldberg and Hellerstein (2008) reviewthe micro-foundations of ERPT from the perspective of pass through to im-port prices. Exporters set prices in their domestic currency (the producercurrency) and those prices depend on costs and the firms’ mark-up (becausefirms are imperfectly competitive they are able to price above marginal cost).The exchange rate at time t enters the equation for the export goods’ pricedenominated in the local currency. Complete exchange rate pass-throughoccurs when the variation in the local currency price of the good mirrorsthe change in the exchange rate. Incomplete pass-through occurs when achange in a bilateral exchange rate is not completely transmitted into thelocal currency price of a traded good. For incomplete pass-through to occur,
9 90 percent for imports and 97 percent for exports10 Unfortunately, we are unable to determine when (or if) firms convert foreign earnings
into NZD or when export contracts are signed. Instead our reference date is the timethe shipment leaves New Zealand and we assume that this is the month during whichpayment would be received.
11 In our empirical analysis we test a modified version of this definition.
6

a change in the exchange rate must affect either (or both) the firms’ mark-up or marginal cost. Goldberg and Hellerstein (2008) further decomposeincomplete pass-through into mark-up adjustment, marginal cost changes,and costs associated with re-pricing.
The empirical literature estimating the ERPT relationship is extensive. Knet-ter (1989) proposes a commonly used reduced form specification for estimat-ing ERPT. He uses panel data with export prices denominated in the ex-porter’s currency and indexed by country of destination and time. Knetter(1989) argues that export prices are affected by changes in the exchange ratethrough two channels: changes in marginal costs of production, and firmsadjusting mark-ups to destination-sensitive elasticities of demand. He dis-tinguishes between these two explanations of incomplete pass by exploitingdata on the shipments of goods to multiple destinations. If firms use im-ported goods that are affected by exchange rate movements as inputs, andinputs represent a constant cost increase or decrease across all destinationsfor a product, the component of a price change due to marginal cost will bethe same across destinations, whereas mark-ups are destination-specific.
A large body of empirical evidence supports incomplete pass-through ofchanges in exchange rates onto the local currency prices of goods. Thereare several theoretical explanations for incomplete pass-through. The mostwidely cited is the Krugman (1987) (and Dornbusch 1987) “pricing to mar-ket” model of firm’s price setting behaviour in relation to changes in exchangerates: “The phenomenon of foreign firms maintaining or even increasingtheir export prices to the US when the dollar rises may be described as pricingto market” (Krugman 1987, p49). In a monopolistically competitive envi-ronment, firms adjust their mark-up depending on the elasticity of demandfor their good in the destination market. For example, if firms are reluc-tant to lose market share, they will lower their mark-up when the exporter’sexchange rate appreciates against the importing country. This behaviour isinduced by changes in the exchange rate and is generally attributed to firmsstabilising price changes in the buyer’s currency.
Hummels and Skiba (2004) test for “pricing to market” as an alternativeexplanation to the Alchian-Allen hypothesis. They argue that the averageFOB price would have to be “implausibly large” to explain the observedmagnitude of the estimated elasticity of the coefficient on the distance term inthe empirical estimation relating average FOB prices to transport costs. Theynote that within their framework, the effect of tariffs on trade prices for boththe Alchian-Allen and PTM hypotheses reinforce each other, but the effectof transport costs on each hypothesis is opposing. Although Hummels and
7

Skiba do not empirically estimate the PTM relationship, they argue that theaverage coefficient found in the literature cannot explain their results, insteadthey argue that Alchian-Allen and PTM effects are likely both important inexplaining the variation in FOB prices across destinations.
Studies estimating the ERPT relationship using micro data are limited andinclude Goldberg and Verboven (2005), Gopinath and Rigobon (2008), Gold-berg and Hellerstein (2007), Fitzgerald and Haller (2008), and Berman et al(2009).12 Fitzgerald and Haller (2008) use Irish plant level data to look atthe impact of exchange rates on firms’ pricing decisions. They exploit dataon firms’ prices for the same product sold in domestic and export markets,and data on firms’ exporting the same product to different markets, in orderto identify the effect of exchange rate driven demand and cost shocks onpricing decisions. Goldberg and Verboven (2005) study the price dispersionin the car market of EU member states over time. They estimate a hedonicpricing equation, utilising data on the attributes of each car. With annualtime series data they find significant evidence of price discrimination acrosscountries, which they then relate to changes in the bilateral exchange ratesbetween countries. Gopinath and Rigobon (2008) firstly test whether signif-icant foreign currency devaluations affect the probability of a goods’ pricechange. They compare the probability of a price change in the period priorto and after currency devaluation. In general, they find no significant differ-ence. They also estimate an ERPT equation with import prices indexed bythe good, industry sector, and country of origin. They estimate the cumula-tive change in the exchange rate and import price since the last price change.This deals with problems of price stickiness being incorrectly associated withincomplete pass-through.
Gopinath and Rigobon (2008) use USD import prices and the bilateral ex-change rate with the source country to estimate the ERPT relationship.They also estimate the degree of exchange rate pass through for US importsthat are invoiced in USD vs. non-USD, finding a significant difference in thepass-through of exchange rate changes for each of these groups.
As far as we are aware, the only other attempt at estimating the impact ofexchange rates on prices at the firm level is a recent working paper by Bermanet al (2009). They index on firms to estimate the impact of exchange rates onexport prices and quantity of goods exported. They index their prices on firm,
12 Papers estimating the ERPT and pricing-to-market relationship using aggregate tradedata are more prolific and include Bugamelli and Tedeschi 2008, Parsons and Sato2006, Athukorala and Menon 1994, Gaulier, Lahreche-Revil, and Mejean 2008, Mallickand Marques 2008, and Campa and Goldberg 2005.
8
destination market, and time. They also include a firm-specific measure ofproductivity to test whether firm responses to exchange rate changes differacross this dimension. However, Berman et al (2009) do not distinguishthe currency of trade, and they estimate ERPT with the bilateral exchangerate of the country of destination. Given the Gopinath and Rigobon (2008)results, we expect knowledge of the currency of invoice (as in our study) tobe an important factor to control for.
Goldberg and Knetter (1997), in their review of the literature on goodsprices and exchange rates, note that dynamics complicate the study of PTM.Firstly, the currency in which trades are invoiced could bias the finding ofPTM. If invoicing is in the buyer’s currency and price adjustment is in-frequent, this could lead to spurious findings of PTM. On the other handif invoicing is in the exporters currency and price adjustment is infrequentthis creates a bias against finding PTM. In addition, issues of permanentversus temporary changes in the exchange rate could also affect findings ofPTM because exporters should respond differently to these changes (assum-ing identification of such a distinction is feasible). However, Goldberg andKnetter (1997) argue that conscious price discrimination appears to be per-vasive and that price differentials appear to be persistent and not reflectiveof an underlying price convergence.
3 Data
3.1 The Longitudinal Business Database
The dataset used in this paper is indexed on firm, good, destination andcurrency of invoice. We start from daily Customs data linked to StatisticsNew Zealand’s prototype Longitudinal Business Database (LBD) and thenaggregate to a monthly trade frequency.13 We justify this detailed indexing onthe basis of observed dispersion in export unit values across and within firms.That is, we show that there is significant heterogeneity in unit values acrossfirm-good-country relationships suggesting that pricing to market could befalsely identified from compositional change in the export destinations thatfirms trade to.
Products are defined using the highly detailed ten-digit Harmonised System
13 Fabling and Sanderson (2008) document how we allocate trade data to manufacturingfirms based on Statistics New Zealand’s initial match to the LBD.
9
(HS10) and unit values are calculated as the free-on-board value (in eitherthe invoicing currency or NZD) over the quantity exported:14
P FX,NZDfcgxt =
valueFX,NZDfcgxt
volumefcgxt(1)
where f, c, g, x, t index the firm, country, good, currency and month respec-tively, and the superscript denotes whether the FOB value is denominatedin the currency of invoice (FX, which includes NZD-denominated contracts)or the NZD converted value.15 Changes in unit values over time are log dif-ferences of levels divided by the number of months (Mt) between consecutivetrades of the combination f ,c,g,x, that is:
∆P FX,NZDfcgxt =
1
Mt
(lnP FX,NZD
fcgx,t − lnP FX,NZDfcgx,t−Mt
). (2)
In this latter equation, we focus on the currency of invoice since we areprimarily interested in whether New Zealand exporters are able to (or chooseto) negotiate price changes in export contracts. Consideration of the effectof contract price in the foreign currency on the NZD-converted earnings ofthe exporter are considered when we look at exchange rate pass-through inSection 5.
The monthly data covers April 2004–December 2007, which is the periodwhere we have comprehensive currency of invoice information.16 Over thisperiod we observe trade in 7,894 goods to 218 countries by 5,247 firms.17
We have a total of 686,952 observations of Pfcgxt, and 513,864 observationsof ∆Pfcgxt (there are 100,311 one-off trades and these are disproportion-ately invoiced in NZD). Table 1 shows the proportion of unit value leveland change observations by currency of invoice. While a large proportion oftrades are denominated in NZD, the majority of the (NZD) value of trade hasthe USD as the currency of invoice, making the role of currency fluctuationin the evolution of unit values a key consideration at the macroeconomic
14 Quantities are measured in standard units that are time-invariant and good-specific(eg, kilograms, litres or counts). For a small proportion of trade, quantities are notdefined – primarily because the span of goods in the ten-digit code is not thought tobe homogeneous enough to be covered by a single unit of measurement. In such caseswe use the shipment weight to derive a proxy unit value or, where this is not possible,drop these observations.
15 Where the analysis the same across FX/NZD we drop the superscript and simply referto Pfcgxt or P .
16 April 2004 saw the introduction of mandatory electronic filing of exports shipments.17 Throughout the paper, firm-based counts are random-rounded to base three in com-
pliance with Statistics New Zealand’s confidentiality rules.
10

Table 1Proportion of observations by currency of invoice
Unweighted Trade-weightedCurrency (x) Pfcgxt ∆Pfcgxt Pfcgxt
NZD 0.491 0.453 0.175USD 0.272 0.293 0.583AUD 0.142 0.154 0.102EUR 0.048 0.048 0.074GBP 0.019 0.021 0.036Other 0.028 0.031 0.030
level. That is, NZD-denominated trades are of lower average value thanforeign-denominated trades. This may in part be because smaller firms areless capable or willing to enter trade relationships that involve currency riskof various kinds (see Fabling and Grimes 2008, and Fabling et al 2009 forevidence of this using the same Customs data used here).
The majority of firms (51.3 percent) only trade in one currency. Australia isour largest trading partner and also accounts for 29.9 percent of all observa-tions. Within Australian trade, there is a roughly even split of observationsbetween the currency of invoice being Australian Dollars (AUD) or NZD.A different picture is apparent for our second largest trading partner, theUnited States. While most US-destined trade is invoiced in USD (consistentwith evidence from US importers), 80.9 percent of observations invoiced inUSD are not destined for the US market, reflecting the role of the USD as aninternational currency of trade (Goldberg and Tille 2008; Krugman 1980).We select NZD and the four largest foreign currencies of invoice, USD, AUD,Euro (EUR), and Pound Sterling (GBP) for subsequent analysis.
3.2 Motivating the need for disaggregated unit values
Despite being widely used in research, a common critique of unit valuesis that they cannot ensure that the goods traded are homogeneous withinproduct categories.18 While we have made significant attempts to control forsources of heterogeneity when calculating unit values, we deliberately avoidreferring to Pfcgxt as a price.
To explore the composition issue we construct various sub-populations andexamine the coefficient of variation (ie, the standard deviation over the mean)of unit values in NZD, cν(P
NZD). We look first at the variation across firms
18 Silver (2007) explains in detail how the calculation of unit value-based price indices isaffected by the composition of goods.
11

trading the same good – that is, a set of unit values that would be aggregatedinto a single product for an aggregate study – and consider the reduction inwithin-month variation that arises from further indexing on country and cur-rency. We then look at within firm-good price dispersion across countries –a set of unit values that would, presumably, be averaged over should a firmbe asked for a good-level export price. The presence of significant dispersionin unit values both across and within firms justifies indexing on firm, good,and country in our analysis of the evolution of export unit values. Finally,we question whether some of our good categories are sufficiently homoge-neous by looking at Harmonised System descriptors that contain the phrase“not elsewhere classified (nec)”. That analysis naturally leads into a broaderdiscussion of measurement error.
In estimating cν(PNZDgt ) across firms trading the same good in a month, we
restrict to goods where there are at least five firms trading in the month. Outof a total 143,680 monthly observations of goods traded, 12.8 percent satisfythis criteria. The median value of cν(P
NZDgt ) is 0.939 across all countries and
currencies. Among other things, product-level unit value dispersion will re-flect firms discriminating across destinations, destination-dependent pricingthat is common to all firms, any ability of firms to differentiate their products(which may be harder in goods with a lower value-added component19), andmeasurement error (discussed in the next subsection). Additionally control-ling for the country of destination, so firms are all trading the same good tothe same country in that month we have a total 14,001 unique observations,and the median deviation drops to 0.636.
Further restricting to goods being traded to the same country in the samecurrency, we have 10,974 unique observations with then median value ofcν(P
NZDcgxt ) being 0.553. This presents the most disaggregate level at which
we can control for sources of heterogeneity. The reduction in variation atthis level is relatively minor (compared to the prior step controlling for desti-nation) mainly because most firms only trade goods to a country in a singlecurrency. Aside from allowing us to interpret the impact of currency move-ments on unit values more clearly, an additional motivation for separatingthe currency of invoice is that firms trading to the same country in multiplecurrencies may be indicative of multiple buyers and, therefore, potentiallyreflect differing contract relationships.
To examine the within-firm dispersion of goods prices we restrict our datasetto firms trading in the same good in the same currency of invoice. Dropping
19 The next version of this paper will follow up on this possibility by splitting goods intocategories using the classification system of Rauch (1999).
12
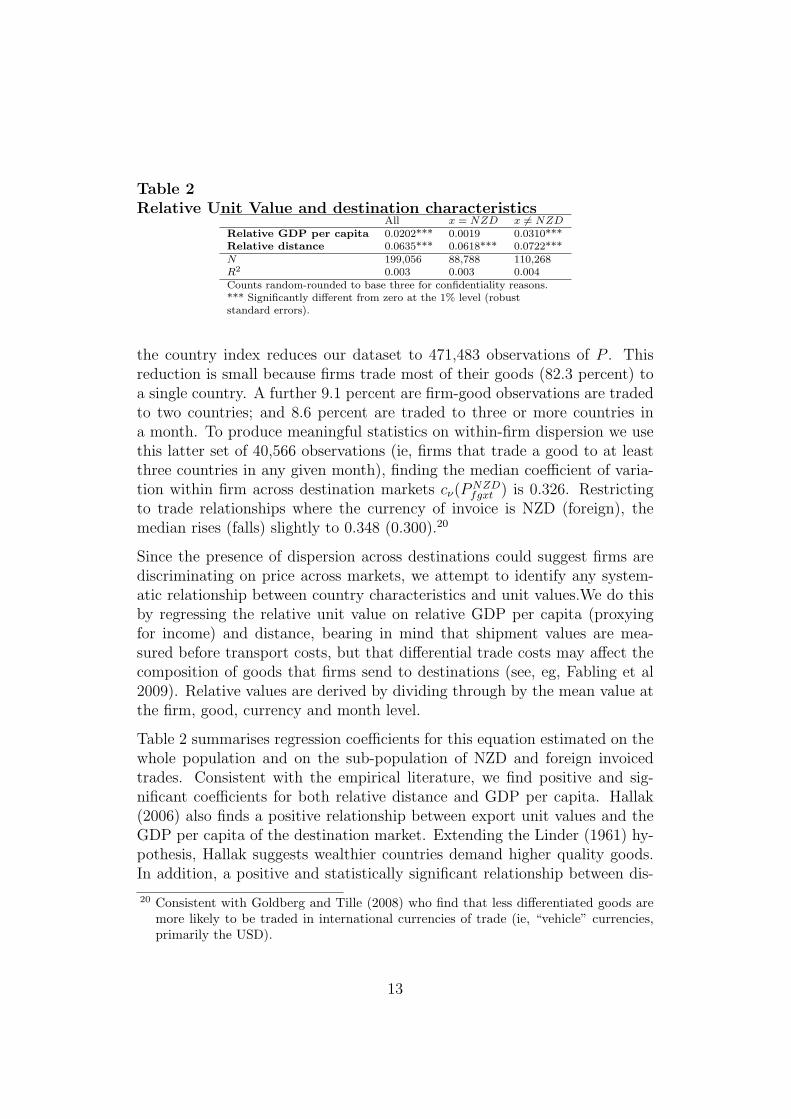
Table 2Relative Unit Value and destination characteristics
All x = NZD x 6= NZDRelative GDP per capita 0.0202*** 0.0019 0.0310***Relative distance 0.0635*** 0.0618*** 0.0722***N 199,056 88,788 110,268R2 0.003 0.003 0.004Counts random-rounded to base three for confidentiality reasons.*** Significantly different from zero at the 1% level (robuststandard errors).
the country index reduces our dataset to 471,483 observations of P . Thisreduction is small because firms trade most of their goods (82.3 percent) toa single country. A further 9.1 percent are firm-good observations are tradedto two countries; and 8.6 percent are traded to three or more countries ina month. To produce meaningful statistics on within-firm dispersion we usethis latter set of 40,566 observations (ie, firms that trade a good to at leastthree countries in any given month), finding the median coefficient of varia-tion within firm across destination markets cν(P
NZDfgxt ) is 0.326. Restricting
to trade relationships where the currency of invoice is NZD (foreign), themedian rises (falls) slightly to 0.348 (0.300).20
Since the presence of dispersion across destinations could suggest firms arediscriminating on price across markets, we attempt to identify any system-atic relationship between country characteristics and unit values.We do thisby regressing the relative unit value on relative GDP per capita (proxyingfor income) and distance, bearing in mind that shipment values are mea-sured before transport costs, but that differential trade costs may affect thecomposition of goods that firms send to destinations (see, eg, Fabling et al2009). Relative values are derived by dividing through by the mean value atthe firm, good, currency and month level.
Table 2 summarises regression coefficients for this equation estimated on thewhole population and on the sub-population of NZD and foreign invoicedtrades. Consistent with the empirical literature, we find positive and sig-nificant coefficients for both relative distance and GDP per capita. Hallak(2006) also finds a positive relationship between export unit values and theGDP per capita of the destination market. Extending the Linder (1961) hy-pothesis, Hallak suggests wealthier countries demand higher quality goods.In addition, a positive and statistically significant relationship between dis-
20 Consistent with Goldberg and Tille (2008) who find that less differentiated goods aremore likely to be traded in international currencies of trade (ie, “vehicle” currencies,primarily the USD).
13

tance and export unit values is consistent with estimation of Alchian-Alleneffects in Hummels and Skiba (2004), and with QHFT trade models – ifwe are prepared to interpret higher unit values as reflecting higher qualityproducts.
Both the across- and within-firm analyses above suggest the detailed level ofobservation will help eliminate changes in P caused by composition. How-ever, we should still expect residual heterogeneity within goods that mightonly be eliminated by, say, observations of specific consistently measuredgoods (eg, bar code price studies such as Broda and Weinstein 2008).
Some suggestion of remaining composition issues can be found by looking atgoods whose Harmonised System descriptor contains the phrase “not else-where classified (nec)”. Within goods being traded, we observe larger dis-persions for product categories that are described in this manner. On anunweighted basis, this categorisation is material, since roughly a quarter ofobservations of P are of this type. Controlling for country and currency, themedian coefficient of variation for goods defined as nec is 0.934, comparedto a median of 0.429 for non-nec goods suggesting that composition effectsmay be more of a problem in categories that are not so narrowly defined.Throughout the rest of the paper, we retain these observations on the main-tained assumption that homogeneity within these categories is likely to behigher at the firm-level.
3.3 Other measurement issues
Before presenting empirical results, we discuss non-compositional measure-ment issues. These issues are particularly pertinent to situating our findingsin the empirical literature where administrative trade data is not the sourceof price information. As our benchmark for comparison we use Gopinathand Rigobon (2008), who find significant stickiness in traded goods pricesusing surveyed micro-data from the United States. Whether survey pricesreflect the actual price charged by firms more accurately than unit valuesis debatable. Self-reported price surveys and FOB unit value derived fromCustoms data are subject to many common critiques. For example, it ispossible respondents/exporter’s fill out forms incorrectly or forms are filledout inconsistently over time. In particular, firms may be reluctant to reportall price changes because, eg, there is a cost to varying their response fromlast time, or price changes are “small” and therefore overlooked.
Survey design may exacerbate these latter biases towards finding greater price
14
stickiness. For example, the survey data underlying Gopinath and Rigobon(2008) allows firms to report a fixed contract price in advance for multiplemonths. In the case of administrative data, at least, there is an ability tosanction firms for misreporting. Furthermore, administrative data generallycollects much more and much finer detail than is possible through surveys. Itis somewhat unclear what survey respondents will report when the same goodis traded at multiple prices (potentially biasing stickiness results downwards).This problem is encountered less often when more detailed disaggregation isrequired (as per our discussion above), though the strength of the argumentis conditional on respondents accessing data that is relevant to the morespecific question rather than, say, applying “rules of thumb” at higher levelsof aggregation.
In defence of the survey method, unit values could bias results towards findinglittle price stickiness since data for every trade is reported and any inconsis-tency in reporting FOB value or quantity of goods shipped could generatesmall fluctuations in unit values that are not actual price changes. Arguably,there is more room for measurement error when using FOB values and quan-tity to proxy for price, rather than direct price data since we have to performa division (ie, value over quantity). Of course, this point assumes surveyedrespondents reference a price directly.
Since we do not have direct surveyed prices of individual export goods in NewZealand, we cannot separate the impact of different data collection methodsfrom differing market conditions. For an example of the latter, recall thatthe vast majority of US exporters contract in USD suggesting that, at aminimum, US firms are likely to be less exposed to fluctuations in exportreceipts due to currency movements than exporters in other jurisdictions(Gopinath and Rigobon 2008; Goldberg and Tille 2008). The fact that thosefirms are not exposed to as many currencies in trade may well also reflectan asymmetry in market power between US and other firms which couldpresumably flow through into price-setting behaviour.
One way to check for potential measurement error in ∆P FX is to test forautocorrelation in unit values changes. We do this by regressing ∆P FX
fcgxt, onits lagged value (ie, at t−Mt) yielding a statistically significant (p = 0.000)relationship with a coefficient of -0.39. The negative coefficient is consistentwith both measurement error and/or some temporary shock(s) impacting onunit values. Separating the population on the median FOB New Zealandvalue, as a proxy for populations of large and small firms, we estimate therelationship again finding a coefficient of -0.41 for larger firms and -0.39 forsmaller firms, suggesting that if the story is one of measurement error, it is
15
not particularly more troublesome in smaller trade relationships.
In common with other types of export price data, we also have to considerthe self-selection nature of our trade data. If a firm does not trade, we do notobserve whether a product changes price. “Take it or leave it” offers of pricevariation by trading partners (perhaps driven by currency movements) couldinduce entry or exit by New Zealand exporters.21 This analysis makes noadjustment for attrition and compares unit values across consecutive tradingmonths.
One adjustment we do make when we consider price stickiness (ie, the sameunit value persisting over time) is to allow for the possibility that roundingof reported Customs values has affected our measure of ∆P . In the nextsection we consider various threshold values at which we treat a unit pricechange as sticky.
Finally, in the LBD, t refers to the time the shipment clears Customs ratherthan the time when the trade contract was signed. Since this latter date isour ideal for analysing ERPT issues and there could be any number of monthslag between contract signing and delivery, we potentially have a measurementissue with our right-hand side variable, the currency movement over time.22
3.4 Data summary
Overall, we have argued that controlling for a firm, good, destination, andcurrency is a substantial attempt at controlling for heterogeneity that couldcause us to underestimate export unit value stickiness. Despite these con-trols P should be viewed as a proxy for a price and likely subject to somemeasurement error. With this in mind we focus on the dynamics of exportunit value changes and the relationship between ∆P FX and movements inthe bilateral exchange rate with the currency of invoice.
4 Unit value stickiness
We begin our empirical analysis by estimating the “stickiness” of export unitvalues – the percentage of trades where P is observed to stay approximately
21 Or, alternatively, fixed NZD price offers from NZ exporters could result in variableforeign demand.
22 The next version of the paper will include lagged values of the exchange rate changeto partially account for this issue.
16

Table 3Proportion of sticky unit values
Unweighted Trade-weighted∆PFX ∆PFX ∆PNZD ∆PFX ∆PFX ∆PNZD
Range x = NZD x 6= NZD x 6= NZD x = NZD x 6= NZD x 6= NZD0 0.051 0.034 0.002 0.015 0.008 0.000
[−0.001, 0.001] 0.079 0.073 0.014 0.051 0.047 0.015[−0.005, 0.005] 0.123 0.140 0.062 0.107 0.140 0.070[−0.010, 0.010] 0.168 0.199 0.121 0.172 0.219 0.139Underlying counts random-rounded to base three for confidentiality reasons.
Table 4Summary statistics for ∆P FX by currency of trade
Currency (x) N mean median st. dev. | ∆PFX |< 0.001NZD 232,974 0.002 0.000 0.583 0.079USD 150,735 0.007 0.000 0.471 0.083AUD 78,972 -0.002 0.000 0.573 0.054EUR 24,762 0.000 0.000 0.442 0.069GBP 10,728 -0.001 0.000 0.580 0.074Counts random-rounded to base three for confidentiality reasons.
the same over time. Table 3 sets out the proportion of sticky unit values usingdifferent thresholds. Observed in the currency of invoice, the percentage ofsticky unit values is roughly equal for NZD- and foreign-denominated trades,although slightly higher for NZD trade at low thresholds and slightly higherfor foreign invoiced trades at higher thresholds (the first two columns of thetable). The trade-weighted results suggest that smaller value trades are morelikely to be sticky at low threshold levels. Foreshadowing the exchange ratepass through results in the following section, the NZD-converted unit valueof foreign currency trade (columns 3 and 6 of table 3) are far less sticky thanthe invoiced currency value (columns 2 and 5).
Overall, most unit values change frequently. Figure 1 reinforces this pointby plotting the distribution of ∆P FX . Having said that, while this figureexcludes observations in the tails,23 it is clear that changes in unit valuesare clustered around zero. Table 4 reports summary statistics for ∆P FX
for the top five trading currencies and proportions of sticky values using athreshold value of 0.001. Consistent with the overall picture, changes in P FX
are centred on zero for every major currency of invoice.
23 In compliance with Statistics NZ confidentiality requirements.
17

Figure 1Distribution of ∆P FX
5 Exchange rate pass-through
There are many reasons why firms might change prices. In this section weconsider the possibility that exporters invoicing in a foreign currency couldbe motivated to smooth the NZD value of that income. Given that rationalefor pricing behaviour, we would expect to see P FX increase if the NZD ap-preciated against the currency of invoice. We would also expect successfulsmoothing of NZD-converted income to show up in measurable price stick-iness in PNZD where x 6= NZD. We have already seen from table 3 thatthis latter observation is not apparent, at least at low threshold values fordefining stickiness. However, it is still possible that some of the variabil-ity NZD-converted income is smoothed by passing on some exchange ratevariation into foreign unit values.
Our method for testing the strength of any ERPT relationship is simple –we regress ∆P FX on the cumulative log change of the bilateral exchange ratebetween the currency of invoice and the NZD (we use the nominal exchangerate in units of foreign currency per New Zealand dollar, eg, XUSD,t = 0.6
18

Table 5Exchange rate pass through estimation
(1) (2) (3) (4)∆FXx 0.108 0.042
p0 (0.021) (0.678)p1 (0.000) (0.000)
∆FXx,M = 1 0.092p0 (0.086)p1 (0.000)
∆FXx,M > 1 0.193p0 (0.006)p1 (0.000)
∆FXx > 0 0.131p0 (0.204)p1 (0.000)
∆FXx < 0 0.027p0 (0.775)p1 (0.000)
Test: coef. equiv. (0.255) (0.462)N 280,890 280,890 280,890 280,890R2 0.000 0.000 0.001 0.000Robust p-values in brackets. Counts random-rounded tobase 3 for confidentiality reasons. Columns 2 and 4include unreported subgroup constants. Column 3 isimplemented using Stata’s areg command.
means that one NZD buys 0.6 USD):
∆P FXfcgxt = β∆FXfcgxt + εfcgxt, (3)
∆FXfcgxt =1
Mt
(lnXx,t − lnXx,t−Mt) . (4)
where Mt is defined as before. In this specification a positive coefficient onβ less than one implies incomplete pass-through, but some ability of NZexporters to pass currency risk to foreign buyers.
Tables 5 and 6 estimate the effect of ∆FX on ∆P FX for the whole populationof firms and by major foreign currency of invoice respectively. Focussingon table 5 first, column one shows the simple OLS estimate of β is 0.108.Roughly 11 percent of any exchange rate movement is carried through intosubsequent contracted unit values. Two tests (reported p-values) are includedand imply the rejection of no positive relationship between unit value changesand currency movements (the p0 row, rejected at the 5 percent level), andrejection of complete pass-through (ie, that β = 1) at the 1 percent level.Subsequent specifications test the robustness of this result.
Firstly, in column two, we separate the population into observations of P FX
that occur over consecutive months and those that have at least a one monthgap between trades (bearing in mind that both the dependent and indepen-dent variables have been normalised by the period between trades, Mt). We
19
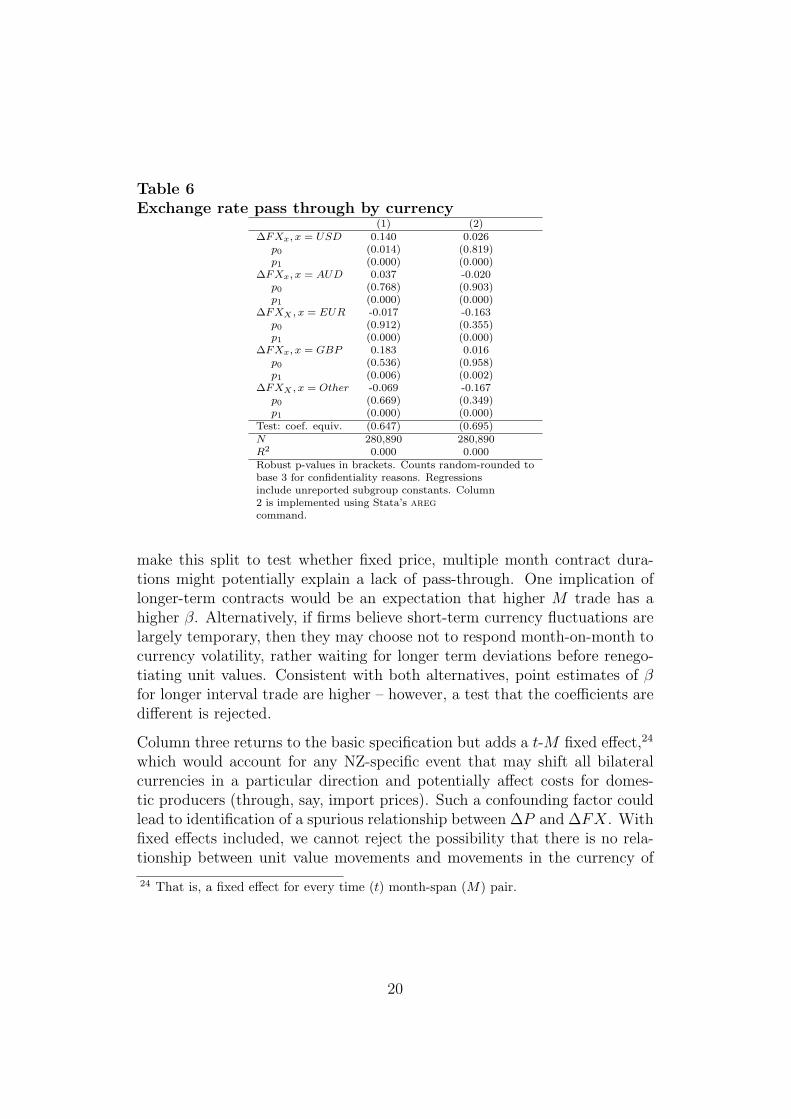
Table 6Exchange rate pass through by currency
(1) (2)∆FXx, x = USD 0.140 0.026
p0 (0.014) (0.819)p1 (0.000) (0.000)
∆FXx, x = AUD 0.037 -0.020p0 (0.768) (0.903)p1 (0.000) (0.000)
∆FXX , x = EUR -0.017 -0.163p0 (0.912) (0.355)p1 (0.000) (0.000)
∆FXx, x = GBP 0.183 0.016p0 (0.536) (0.958)p1 (0.006) (0.002)
∆FXX , x = Other -0.069 -0.167p0 (0.669) (0.349)p1 (0.000) (0.000)
Test: coef. equiv. (0.647) (0.695)N 280,890 280,890R2 0.000 0.000Robust p-values in brackets. Counts random-rounded tobase 3 for confidentiality reasons. Regressionsinclude unreported subgroup constants. Column2 is implemented using Stata’s aregcommand.
make this split to test whether fixed price, multiple month contract dura-tions might potentially explain a lack of pass-through. One implication oflonger-term contracts would be an expectation that higher M trade has ahigher β. Alternatively, if firms believe short-term currency fluctuations arelargely temporary, then they may choose not to respond month-on-month tocurrency volatility, rather waiting for longer term deviations before renego-tiating unit values. Consistent with both alternatives, point estimates of βfor longer interval trade are higher – however, a test that the coefficients aredifferent is rejected.
Column three returns to the basic specification but adds a t-M fixed effect,24
which would account for any NZ-specific event that may shift all bilateralcurrencies in a particular direction and potentially affect costs for domes-tic producers (through, say, import prices). Such a confounding factor couldlead to identification of a spurious relationship between ∆P and ∆FX. Withfixed effects included, we cannot reject the possibility that there is no rela-tionship between unit value movements and movements in the currency of
24 That is, a fixed effect for every time (t) month-span (M) pair.
20

Figure 2Distribution of ∆PNZ by currency and periods of currency appre-ciation and depreciation
trade, though we still reject complete pass-through.25
In column four of table 5, we test for differences in ERPT when the NZD isappreciating or depreciating against the currency of invoice. We perform thistest motivated by the possibility that NZ firms may have weak price-settingability (relative to trading partners) so that bilateral currency movementsare only passed on to unit values when that would raise the profits of theimporter. A predominance of such trade relationships would imply a lowercoefficient on ∆FX during appreciations. Alternatively, and yielding thesame implications for coefficients, firms may strategically pass on exchangerate driven foreign prices declines (eg, to gain market share),26 but be un-willing to raise prices during adverse currency movements say, because ofimplicit contracts with customers (as in Blinder 1991). The empirical resultssuggest point estimates of β are lower during appreciations of the NZD but,
25 An alternative approach would be to introduce additional independent variables thatmight be thought to systematically affect ∆PFX including the bilateral exchange ratewith the country of trade, which may be important over longer time intervals (M).This approach is left to the next version of the paper.
26 Or maintain prices during depreciations of the NZD to increase profits.
21

not significantly different across the two sub-populations.27
Finally, in table 6, we split across currencies of trade. Estimated coefficientsare reported both without (column 1) and with t-M fixed effect (column 2).Once again we reject differences in sub-population pass-through coefficientsand reject complete pass-through.
To summarise, we consistently find that exchange rate pass through is lessthan complete – we reject β = 1, at the 1 percent level, in every specifica-tion. Without risk mitigation strategies such as hedging currency exposure,the absence of substantial foreign price adjustment results in a substantiallydifferent picture of ∆PNZD from that presented for ∆P FX . This outcome isshown in Figure 2, which plots the distribution of the NZD-converted unitvalue (ie, PNZD) split by whether the currency of invoice is appreciating(ie, NZ firms receiving lower profits, ceteris paribus) or depreciating.28 Formonths where the bilateral exchange rate with the currency of trade de-preciates, NZD converted unit values are positively skewed. For periods ofdepreciation, NZD unit value changes are negatively skewed. This is com-pared with figure 1 and the summary statistics presented in table 4 whichclearly show distributions centred on zero – that is, a tendency for unit valuesto stay relatively stable, if not completely sticky, in the currency of trade.
6 Conclusion
We have documented the dispersion in export unit values across firms tradingthe same good, and within firms trading the same good, across destinationmarkets. In particular, our results for firm-level price discrimination suggestdistance and GDP per capita of the destination market play a significant rolein explaining observed export unit values. Dispersion in product unit valuesboth across and within firms motivates us to examine the evolution of exportunit prices at the detailed firm-product-country-currency level.
Using this detailed measure of ∆P FX we find that unit values of export goodstend to be reasonably flexible over time and that changes in unit values aresimilar across New Zealand Dollar (NZD)- and foreign currency-denominatedcontracts. However, NZD trades tend to be smaller and more likely to be one-off so that, on a trade-weighted basis, contracts written in foreign currencies
27 Currency difference could explain why the point estimates are the wrong way around??28 This calculation ignores the available hedging data. Future work could usefully test
whether NZD-converted values are less variable when hedging rates are taken intoaccount.
22

are dominant. Focussing on the sub-population where x 6= NZD, we haveexamined the role that movements in the bilateral exchange rate between thecurrency of invoice and NZD play in determining unit value changes. Acrossa number of specifications, we reject the possibility that NZ firms negotiatethe foreign (contracted) value of their goods in order to completely smooththe (realised) NZD value – that is, we reject complete exchange rate passthrough. We observe two natural consequences flowing from incomplete pass-through. First, unit value stickiness is almost non-existent at the preferred(ie, 0.001) threshold level. Second, the NZD-converted income from foreigntrades is impacted by currency appreciations and depreciations implying thatshort-run currency movements have implications for firms’ bottom lines.
This last result is consistent with earlier research showing that firms tradingto Australia actively manage exchange rate risk (Fabling and Grimes 2008).The next version of this paper will test whether such hedging practices resultin greater stickiness in NZD-converted unit values, as well as addressing anumber of methodological issues identified in the paper (such as controllingfor the bilateral exchange rate with the country of trade, and accounting forthe timing between contract and shipment dates).
23

References
Athukorala, P and J Menon (1994), “Pricing to market behaviour andexchange rate pass-through in Japanese exports,” Economic Journal,104(423), 271–281.
Baldwin, R and J Harrigan (2007), “Zeros, quality and space: Tradetheory and trade evidence,” National Bureau of Economic Research,Working Papers, 13214.
Baldwin, R and T Ito (2008), “Quality competition versus price compe-tition goods: An empirical classification,” National Bureau of Eco-nomic Research, Working Papers, 14305.
Berman, N, P Martin, and T Mayer (2009), “How do different firmsreact to exchange rate variations: Prices, quantity, and entry-exit,”paper presented at 2009 American Economic Association meeting,San Francisco.
Betts, C and M Devereux (2000), “Exchange rate dynamics in a modelof pricing-to-market,” Journal of International Economics, 50(1),215–244.
Blinder, A (1991), “Why are prices sticky? Preliminary results from aninterview study,” AEA Papers and Proceedings, 81(2), 89–100.
Broda, C and D Weinstein (2008), “Understanding international pricedifferences using barcode data,” National Bureau of Economic Re-search, Working Papers, 14017.
Bugamelli, M and R Tedeschi (2008), “Pricing-to-market and marketstructure,” Oxford Bulletin of Economics and Statistics, 70(2), 155–180.
Campa, J and L Goldberg (2005), “Exchange rate pass-through intoimport prices,” The Review of Economics and Statistics, 87(4), 679–690.
Co, C (2007), “Factors that account for the large variations in U.S.export prices,” Review of World Economics, 143(3), 557–582.
Dornbusch, R (1987), “Exchange rates and prices,” American EconomicReview, 77(1), 93–106.
Fabling, R and A Grimes (2008), “Over the hedge? Exporters’ opti-mal and selective hedging choices,” Reserve Bank of New Zealand,Discussion Papers, DP2008/14.
Fabling, R and L Sanderson (2008), “Entrepreneurship and aggregatemerchandise trade growth in New Zealand,” paper presented at 11thMcGill International Entrepreneurship Conference, Dunedin, NewZealand.
Fabling, R, L Sanderson, and D Taglioni (2009), “Exchange rate uncer-
24

tainty and firms’ trade,” Reserve Bank of New Zealand, DiscussionPapers, forthcoming.
Fitzgerald, D and S Haller (2008), “Exchange rates and producer prices:Evidence from micro-data,” Stanford mimeo.
Fontagne, L, G Gaulier, and S Zignago (2008), “Specialization acrossvarieties and North-South competition,” Economic Policy, 23(1), 51–91.
Friberg, R and F Wilander (2008), “The currency denomination of ex-ports – a questionnaire study,” Journal of International Economics,75(1), 54–69.
Gaulier, G, A Lahreche-Revil, and I Mejean (2008), “Exchange-ratepass-through at the product level,” Canadian Journal of Economics,41(2), 425–449.
Goldberg, L and C Tille (2008), “Vehicle currency use in internationaltrade,” Journal of International Economics, 76, 177–192.
Goldberg, P and R Hellerstein (2007), “A framework for identifyingthe sources of local-currency price stability with an empirical ap-plication,” National Bureau of Economic Research, Working Paper,13183.
Goldberg, P and R Hellerstein (2008), “A structural approach toexplaining incomplete exchange-rate pass-through and pricing-to-market,” American Economic Review, 98(2), 423–29.
Goldberg, P and M Knetter (1997), “Goods prices and exchange rates:What have we learned?” Journal of Economic Literature, 35(3),1243–1272.
Goldberg, P and F Verboven (2005), “Market integration and conver-gence to the law of one price: Evidence from the European car mar-ket,” Journal of International Economics, 65(1), 49–73.
Gopinath, G and R Rigobon (2008), “Sticky borders,” The QuarterlyJournal of Economics, 123(2), 531–575.
Hallak, J and P Schott (2008), “Estimating cross-country differences inproduct quality,” National Bureau of Economic Research, WorkingPaper, 13807.
Hallak, J C (2006), “Product quality and the direction of trade,” Journalof International Economics, 68(1), 238–265.
Hummels, D and P Klenow (2005), “The variety and quality of a nation’sexports,” American Economic Review, 95(3), 704–723.
Hummels, D and A Skiba (2004), “Shipping the good apples out? Anempirical confirmation of the Alchian-Allen conjecture,” Journal ofPolitical Economy, 112(6), 1384–1402.
Knetter, M (1989), “Price discrimination by U.S. and German ex-
25

porters,” American Economic Review, 79(1), 198–210.Krugman, P (1980), “Vehicle currencies and the structure of interna-
tional exchange,” Journal of Money, Credit and Banking, 12(3), 513–526.
Krugman, P (1987), “Pricing to market when the exchange ratechanges,” in Real-Financial Linkages among Open Economies, edsS Arndt and J D Richardson, 49–70, The MIT Press, Cambridge,MA.
Linder, S (1961), An Essay on Trade and Transformation, Wiley.Mallick, S and H Marques (2008), “Pass-through of exchange rate and
tariffs into import prices of India: Currency depreciation versus im-port liberalization,” Review of International Economics, 16(4), 765–782.
Melitz, M (2003), “The impact of trade on intra-industry reallocationsand aggregate industry productivity,” Econometrica, 71(6), 1695–1725.
Obstfeld, M and K Rogoff (1995), “Exchange rate dynamics redux,”Journal of Political Economy, 103(3), 624–60.
Parsons, C and K Sato (2006), “Exchange rate pass-through and cur-rency invoicing: Implications for monetary integration in East Asia,”The World Economy, 29(12), 1759–1788.
Rauch, J (1999), “Networks versus markets in international trade,”Journal of International Economics, 48, 7–35.
Schott, P (2004), “Across-product versus within-product specializationin international trade,” The Quarterly Journal of Economics, 119(2),646–677.
Silver, M (2007), “Do unit value export, import, and terms of tradeindices represent or misrepresent price indices?” International Mon-etary Fund, Working Paper, 07/121.
26