The Evolution of APEC and its Role in Philippine …...The Evolution of APEC and its Role in...
68
DISCUSSION PAPER SERIES NO. 2019-07 JULY 2019 The Evolution of APEC and its Role in Philippine Trade and Investment Francis Mark A. Quimba and Mark Anthony A. Barral The PIDS Discussion Paper Series constitutes studies that are preliminary and subject to further revisions. They are being circulated in a limited number of copies only for purposes of soliciting comments and suggestions for further refinements. The studies under the Series are unedited and unreviewed. The views and opinions expressed are those of the author(s) and do not necessarily reflect those of the Institute. Not for quotation without permission from the author(s) and the Institute. CONTACT US: RESEARCH INFORMATION DEPARTMENT Philippine Institute for Development Studies 18th Floor, Three Cyberpod Centris - North Tower EDSA corner Quezon Avenue, Quezon City, Philippines [email protected] (+632) 372-1291/(+632) 372-1292 https://www.pids.gov.ph
Transcript of The Evolution of APEC and its Role in Philippine …...The Evolution of APEC and its Role in...
DISCUSSION PAPER SERIES NO. 2019-07
JULY 2019
The Evolution of APEC and its Role in Philippine Trade and Investment
Francis Mark A. Quimba and Mark Anthony A. Barral
The PIDS Discussion Paper Series constitutes studies that are preliminary and subject to further revisions. They are being circulated in a limited number of copies only for purposes of soliciting comments and suggestions for further refinements. The studies under the Series are unedited and unreviewed. The views and opinions expressed are those of the author(s) and do not necessarily reflect those of the Institute. Not for quotation without permission from the author(s) and the Institute.
CONTACT US:RESEARCH INFORMATION DEPARTMENTPhilippine Institute for Development Studies
18th Floor, Three Cyberpod Centris - North Tower EDSA corner Quezon Avenue, Quezon City, Philippines
[email protected](+632) 372-1291/(+632) 372-1292 https://www.pids.gov.ph
The Evolution of APEC and its Role in Philippine Trade and Investment
Francis Mark A. Quimba and Mark Anthony A. Barral
PHILIPPINE INSTITUTE FOR DEVELOPMENT STUDIES
July 2019

1
Abstract This paper presents how APEC has evolved as an institution, the changes it undergoes and the challenges it has faced for the past decades. More importantly, this paper tries to enumerate the roles of APEC in positioning the Philippines in the global economy. Established in 1989 in Canberra, Australia, with twelve founding members, APEC desired to promote economic growth, foster and strengthen trade, and improve the living standards in the Region. Started as a simple program for sectoral and trade initiatives, APEC has come to achieve to become the largest are of free trade and investment by 2020. Forged and adopted in Bogor, Indonesia, in 1994, this challenge was known as the Bogor Goals, which aims to achieve long-term free and open trade not later than 2020; in particular, by 2010 for developed economies and by 2020 for developing economies. To ensure the achievement of Bogor Goals, three pillars were created as the main strategies of APEC. The first pillar is the Trade and Investment Liberalization. Through unilateral liberalization, APEC members voluntarily agree to liberalize a particular trade and investment area, including tariffs, non-tariff measures, services, investment, standards and conformance, customs procedures, and intellectual property rights, among others. This is done using the Individual Action Plans (IAPs), prepared by individual economy. The second pillar is Trade Facilitation, which eases and lessens the cost of doing business in the region by facilitating more efficient standards, customs, and other procedures relating to e-commerce, business travel, telecommunications, and government procurement, among others. The last pillar, the Economic and Technical Cooperation (ECOTECH), pertains to the collective actions of APEC to achieve its overall goals of attaining sustainable growth and improving economic and social well-being in the Region. The Trade and Investment Liberalization and Economic and Technical Cooperation were adopted in 1995 in Osaka, Japan, and are collectively known as the Osaka Action Agenda. In 1996, during the Manila Meeting, the Asia Pacific Economic Cooperation Framework for Strengthening Economic Cooperation and Development was adopted to lay down the principles and priorities of ECOTECH. This is known as the Manila Action Plan for APEC (MAPA), which identified six priorities for ECOTECH, including the developing human capital; developing stable, safe and efficient capital markets; strengthening economic infrastructure; harnessing technologies for the future; safeguarding the quality of life through environmentally sound growth; and developing and encouraging the dynamism of small and medium enterprises. The initiatives put forward in APEC help the Philippines stimulate and improve the competitiveness of domestic producers and sectors. It is to the economy’s advantage to utilize these initiatives, backed with the upgrading of domestic facilities to meet global standards and the aligning of domestic regulations. These address behind-the-border barriers that limit the flow of goods and services and expand the coverage of businesses to overseas markets. Trade agreements in APEC also help firms gain access to cheaper inputs and more advanced technologies, which foster competition and increased productivity and growth. Keywords: APEC, globalization, Philippines, TILF, ECOTECH
2
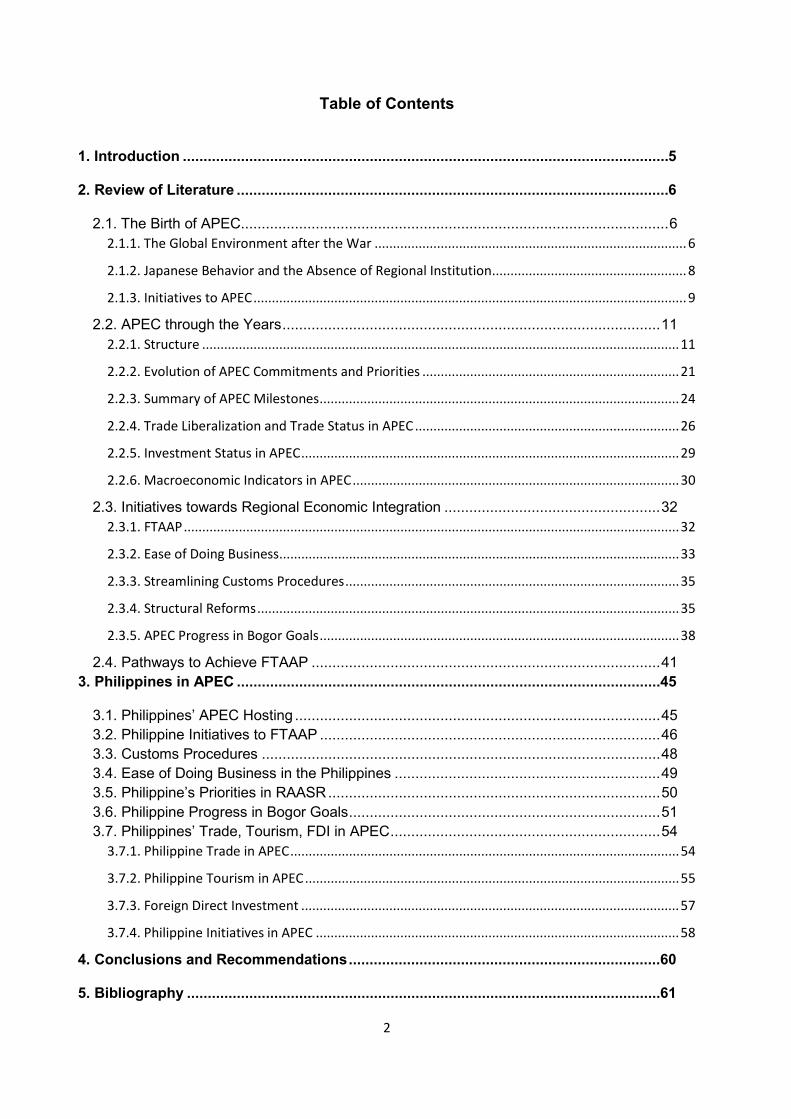
Table of Contents
1. Introduction ..................................................................................................................... 5
2. Review of Literature ........................................................................................................ 6
2.1. The Birth of APEC ....................................................................................................... 6 2.1.1. The Global Environment after the War ..................................................................................... 6
2.1.2. Japanese Behavior and the Absence of Regional Institution ..................................................... 8
2.1.3. Initiatives to APEC ...................................................................................................................... 9
2.2. APEC through the Years ........................................................................................... 11 2.2.1. Structure .................................................................................................................................. 11
2.2.2. Evolution of APEC Commitments and Priorities ...................................................................... 21
2.2.3. Summary of APEC Milestones .................................................................................................. 24
2.2.4. Trade Liberalization and Trade Status in APEC ........................................................................ 26
2.2.5. Investment Status in APEC ....................................................................................................... 29
2.2.6. Macroeconomic Indicators in APEC ......................................................................................... 30
2.3. Initiatives towards Regional Economic Integration .................................................... 32 2.3.1. FTAAP ....................................................................................................................................... 32
2.3.2. Ease of Doing Business ............................................................................................................. 33
2.3.3. Streamlining Customs Procedures ........................................................................................... 35
2.3.4. Structural Reforms ................................................................................................................... 35
2.3.5. APEC Progress in Bogor Goals .................................................................................................. 38
2.4. Pathways to Achieve FTAAP .................................................................................... 41 3. Philippines in APEC ...................................................................................................... 45
3.1. Philippines’ APEC Hosting ........................................................................................ 45 3.2. Philippine Initiatives to FTAAP .................................................................................. 46 3.3. Customs Procedures ................................................................................................ 48 3.4. Ease of Doing Business in the Philippines ................................................................ 49 3.5. Philippine’s Priorities in RAASR ................................................................................ 50 3.6. Philippine Progress in Bogor Goals ........................................................................... 51 3.7. Philippines’ Trade, Tourism, FDI in APEC ................................................................. 54
3.7.1. Philippine Trade in APEC .......................................................................................................... 54
3.7.2. Philippine Tourism in APEC ...................................................................................................... 55
3.7.3. Foreign Direct Investment ....................................................................................................... 57
3.7.4. Philippine Initiatives in APEC ................................................................................................... 58
4. Conclusions and Recommendations ........................................................................... 60
5. Bibliography .................................................................................................................. 61
3
List of Tables Table 1. Saving and GDP Growth Rates in Selected Asian Economies (per cent) ........................................ 8 Table 2. APEC Milestones .......................................................................................................................... 24 Table 3. Accumulated overall progress of Ease of Doing Business Initiative (average values) ................. 34 Table 4. RAASR indicators and associated pillars ...................................................................................... 36 Table 5. APEC progress in RAASR ............................................................................................................... 37 Table 6. APEC Bogor Goals progress (as of November 2018) .................................................................... 39 Table 7. Key features of RCEP and TPP ...................................................................................................... 41 Table 8. Key features of RCEP and TPP ...................................................................................................... 42 Table 9. Issues Covered in RCEP and TPP .................................................................................................. 44 Table 10. Philippine’s actions to improve supply chain ............................................................................. 46 Table 11. Boracay Action Agenda Priorities ............................................................................................... 47 Table 12. Global Competitiveness Report Card of Philippines .................................................................. 49 Table 13. Philippine’s priorities in RAASR .................................................................................................. 50 Table 14. Philippine’s priorities in RAASR (as of November 2018) ............................................................ 51 Table 15. Philippine exports and imports (as of October 2018) ................................................................ 54 Table 16. Top foreign investors in the country .......................................................................................... 57 Table 17. Selected Philippine initiatives in APEC ....................................................................................... 58 List of Figures Figure 1. APEC’s share in global population, GDP, and trade (2017) ........................................................ 11 Figure 2. Initial Structure of APEC (1993) .................................................................................................. 13 Figure 3. APEC Structure as of 2015. ......................................................................................................... 16 Figure 4 (a). APEC Structure as of 2018. .................................................................................................... 19 Figure 4 (b). APEC Structure as of 2018. .................................................................................................... 20 Figure 5. Number of APEC Commitments (1996-2016) ............................................................................. 21 Figure 6. Number of APEC Commitments, by Topic (1996-2016) ............................................................. 22 Figure 7. Percentage Share Duty Free vs. Products with MFN above 10%, 2007-2017 ............................ 26 Figure 8. Cumulative number of FTAs in APEC, pre-1989-2016 ................................................................ 27 Figure 9. Share of trade by value covered by FTA partners (percent), 1997-2017 ................................... 27 Figure 10. Value of merchandise trade (US$ trillion), 2000-2017 ............................................................. 28 Figure 11. Value of commercial services trade (US$ billion), 2007-2017 .................................................. 28 Figure 12. FDI in APEC (US$ billion, share in percent), 2000-2017 ............................................................ 29 Figure 13. Gross fixed capital formation (US$ billion), 1989-2016 ............................................................ 29 Figure 14. GDP per capita (current US$) in APEC, 2017 ............................................................................ 30 Figure 15. Real GDP per capita growth (annual percent), 2000-2017 ....................................................... 30 Figure 16. Unemployment rate in APEC, 2017 .......................................................................................... 31 Figure 17. Number of people living in poverty or near-poverty (million), 1990-2013 .............................. 31 Figure 18. Accumulated progress in EoDB for 2016-2017 (average values).............................................. 34 Figure 19. MFN Tariffs in APEC (average values) ....................................................................................... 38 Figure 20. Number of FTAs/RTAs in-force with APEC services commitments ........................................... 40 Figure 21. Perception on regulatory framework for foreign investments ................................................ 40 Figure 22. MFN applied tariff (HS 6-digit level simple average) ................................................................ 52
4
Figure 23. MFN applied tariffs on agricultural and non-agricultural products (HS 6-digit level simple average) ..................................................................................................................................................... 53 Figure 24. Perception on the investment conditions in the Philippines .................................................... 53 Figure 25. Philippine exports (in US$ million) ............................................................................................ 55 Figure 26. Philippine imports (in US$ million) ........................................................................................... 55 Figure 27. Visitor arrivals to the Philippines, 2011-2018 ........................................................................... 56 Figure 28. Visitor arrivals from APEC (as of September 2018) .................................................................. 56

5
The evolution of APEC and its role in Philippine trade and investment
Francis Mark A. Quimba and Mark Anthony A. Barral∗
1. Introduction As an organization that promotes free trade and economic cooperation in the Asia-Pacific region, APEC has facilitated the establishment of new markets for, among others, agricultural products and raw materials. Aiming to raise the living standards and education through sustainable growth, and to foster a sense of community and an appreciation of shared interests among member states, APEC has committed to uphold three agenda focus of Trade and Investment Liberalization, Business Facilitation, and Economic and Technical Cooperation (ECOTECH). Through the years, APEC has generally been regarded as having effectively shaped the dynamics of Asia-Pacific communities in various areas – political, economic, social, and even environmental. APEC has become the forerunner of peace, growth, and welfare, and has fostered the identity of the region and peoples coming from different social and economic backgrounds but peoples that share and exchange some common history, culture, beliefs and aspirations. Like any other organization, however, APEC have had its own share of predicaments. Influenced by the global economy, APEC is not isolated from the busts and crashes of the economic and financial systems. However, as the influence and impacts of APEC deepen and widen across the world, the friction increases but the cooperation also tightens, solidifying every member economy. It is generally accepted that APEC began as an informational meeting in 1989 – out of a perceived necessity to have a region-wide cooperation. That necessity of having what is now APEC, however, is rooted from deeper historical, political, and economic motivations; understanding of which requires substantial consideration of its transparency, comprehensiveness, and some country-specific dimensions. This paper briefly describes the conception and evolution of APEC and the influence of APEC on trade and investment liberalization of the Philippines. The Philippines, one of the twelve founding members of APEC, has since gained advantage of the freer markets in the region, advancing the country through major growth drivers, such as the boom of business process outsourcing (BPO) industry. It becomes noteworthy to understand the influence of APEC on growth drivers of the country. The would require some consideration of the factors that dictate the changes of, its priorities, structures and policies, including how these have changed over time. With that, this paper seeks to understand the formation and evolution of APEC and how it influenced the Philippine trade and investment. In particular, this paper would try to (a) determine how the APEC structure has evolved; (b) determine the economic factors and political motivations that influenced APEC; and (c) reckon on the future direction of APEC, anticipating the realization of Bogor Goals. ∗ Research Fellow and Research Associate, Philippine Institute for Development Studies.
6
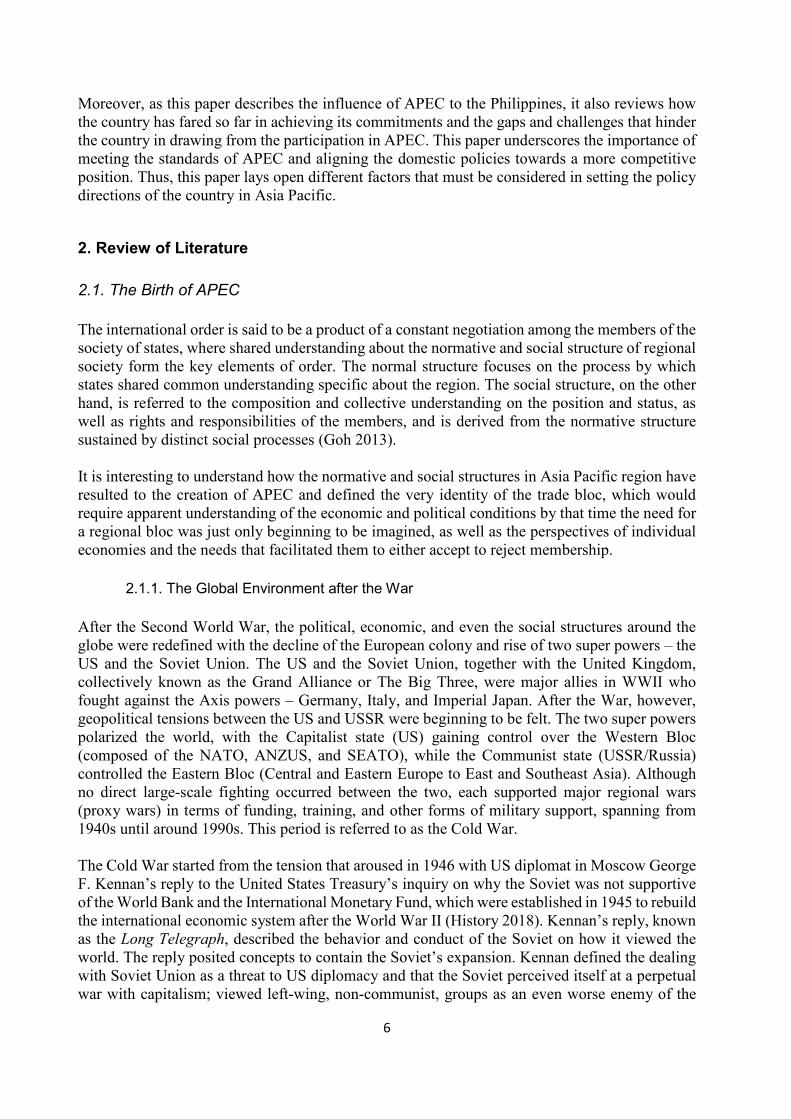
Moreover, as this paper describes the influence of APEC to the Philippines, it also reviews how the country has fared so far in achieving its commitments and the gaps and challenges that hinder the country in drawing from the participation in APEC. This paper underscores the importance of meeting the standards of APEC and aligning the domestic policies towards a more competitive position. Thus, this paper lays open different factors that must be considered in setting the policy directions of the country in Asia Pacific.
2. Review of Literature 2.1. The Birth of APEC The international order is said to be a product of a constant negotiation among the members of the society of states, where shared understanding about the normative and social structure of regional society form the key elements of order. The normal structure focuses on the process by which states shared common understanding specific about the region. The social structure, on the other hand, is referred to the composition and collective understanding on the position and status, as well as rights and responsibilities of the members, and is derived from the normative structure sustained by distinct social processes (Goh 2013). It is interesting to understand how the normative and social structures in Asia Pacific region have resulted to the creation of APEC and defined the very identity of the trade bloc, which would require apparent understanding of the economic and political conditions by that time the need for a regional bloc was just only beginning to be imagined, as well as the perspectives of individual economies and the needs that facilitated them to either accept to reject membership.
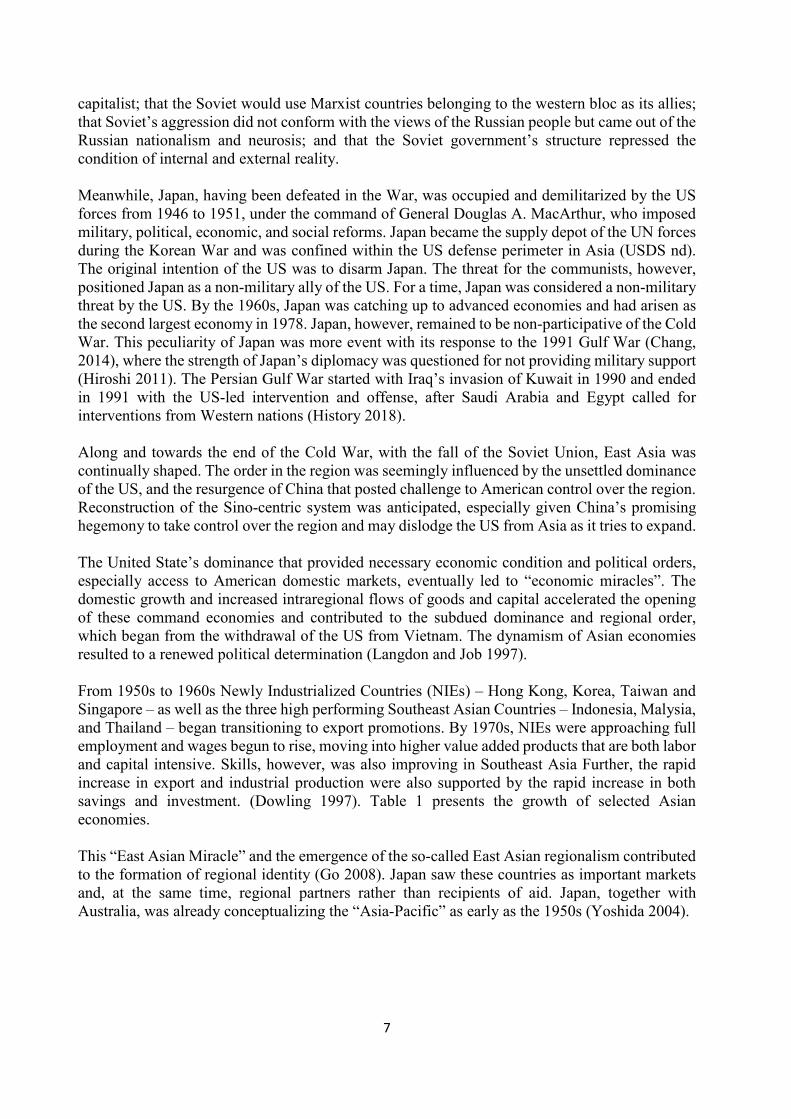
2.1.1. The Global Environment after the War After the Second World War, the political, economic, and even the social structures around the globe were redefined with the decline of the European colony and rise of two super powers – the US and the Soviet Union. The US and the Soviet Union, together with the United Kingdom, collectively known as the Grand Alliance or The Big Three, were major allies in WWII who fought against the Axis powers – Germany, Italy, and Imperial Japan. After the War, however, geopolitical tensions between the US and USSR were beginning to be felt. The two super powers polarized the world, with the Capitalist state (US) gaining control over the Western Bloc (composed of the NATO, ANZUS, and SEATO), while the Communist state (USSR/Russia) controlled the Eastern Bloc (Central and Eastern Europe to East and Southeast Asia). Although no direct large-scale fighting occurred between the two, each supported major regional wars (proxy wars) in terms of funding, training, and other forms of military support, spanning from 1940s until around 1990s. This period is referred to as the Cold War. The Cold War started from the tension that aroused in 1946 with US diplomat in Moscow George F. Kennan’s reply to the United States Treasury’s inquiry on why the Soviet was not supportive of the World Bank and the International Monetary Fund, which were established in 1945 to rebuild the international economic system after the World War II (History 2018). Kennan’s reply, known as the Long Telegraph, described the behavior and conduct of the Soviet on how it viewed the world. The reply posited concepts to contain the Soviet’s expansion. Kennan defined the dealing with Soviet Union as a threat to US diplomacy and that the Soviet perceived itself at a perpetual war with capitalism; viewed left-wing, non-communist, groups as an even worse enemy of the
7
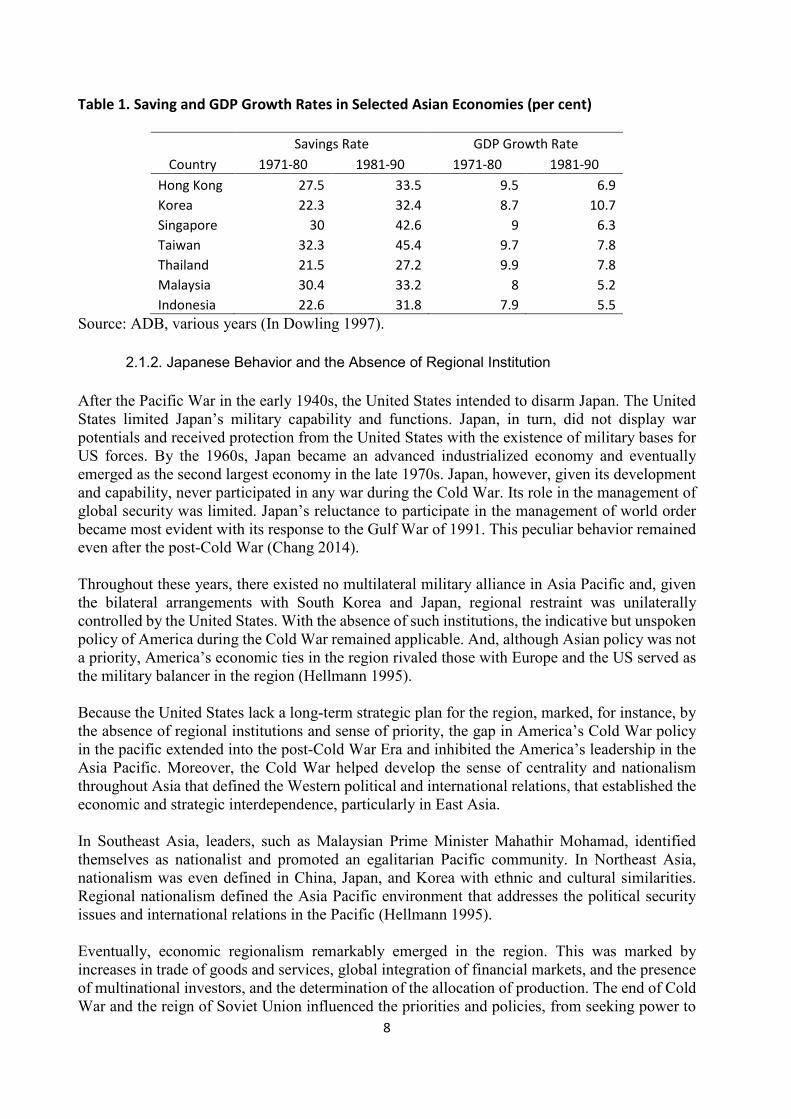
capitalist; that the Soviet would use Marxist countries belonging to the western bloc as its allies; that Soviet’s aggression did not conform with the views of the Russian people but came out of the Russian nationalism and neurosis; and that the Soviet government’s structure repressed the condition of internal and external reality. Meanwhile, Japan, having been defeated in the War, was occupied and demilitarized by the US forces from 1946 to 1951, under the command of General Douglas A. MacArthur, who imposed military, political, economic, and social reforms. Japan became the supply depot of the UN forces during the Korean War and was confined within the US defense perimeter in Asia (USDS nd). The original intention of the US was to disarm Japan. The threat for the communists, however, positioned Japan as a non-military ally of the US. For a time, Japan was considered a non-military threat by the US. By the 1960s, Japan was catching up to advanced economies and had arisen as the second largest economy in 1978. Japan, however, remained to be non-participative of the Cold War. This peculiarity of Japan was more event with its response to the 1991 Gulf War (Chang, 2014), where the strength of Japan’s diplomacy was questioned for not providing military support (Hiroshi 2011). The Persian Gulf War started with Iraq’s invasion of Kuwait in 1990 and ended in 1991 with the US-led intervention and offense, after Saudi Arabia and Egypt called for interventions from Western nations (History 2018). Along and towards the end of the Cold War, with the fall of the Soviet Union, East Asia was continually shaped. The order in the region was seemingly influenced by the unsettled dominance of the US, and the resurgence of China that posted challenge to American control over the region. Reconstruction of the Sino-centric system was anticipated, especially given China’s promising hegemony to take control over the region and may dislodge the US from Asia as it tries to expand. The United State’s dominance that provided necessary economic condition and political orders, especially access to American domestic markets, eventually led to “economic miracles”. The domestic growth and increased intraregional flows of goods and capital accelerated the opening of these command economies and contributed to the subdued dominance and regional order, which began from the withdrawal of the US from Vietnam. The dynamism of Asian economies resulted to a renewed political determination (Langdon and Job 1997). From 1950s to 1960s Newly Industrialized Countries (NIEs) – Hong Kong, Korea, Taiwan and Singapore – as well as the three high performing Southeast Asian Countries – Indonesia, Malysia, and Thailand – began transitioning to export promotions. By 1970s, NIEs were approaching full employment and wages begun to rise, moving into higher value added products that are both labor and capital intensive. Skills, however, was also improving in Southeast Asia Further, the rapid increase in export and industrial production were also supported by the rapid increase in both savings and investment. (Dowling 1997). Table 1 presents the growth of selected Asian economies. This “East Asian Miracle” and the emergence of the so-called East Asian regionalism contributed to the formation of regional identity (Go 2008). Japan saw these countries as important markets and, at the same time, regional partners rather than recipients of aid. Japan, together with Australia, was already conceptualizing the “Asia-Pacific” as early as the 1950s (Yoshida 2004).
8
Table 1. Saving and GDP Growth Rates in Selected Asian Economies (per cent)
Country Savings Rate GDP Growth Rate
1971-80 1981-90 1971-80 1981-90 Hong Kong 27.5 33.5 9.5 6.9 Korea 22.3 32.4 8.7 10.7 Singapore 30 42.6 9 6.3 Taiwan 32.3 45.4 9.7 7.8 Thailand 21.5 27.2 9.9 7.8 Malaysia 30.4 33.2 8 5.2 Indonesia 22.6 31.8 7.9 5.5
Source: ADB, various years (In Dowling 1997).
2.1.2. Japanese Behavior and the Absence of Regional Institution After the Pacific War in the early 1940s, the United States intended to disarm Japan. The United States limited Japan’s military capability and functions. Japan, in turn, did not display war potentials and received protection from the United States with the existence of military bases for US forces. By the 1960s, Japan became an advanced industrialized economy and eventually emerged as the second largest economy in the late 1970s. Japan, however, given its development and capability, never participated in any war during the Cold War. Its role in the management of global security was limited. Japan’s reluctance to participate in the management of world order became most evident with its response to the Gulf War of 1991. This peculiar behavior remained even after the post-Cold War (Chang 2014). Throughout these years, there existed no multilateral military alliance in Asia Pacific and, given the bilateral arrangements with South Korea and Japan, regional restraint was unilaterally controlled by the United States. With the absence of such institutions, the indicative but unspoken policy of America during the Cold War remained applicable. And, although Asian policy was not a priority, America’s economic ties in the region rivaled those with Europe and the US served as the military balancer in the region (Hellmann 1995). Because the United States lack a long-term strategic plan for the region, marked, for instance, by the absence of regional institutions and sense of priority, the gap in America’s Cold War policy in the pacific extended into the post-Cold War Era and inhibited the America’s leadership in the Asia Pacific. Moreover, the Cold War helped develop the sense of centrality and nationalism throughout Asia that defined the Western political and international relations, that established the economic and strategic interdependence, particularly in East Asia. In Southeast Asia, leaders, such as Malaysian Prime Minister Mahathir Mohamad, identified themselves as nationalist and promoted an egalitarian Pacific community. In Northeast Asia, nationalism was even defined in China, Japan, and Korea with ethnic and cultural similarities. Regional nationalism defined the Asia Pacific environment that addresses the political security issues and international relations in the Pacific (Hellmann 1995). Eventually, economic regionalism remarkably emerged in the region. This was marked by increases in trade of goods and services, global integration of financial markets, and the presence of multinational investors, and the determination of the allocation of production. The end of Cold War and the reign of Soviet Union influenced the priorities and policies, from seeking power to
9
gaining wealth. The interdependence further complicates international relations that later involved between firms and states. The strategic alliances between multinational corporations impacted the statuses of states and dictated international relationships, highlighting the role of the states to deal economic conflicts. This new wave of global regionalism created international organizations such as North American Free Trade Agreement and the European Union, as well as APEC in 1989. The decline of US hegemony, which was very prominent by the 50’s and 60s that enabled the US to manage international economic and financial systems, the collapse of Cold War and Soviet Union, the changes in the North-South relations that liberalize the global economy, and the political incentives to promote globalization altogether paved the way to a new brand of regionalism (Watanabe and Kikuchi 1995).
2.1.3. Initiatives to APEC Prior to the Afro-Asian conference initiated by the Indonesian President, Sukarno, in 1953, fourteen Asian countries met with some of the African states to establish unity and friendship, promote cooperation; to consider social, economic, and cultural difficulties; to consider any concerns common to both Asian and African peoples; and to evaluate the position of Africa and Asia in the world economy and their roles in maintaining and increasing world peace. On April 12-24, 1955, 23 Asian and six African countries met in Bandung, Indonesia, to promote the mutual cooperation among Asian-African nations, having different social and political systems. The Bandung conference created a favorable atmosphere and reduced international tensions and gave birth to the Non-Alignment Movement, which became the safeguard of peace, freedom and justice, and has worked for maintaining peace, security, disarmament, and independence, development and cooperation. The conference aimed to discuss how to attain economic, political, and cultural cooperation and to eliminate racialism and colonialism. It was a declaration of world peace and cooperation, and a declaration of absolute right of all nations to choose a political and economic system and a way of life in keeping with the UN charter principles. However, out of the 29 members who took part in the conference, only eight followed the principle of non-alignment due to the military commitment of other participants to the United States. The eight nations include India, Burma, Indonesia, Laos, Cambodia, Afghanistan, Nepal and Egypt. Those who did not follow include South Vietnam, Iran, Thailand, Turkey, the Philippines, and Japan (Suryanarayanan 2002). The norms developed in Asia were considered powerful forces required to building institutions and establishing cooperation in post-war Asia through a series of conferences, starting with the Asian Relations Conference in New Delhi in 1947 until the Asia-Africa Bandung Conference. Despite having no institutions developed in these conferences, they warrant the necessary norms for institution building in Asia (Acharya 2009). Moreover, the Bandung Conference was the first major international conference that Japan attended since the WWII. Japan’s attendance to the conference was a precedent to its concern for a broader image in the post-war international relations (Ampiah 1995). The invitation of Japan to the conference, which was considered a union of anti-colonialism countries, was considered a product of international political dynamism in Asia (Lumumba-Kasongo 2015).
10
Eventually, Japan, with the support of Australia, initiated the establishment of economic institutions, such as the Pacific Trade and Development (PAFTAD), the Pacific Basin Economic Council (PBEC), Pacific Economic Cooperation Council (PECC), and APEC. The Asia-Pacific policy was regarded as the forerunner of regionalism in Japan. Japan’s policy created a new concept of “Asia-Pacific” and provided the basic environment for regional economic cooperation. It also founded the partnership with Australia that paved the way for the establishment of PECC and APEC, then later on the PAFTAD. Japan also was also able to incorporate the concept of ‘open regionalism’ into its trade policy (Terada 1998). The idea to formalize a Pacific association was promoted in 1967 by Prime Minister Takeo Miki with his ideas for an ‘Asian Pacific policy’. His ideas can be linked to the previous attempts by his predecessor, Etsusaburo Shiina, of establishing regional cooperation that led to ADB and the Ministerial Conference for Southeast Asian Development, which indicated the growing expectation of multilateral cooperation among Asian countries and intensified efforts among US, Canada, Australia, New Zealand, and Japan in assisting Asian countries. This can also be linked to the role of Japan as the sole industrialized country in Asia to bridge the gaps between developing nations and the industrialized countries in the region, and in the recognition to the limitations of Japan’s capability to undertake the task of addressing the North-South problem in Asia. As such, calls for the cooperation among the advanced economies in the Pacific were made. Even as early as 1948, immediately after the World War II, Prime Minister Miki already expressed his interest in the issues and forging a tie among Asian countries. He even opposed the Yoshida Doctrine, a strategy Japan adopted to recover from the impacts war, which required the dependence to the US and Europe. Miki believed that Japan should not be isolated and should take part in sustaining economic development in Asia for it to survive, and that Japan’s diplomacy did not fit the Asia-centered approach. When Japan, however, became a member of the OECD and the Development Assistance Committee (DAC) in 1964, and had paid all its debt to the World Bank, Japan’s position to the international politics changed extremely. It began taking initiatives for Asian economic development. Japan’s high economic growth and the strengthened position in international politics made it possible for Asia-Pacific economies to accept the Asia-Pacific policy of addressing the North-South problem. The Asia-Pacific policy contained two aspects of regionalism. First are the development cooperation and the provision of aid, with the formation of ADB and the Ministerial Conference of Southeast Asian Development. Second is the concentration of trade liberalization and the possibility of Pacific Free Trade Area (PAFTA), in the hope to also increase the trade among the developing countries in Asia. Miki’s Asia-Pacific policy had four key elements. First, it intended to enlighten and bring awareness among countries in the region that they shared a mutual destination and situation. Second, the cooperation among Asian countries, demonstrated by Japan extending its cooperation and understanding; and, third, cooperation among the advanced economies in the Pacific. Finally, the existence of the North-South gap, which stressed the importance and the role of developed countries for assisting the developing counterparts (Terada 1998). By 1978, Japanese Prime Minister Masayaoshi Ohira proposed the Pacific Basin Community, which caught the interests of businessmen, economists, diplomats, scholars and journalists. After a year, a group was organized to publish a report (Pacific Basin Community Study Group Report). Prime Minister Ohira, and his Foreign Minister Saburo Ohkita, visited Australia and New Zealand with the report. Australian Prime Minister Malcom Fraser and his adviser Sir John Crawford

11
agreed with Ohira and Ohkita on the promotion of cooperation in the Pacific. The Canberra Seminar was then organized in 1980. Ohkita and Crawford, with Kojima, co-founded PAFTAD to start the Pacific nations’ cooperation that commenced with a series of Pacific Economic Cooperation Conference (PECC). PECC was initially participated by 11 countries, including Japan, Australia, New Zealand, US, Canada, South Korea, and the five ASEAN countries. By 1989, APEC started taking shape as a series of meetings by foreign and trade ministers of twelve nations to discuss economic cooperation in Asia-Pacific region (Yamazawa, 2012). 2.2. APEC through the Years From its official establishment as an informal meeting in Canberra, Australia in 1989, numerous developments have occurred vis-a-vis relationships and integration deepened among and within APEC communities. As of 2017, APEC’s share in global population accounted for 38 percent, with China having the largest share at 18 percent, followed by the United States and Indonesia at four percent each. APEC’s share in the global GDP was 60 percent of the US$ 48 trillion, with the United States owning the 24 percent and China with 15 percent. The share in global trade, on the other hand, was 47 percent. The USA, China, and Japan contribute a quarter of this global trade share (Figure 1). Figure 1. APEC’s share in global population, GDP, and trade (2017)
Source: APEC 2018
2.2.1. Structure When APEC was inaugurated in 1989, the goal was to promote free and open trade and advance sustainable economic growth within the bounds of Asia Pacific communities. The informal dialogue was composed of senior officials and ministers from 12 member economies. It was in the first Ministerial Meeting in Canberra when APEC’s initial official words were delivered. The annual Ministerial Meeting is the primary organ and the Joint Statements are APEC’s principal official documents (Ogita, 2001). During this Ministerial Meeting, the general principles for regional economic cooperation were identified and a general framework to guide the development of the APEC process was established. To address practical issues of economic
12
concerns and tangible benefits to the region, the SOM developed a number of work projects and assigned these to participating economies (as “shepherds”). These include work projects on economic studies, trade liberalization, and sectoral cooperation (Dippelsman 1990). Examples of these are the following:
Economic studies: • Review of trade and investments data – US, Japan, Singapore • Trade promotion; programs and mechanisms for cooperation – Malaysia and ROK
Investment, technology transfer and related aspects of human resources development: • The expansion of investment and technology transfer in the Asia Pacific region –
Philippines, Japan, Indonesia • The Asia Pacific Multilateral Human Resources Development Initiative – Japan, Thailand,
Indonesia, ROK, Malaysia, Canada
Sectoral cooperation: • Regional energy cooperation – Australia • Marine resource conservation – Canada, Indonesia, New Zealand
In addition, the US and Thailand were tasked to prepare a work project in telecommunications area to be consider during the following APEC SOM meeting (Dippelsman 1990). In 1990 and 1993, respectively, the Ministerial Meeting and the Senior Officials’ Meetings, as well as the various Working Groups, were made regular features of APEC as a reflection of APEC’s recognition of the works needed to be done for the common interests of the member economies (Hirano 1996). During the Seoul Declaration in 1991, three additional working groups were established – fisheries, transportation, and tourism (Janow 1997 and Hirano 1996). In the Ministerial Meeting in Thailand in 1992, it was agreed that a permanent secretariat is established to support APEC activities. The Eminent Persons Group (EPG) was also established in 1992 (EPL 2004) to enunciate a vision for trade in the region by 2000, and identify constraints and issues that should be considered in APEC. The APEC Fund was also established to finance the implementation of APEC activities1. The EPG was extended until 1994 and reported directly to the Ministers (Frost 1994). The following year, in 1993, the permanent Secretariat became operational (EPL 2004). The Committee on Trade and Investment (CTI), which replaced the Informal Group on Regional Trade Liberalization (RTL), was promoted as a standing committee (Hirano 1996 and APEC Secretariat 1995). The CTI was created following the adoption of the Declaration on a Trade and Investment Framework for the purpose of increasing economic activity and facilitating the flow of goods and services, as well as technology, in the region. The CTI directly reports to the Ministers through the SOM. On the same year, the Informal Economic Leaders’ Meeting was held on November 20, in Blake Island, Seattle, USA. The informal discussions emphasized the commitment of member economies to APEC (Frost 1994). This followed the annual meeting of APEC ministers of foreign affairs and of economic affairs, wherein the policy objectives are discussed and defined (EPL 2004).
1 Fourth Ministerial Meeting Join Statement (Bangkok, September 10-11, 1992)

13
The Budget and Administrative Committee (BAC), which became Business and Management Committee (BMC) later in 1998, was also established in 1993 to advise the APEC senior officials on budgetary, administrative and managerial issues. It reviews the operational budgets of the committees and groups, and assesses their effectiveness (EPL 2004). The BAC also assesses administrative budget proposed by the Secretariat and evaluates the project expenditures and completed projects (Frost 1994). Also, the Economic Leaders asked the business leaders to establish a Pacific Business Forum (PBF) that will identify issues to be addresses to facilitate regional trade and investment and to strengthen the business networks in the region. The PBF would be comprised of two private sector representatives, wherein one would represent the small and medium business, from each member economy (APEC Secretariat 1995). A year later, the PBF was established and reported directly to the Economic Leaders (Frost 1994). The EPG and the PBF are two of APEC’s advisory groups. Virtually, as of 1993, the APEC structure was composed of the Policy Level, including, informal leaders’ meeting, ministerial meeting, the EPG and the PBF, the SOM; the Secretariat; and the Working Level, which include, the BAC, the CTI and the ad hoc Economic Trends and Issues Group (ETI), and the ten working groups (Figure 2). Figure 2. Initial Structure of APEC (1993) Note: Modified from MOFA (1995) and DFAT Australia in Frost (1994).
The Leaders’ Meeting was institutionalized in 1994, while the ad hoc ETI was promoted to a standing committee, the Economic Committee (EC) (Hirano 1996), following the realization of the Group’s significant role in promoting economic dialogue, encouraging economic growth and increasing the economic well-being of the peoples (APEC Secretariat 2018). The promotion of ETI was supported by Japan in view of the fast developments in the region in various fields due
Leaders’ Meeting
Ministerial Meeting
Senior Officials’ Meeting Secretariat
Pacific Business Forum (PBF)
Eminent Persons Group (EPG)
Committee on Trade and Industry (CTI)
Economic Trends and Issue Group (ETI)
Budget and Administrative Committee (BAC)
Working Groups • Trade and Investment Data Review (TID) • Trade Promotion (TP) • Industrial Science and Technology (IST) • Human Resources Development (HRD) • Regional Energy Cooperation (REC) • Marine Resource Conservation (MRC) • Telecommunications (TEL) • Transportation (TPT) • Tourism (TWG) • Fisheries (FWG)
14
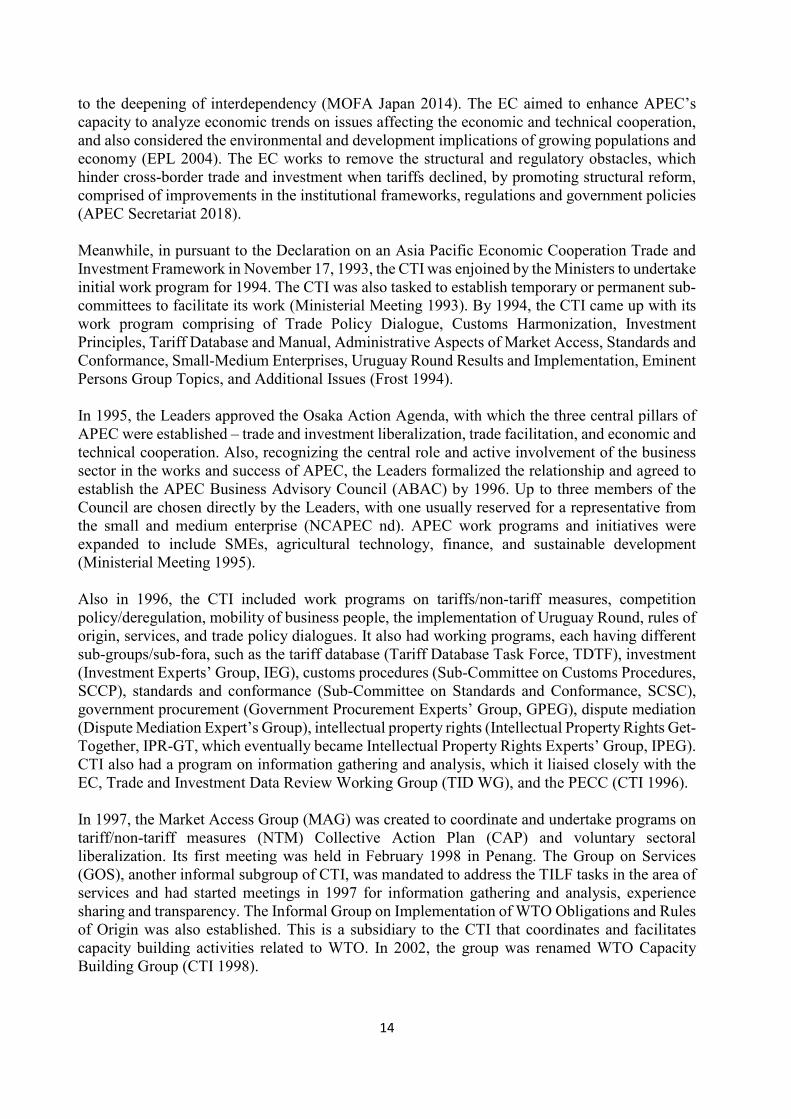
to the deepening of interdependency (MOFA Japan 2014). The EC aimed to enhance APEC’s capacity to analyze economic trends on issues affecting the economic and technical cooperation, and also considered the environmental and development implications of growing populations and economy (EPL 2004). The EC works to remove the structural and regulatory obstacles, which hinder cross-border trade and investment when tariffs declined, by promoting structural reform, comprised of improvements in the institutional frameworks, regulations and government policies (APEC Secretariat 2018). Meanwhile, in pursuant to the Declaration on an Asia Pacific Economic Cooperation Trade and Investment Framework in November 17, 1993, the CTI was enjoined by the Ministers to undertake initial work program for 1994. The CTI was also tasked to establish temporary or permanent sub-committees to facilitate its work (Ministerial Meeting 1993). By 1994, the CTI came up with its work program comprising of Trade Policy Dialogue, Customs Harmonization, Investment Principles, Tariff Database and Manual, Administrative Aspects of Market Access, Standards and Conformance, Small-Medium Enterprises, Uruguay Round Results and Implementation, Eminent Persons Group Topics, and Additional Issues (Frost 1994). In 1995, the Leaders approved the Osaka Action Agenda, with which the three central pillars of APEC were established – trade and investment liberalization, trade facilitation, and economic and technical cooperation. Also, recognizing the central role and active involvement of the business sector in the works and success of APEC, the Leaders formalized the relationship and agreed to establish the APEC Business Advisory Council (ABAC) by 1996. Up to three members of the Council are chosen directly by the Leaders, with one usually reserved for a representative from the small and medium enterprise (NCAPEC nd). APEC work programs and initiatives were expanded to include SMEs, agricultural technology, finance, and sustainable development (Ministerial Meeting 1995). Also in 1996, the CTI included work programs on tariffs/non-tariff measures, competition policy/deregulation, mobility of business people, the implementation of Uruguay Round, rules of origin, services, and trade policy dialogues. It also had working programs, each having different sub-groups/sub-fora, such as the tariff database (Tariff Database Task Force, TDTF), investment (Investment Experts’ Group, IEG), customs procedures (Sub-Committee on Customs Procedures, SCCP), standards and conformance (Sub-Committee on Standards and Conformance, SCSC), government procurement (Government Procurement Experts’ Group, GPEG), dispute mediation (Dispute Mediation Expert’s Group), intellectual property rights (Intellectual Property Rights Get-Together, IPR-GT, which eventually became Intellectual Property Rights Experts’ Group, IPEG). CTI also had a program on information gathering and analysis, which it liaised closely with the EC, Trade and Investment Data Review Working Group (TID WG), and the PECC (CTI 1996). In 1997, the Market Access Group (MAG) was created to coordinate and undertake programs on tariff/non-tariff measures (NTM) Collective Action Plan (CAP) and voluntary sectoral liberalization. Its first meeting was held in February 1998 in Penang. The Group on Services (GOS), another informal subgroup of CTI, was mandated to address the TILF tasks in the area of services and had started meetings in 1997 for information gathering and analysis, experience sharing and transparency. The Informal Group on Implementation of WTO Obligations and Rules of Origin was also established. This is a subsidiary to the CTI that coordinates and facilitates capacity building activities related to WTO. In 2002, the group was renamed WTO Capacity Building Group (CTI 1998).
15
Also in 1997, the Ministers committed to further strengthen the economic and technical cooperation by fully implementing the Framework for Strengthening Economic Cooperation and Development as agreed in the previous year. The Ministers endorsed the creation of SOM Subcommittee on Economic and Technical Cooperation (ECOTECH) (Ministerial Meeting 1997). ECOTECH started in 1998. The following years, electronic commerce was added to the list of CTI sub-forum and industry dialogues were established, including the Automotive Dialogue (1999), High-Level Policy Dialogue on Agricultural Biotechnology (2001), Chemical Dialogue (2002), and Life Sciences Innovation Forum (2003). The first Automotive Dialogue in Bali, Indonesia, was a venue to exchange ideas on the state of the industry, traffic congestion and the environment, effective automotive policies, and the impact of liberalized trade on economies and adjustment techniques to address the impacts (CTI 1999). The Chemical Dialogue, on the other hand, was proposed in 2000 by the Pacific Chemical Industry Coalition (APCIC) (CTI 2000). The first Chemical Dialogue was held in 2002 and adopted the Globally Harmonized System on Hazard Classification and Labelling of Chemical and Safety Data Sheets (CTI 2002), which is a document that describes the classification criteria and the hazard communication elements (UN 2011). Ever since, APEC has been evolving in terms of its structure and priorities. APEC Leaders later on, in 2004, endorsed the Leader’s Agenda to Implement Structural Reform (LAISR) that covered regulatory reform, competition policy, public sector governance, corporate governance, and strengthening economic and legal infrastructure (APEC Secretariat 2018). This was expanded in 2010 as the APEC New Strategy for Structural Reform (ANSSR) to promote (a) more open, well-functioning, transparent and competitive markets; (b) better functioning and effectively regulated financial markets; (c) labor market opportunities, training and education; (d) sustained SME development and enhanced opportunities for women and for vulnerable populations; and (e) effective and fiscally sustainable social safety net programs2. The ANSSR’s target year was 2015. It was further extended to guide APEC’s work on structural reforms until 2020 in the Renewed APEC Agenda for Structural Reform (RAASR) (APEC Secretariat 2018). A little more than two decades since its first meeting, APEC structure has become more complex. As of 2015, APEC took the structure as shown in Figure 3. Most noticeable changes in the structure include the APEC Business Advisory Council, Sectoral Ministerial Meetings, Senior Finance Officials’ Meeting, the Friends of the Chair (FOTC), the Internet Economy Ad Hoc Steering Group, and the different sub-groups under the different committees.
2 APEC New Strategy for Structural Reform (ANSSR). Forum Doc. No. 2010/AMM/011.

16
Figure 3. APEC Structure as of 2015.
Source: APEC Secretariat

17
APEC Business Advisory Council (ABAC) was organized and convened in 1996 (Leaders’ Declaration 1996 and Ministerial Meeting 1996). ABAC serves as the private-sector of APEC and advises the Leaders and other APEC officials on issues concerning business interests. It also responds to sub-groups for information in particular to business cooperation (APEC Secretariat 2018). The first considered Sectoral Ministerial Meeting was the APEC Educational Ministerial Meeting held in August 1992 in Washington, D.C. George H. W. Bush, the US president at the time and a known education reform advocate, who actually declared himself as the “education president”3 (Manno 2018), invited the Education Ministers and other senior education officials from the 14 member economies4 (APEC Leaders’ Declaration 1992 and APEC Education Ministerial Meeting 1992). His advocacy began when he was still the vice president during the Reagan administration. There were on-going debates on how to improve America’s education system and the administration released a report, A Nation at Risk, which identified problems in the education system that resulted to students with mediocre results and “not learning enough for work, citizenship and life in the 21st century” (Manno 2018). During a question-and-answer session with the Singapore Lecture Group on January 4, 1992, Bush recognized that “no nation will prosper long without a first-rate educational system” and encouraged Americans to revolutionized education through what he referred to as the America 2000 education strategy, wherein he world-class schools would be created. With this, Bush maintained to continue to strengthen the US university system that was host to more than 200,000 Asian students at that time, and recognized the APEC educational partnership initiative to link these educational ties for mutual economic interests5 (Bush 2005). In response to the perceived need for cooperative action in education, the APEC Education Forum was established (APEC Leaders’ Declaration 1992 and APEC Education Ministerial Meeting 1992). The next Educational Ministerial Meeting was held in 2000, and has since been held every four years. By 1994, other sectoral ministerial meetings were held, focusing on environment, finance, small and medium enterprises, and trade. The APEC Finance Ministers, in particular, met to discuss economic challenges such as sustaining growth with low inflation, financing investment and infrastructure development, and promoting capital market development. The Senior Finance Officials’, an ad hoc group that reports to Finance Ministers, meet to identify factors and developments that deputies and central banks would address (APEC Ministers Meeting 1994 and APEC Finance Ministerial Meeting 1994). From then, several other sectoral meeting were held each year, with different frequencies except for finance, small and medium enterprises, and trade, which are held annually. In the same way, FOTC is another set of sub-groups under different committees. The earliest FOTC was a small group led by Canada that intended to integrate the gender issues into the CTO work program. The group intended to integrate gender aspect to the work of CTI. CTI, in turn, approved a project for a study, which was funded under TILF, aimed at supporting potential women exporters (CTI 2003). In 2004, when the CTI adopted a short list of five priorities – including support to WTO, trade and investment facilitation (including IPR), implementation of the APEC Transparency Standards, implementation of Pathfinder initiatives, and the contribution 3 Manno, B. V. 2018. George H.W. Bush: The Education President. https://www.waltonfamilyfoundation.org/stories/k-12-education/george-h-w-bush-the-education-president. 4 Australia, Brunei Darussalam, Canada, the People’s Republic of China, Hong Kong, Indonesia, Japan, the Republic of Korea, New Zealand, the Republic of the Philippines, Singapore, Chinese Taipei, Thailand, and the United States. 5 Bush, G. 2005. George Bush: 1992-93 (in two books). [Book 1], p29. (Retrieved from https://quod.lib.umich.edu/p/ppotpus/4733026.1992.001?view=toc)
18
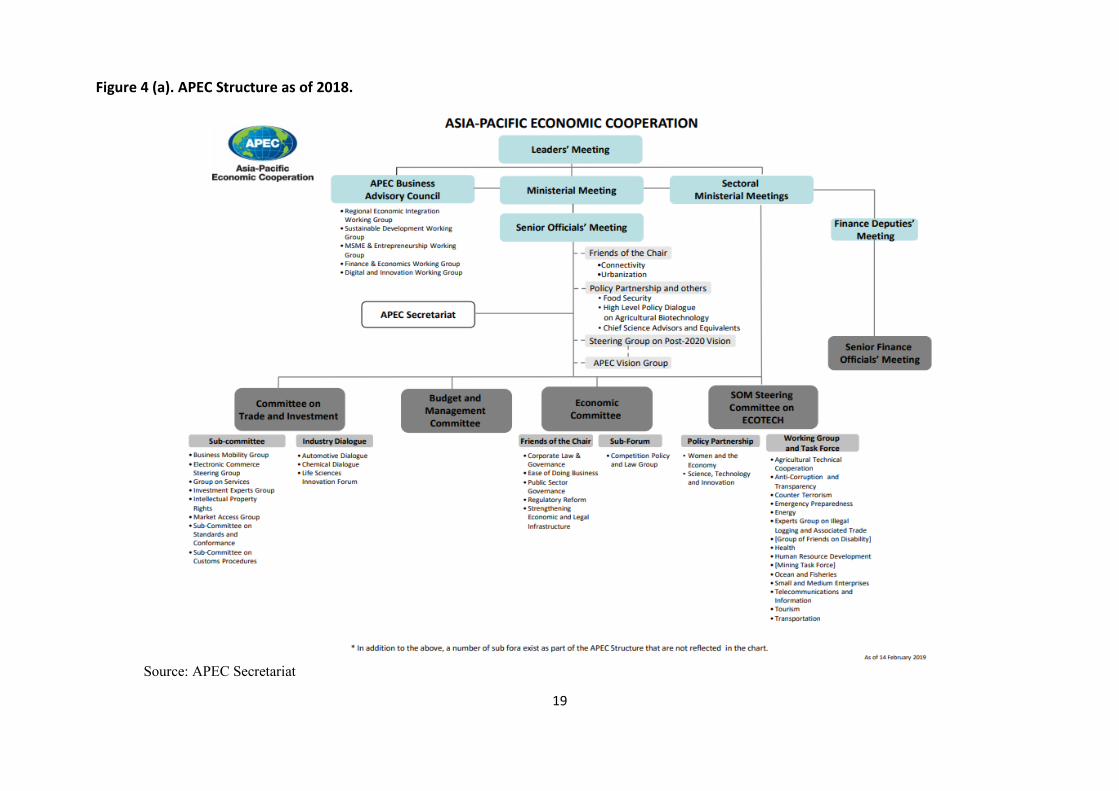
to the APEC Structural Reform Action Plan – in line with the Osaka Action Agenda, five small groups of FOTCs were established to develop the work plans of each priority (CTI 2004). Several other FOTC groups were established in the succeeding years. In 2009, the CTI established four FOTCs to work out plans on the areas of REI/FTAAP; trade facilitation; digital economy, and strengthening Intellectual Property Rights (IPR), and investment. A sub-group under REI/FTAAP FOTC was also created to undertake greater convergence promotion of cross-border services (CTI 2009). The CTI and EC then held a joint policy dialogue on trade logistics in Singapore to collaborate and take forward the 2009 priority of enhancing the physical across the border connectivity. They call this the Supply Chain Connectivity Initiative (SCI) (CI Report 2009). In the 2010 CTI’s priorities – Trade Facilitation and Supply Chain Connectivity (SCI); digital economy, and strengthening Intellectual Property Rights (IPR); investment; and Environmental Goods and Services (EGS) –, which were almost similar and a continuation of the previous, another four were created to develop action plans for these priorities (CTI 2010). The Ministers endorsed the SCI and committed to implement it to improve the Supply Chain performance in APEC by 10 percent in 2015 (PSU Annual Report 2011). In 2014, the CTI FOTC on REI and Advancing FTAAP was established (Leaders’ Declarations 2014) and was assigned to lead a task force that would undertake a study related to the realization of FTAAP (Ministerial Meeting 2014). Moreover, in 2014, the Ministers also agreed to set up a SOM FOTC on Urbanization (Ministerial Meeting 2014). The first FOTC on Urbanization was held in Cebu, Philippines, on September 3, 2015, which focused on the terms of reference and mandate of FOTC. The SOM endorsed the proposal on APEC Water Initiative for inclusive resilience and sustainability (SOM 2015).6 Other groups were established under different committees, such as in the EC and SCE (ECOTECH), either in support to the works of other committees’ priorities or distinct APEC priorities. Another sub-group under the SOM was the Ad Hoc Steering Group on Internet Economy. In 2014, the Ministers welcomed the establishment of the group in recognition to the role of Internet Economy as an effective driver of economic reform, innovation, and sustainable growth, and endorsed the APEC Initiative of Cooperation to Promote Internet Economy to understand policies to benefit from the information economy (Ministerial Meeting 2014). The APEC structure has become more diverse and complex. Currently, there are four sub-groups directly under the watch of SOM. These include the FOTC on Connectivity and on Urbanization; Policy Partnership on food security, high level policy dialogue on agricultural biotechnology, and Chief Science Advisors and Equivalents; Steering Group on Post-2020 Vision, who works with the other group – the APEC Vision Group. The CTI and ECOTECH, in particular have more defined substructures. Apart from the eight sub-committees and three industry dialogues, the CTI have three sub-groups under its electronic commerce steering group, business mobility group, and standards and conformance sub-committees. The industry dialogue on life science and innovation forum of CTI also has another sub-group. Similarly, the SCE’s working groups on transportation, human resource development, energy, anticorruption and transparency, and telecommunications and information have their own expert and sub-groups (Figure 4).
6 APEC 2015 2nd SOM, Boracay, Aklan, Philippines, 19-20 May 2015; retrieved from http://mddb.apec.org/Documents/2015/SOM/SOM2/15_som2_summary.pdf
19
Figure 4 (a). APEC Structure as of 2018.
Source: APEC Secretariat

20
Figure 4 (b). APEC Structure as of 2018.
Source: APEC Secretariat 2019
21
The structure of APEC has rapidly grown, even without initially having a long term plan, as manifested in the rapid expansion of its activities, ranging from economic and social cooperation to the facilitation and liberalization of trade and investments. As the regional economy undergoes transitions, and with varying needs from time to time, APEC priorities also evolve to respond to these needs, resulting to APEC having permanent and temporary sub-groups and fora. For instance, intensifying the efforts to foster cooperation among governments, businesses and academia, and promoting regional economic integration, required the functions of ABAC, APEC Policy Support Unit (PSU), PECC, APEC Study Center Consortium (ASCC) and other fora (AMM/CTI 2016).
2.2.2. Evolution of APEC Commitments and Priorities7
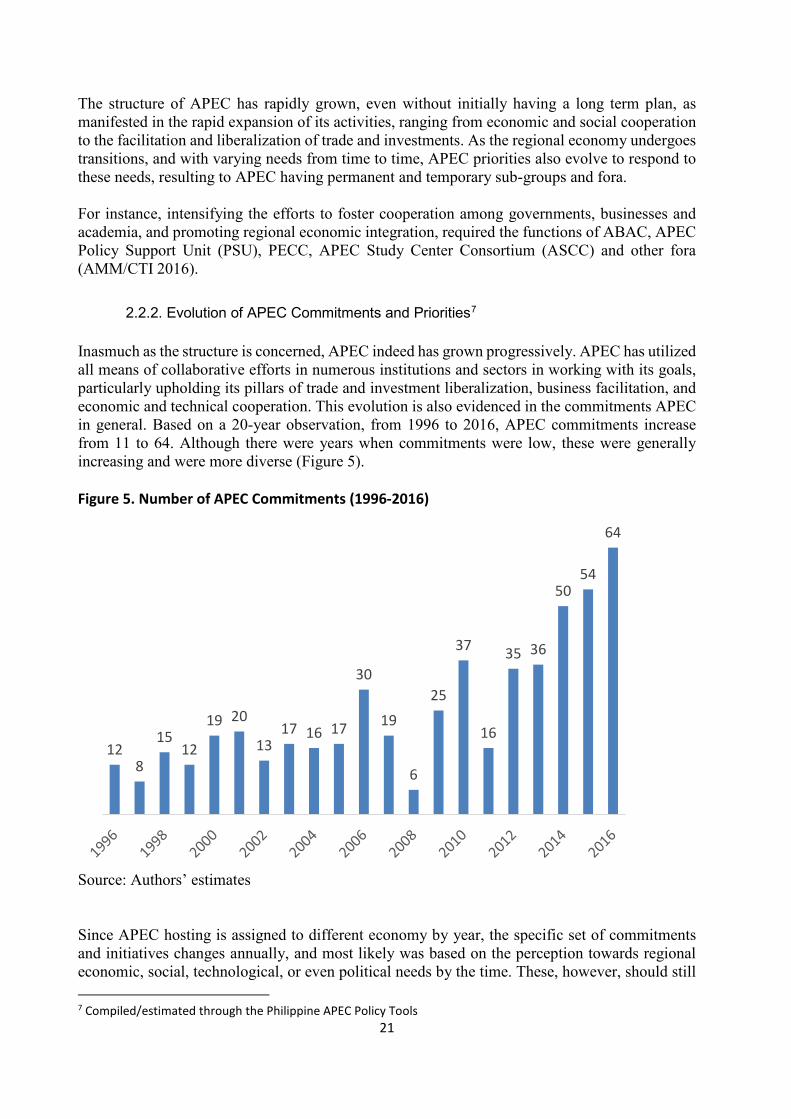
Inasmuch as the structure is concerned, APEC indeed has grown progressively. APEC has utilized all means of collaborative efforts in numerous institutions and sectors in working with its goals, particularly upholding its pillars of trade and investment liberalization, business facilitation, and economic and technical cooperation. This evolution is also evidenced in the commitments APEC in general. Based on a 20-year observation, from 1996 to 2016, APEC commitments increase from 11 to 64. Although there were years when commitments were low, these were generally increasing and were more diverse (Figure 5). Figure 5. Number of APEC Commitments (1996-2016)
Source: Authors’ estimates Since APEC hosting is assigned to different economy by year, the specific set of commitments and initiatives changes annually, and most likely was based on the perception towards regional economic, social, technological, or even political needs by the time. These, however, should still 7 Compiled/estimated through the Philippine APEC Policy Tools
128
1512
19 20
1317 16 17
30
19
6
25
37
16
35 36
5054
64
22
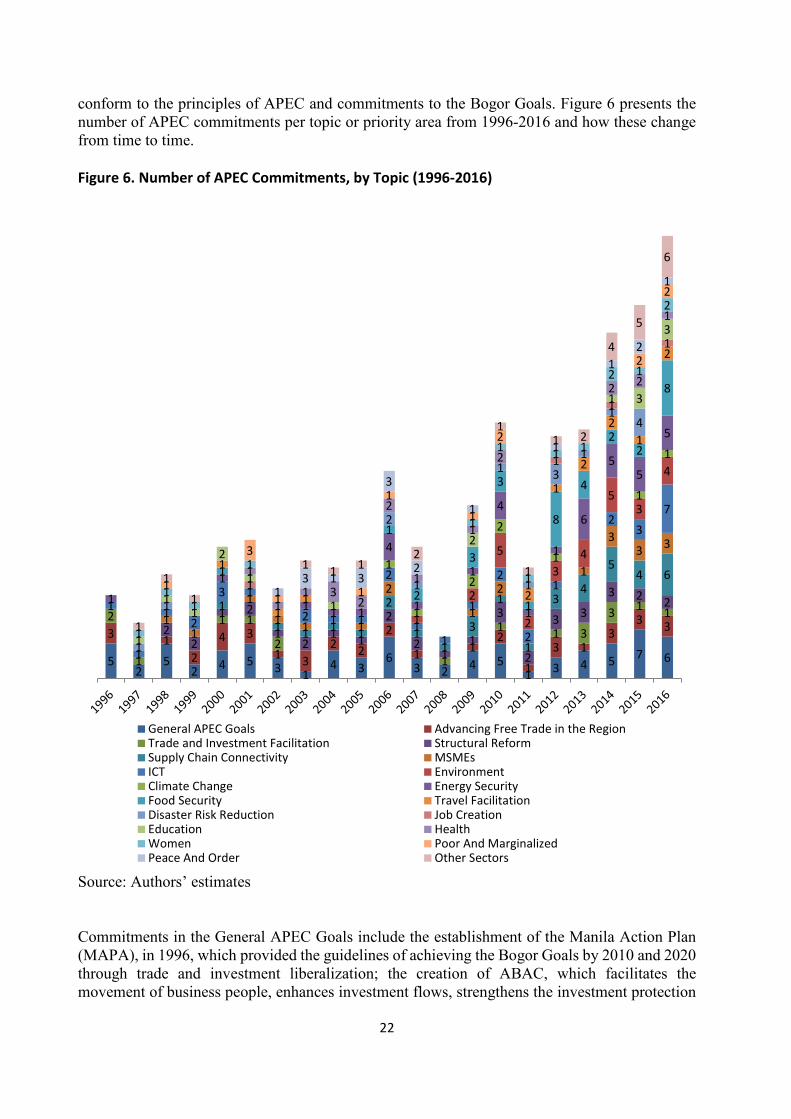
conform to the principles of APEC and commitments to the Bogor Goals. Figure 6 presents the number of APEC commitments per topic or priority area from 1996-2016 and how these change from time to time. Figure 6. Number of APEC Commitments, by Topic (1996-2016)
Source: Authors’ estimates Commitments in the General APEC Goals include the establishment of the Manila Action Plan (MAPA), in 1996, which provided the guidelines of achieving the Bogor Goals by 2010 and 2020 through trade and investment liberalization; the creation of ABAC, which facilitates the movement of business people, enhances investment flows, strengthens the investment protection
52
52 4 5 3 1
4 36
3 2 4 51 3 4 5 7 6
3 12
4 31 3
2 22
1 12
13 1
33 3
2
1
1 1
21
1 1 33 1 1
22
1 2
12
1 1
2
21
1
3
2
3 33 2 21
1 1 1 1
2
11
3
1
1
34
54 6
11
11 1 1
2
1
21
33 3
1
1
12
3 1
2 1 1
2
11
1
2
2
1
23
7
1
2
5
2
34
53
4
1
1
2
2
1
1
1
11
1 1 1
4
1
1
4
1
1
6
55
5
1
1
2
3
3
1
8
4
22
8
1
11 2
1
2
21
2
1
1
2
1
1
1
31
14
1
1
1
1
1
11
2
1
1
2
1 3
3
1
11 3
2
2
1
1
2
2 2
1
1
11
1
1
1
1
1 1
2 1
2
1
3
1 1
11
2
2
2
13 1 3
3
2
1
1
12
1
1
11
1 1 12
1
1
1 2
4
5
6
General APEC Goals Advancing Free Trade in the RegionTrade and Investment Facilitation Structural ReformSupply Chain Connectivity MSMEsICT EnvironmentClimate Change Energy SecurityFood Security Travel FacilitationDisaster Risk Reduction Job CreationEducation HealthWomen Poor And MarginalizedPeace And Order Other Sectors

23
through transparency, predictability, arbitration, among others, as part of strengthening APEC as an organization; provision of a stable and secure economic environment; economic and technical cooperation; and fostering public-private partnership. The commitment of developing domestic markets was pursued through a cooperative growth strategy in 1998, with prudent macroeconomic policies to sustain the conditions for strong domestic demand-led growth. In the same year, there was also a commitment to expand financial assistance by endorsing flexibility of IMF programs, and in the World Bank and the Asian Development Bank. FTAAP commitments came in 2004 through the Santiago Initiative to expand trade in APEC that supports free and open trade in the region. In 2006, the Leaders reiterated their commitment to greater regional economic integration in Asia-Pacific. By 2015, the Leaders’ committed to implement the 2030 Agenda for Sustainable Development (“2030 Agenda”), which sets a comprehensive, universal, and ambitious framework for global development. With this, the Leader also committed to implement the Addis Ababa Action Agenda, which provides economies with guidelines on attracting and mobilizing financial resources for the realization of the Sustainable Development Goals. On Advancing Free Trade in the Region, APEC committed to advance the interest in the WTO of open multilateral trading systems; supported by the endorsement of initiatives to reduce barriers to trade and non-discriminatory trade in goods and services. By 1999, membership issues to the membership in WTO were addressed, particularly for APEC economies that were not yet part of the WTO. Also in 1996, trade and investment facilitation were pursued by initially committing an early voluntary liberalization towards trade, investment and economic growth; and harmonization of tariff nomenclature; simplification of customs procedures, commitments to IPR, customs valuation, facilitation of comprehensive trade in services; and enhancing the environment for investments. Further, APEC Investment Facilitation Action Plan (IFAP) was introduced in 2008 to improve the investment environment in the region. By 2013, the Leaders committed to address next generation trade and investment issues. Under ICT, the conclusion of the formation technology agreement was committed to support the commitments related to WTO and trade barriers to eliminate tariffs by 2000. The importance of telecommunications and information technology to ensure regional competitiveness was recognized with the creation of the Asia-Pacific Information Infrastructure. By 1999, Leaders recognized the role of e-commerce in linking economies, and supported the efforts to create a favorable environment for e-commerce cooperation with private sector. Other initiatives were committed to support the commitments in realizing the goals of APEC, such as the commitments under structural reforms, pertaining to structural reform policies, addressing middle income trap, financial reform, regulatory practices, minimizing risks, and transparency; supply chain connectivity commitments – improving business transactions, global value chain, transportation development towards supply chain connectivity, connectivity blueprint, global data standards, and green supply chain; commitments on MSMEs – strengthening MSMEs, efficient business operations, enabling environment for MSMEs, and financing; and commitments under trade facilitation – passenger information, tourism, people mobility, and air cargo liberalization.

24
There were also commitments that focused more on the provision of welfare development for the APEC peoples and economies. These include commitments to address issues on environment, energy, climate change, food security and disaster risk reduction; as well as commitments to develop the social infrastructure, focusing on education, job creation, health, women, poor and marginalized, and peace and order. Finally, initiatives to develop other sectors were also put forward. These include commitments on services sector development, urban and rural development, sustainable infrastructure, science and technology, and anti-corruption and transparency (APEC Policy Tools).
2.2.3. Summary of APEC Milestones APEC has come to realize as a forum of 21 Pacific Rim economies that agreed to regional trade and investment liberalization and facilitation, and enhance the growth and development of the Asia-Pacific community. APEC officially started as an informal Ministerial-level dialogue of the 12 founding members in Canberra in 1989. Since the 1993 meeting in Blake Island, United States, APEC meetings were regularly done “to provide greater strategic vision and direction for cooperation in the region”. APEC’s vision of “stability, security, and prosperity for our peoples” was crafted (APEC Secretariat 2018). Table 2 presents a summary of APEC events and achievements. Table 2. APEC Milestones
Year Location Description 1993 Blake Island, USA First APEC Leaders’ meeting; APEC’s vision of “stability, security, and prosperity for our
peoples” was crafted 1994 Bogor, Indonesia The Bogor Goals of trade and investment liberalization was adopted and APEC served
as a driving force in concluding the Uruguay Round. 1995 Osaka, Japan The Osaka Action Agenda was adopted as a framework that would lead to the
achievement of the Bogor Goals through the three pillars of APEC – trade and investment liberalization, business facilitation, and economic and technical cooperation. ABAC was established.
1996 Manila, Philippines Manila Action Plan for APEC (MAPA) was adopted, strengthening the Bogor Goals by implementing the Collective and Individual Action Plans.
1997 Vancouver, Canada APEC endorsed a proposal for early voluntary liberalization of 15 sectors and decided to update the IAP annually.
1998 Kuala Lumpur, Malaysia
A Blueprint for Action on Electronic Commerce was agreed upon and paperless trading was committed that would be realized in developed economies and in developing economies, by 2005 and by 2010, respectively.
1999 Auckland, New Zealand
The APEC principles to Enhance Competition and Regulatory Reform were adopted to address the structural and regulatory weaknesses that contributed to the Asian financial crises. Paperless trading was recommitted and the APEC Business Travel Card scheme was approved. The Mutual Recognition Arrangement on Electrical Equipment and the Framework for the Integration of Women in APEC were also endorsed. Since then, other sectoral concerns were addressed in APEC, such as the provision of more internet access in APEC region, counterterrorism, digital economy, health security, sound and efficient financial systems, among others.
2000 Bandar Seri Begawan, Brunei Darussalam
Action Agenda for the New Economy was committed and the goals of tripling the internet access by 2005 and achieving universal access by 2010 were set.

25
2001 Shanghai, PRC The Shanghai Accord was adopted to broaden the vision of APEC and reflect changes that resulted from digital economy, to clarify the roadmap for Bogor Goals, and to strengthen the IAP Peer Review process.
2002 Los Cabos, Mexico Trade Facilitation Action Plan and the Statement to Implement APEC Policies on Trade and the Digital Economy were adopted. The Secure Trade in the APEC Region (STAR) was initiated to promote transparency in the region.
2003 Bangkok, Thailand Member economies committed to implement the APEC Action Plan on SARS and the Health Security Initiative to prevent and respond health threats. APEC Leaders committed to promote efficient financial systems and encouraged the development of domestic and regional bond markets.
2004 Santiago, Chile The best practices reference to guide RTA/FTA negotiations was adopted. The Leaders’ Agenda to Implement Structural Reform (LAISR) was launched to address regulatory reform, corporate governance, public governance, competition policy, and strengthen economic legal infrastructure.
2005 Busan, Korea The Mid-term Stock-take assessed the progress towards Bogor goals. The stock-take indicated an average reduction of tariffs to 5.5 percent from 16.9 percent in 1989.
2006 Ha Noi, Viet Nam The actions and milestones to implement the Bogor Goals were identified in the Ha Noi Action Plan, and Leaders concluded that APEC Trade Facilitation Action Plan achieved a five percent reduction in trade costs from 2002 to 2006.
2007 Sydney, Australia Climate change was addressed in APEC with the Declaration on Climate Change, Energy Security, and Clean Development. The second APEC Trade Facilitation Action Plan was adopted to reduce further the transaction costs by five percent by 2010.
2008 Lima, Peru The global financial crisis was addressed in the Lima Statement on the Global Economy. Commitment to take economic and financial measures to restore stability and growth, rejection of protectionism, and intensification of the efforts to the Doha Development Agenda were pushed.
2009 Singapore Due to the global financial crisis, the first joint meetings between the APEC senior trade and finance officials were held during the 2009 meeting in Singapore. The Supply-Chain Connectivity Framework and the Ease of Doing Business Action Plan were launch for a 25 percent cheaper, faster and easier business condition by 2015.
2010 Yokohama, Japan Leasers provided a roadmap to realize an economically integrated, robust and secure APEC community. The assessment on the progress of Bogor Goals was completed and significant gains in goods, services and investment liberalization and trade facilitation were found. The APEC Strategy for Investment was formulated and the APEC New Strategy for Structural Reform was endorsed. The first APEC Ministerial Meeting on Food Security was held.
2011 Honolulu, USA Various commitments were made by APEC Leaders to a seamless regional economy with shared green growth objectives, and advance regulatory cooperation and convergence, which they tend to achieve by reducing applied tariff rates of environmental goods to f percent or less by 2015, reduction of energy by 45 percent by 2035, and by implementing good regulatory practices by 2013.
2012 Vladivostok, Russia Leaders endorsed the APEC List of Environmental Goods, to contribute to green growth and sustainable development, and the APEC Model Chapter on Transparency for RTAs/FTAs.
2013 Bali, Indonesia APEC Leaders reaffirm their commitment to the rules-based multilateral trading system and achieving the Doha Round and endorsed a multi-year plan on infrastructure development and investment.
2014 Beijing, China The APEC Connectivity Blueprint was endorsed to achieve greater regional economic integration and translate the vision of Free Trade Area of the Asia-Pacific (FTAAP) in to reality. The roadmap was set to achieve better physical, institutional and people-to-people connectivity by 2025.
2015 Manila, Philippines The goal of deeper integration was further in 2015 in Manila, Philippines, where Leaders agreed to set policy for integration of micro, small and medium enterprises in global and regional markets, building sustainable and resilient communities, developing human capital, and enhancing economic integration agenda.
26
2016 Lima, Peru APEC Leaders reaffirmed the member economies' confidence in international trade for achieving economic and social developments.
2017 Da Nang, Viet Nam The Leaders underlined once more the rules-based, free, open, fair, transparent and inclusive multilateral trading system; recognized the impacts of digital transformation; resolution to advance agenda for economic, financial, and social inclusions; strengthening of micro, small and medium enterprises; and climate change and food security with the adoption of Food Security and Climate Change Multi-Year Action Plan 2018-2020.
2018 Port Moresby, Papua New Guinea
APEC Chair released the Era Kone Statement that reflects the work of member economies in 2018, and wherein Leaders reaffirm the importance of trade liberalization and facilitation in economic growth. APEC leaders committed to advance inclusive growth through innovation and digital technologies which are recognized change businesses and governments operation. The Action Agenda for the Digital Economy was endorsed as commitment to the digital future.
Source: APEC Secretariat 2018
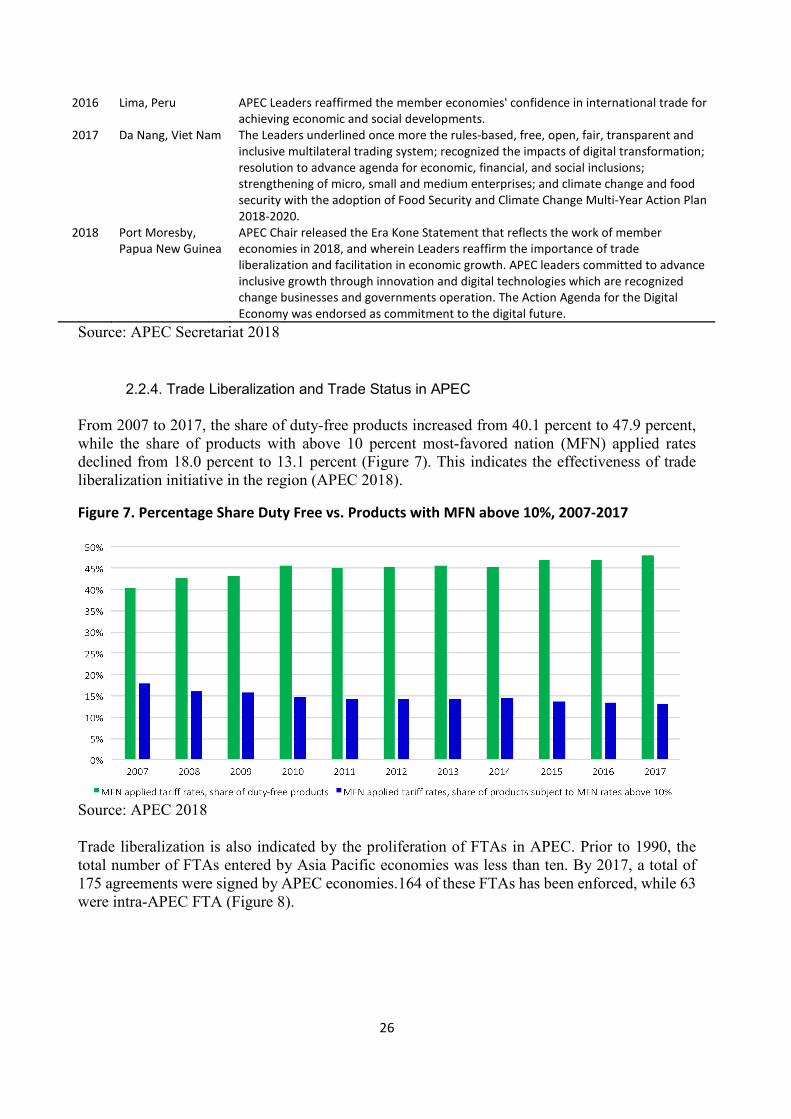
2.2.4. Trade Liberalization and Trade Status in APEC From 2007 to 2017, the share of duty-free products increased from 40.1 percent to 47.9 percent, while the share of products with above 10 percent most-favored nation (MFN) applied rates declined from 18.0 percent to 13.1 percent (Figure 7). This indicates the effectiveness of trade liberalization initiative in the region (APEC 2018).
Figure 7. Percentage Share Duty Free vs. Products with MFN above 10%, 2007-2017
Source: APEC 2018 Trade liberalization is also indicated by the proliferation of FTAs in APEC. Prior to 1990, the total number of FTAs entered by Asia Pacific economies was less than ten. By 2017, a total of 175 agreements were signed by APEC economies.164 of these FTAs has been enforced, while 63 were intra-APEC FTA (Figure 8).

27
Figure 8. Cumulative number of FTAs in APEC, pre-1989-2016
Source: APEC 2018 With that, the share of trade covered by FTAs also increased. Comparing the exports and imports across member economies in 1997, 2007, and 2017, the average exports and imports trade relationships covered by FTA partners increased. As of 2017, APEC export trade relationship covered by FTA agreements was 49.4 percent, while import was 46.0 percent, both higher than 1997 and 2007 values (Figure 9). Figure 9. Share of trade by value covered by FTA partners (percent), 1997-2017
Source: APEC 2018
28
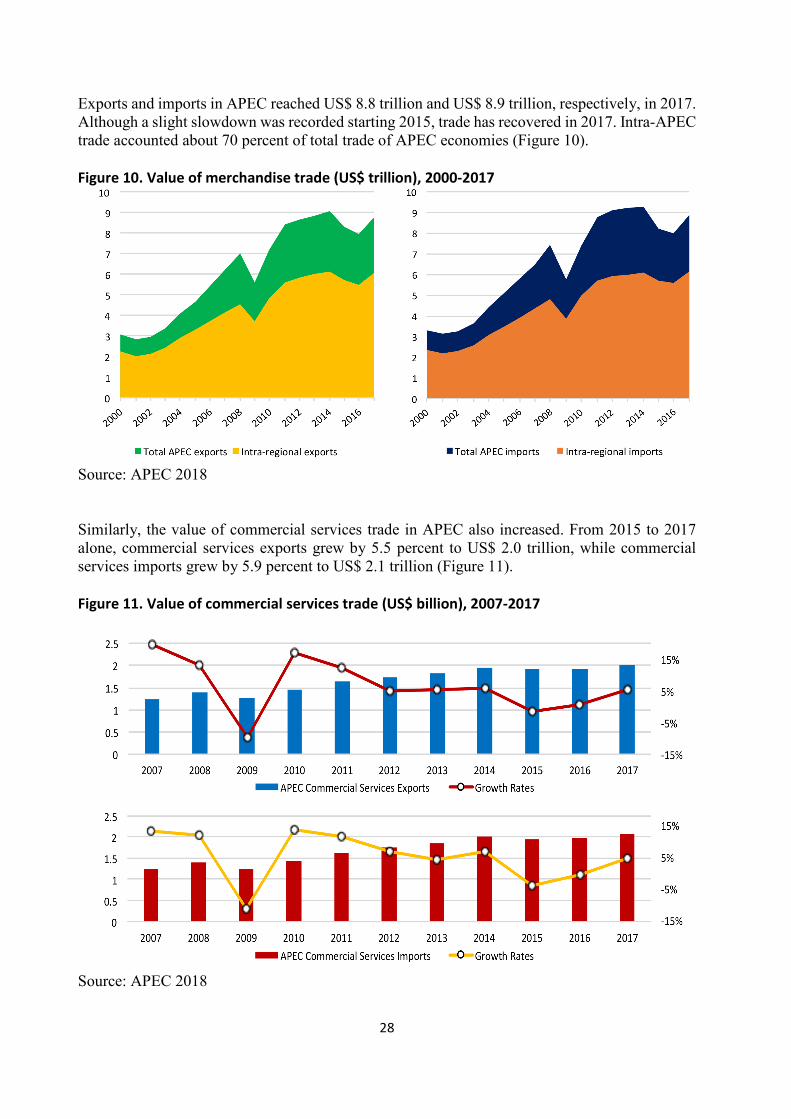
Exports and imports in APEC reached US$ 8.8 trillion and US$ 8.9 trillion, respectively, in 2017. Although a slight slowdown was recorded starting 2015, trade has recovered in 2017. Intra-APEC trade accounted about 70 percent of total trade of APEC economies (Figure 10). Figure 10. Value of merchandise trade (US$ trillion), 2000-2017
Source: APEC 2018 Similarly, the value of commercial services trade in APEC also increased. From 2015 to 2017 alone, commercial services exports grew by 5.5 percent to US$ 2.0 trillion, while commercial services imports grew by 5.9 percent to US$ 2.1 trillion (Figure 11). Figure 11. Value of commercial services trade (US$ billion), 2007-2017
Source: APEC 2018
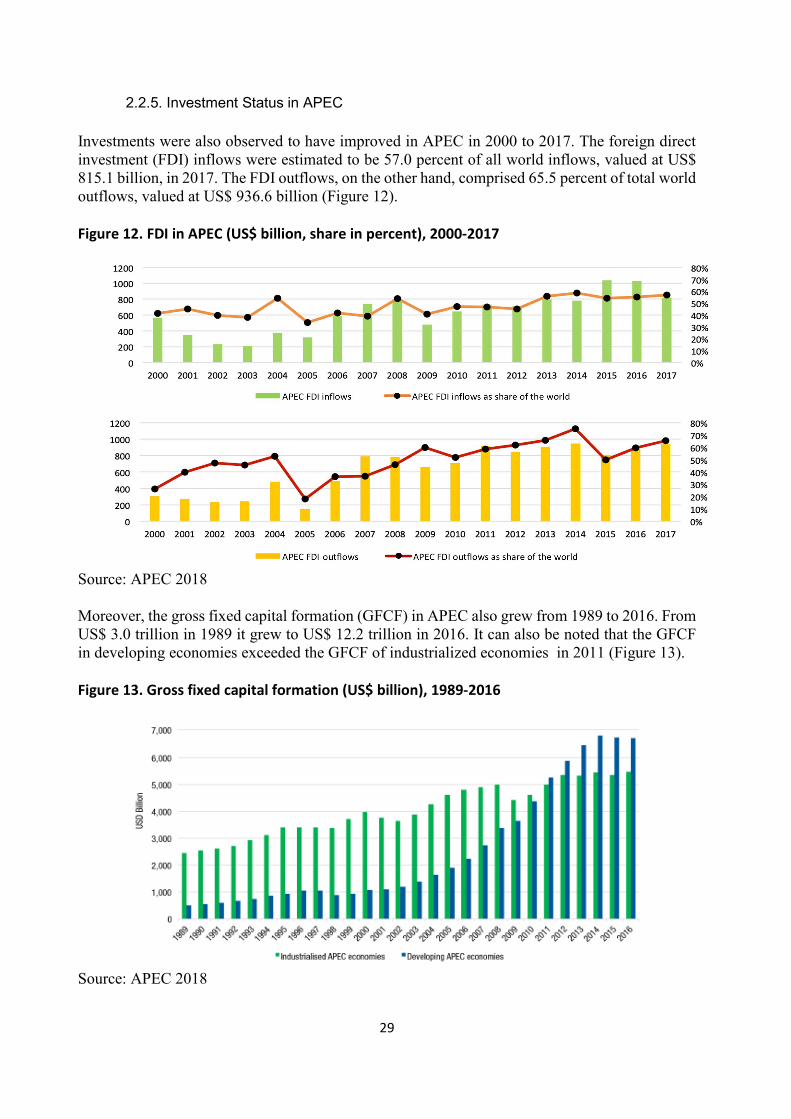
29
2.2.5. Investment Status in APEC Investments were also observed to have improved in APEC in 2000 to 2017. The foreign direct investment (FDI) inflows were estimated to be 57.0 percent of all world inflows, valued at US$ 815.1 billion, in 2017. The FDI outflows, on the other hand, comprised 65.5 percent of total world outflows, valued at US$ 936.6 billion (Figure 12). Figure 12. FDI in APEC (US$ billion, share in percent), 2000-2017
Source: APEC 2018 Moreover, the gross fixed capital formation (GFCF) in APEC also grew from 1989 to 2016. From US$ 3.0 trillion in 1989 it grew to US$ 12.2 trillion in 2016. It can also be noted that the GFCF in developing economies exceeded the GFCF of industrialized economies in 2011 (Figure 13). Figure 13. Gross fixed capital formation (US$ billion), 1989-2016
Source: APEC 2018
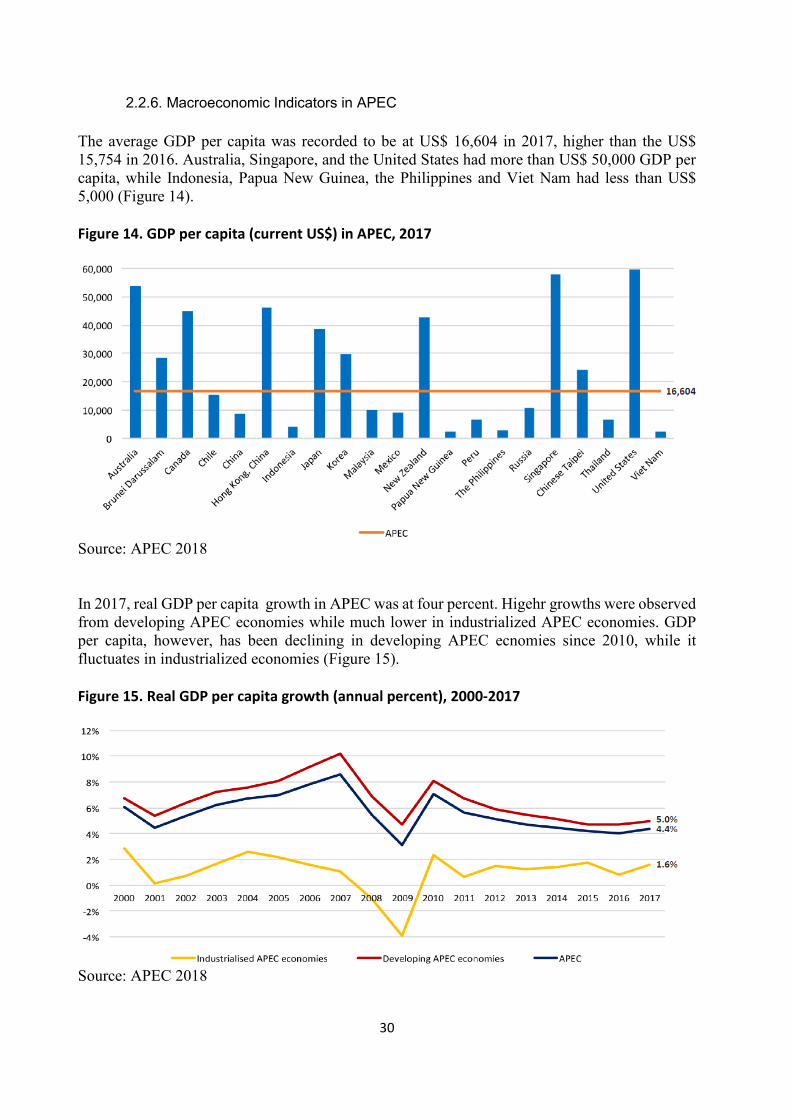
30
2.2.6. Macroeconomic Indicators in APEC The average GDP per capita was recorded to be at US$ 16,604 in 2017, higher than the US$ 15,754 in 2016. Australia, Singapore, and the United States had more than US$ 50,000 GDP per capita, while Indonesia, Papua New Guinea, the Philippines and Viet Nam had less than US$ 5,000 (Figure 14). Figure 14. GDP per capita (current US$) in APEC, 2017
Source: APEC 2018 In 2017, real GDP per capita growth in APEC was at four percent. Higehr growths were observed from developing APEC economies while much lower in industrialized APEC economies. GDP per capita, however, has been declining in developing APEC ecnomies since 2010, while it fluctuates in industrialized economies (Figure 15). Figure 15. Real GDP per capita growth (annual percent), 2000-2017
Source: APEC 2018

31
Unemployment rate in APEC averaged at 4.2 percent. The lowest unemployment rate was recorded in Thailand at 1.1 percent in 2017, higher than 0.6 percent of the previous year. The highest was in Brunei at 7.1 percent, exceeding Canada, which has the highest number of unemployed individuals in 2016, at 7.0 percent (Figure 16). Figure 16. Unemployment rate in APEC, 2017
Source: APEC 2018 Moreover, poverty in APEC seems to have improved as well. From 1.5 billion people in APEC living in poor to extremely poor, only about 475.2 million lived in poverty in 2013. Those considered near-poor, or people living above the poverty line and are vulenrable to returning to poverty, had risen from 241.1 million in 1990 to 720.3 million in 2013 (Figure 17) (APEC 2018). Figure 17. Number of people living in poverty or near-poverty (million), 1990-2013
Source: APEC 2018
32
2.3. Initiatives towards Regional Economic Integration Regional economic integration (REI) is the condition in which multiple economies coordinate in terms of trade, fiscal, and/or monetary policies to benefit from improved trade, developed infrastructure, environmental programs and more efficient financial markets. There are different degrees and order of integration, which dictate the form of the REI – the Preferential Trade Agreement (PTA), Free Trade Area (FTA), Customs Union, Common Market, Economic Union and Monetary Union. To achieve REI, APEC has embarked on several strategies, including the Free Trade Area of the Asia-Pacific (FTAAP), improving the ease of doing business, streamlining customs procedures, and structural reforms. In APEC, regional economic integration will be done by complementing the Bogor Goals of free and open trade and investment (Boney 2011).
2.3.1. FTAAP The first reference to FTAAP was made in Hanoi meeting in 2006, which acknowledge the role of RTAs/FTAs in advancing the trade liberalization and the reduction of trade costs. FTAAP is seen to harmonize the “noodle bowl” (“spaghetti bowl”) of the proliferating regional and bilateral free trade agreements that followed the collapse of Doha Round in 2006. After exploring possible building blocks towards a possible FTAAP, a concrete step was taken by APEC members towards greater regional economic integration. The Beijing Roadmap for the realization of FTAAP was endorsed and the Collective Strategic Study on Issues Related to the Realization of FTAAP was launched in 2014. The study determined potential economic and social benefits, pathways towards FTA, and identify challenges. The leaders reaffirmed that FTAAP should support and complement the multilateral trading system; should be comprehensive and a high-quality instrument to address next generation trade and investment issue; could be advanced by the progress toward Bogor Goals; would be realized outside but parallel with APEC process; and should not aim to minimize any negative impacts of the propagate RTAs/FTAs (APEC CTI 2016). Aside from the adoption of the Bogor Goals in 1994, some initiatives and outcomes relevant to FTAAP include (a) cooperation in trade facilitation, (b) the APEC List of Environmental Gods, (c) modernization of origin certification procedures, (d) endorsement of the APEC Principles for Cross-Border Trade in Services, (e) APEC Non-Binding Investment Principles, and (f) capacity building and other activities. When the Bogor Goals was adopted in 1994, the Osaka Action Agenda was set in 1995 to serve as a roadmap to achieve the Bogor Goals by reducing the trade and investment barriers, promoting free flow of goods, services and capital. The preparation of IAPs and CAPs was adopted to monitor and update the current and planned activities of APEC economies and working groups to achieve the Bogor Goals. These efforts were supported by relaxing the conditions and procedures to attract foreign investment, and reforms were worked out particularly on customs procedures, government procurement, competition policy, intellectual property rights, regulatory reform, and mobility of business people. The APEC Business Travel Card (ABTC) system has also been implemented to ease the mobility of business people. On trade facilitation cooperation, in response to the Leaders’ goal of reducing transport costs by five percent in 2002 and 2006, the APEC Trade Facilitation Action Plan (TFAP I) was developed in 2001. This consisted of actions and measures to reduce trade transaction costs and simplify

33
requirements in customs procedures, standards and conformance, business mobility, and electronic commerce. This was furthered in 2005 in the second TFAP (TFAP II) to another five percent reduction in 2007 and 2010. Later, in 2010, the Supply-Chain Connectivity Framework Action Plan (SCFAP) was endorsed to improve the supply chain performance by ten percent by 2015. The SCFAP identified the chokepoints that needed to be eliminated for a better and more efficient supply chain operations (CTI 2014). Identified chokepoints include yhr lak of transparency and awareness, inefficient transport infrastructure, lack of capacity in logistics, inefficient clearance, burdensome customs documentation procedure, underdeveloped transport capabilities and inefficient connectivity, inconsistent standards and regulations, and the lack of regional cross-border customs-transit arrangements (Patalinghug 2015 and CTI 2014). Similarly, by 2014, the APEC Cooperation Network on Green Supply Chain (GSCNET) was established to strengthen the capacity building and information sharing on green supply chain (CTI 2016). The Green Supply Chain (GSC) is defined as using green and sustainable development notions to design different parts of supply chain, from purchasing, manufacturing, packaging, to consumption and recycling, among others. It aims to reduce the environmental load and impacts throughout the products’ life cycle, and enables enterprises to comply with environmental standards and improve the environmental performance (CTI 2014). GSCNET also supported the Leaders’ APEC List of Environmental Goods initiative. The list resolved to reduce the tariff rates of 54 environmental products to five percent or less by 2015. This contributed to APEC’s pursuit of free and sustainable growth in the region, and extended the access to environmental technologies at lower cost. In addition to initiatives established to facilitate trade, the APEC Leaders endorsed the Electronic Certificates of Origin in 2002. Certificates of Origin attest that the goods originate from a particular economy and are required to obtain tariff concessions as agreed in the RTAs/FTAs. The electronic processing of the certificates reduces the documentation and other customs procedures costs. In 2009, the Ministers endorsed the APEC Pathfinder Initiative for Self-Certification of Origin, which is a one-stop process that eased further the trade facilitation of MSMEs in APEC. Further, in 2015, the Trade Ministers endorsed the Boracay Action Agenda (BAA) to Globalize MSMEs, which provides an option to waive the Certificates of Origin when a commercially significant threshold value is met; encourages the adoption of self-certification as a best practice in trade facilitation and participation; and promotes the use of information technology and automation. Moreover, the APEC Connectivity Blueprint for 2015-2025 was endorsed in 2014 to strengthen the physical, institutional and people-to-people connectivity in Asia-Pacific (CTI 2016).
2.3.2. Ease of Doing Business Another approach to achieving regional economic integration was through making trade cheaper, easier, and faster. The Ease of Doing Business Action Plan was launched in 2009 and was expected to improved doing business in the region by 11.3 percent across all areas (Table 3). The Second APEC’s Ease of Doing Business (EoDB) Action Plan is the continuation of the initiative launched in 2009. APEC’s EoDB is based on the World Bank’s Doing Business program and focuses on five priority areas: Starting a Business, Dealing with Construction Permits, Getting Credit, Trading across Borders, and Enforcing Contracts (APEC 2018). The overall target of the First APEC’s EoDB Action Plan for 2009-2015 was to achieve an overall target of 25 percent

34
improvement. APEC, however, fell short in most areas except for Starting a Business where it achieved 47.7 percent improvement (APEC 2016). Table 3. Accumulated overall progress of Ease of Doing Business Initiative (average values)
Improvement Starting a Business
Dealing with Construction
Permits Getting Credit
Trading Across
Borders Enforcing Contracts
Overall Progress Benchmark
2009-2010* 6.3 3.3 1.8 1.4 0 2.6 2.5 2009-2011* 17.1 6.9 3.3 2.7 0.4 6.1 5 2009-2012* 22.8 15.7 4 2.5 0.1 9 10 2009-2013* 27.3 19.8 6.6 2.6 0.2 11.3 15 2009-2014** 38.7 14.9 8 1.5 0.5 12.7 20 20092015*** 47.4 13.9 10.1 1.4 0.4 14.6 25
Source: APEC Secretariat, Policy Support Unit calculations using data from: * World Bank, Doing Business 2014 database ** World Bank, Doing Business 2015 database *** World Bank, Doing Business 2016 database Note: Figures in percentage values. Improvements are shown with positive values. Despite failing to reach the overall target, the EoDB initiative of APEC definitely achieved remarkable improvements in making trading and business in APEC cheaper, easier, and more efficient and helped firms save time and resources. For 2016-2017, the EoDB had achieved an overall progress of 7.3 percent, higher than the pro-rata target of 6.6 percent. However, this can only be accounted from the improvements in Starting a Business and Getting Credit priority areas. The rest, although having improved, was far beyond the target (Figure 18) (APEC 2018). Figure 18. Accumulated progress in EoDB for 2016-2017 (average values)
Source: APEC Secretariat, PSU calculations using data from the World Bank, Doing Business 2018 database (APEC 2018)
35
2.3.3. Streamlining Customs Procedures Established as a sub-forum of the Committee on Trade and Investment (CTI), APEC’s Sub-Committee on Customs Procedures (SCCP) has the main objective of simplifying and harmonizing regional customs procedures to ensure efficient movement of goods and services. Among its initiatives to achieve its objectives are the Single Window Strategic Plan, the Intellectual Property Rights (IPR) Enforcement Strategies, and the Action Plan on the Development of Authorized Economic Operator (AEO) Programs and the AEO Compendium (APEC 2018). APEC’s initiative to streamline customs procedures created a centralized online export-import processing, platform known as the Single Window, which accelerates the transport of goods across borders. The virtual system consolidates the links to government agencies and allows companies to submit documents electronically anywhere. The system was adopted in 2007 to allow for speedy processing as it is paperless and to promote international interoperability (APEC 2014). The IPR Enforcement Strategies and the APEC Guidelines for Customs Border Enforcement, Counterfeiting and Piracy were endorsed to strengthen the enforcement of IPR at borders. The AEO Programs and Compendium help members establish AEO programs and mutual recognition, which helps speed customs inspections for low-risk accredited operators (APEC 2018).
2.3.4. Structural Reforms The structural reform is another initiative of APEC that supports economies to progress even in times of economic slowdown. Initially, it was intended to prevent slower growth, but now it helps economies leverage improved efficiency and competitiveness. The Leaders’ Agenda to Implement Structural Reform (LAISR) was adopted in 2004 with five priorities to focus on regulatory reform, competition policy, corporate governance, public sector governance, and economic and legal infrastructure until 2010. In 2010, the agenda was extended and the APEC New Strategy for Structural Reform (ANNSR) was adopted with broader priorities: (a) more open, well-functioning, transparent, and competitive markets; (b) labor market opportunities, training, and education; (c) sustained SME development and enhanced opportunities for women and vulnerable populations; (d) effective and fiscally sustainable social safety net programs; and 5) better functioning and effectively regulated financial markets. This ran until 2015. Later, in 2015, the Renewed APEC Agenda for Structural Reform (RAASR) was propose by APEC’s Structural Reform Ministers. The RAASR had three pillars that serve as a guide for individual economies in taking concrete reform actions. These include (a) more open, well-functioning, transparent and competitive markets; (b) deeper participation in those markets by all segments of society, including micro, small and medium enterprises (MSMEs), women, youth, older workers, and people with disabilities; and (c) sustainable social policies that promote the above-mentioned objectives, enhance economic resilience, and are well-targeted, effective, and non-discriminatory. Both the ANNSR and RAASR are non-prescriptive and provide economies independence in their reform priorities.

36
Under the three pillars of RAASR, 17 agreed indicators are adopted. These indicators are either based on policies or perceptions, or outcome indicators. Five indicators are based on the assessment of economies’ policy framework, including the World Bank Ease of Doing Business, OECD Economy-wide Product Market Regulation, OECD FDI Regulatory Restrictiveness Index, OECD Services Trade Restrictiveness Index, and the World Bank Indicators on Women, Business and the Law. The next five indicators are based on perceptions and provide insights about the stakeholders’ perceptions on policies. These are the World Economic Forum (WEF) indicators for Business Sophistication and Innovation, for Labor Market Efficiency, for Financial Market Efficiency, for Basie Services and Infrastructure and for Fiscal Transfers. The rest are outcome indicators that provide insights on the economies’ progress in achieving their objectives in implementing policies (Table 4) (APEC 2018). Table 4. RAASR indicators and associated pillars
No. Indicator
More open, well-functioning,
transparent and competitive
markets
Deeper participation
by all segments of society, including MSMEs, women,
youth, older workers, and
people with disabilities
Sustainable social policies that
promote the other pillars,
enhance economic resilience, and are
well-targeted, effective and
nondiscriminatory 1 World Bank Ease of Doing Business
Distance to Frontier ⃝ ⃝
2 OECD Economy-wide Product Market Regulation ⃝ ⃝
3 OECD FDI Regulatory
Restrictiveness Index ⃝ ⃝
4 OECD Services Trade Restrictiveness Index ⃝ ⃝
5 The Conference Board Labor Productivity per Person Employed ⃝ ⃝
6 WEF Global Competitiveness Indicators for Business Sophistication and Innovation
⃝ ⃝
7 ILO Employment to Population Ratio ⃝
8 ILO Share of Youth Unemployment ⃝ 9 ILO Labor Force Participation Rate
for Age Group 65+ ⃝
10 World Bank Indicators on Women,
Business and the Law ⃝
11 WEF Global Competitiveness
Indicators for Labor Market Efficiency
⃝ ⃝
12 WEF Global Competitiveness Indicators for Financial Market Efficiency
⃝ ⃝
13 UNESCO Tertiary Gross Enrolment Ratio ⃝ ⃝
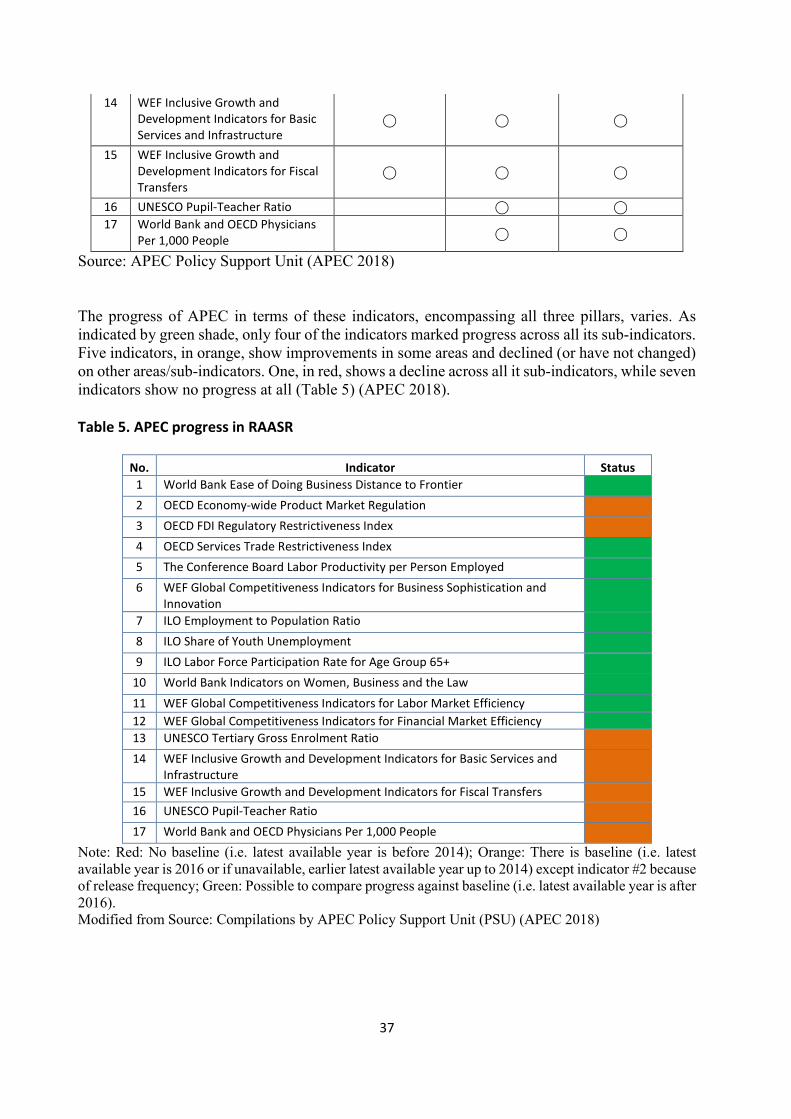
37
14 WEF Inclusive Growth and Development Indicators for Basic Services and Infrastructure
⃝ ⃝ ⃝
15 WEF Inclusive Growth and Development Indicators for Fiscal Transfers
⃝ ⃝ ⃝
16 UNESCO Pupil-Teacher Ratio ⃝ ⃝ 17 World Bank and OECD Physicians
Per 1,000 People ⃝ ⃝
Source: APEC Policy Support Unit (APEC 2018) The progress of APEC in terms of these indicators, encompassing all three pillars, varies. As indicated by green shade, only four of the indicators marked progress across all its sub-indicators. Five indicators, in orange, show improvements in some areas and declined (or have not changed) on other areas/sub-indicators. One, in red, shows a decline across all it sub-indicators, while seven indicators show no progress at all (Table 5) (APEC 2018). Table 5. APEC progress in RAASR
No. Indicator Status 1 World Bank Ease of Doing Business Distance to Frontier
2 OECD Economy-wide Product Market Regulation
3 OECD FDI Regulatory Restrictiveness Index
4 OECD Services Trade Restrictiveness Index
5 The Conference Board Labor Productivity per Person Employed
6 WEF Global Competitiveness Indicators for Business Sophistication and Innovation
7 ILO Employment to Population Ratio 8 ILO Share of Youth Unemployment 9 ILO Labor Force Participation Rate for Age Group 65+
10 World Bank Indicators on Women, Business and the Law 11 WEF Global Competitiveness Indicators for Labor Market Efficiency
12 WEF Global Competitiveness Indicators for Financial Market Efficiency
13 UNESCO Tertiary Gross Enrolment Ratio 14 WEF Inclusive Growth and Development Indicators for Basic Services and
Infrastructure
15 WEF Inclusive Growth and Development Indicators for Fiscal Transfers
16 UNESCO Pupil-Teacher Ratio 17 World Bank and OECD Physicians Per 1,000 People
Note: Red: No baseline (i.e. latest available year is before 2014); Orange: There is baseline (i.e. latest available year is 2016 or if unavailable, earlier latest available year up to 2014) except indicator #2 because of release frequency; Green: Possible to compare progress against baseline (i.e. latest available year is after 2016). Modified from Source: Compilations by APEC Policy Support Unit (PSU) (APEC 2018)
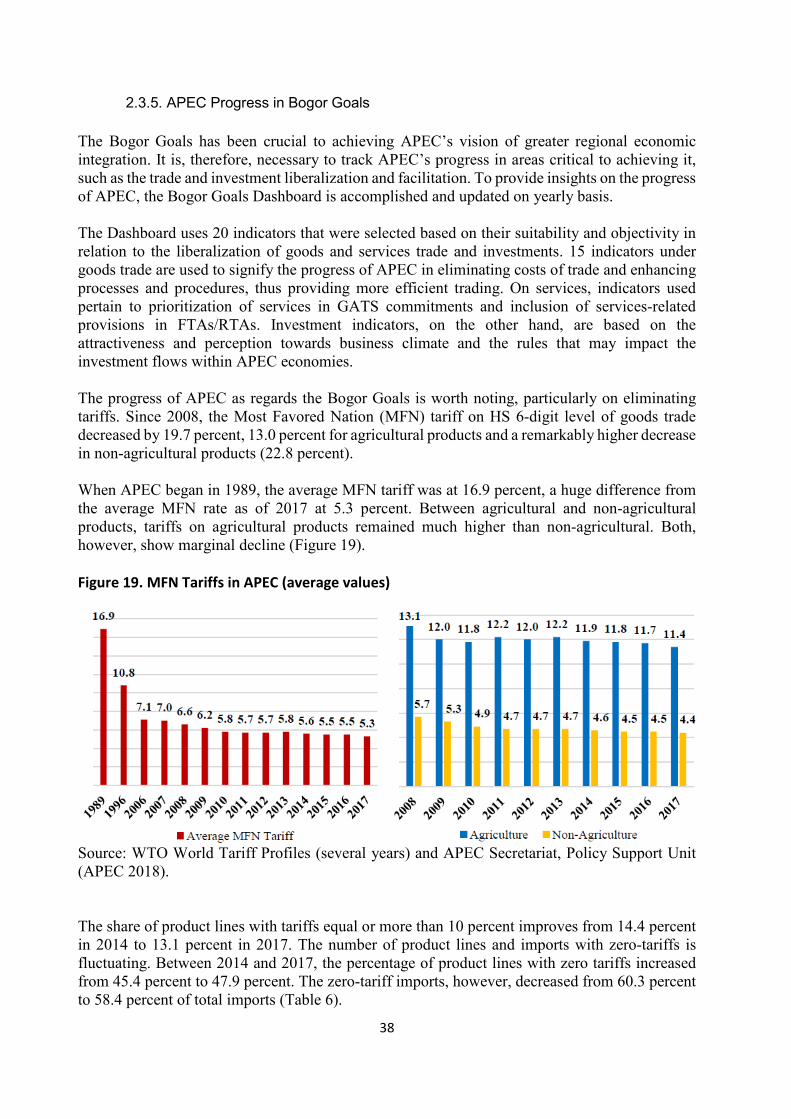
38
2.3.5. APEC Progress in Bogor Goals The Bogor Goals has been crucial to achieving APEC’s vision of greater regional economic integration. It is, therefore, necessary to track APEC’s progress in areas critical to achieving it, such as the trade and investment liberalization and facilitation. To provide insights on the progress of APEC, the Bogor Goals Dashboard is accomplished and updated on yearly basis. The Dashboard uses 20 indicators that were selected based on their suitability and objectivity in relation to the liberalization of goods and services trade and investments. 15 indicators under goods trade are used to signify the progress of APEC in eliminating costs of trade and enhancing processes and procedures, thus providing more efficient trading. On services, indicators used pertain to prioritization of services in GATS commitments and inclusion of services-related provisions in FTAs/RTAs. Investment indicators, on the other hand, are based on the attractiveness and perception towards business climate and the rules that may impact the investment flows within APEC economies. The progress of APEC as regards the Bogor Goals is worth noting, particularly on eliminating tariffs. Since 2008, the Most Favored Nation (MFN) tariff on HS 6-digit level of goods trade decreased by 19.7 percent, 13.0 percent for agricultural products and a remarkably higher decrease in non-agricultural products (22.8 percent). When APEC began in 1989, the average MFN tariff was at 16.9 percent, a huge difference from the average MFN rate as of 2017 at 5.3 percent. Between agricultural and non-agricultural products, tariffs on agricultural products remained much higher than non-agricultural. Both, however, show marginal decline (Figure 19). Figure 19. MFN Tariffs in APEC (average values)
Source: WTO World Tariff Profiles (several years) and APEC Secretariat, Policy Support Unit (APEC 2018). The share of product lines with tariffs equal or more than 10 percent improves from 14.4 percent in 2014 to 13.1 percent in 2017. The number of product lines and imports with zero-tariffs is fluctuating. Between 2014 and 2017, the percentage of product lines with zero tariffs increased from 45.4 percent to 47.9 percent. The zero-tariff imports, however, decreased from 60.3 percent to 58.4 percent of total imports (Table 6).
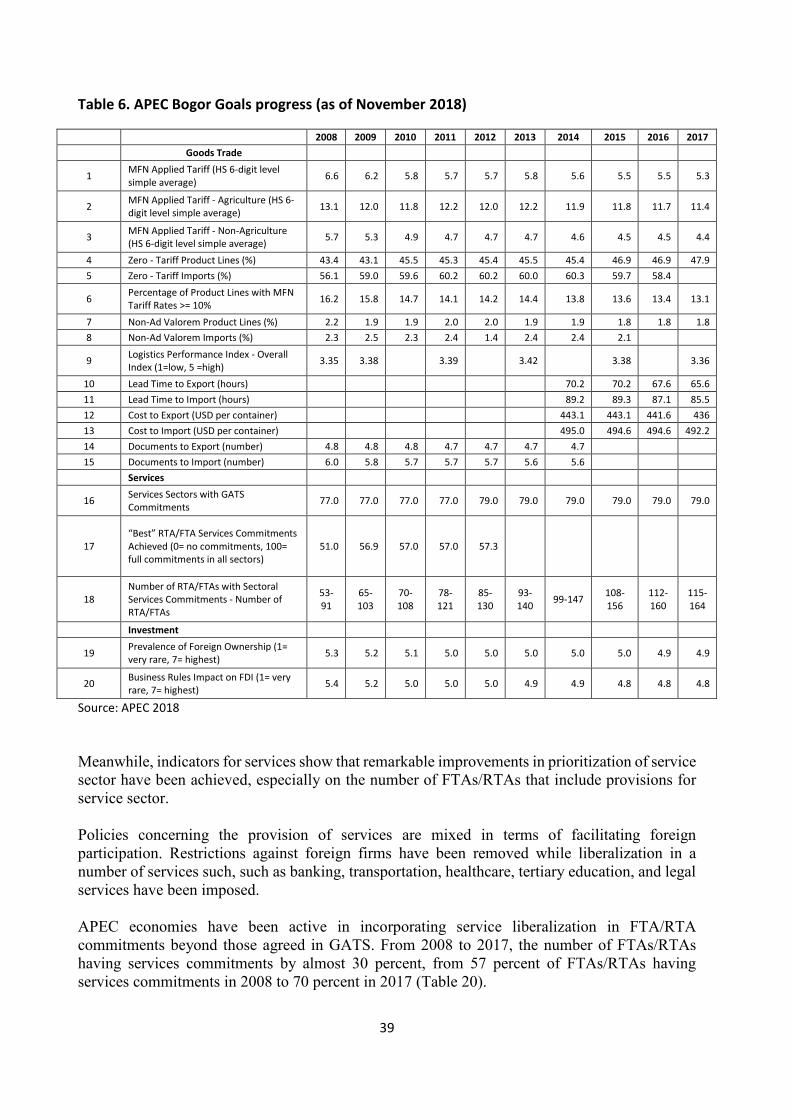
39
Table 6. APEC Bogor Goals progress (as of November 2018)
2008 2009 2010 2011 2012 2013 2014 2015 2016 2017 Goods Trade
1 MFN Applied Tariff (HS 6-digit level simple average) 6.6 6.2 5.8 5.7 5.7 5.8 5.6 5.5 5.5 5.3
2 MFN Applied Tariff - Agriculture (HS 6-digit level simple average) 13.1 12.0 11.8 12.2 12.0 12.2 11.9 11.8 11.7 11.4
3 MFN Applied Tariff - Non-Agriculture (HS 6-digit level simple average) 5.7 5.3 4.9 4.7 4.7 4.7 4.6 4.5 4.5 4.4
4 Zero - Tariff Product Lines (%) 43.4 43.1 45.5 45.3 45.4 45.5 45.4 46.9 46.9 47.9 5 Zero - Tariff Imports (%) 56.1 59.0 59.6 60.2 60.2 60.0 60.3 59.7 58.4
6 Percentage of Product Lines with MFN Tariff Rates >= 10% 16.2 15.8 14.7 14.1 14.2 14.4 13.8 13.6 13.4 13.1
7 Non-Ad Valorem Product Lines (%) 2.2 1.9 1.9 2.0 2.0 1.9 1.9 1.8 1.8 1.8 8 Non-Ad Valorem Imports (%) 2.3 2.5 2.3 2.4 1.4 2.4 2.4 2.1
9 Logistics Performance Index - Overall Index (1=low, 5 =high) 3.35 3.38 3.39 3.42 3.38 3.36
10 Lead Time to Export (hours) 70.2 70.2 67.6 65.6 11 Lead Time to Import (hours) 89.2 89.3 87.1 85.5 12 Cost to Export (USD per container) 443.1 443.1 441.6 436 13 Cost to Import (USD per container) 495.0 494.6 494.6 492.2 14 Documents to Export (number) 4.8 4.8 4.8 4.7 4.7 4.7 4.7 15 Documents to Import (number) 6.0 5.8 5.7 5.7 5.7 5.6 5.6 Services
16 Services Sectors with GATS Commitments 77.0 77.0 77.0 77.0 79.0 79.0 79.0 79.0 79.0 79.0
17 “Best” RTA/FTA Services Commitments Achieved (0= no commitments, 100= full commitments in all sectors)
51.0 56.9 57.0 57.0 57.3
18 Number of RTA/FTAs with Sectoral Services Commitments - Number of RTA/FTAs
53-91
65-103
70-108
78-121
85-130
93-140 99-147 108-
156 112- 160
115- 164
Investment
19 Prevalence of Foreign Ownership (1= very rare, 7= highest) 5.3 5.2 5.1 5.0 5.0 5.0 5.0 5.0 4.9 4.9
20 Business Rules Impact on FDI (1= very rare, 7= highest) 5.4 5.2 5.0 5.0 5.0 4.9 4.9 4.8 4.8 4.8
Source: APEC 2018 Meanwhile, indicators for services show that remarkable improvements in prioritization of service sector have been achieved, especially on the number of FTAs/RTAs that include provisions for service sector. Policies concerning the provision of services are mixed in terms of facilitating foreign participation. Restrictions against foreign firms have been removed while liberalization in a number of services such, such as banking, transportation, healthcare, tertiary education, and legal services have been imposed. APEC economies have been active in incorporating service liberalization in FTA/RTA commitments beyond those agreed in GATS. From 2008 to 2017, the number of FTAs/RTAs having services commitments by almost 30 percent, from 57 percent of FTAs/RTAs having services commitments in 2008 to 70 percent in 2017 (Table 20).
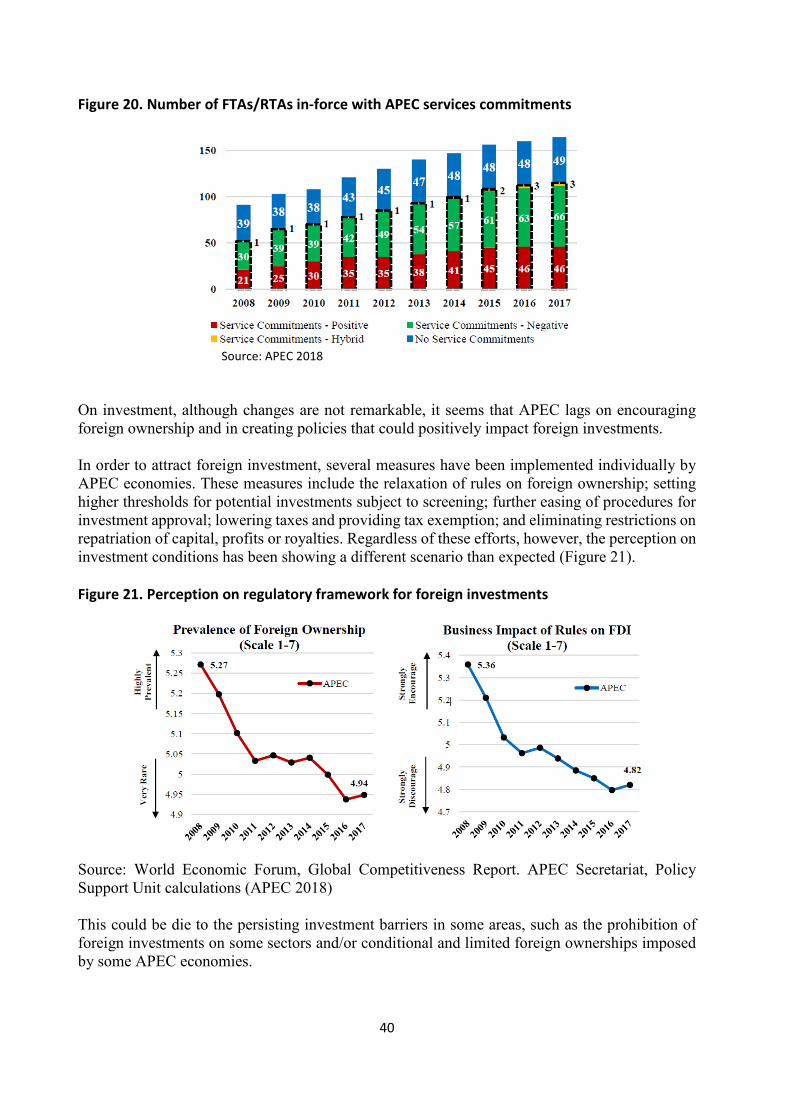
40
Figure 20. Number of FTAs/RTAs in-force with APEC services commitments
Source: APEC 2018
On investment, although changes are not remarkable, it seems that APEC lags on encouraging foreign ownership and in creating policies that could positively impact foreign investments. In order to attract foreign investment, several measures have been implemented individually by APEC economies. These measures include the relaxation of rules on foreign ownership; setting higher thresholds for potential investments subject to screening; further easing of procedures for investment approval; lowering taxes and providing tax exemption; and eliminating restrictions on repatriation of capital, profits or royalties. Regardless of these efforts, however, the perception on investment conditions has been showing a different scenario than expected (Figure 21). Figure 21. Perception on regulatory framework for foreign investments
Source: World Economic Forum, Global Competitiveness Report. APEC Secretariat, Policy Support Unit calculations (APEC 2018) This could be die to the persisting investment barriers in some areas, such as the prohibition of foreign investments on some sectors and/or conditional and limited foreign ownerships imposed by some APEC economies.

41
2.4. Pathways to Achieve FTAAP The complexity and difficulty encountered in reducing the trade barriers led FTAs/RTAs to flourish around the world. Two of the widely recognized mega FTAs – the Trans-Pacific Partnership (TPP) and the Regional Comprehensive Economic Partnership (RCEP), share common goals of trade liberalization and economic integration. The TPP was initially conceptualized in 2002 when Chile, New Zealand, and Singapore agreed to form a “Common Economic Partnership” that would prioritize open trade. When Brunei joined in the succeeding years, it came to be known as the “Trans-Pacific Strategic Economic Partnership Agreement”, also known as P4. Eventually, as more countries joined, the “Trans-Pacific Partnership” was conceived. Australia, Malaysia, Peru, Singapore, and Viet Nam followed, and in 2009, US formally entered the TPP negotiation. Canada, Japan, and Mexico followed in 2013 (Kim 2016). The United States, however, withdrew from TPP on January 30, 2017. As a result, China accordingly achieved a major strategic advantage over Asia that could dictate the trade in the region and even beyond, and could be able to strengthen its power through RCEP (Chow et al 2018). RCEP, on the other hand, is an initiative that the policy makers of Association of Southeast Asian Nations (ASEAN) have embarked to operate on the potentials of an FTA. The ASEAN has been pursuing economic regionalism since the 90s and started integration through the ASEAN FTA in 1992, which it expanded through the ASEAN Economic Community (AEC) and further integrated globally using the ASEAN+1 scheme. The utilization rates of FTA preferences, however, remained low due to lack of information among businesses and multi-national corporations (MNCs), low margins of preference, the prevalence of non-tariff barriers and exclusion lists, and the existence of multiple rules of origin (ROOs). These all led to delays and high administrative costs (Das and Jagtiani 2014). RCEP has the primary objective of attaining a modern, comprehensive, high-quality and mutually beneficial economic partnership agreement. Achieving these would permit members states and FTA partners to contribute and sustain individual economies and to achieve economic integration, equitable development, and strengthened cooperation. On the other hand, TPP’s prime objectives are to augment trade and investments among its members, to promote innovation and economic growth and development, and to back up the creation and retention of jobs and initiate a high-standard modern agreement (Kim 2016). TPP seeks to liberalize trade and investment with new rules and disciplines ahead of the existing rules in the World Trade Organization (WTO). It envisions as a living agreement that would also benefit future members and may lead to a wider Asia-Pacific FTA (Fergusson, et al. 2016). Table 7. Key features of RCEP and TPP
TPP RCEP First mooted December 2009 November 2011 Official negotiations March 2010 May 2013 Intended completion
Late 2014 Late 2015
Negotiating rounds completed
19 5

42
Primary goal Address quality issues through a new ‘twenty-first-century’ free trade agreement
ASEAN-plus-X model, accession yet to occur
Relation to regional architecture
Not tied to any existing organization Affirms principle of ASEAN centrality
Scope and coverage “WTO-plus” aspirations—20 non-tariff issues targeted
“WTO consistent” only— mostly focused on tariffs
Major sponsor US led ASEAN led Current members Australia, Brunei, Canada, Chile, Japan,
Malaysia, Mexico, New Zealand, Peru, Singapore, USA and Vietnam
ASEAN, Japan, South Korea, China, India, Australia and New Zealand
Source: Wilson 2015 Having similar goals of trade liberalization and economic integration, RCEP and TPP are perceived to lead the regional economic integration. TPP is regarded as a provisional arrangement and springboard to Free Trade Area of the Asia-Pacific (FTAAP), which was conceived by APEC in Bogor in 1994. The TPP considers extending the membership to potential members, but more notably aims to intensify collaboration with APEC members and China (Urata in Kim 2014). 12 APEC economies are put forward to include in RCEP, as it is deemed to facilitate the Bogor Goals and accomplish the Asia-Pacific trade and investment liberalization by 2020. In 2004, in view of the proliferation of FTAs, APEC Business Advisory Council (ABAC) propounded the 21 economies to adopt the FTAAP vision in 2006 to reinforce APEC. In the 2010 APEC Leaders’ Declaration, ASEAN+3, ASEAN+6, and the TPP were identified as pathways to FTAAP (Hsieh 2017). TPP and RCEP share common aspiration of establishing high-quality and comprehensive agreements for economic growth and development in the region. The two mega-trade agreements, however, are different in some aspects. RCEP is intended to realize equitable economic development through economic cooperation, which is not emphasized in TPP. Comparing TPP and RCEP, the differences are noticeable in terms of population, GDP, GDP per capita, and trade (Table 8). Table 8. Key features of RCEP and TPP
Population GDP GDP per
capita (US$) Trade
(million) (%) (US$ billions) (%) (US$ billions) (%)
RCEP
China
1,350.7
19.2
8,227.1
11.4
6,091.0
3,866.9
10.4
S. Korea
50.0
0.7
1,129.6
1.6
22,590.2
1,067.5
2.9
India
1,236.7
17.6
1,841.7
2.5
1,489.2
782.6
2.1
Cambodia
14.9
0.2
14.0
-
944.4
19.2
0.1
Indonesia
246.9
3.5
878.0
1.2
3,556.8
378.4
1.0
Laos
6.6
0.1
9.4
-
1,417.1
5.1
-
Myanmar
52.8
0.7
52.5
0.1
861.0
20.4
0.1

43
Philippines
96.7
1.4
250.2
0.3
2,587.0
117.4
0.3
Thailand
66.8
0.9
366.0
0.5
5,479.8
477.1
1.3
RCEP
and
TPP
Brunei
0.4
-
17.0
-
41,126.6
17.0
-
Malaysia
29.2
0.4
305.0
0.4
10,432.1
424.0
1.1
Singapore
5.3
0.1
247.4
0.4
51,709.5
788.1
2.1
Vietnam
88.8
1.3
155.8
0.2 155,2
228.4
0.6
Japan
127.6
1.8
5,959.7
8.2
46,720.4
1,684.4
4.6
Australia
22.7
0.3
1,532.4
2.1
67,555.8
517.8
1.4 New Zealand
4.4
0.1
167.3
0.2
37,749.4
75.6
0.2
TPP
USA
313.9
4.5
16,244.6
22.4
51,748.6
3,882.7
10.5
Canada
34.9
0.5
1,821.4
2.5
52,219.0
929.7
2.5
Mexico
120.8
1.7
1,178.1
1.6
9,748.9
751.4
2.0
Chile
17.5
0.2
269.9
0.4
15,452.2
158.1
0.4
Peru
30.0
0.4
203.8
0.3
849.4
88.2
0.2
RCEP
3,400.5
48.3
21,180.6
29.2
18,879.1
10,469.6
28.3
TPP
795.5
11.3
28,129.8
38.8
32,751.1
9,545.2
25.8
World 7,046.4
100.0
72,440.4
100.0
10,280.5
37,006.6
100.0
Notes: All the figures except GDP and GDP per capita for Myanmar are taken from World Bank, while GDP and GDP per capita for Myanmar are taken from the ASEAN Secretariat. Sources: World Bank, World Development Indicators online accessed March 30, 2014 ASEAN Secretariat, http://www.asean.org/news/item/selected-key-indicators accessed on March 30, 2014 (Urata 2014).
The TPP has a population of only about 0.8 billion, barely a quarter of RCEP’s 3.4 (billion representing almost half of the world’s population). In terms of GDP, however, TPP has higher at US$ 28 trillion, about 40 percent of the world’s GDP, compared to RCEP’s US$ 21 trillion. The population and GDP of TPP and RCEP also reflect the differences in their GDP per capita. Considering the larger population and higher GDP, and the low-income member economies, RCEP has significantly lower GDP per capita at US$ 18,879, while TPP has only US$ 32,751. Lastly, the magnitudes of trade in TPP and RCEP are both valued at around US$ 10 trillion. In terms of coverage, RCEP and TPP also differ (Table 8). For instance, while TPP seeks complete tariff elimination, RCEP may have slightly lower trade liberalization rate. More notable of these differences is the mode of agreement – TPP tries to include all of the components in a “single undertaking”, while RCEP adopts a gradual approach and negotiations of components are done on different time periods according to the difficulty of arriving at an agreement.

44
Table 9. Issues Covered in RCEP and TPP
Issues TPP RCEP Trade in Goods ● ● - Market Access for Goods ● ● - Textile and Apparel ● ◌ - Rules of Origin ● ◌ - Customs ● ◌ - Trade Facilitation ● - TBT ● - SPS ● - Trade Remedies ● Trade in Services ● ● - Cross-border Services ● ● - Financial Services ● ◌ - Telecommunications ● ◌ - Temporary Entry ● Investment ● ● Economic and Technical Cooperation ●* ● Intellectual Property ● ● Competition ● ● Dispute Settlement ●** ● Legal and Institutional Issues ● ◌ Others ● ● - E-commerce ● ● - Environment ● - Government Procurement ● - Labor ● - Crosscutting Horizontal Issues ●
Note: ● means the issue is covered. ◌ for RCEP means that the issue is likely covered judging from ASEAN+1 FTAs and ASEAN Economic Community. * Cooperation and Capacity Building. ** Legal issues for administration of the Agreement including dispute settlement. Source: Adopted from the work done by Fukunaga of ERIA with some modification (Urata 2014).
The level of commitment of RCEP and TPP also substantially differ, particularly in the treatment of developing economies. As such, the trade ministers of ASEAN+6 agreed to provide special and differential treatment to least-developed ASEAN members in the RCEP, which is consistent with the existing ASEAN+1 FTAs. TPP, in contrast, does not consider special and differential treatment in terms of the contents of agreements. TPP, however, may provide different implementation schedules. Stressing the equitable and sustainable development approach of RCEP, it may begin with shallow by gradual achievement of deeper integration, which may lead to the achievement of East Asian Economic Community (EAEC), a potential extension of the AEC. TPP’s approach, on the other hand, are high-level rules on competition, intellectual property rights, government procurement, among others, to achieving a free and open business environment, that could develop into FTAAP, and eventually into the second WTO (Urata 2014).

45
Despite their differences, the RCEP and The TPP offer benefits that are largely interdependent. Although not necessarily mutually dependent, the two may complement and coexist to attain FTAAP. This can be considered a two-stage approach to achieve the goal of regional integration, wherein developing economies in East Asia may initially participate in RCEP and then TPP when they are already able to meet the high-standard rules. This coexistence, however, may only be realized if the RCEP and the TPP accept new qualified members (Urata 2014). Coinciding memberships would further ensure that the RCEP and the TPP would not compete with each other, as common members would align the provisions in both FTAs to simplify their internal policy adjustments (Kim 2016).
3. Philippines in APEC The Philippines is one of the twelve founding members of APEC. APEC, which operates on the basis of non-binding and voluntary commitment and open dialogue, is important to the Philippines for a number of reasons. Majority of the country’s external trade were from APEC member economies. Its exports to APEC totaled to US$ 47,367 million, equivalent to 84.11 percent of its total exports. 51.6 percent of this was electronic products, and the rests included woodcrafts and furniture, manufacture goods, machinery and transport equipment. Its imports from APEC economies, on the other hand, reached a total of US$ 67,899 million, about 84 percent of the country’s total imports, which included electronic products, transport equipment, and mineral fuels (DTI 2018). In order to understand the relationship of APEC and the Philippines, it is necessary to highlight the roles, as well as the commitments, that the economy portrayed in APEC. 3.1. Philippines’ APEC Hosting The Philippines has already hosted APEC summit twice, first in 1996 in Subic and second in 2015 in Manila. APEC 1996 marks one of the most significant events among APEC summits as this is when the implementation phase of free and open trade and investment agenda was launched; business facilitation measures were delivered; common goals in World Trade Organization were agreed to advance; way to strengthen economic and technical cooperation were developed; and the business sectors role as a full partner in the APEC process was recognized and engaged. The Manila Action Plan for APEC was introduced during the 1996 hosting. MAPA serves as a compilation of individual and collective initiatives, or the Individual Action Plans (IAPs), of member economies in fulfilling their voluntary commitments in implementing the Osaka Action Agenda. The MAPA contains the steps towards achieving the Bogor Goals. The leaders also reaffirmed their commitment to multilateral trading system based on the WTO and endorsed freer and non-discriminatory trade in goods and services. The role of information technology was also recognized in the Information Technology Agreement (APEC 1996). APEC 2015, subsequently, prioritized investing in human capital development; fostering SMEs’ participation in the regional and global markets; building inclusive, sustainable and resilient communities; and enhancing the REI agenda. Leaders in APEC 2015 reiterated their support to comprehensive structural reforms; achievement of positive economic, social and environmental

46
outcomes; and the promotion of good governance. The APEC Strategy for Strengthening Quality Growth was adopted to prioritize institution building, social cohesion, and environmental impact. The Cebu Action Plan (CAP) was also adopted for deeper financial markets. CAP has four pillars of (a) promoting financial integration, (b) advancing fiscal reforms and transparency, (c) enhancing financial resilience, and (d) accelerating the development and financing of infrastructure (APEC 2015, a and b). SMEs participation to global markets and Global Value Chains (GVCs) was also encouraged, thus adopting the Boracay Action Agenda to Globalize MSMEs. The leaders also supported the creation of APEC MSME Marketplace that would provide opportunities for businesses and strengthen the collaboration of public and private organizations. Moreover, the APEC Disaster Risk Reduction (DRR) Framework was adopted to facilitate collective efforts in building sustainable and disaster-resilient economies, and the commitment towards the realization of FTAAP was also reaffirmed (APEC 2015). 3.2. Philippine Initiatives to FTAAP Some of the Philippines’ counterparts in achieving the FTAAP include efforts on improving the supply chain connectivity, green supply chain, contribution to the Boracay Action Agenda during the APEC 2015 hosting, and on connectivity blueprint. Having identified the different chokepoints in the SCFAP, the Philippines conducted its own activities in order to overcome these challenges on four areas – transparency, infrastructure, documentation, and connectivity. These activities were in the form of meetings, seminars, training, planning and publications (Table 10). Table 10. Philippine’s actions to improve supply chain
Chokepoint Actions Transparency · Initiative to Advance the Action Plan for Chokepoint 1 of the
APEC Supply Chain Connectivity Framework. · APEC Guidelines for Advance Rulings · Symposium on Supply Chain Connectivity · Compendium of Best Practices of National Logistics Associations · Improving the Understanding of Logistics Services
Infrastructure · Study and seminar on energy, transport, and environmental benefits of transit-oriented development
Documentation · Self-Certification of Origin Building Program · Explore the possibility of adopting electronic certificates related to customs procedures
Connectivity · Provide training in management of security, safety, and emerging technology in intermodal transportation and supply chain systems
Source: APEC (2013) in Patalinghug (2015) Likewise, the Export Development Council – National Competitiveness Council (EDC-NCC) Task Force on Cabotage identified factors that are responsible for high domestic shipping cost. These include the prohibition of the carriage of foreign cargo by foreign vessels within Philippine
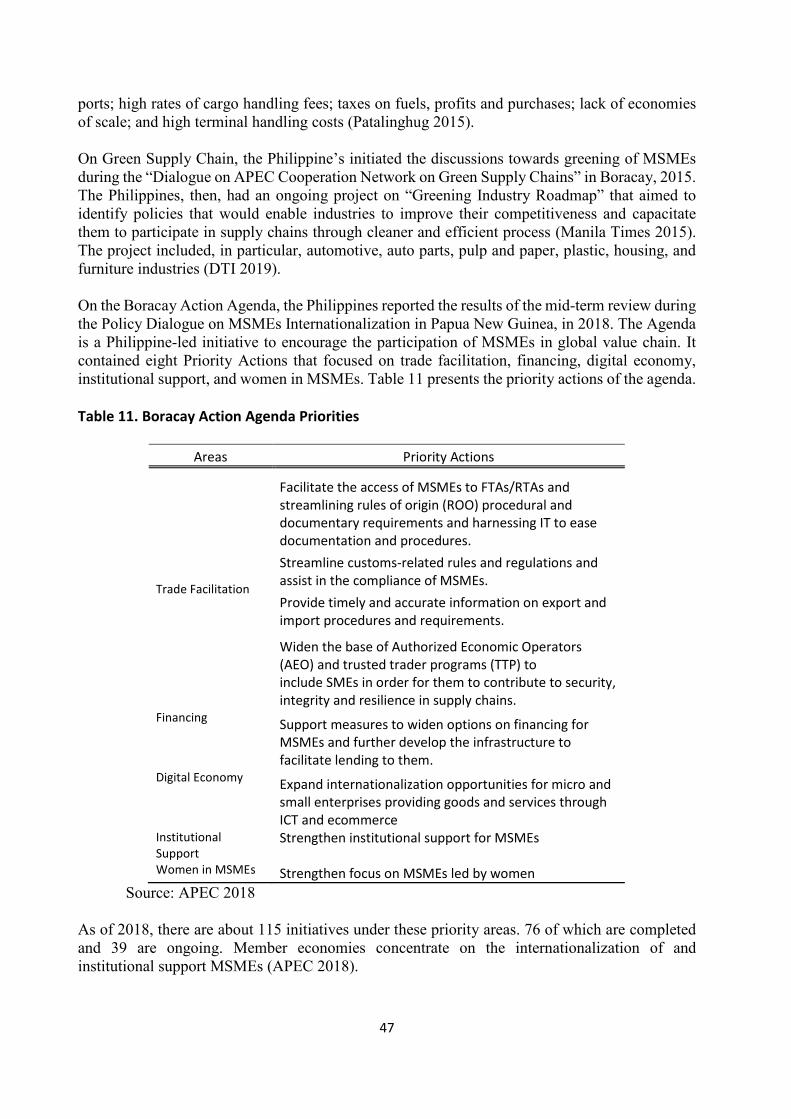
47
ports; high rates of cargo handling fees; taxes on fuels, profits and purchases; lack of economies of scale; and high terminal handling costs (Patalinghug 2015). On Green Supply Chain, the Philippine’s initiated the discussions towards greening of MSMEs during the “Dialogue on APEC Cooperation Network on Green Supply Chains” in Boracay, 2015. The Philippines, then, had an ongoing project on “Greening Industry Roadmap” that aimed to identify policies that would enable industries to improve their competitiveness and capacitate them to participate in supply chains through cleaner and efficient process (Manila Times 2015). The project included, in particular, automotive, auto parts, pulp and paper, plastic, housing, and furniture industries (DTI 2019). On the Boracay Action Agenda, the Philippines reported the results of the mid-term review during the Policy Dialogue on MSMEs Internationalization in Papua New Guinea, in 2018. The Agenda is a Philippine-led initiative to encourage the participation of MSMEs in global value chain. It contained eight Priority Actions that focused on trade facilitation, financing, digital economy, institutional support, and women in MSMEs. Table 11 presents the priority actions of the agenda. Table 11. Boracay Action Agenda Priorities
Areas Priority Actions
Trade Facilitation
Facilitate the access of MSMEs to FTAs/RTAs and streamlining rules of origin (ROO) procedural and documentary requirements and harnessing IT to ease documentation and procedures. Streamline customs-related rules and regulations and assist in the compliance of MSMEs. Provide timely and accurate information on export and import procedures and requirements.
Widen the base of Authorized Economic Operators (AEO) and trusted trader programs (TTP) to include SMEs in order for them to contribute to security, integrity and resilience in supply chains.
Financing Support measures to widen options on financing for MSMEs and further develop the infrastructure to facilitate lending to them.
Digital Economy Expand internationalization opportunities for micro and small enterprises providing goods and services through ICT and ecommerce
Institutional Support
Strengthen institutional support for MSMEs
Women in MSMEs Strengthen focus on MSMEs led by women Source: APEC 2018
As of 2018, there are about 115 initiatives under these priority areas. 76 of which are completed and 39 are ongoing. Member economies concentrate on the internationalization of and institutional support MSMEs (APEC 2018).

48
On the implementation of the Connectivity Blueprint, the Philippines is one of Australia, Canada, and Korea’s partner in boosting the private sector participation and investment infrastructure. It is also one of Australia’s recipients in undertaking a self-funded project to develop a specifically tailored framework to develop well-prepared and bankable PPP transport infrastructure projects (APEC 2014). The Philippines, together with other ASEAN members, has also agreed to develop the ASEAN Single Aviation Market, ratifying and implementing the (a) Multilateral Agreement on the Full Liberalization of Air Freight Services to improve trade connections and (b) Multilateral Agreement on the Full Liberalization of Passenger Air Services to improve the people-to-people connectivity. The Advance Passenger Information System was also done to facilitate the arrival of “trusted” travelers. Considerable work has been done on submarine cables and the development of the BIMP-EAGA Submarine Terrestrial Cable System Project, that would link Brunei Darussalam, Malaysia, the Philippines, and Indonesia (APEC 2014). 3.3. Customs Procedures Since the 2005 IAP review, the Philippines has intensified the simplification and harmonization of customs procedures to facilitate international trade and increase transparency. The Philippines has also participated in the ASEAN Single Window Agreement and initiated a National Single Window (Barrett and Lim 2009). The Philippine National Single Window (NSW) is a computerized internet-based system that allows trade parties to lodge information and documents with a single entry point to comply to regulatory requirements (PNRI 2011). In 2017, the National Single Window Steering Committee, chaired by the secretary of the Department of Finance (DOF), agreed to adopt a government-built platform, “TradeNet.gov.ph”, to serve as the vehicle for NSW, aimed to facilitate trade, heighten transparency in customs procedures, and improve the revenue collection. TradeNet is expected to shorten the processing time, reduce the number of transactions and documents, and remove bureaucratic red tape. It would also connect 66 agencies and 10 economic zones in the country (PortCalls Asia 2017). In 2017, the Philippine Bureau of Customs (BOC) reported significant achievements in five key areas, including anti-corruption drive, revenue collection, trade facilitation, border protection, and enhanced personnel incentives and reward system. On reducing time and cost of trade facilitation, the process of stakeholder accreditation was simplified from 11 steps to 6 steps and from at least 15 days processing to only 5 days. Queuing system was also implemented and additional pre-evaluation windows were set up to reduce clogging of applicants (BOC 2017). On border protection, the BOC also intensified its efforts against smuggling, which resulted to seizure of illegal goods, including counterfeit products, vehicles, illegal drugs, and agricultural products, totaling to P14.198 billion. The monitoring systems were enhanced by installing 19 x-ray machines in two of the country’s international airports in Manila and in Davao/ The BOC also received 20 units of radiation detectors from the US embassy to be used for the detection of nuclear materials and weapons.
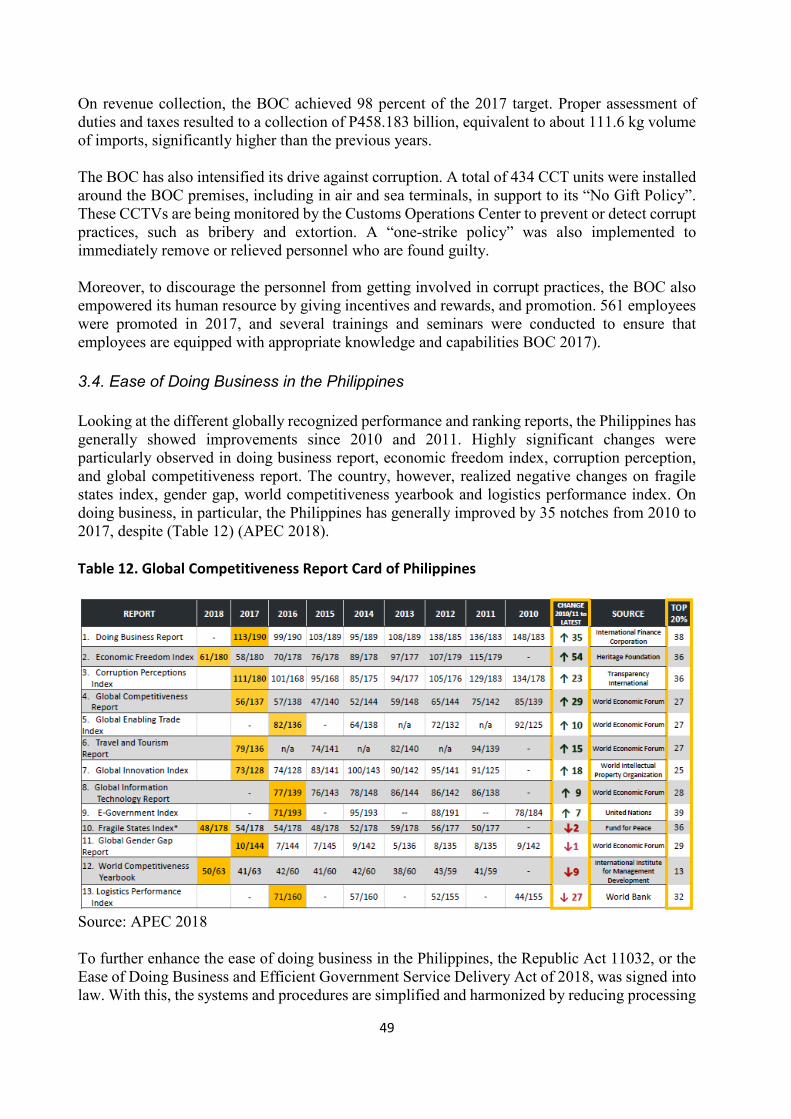
49
On revenue collection, the BOC achieved 98 percent of the 2017 target. Proper assessment of duties and taxes resulted to a collection of P458.183 billion, equivalent to about 111.6 kg volume of imports, significantly higher than the previous years. The BOC has also intensified its drive against corruption. A total of 434 CCT units were installed around the BOC premises, including in air and sea terminals, in support to its “No Gift Policy”. These CCTVs are being monitored by the Customs Operations Center to prevent or detect corrupt practices, such as bribery and extortion. A “one-strike policy” was also implemented to immediately remove or relieved personnel who are found guilty. Moreover, to discourage the personnel from getting involved in corrupt practices, the BOC also empowered its human resource by giving incentives and rewards, and promotion. 561 employees were promoted in 2017, and several trainings and seminars were conducted to ensure that employees are equipped with appropriate knowledge and capabilities BOC 2017). 3.4. Ease of Doing Business in the Philippines Looking at the different globally recognized performance and ranking reports, the Philippines has generally showed improvements since 2010 and 2011. Highly significant changes were particularly observed in doing business report, economic freedom index, corruption perception, and global competitiveness report. The country, however, realized negative changes on fragile states index, gender gap, world competitiveness yearbook and logistics performance index. On doing business, in particular, the Philippines has generally improved by 35 notches from 2010 to 2017, despite (Table 12) (APEC 2018). Table 12. Global Competitiveness Report Card of Philippines
Source: APEC 2018 To further enhance the ease of doing business in the Philippines, the Republic Act 11032, or the Ease of Doing Business and Efficient Government Service Delivery Act of 2018, was signed into law. With this, the systems and procedures are simplified and harmonized by reducing processing
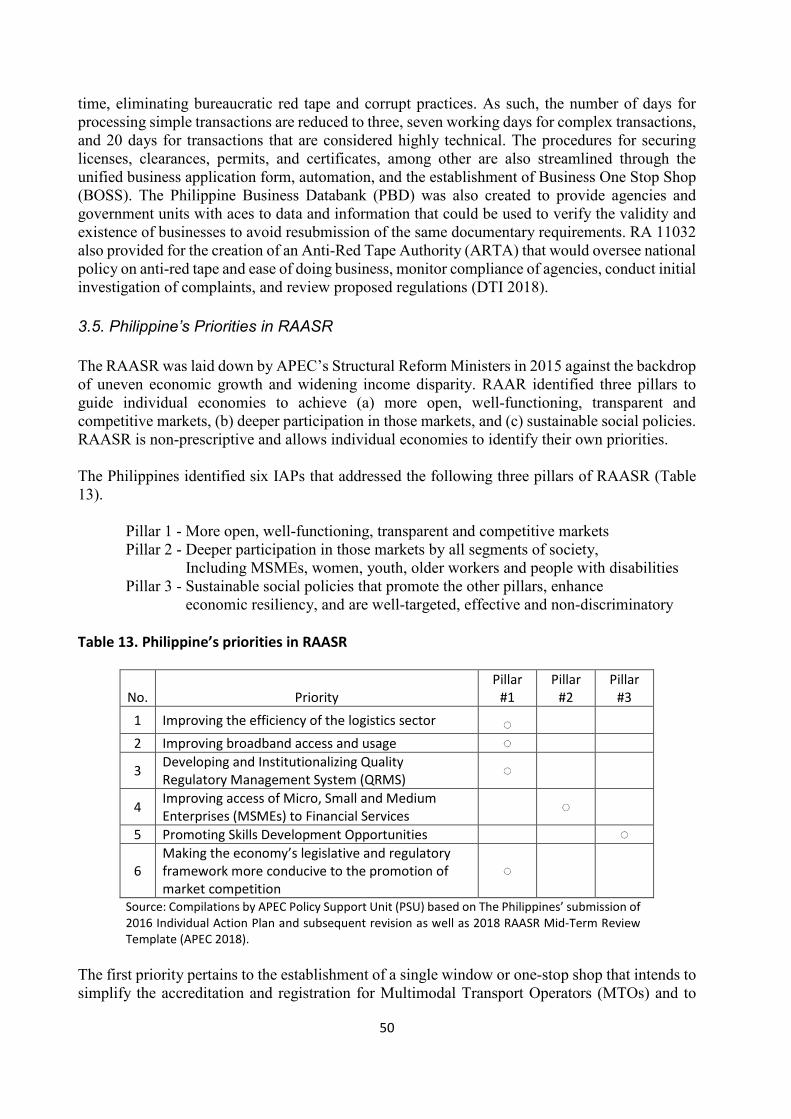
50
time, eliminating bureaucratic red tape and corrupt practices. As such, the number of days for processing simple transactions are reduced to three, seven working days for complex transactions, and 20 days for transactions that are considered highly technical. The procedures for securing licenses, clearances, permits, and certificates, among other are also streamlined through the unified business application form, automation, and the establishment of Business One Stop Shop (BOSS). The Philippine Business Databank (PBD) was also created to provide agencies and government units with aces to data and information that could be used to verify the validity and existence of businesses to avoid resubmission of the same documentary requirements. RA 11032 also provided for the creation of an Anti-Red Tape Authority (ARTA) that would oversee national policy on anti-red tape and ease of doing business, monitor compliance of agencies, conduct initial investigation of complaints, and review proposed regulations (DTI 2018). 3.5. Philippine’s Priorities in RAASR The RAASR was laid down by APEC’s Structural Reform Ministers in 2015 against the backdrop of uneven economic growth and widening income disparity. RAAR identified three pillars to guide individual economies to achieve (a) more open, well-functioning, transparent and competitive markets, (b) deeper participation in those markets, and (c) sustainable social policies. RAASR is non-prescriptive and allows individual economies to identify their own priorities. The Philippines identified six IAPs that addressed the following three pillars of RAASR (Table 13). Pillar 1 - More open, well-functioning, transparent and competitive markets Pillar 2 - Deeper participation in those markets by all segments of society,
Including MSMEs, women, youth, older workers and people with disabilities Pillar 3 - Sustainable social policies that promote the other pillars, enhance
economic resiliency, and are well-targeted, effective and non-discriminatory
Table 13. Philippine’s priorities in RAASR
No. Priority Pillar
#1 Pillar
#2 Pillar
#3 1 Improving the efficiency of the logistics sector ◌ 2 Improving broadband access and usage ◌
3 Developing and Institutionalizing Quality Regulatory Management System (QRMS) ◌
4 Improving access of Micro, Small and Medium Enterprises (MSMEs) to Financial Services ◌
5 Promoting Skills Development Opportunities ◌
6 Making the economy’s legislative and regulatory framework more conducive to the promotion of market competition
◌
Source: Compilations by APEC Policy Support Unit (PSU) based on The Philippines’ submission of 2016 Individual Action Plan and subsequent revision as well as 2018 RAASR Mid-Term Review Template (APEC 2018).
The first priority pertains to the establishment of a single window or one-stop shop that intends to simplify the accreditation and registration for Multimodal Transport Operators (MTOs) and to

51
reduce transaction costs. This initiative involved the Department of Transportation (DOTr), and other agencies related to logistics sector, such as the Bureau of Customs, Civil Aviation Authority of the Philippines, Land Transportation Office, Office of the Transport security, Philippine Cost Guard, and the Philippine Ports Authority. The second priority, to improve broadband services, is undertaken through the National Broadband Plan (NBP), which is composed of (a) investment in broadband infrastructure, (b) policy and regulatory reforms, and (c) stimulating the demand for broadband. With this, several projects were launched to improve internet access, such as the provision of free Wi-Fi access in public places and the creation of National Government Portal, which serves as a single window for all public services. For the third priority, the Philippines introduced the Modernizing Government Regulation (MGR) Program to improve the regulation formulation process of government agencies. MGR is collaborated by the National Economic Development Authority (NEDA) and the Development Academy of the Philippines (DAP). It is intended to integrate overlapping initiatives, develop a quality regulatory management system (QRMS), and incorporate new tools such as the Regulatory Impact Assessment (RIA). This is even intensified through the Expanded Anti Red Tape Act (EARTA) and the implementation of Project Repeal that reviews regulations that are no longer relevant or require amendments. On improving access of MSMEs to financial services, financial institutions were capacitated to assess credit risk and make more informed decisions by creating a sustainable credit information system. This will facilitate faster financial services to borrowers and increase the credit flow to MSMEs. Related to the promotion of skills and development opportunities, the Technical Education and Skill Development Authority (TESDA) is in the process of drafting the National Technical Education and Skills Development Plan (NTESDP) 2017-2022. This will ensure that Technical Vocation Education and Training (TVET) will meet the global challenges and demand. Finally, in providing a more conducive legislative and regulatory framework for market completion, the Philippine Competition Commission (PCC) drafted a framework for amending, repealing, and consolidating anti-competitive legislations and regulations (APEC 2018f). 3.6. Philippine Progress in Bogor Goals With regard to the Bogor Goals, the Philippines have achieved varying results (Table 14). Table 14. Philippine’s priorities in RAASR (as of November 2018)
2008 2009 2010 2011 2012 2013 2014 2015 2016 2017 Goods Trade
1 MFN Applied Tariff (HS 6-digit level simple average) 6.3 6.3 6.3 6.1 6.2 6.3 6.3 6.3 6.3 6.3
2 MFN Applied Tariff - Agriculture (HS 6-digit level simple average) 9.7 9.8 9.8 8.7 9.8 9.9 9.9 9.9 9.8 9.9
3 MFN Applied Tariff - Non-Agriculture (HS 6-digit level simple average) 5.7 5.8 5.7 5.7 5.7 5.7 5.7 5.7 5.7 5.7
4 Zero - Tariff Product Lines (%) 2.3 2.3 2.4 3.2 3.4 3.4 3.4 3.4 3.4 3.4 5 Zero - Tariff Imports (%) 19.6 31.2 30.7 39 44.9 41.9 40.4 37.7
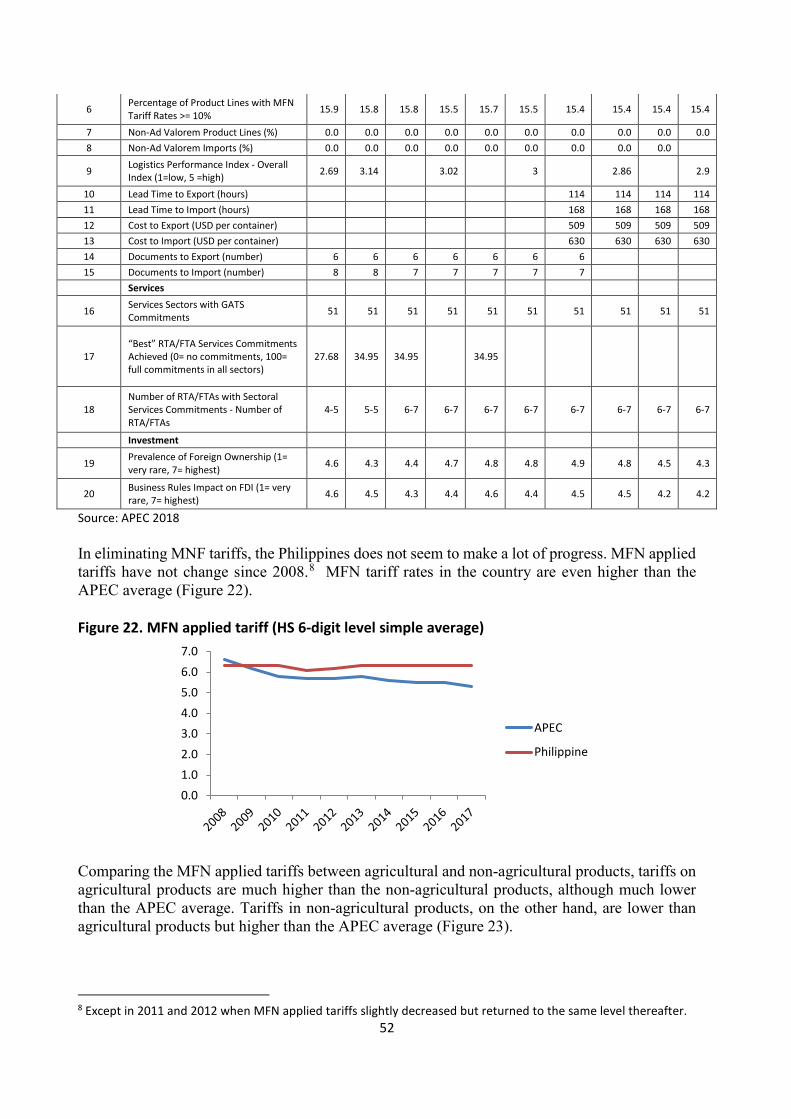
52
6 Percentage of Product Lines with MFN Tariff Rates >= 10% 15.9 15.8 15.8 15.5 15.7 15.5 15.4 15.4 15.4 15.4
7 Non-Ad Valorem Product Lines (%) 0.0 0.0 0.0 0.0 0.0 0.0 0.0 0.0 0.0 0.0 8 Non-Ad Valorem Imports (%) 0.0 0.0 0.0 0.0 0.0 0.0 0.0 0.0 0.0
9 Logistics Performance Index - Overall Index (1=low, 5 =high) 2.69 3.14 3.02 3 2.86 2.9
10 Lead Time to Export (hours) 114 114 114 114 11 Lead Time to Import (hours) 168 168 168 168 12 Cost to Export (USD per container) 509 509 509 509 13 Cost to Import (USD per container) 630 630 630 630 14 Documents to Export (number) 6 6 6 6 6 6 6 15 Documents to Import (number) 8 8 7 7 7 7 7 Services
16 Services Sectors with GATS Commitments 51 51 51 51 51 51 51 51 51 51
17 “Best” RTA/FTA Services Commitments Achieved (0= no commitments, 100= full commitments in all sectors)
27.68 34.95 34.95 34.95
18 Number of RTA/FTAs with Sectoral Services Commitments - Number of RTA/FTAs
4-5 5-5 6-7 6-7 6-7 6-7 6-7 6-7 6-7 6-7
Investment
19 Prevalence of Foreign Ownership (1= very rare, 7= highest) 4.6 4.3 4.4 4.7 4.8 4.8 4.9 4.8 4.5 4.3
20 Business Rules Impact on FDI (1= very rare, 7= highest) 4.6 4.5 4.3 4.4 4.6 4.4 4.5 4.5 4.2 4.2
Source: APEC 2018 In eliminating MNF tariffs, the Philippines does not seem to make a lot of progress. MFN applied tariffs have not change since 2008.8 MFN tariff rates in the country are even higher than the APEC average (Figure 22). Figure 22. MFN applied tariff (HS 6-digit level simple average)
Comparing the MFN applied tariffs between agricultural and non-agricultural products, tariffs on agricultural products are much higher than the non-agricultural products, although much lower than the APEC average. Tariffs in non-agricultural products, on the other hand, are lower than agricultural products but higher than the APEC average (Figure 23).
8 Except in 2011 and 2012 when MFN applied tariffs slightly decreased but returned to the same level thereafter.
0.01.02.03.04.05.06.07.0
APEC
Philippine
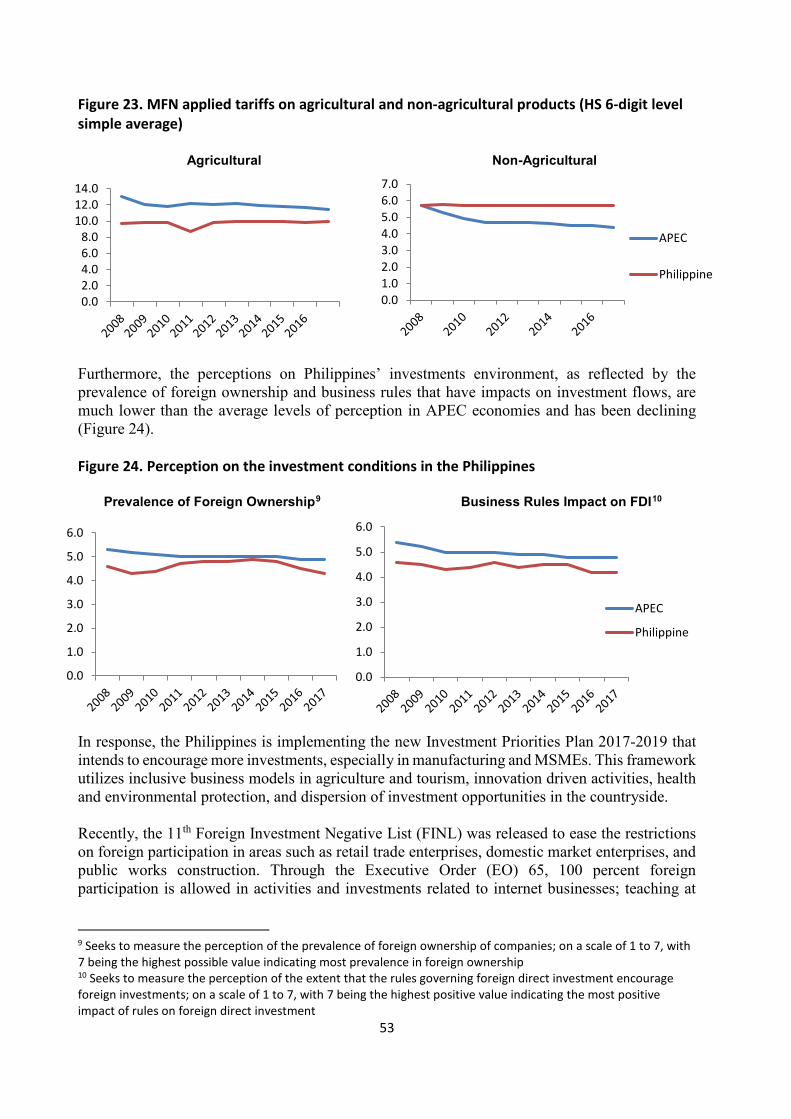
53
Figure 23. MFN applied tariffs on agricultural and non-agricultural products (HS 6-digit level simple average)
Agricultural Non-Agricultural
Furthermore, the perceptions on Philippines’ investments environment, as reflected by the prevalence of foreign ownership and business rules that have impacts on investment flows, are much lower than the average levels of perception in APEC economies and has been declining (Figure 24). Figure 24. Perception on the investment conditions in the Philippines
Prevalence of Foreign Ownership9 Business Rules Impact on FDI10
In response, the Philippines is implementing the new Investment Priorities Plan 2017-2019 that intends to encourage more investments, especially in manufacturing and MSMEs. This framework utilizes inclusive business models in agriculture and tourism, innovation driven activities, health and environmental protection, and dispersion of investment opportunities in the countryside. Recently, the 11th Foreign Investment Negative List (FINL) was released to ease the restrictions on foreign participation in areas such as retail trade enterprises, domestic market enterprises, and public works construction. Through the Executive Order (EO) 65, 100 percent foreign participation is allowed in activities and investments related to internet businesses; teaching at
9 Seeks to measure the perception of the prevalence of foreign ownership of companies; on a scale of 1 to 7, with 7 being the highest possible value indicating most prevalence in foreign ownership 10 Seeks to measure the perception of the extent that the rules governing foreign direct investment encourage foreign investments; on a scale of 1 to 7, with 7 being the highest positive value indicating the most positive impact of rules on foreign direct investment
0.02.04.06.08.0
10.012.014.0
0.01.02.03.04.05.06.07.0
APEC
Philippine
0.0
1.0
2.0
3.0
4.0
5.0
6.0
0.0
1.0
2.0
3.0
4.0
5.0
6.0
APEC
Philippine
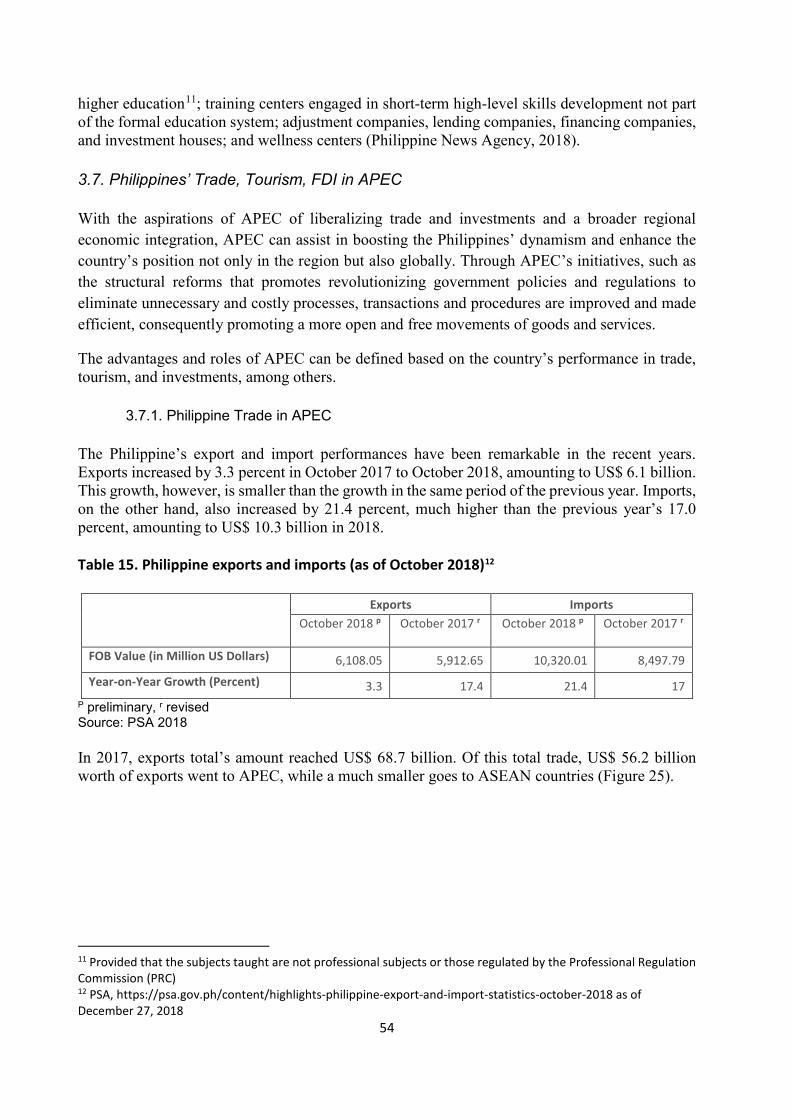
54
higher education11; training centers engaged in short-term high-level skills development not part of the formal education system; adjustment companies, lending companies, financing companies, and investment houses; and wellness centers (Philippine News Agency, 2018). 3.7. Philippines’ Trade, Tourism, FDI in APEC With the aspirations of APEC of liberalizing trade and investments and a broader regional economic integration, APEC can assist in boosting the Philippines’ dynamism and enhance the country’s position not only in the region but also globally. Through APEC’s initiatives, such as the structural reforms that promotes revolutionizing government policies and regulations to eliminate unnecessary and costly processes, transactions and procedures are improved and made efficient, consequently promoting a more open and free movements of goods and services.
The advantages and roles of APEC can be defined based on the country’s performance in trade, tourism, and investments, among others.
3.7.1. Philippine Trade in APEC The Philippine’s export and import performances have been remarkable in the recent years. Exports increased by 3.3 percent in October 2017 to October 2018, amounting to US$ 6.1 billion. This growth, however, is smaller than the growth in the same period of the previous year. Imports, on the other hand, also increased by 21.4 percent, much higher than the previous year’s 17.0 percent, amounting to US$ 10.3 billion in 2018. Table 15. Philippine exports and imports (as of October 2018)12
Exports Imports October 2018 p October 2017 r October 2018 p October 2017 r
FOB Value (in Million US Dollars) 6,108.05 5,912.65 10,320.01 8,497.79
Year-on-Year Growth (Percent) 3.3 17.4 21.4 17 P preliminary, r revised Source: PSA 2018 In 2017, exports total’s amount reached US$ 68.7 billion. Of this total trade, US$ 56.2 billion worth of exports went to APEC, while a much smaller goes to ASEAN countries (Figure 25). 11 Provided that the subjects taught are not professional subjects or those regulated by the Professional Regulation Commission (PRC) 12 PSA, https://psa.gov.ph/content/highlights-philippine-export-and-import-statistics-october-2018 as of December 27, 2018

55
Figure 25. Philippine exports (in US$ million)13
Subsequently, imports totaled to US$ 103.4 billion in 2017. APEC economies acquired US$ 101.9 billion of this trade, while the total value of imports that went to ASEAN was only about US$ 26.3 billion. Figure 26. Philippine imports (in US$ million)14
3.7.2. Philippine Tourism in APEC International tourist arrivals reached 5.4 million as of 2018. This is much lower compared to last year’s 6.6 million. About 4.4 million of the visitors came from APEC economies, while visitors from ASEAN countries was only about 0.4 million (Figure 27). 13 Data retrieved from Comtrade 14 Data retrieved from Comtrade
56,190
10,068 -
68,713
- 10,000 20,000 30,000 40,000 50,000 60,000 70,000 80,000
1995 2001 2007 2013 2017
APEC
ASEAN7
WORLD
103,426
26,335
101,889
-
20,000
40,000
60,000
80,000
100,000
120,000
1995 2001 2007 2013 2017
APEC
ASEAN7
WORLD
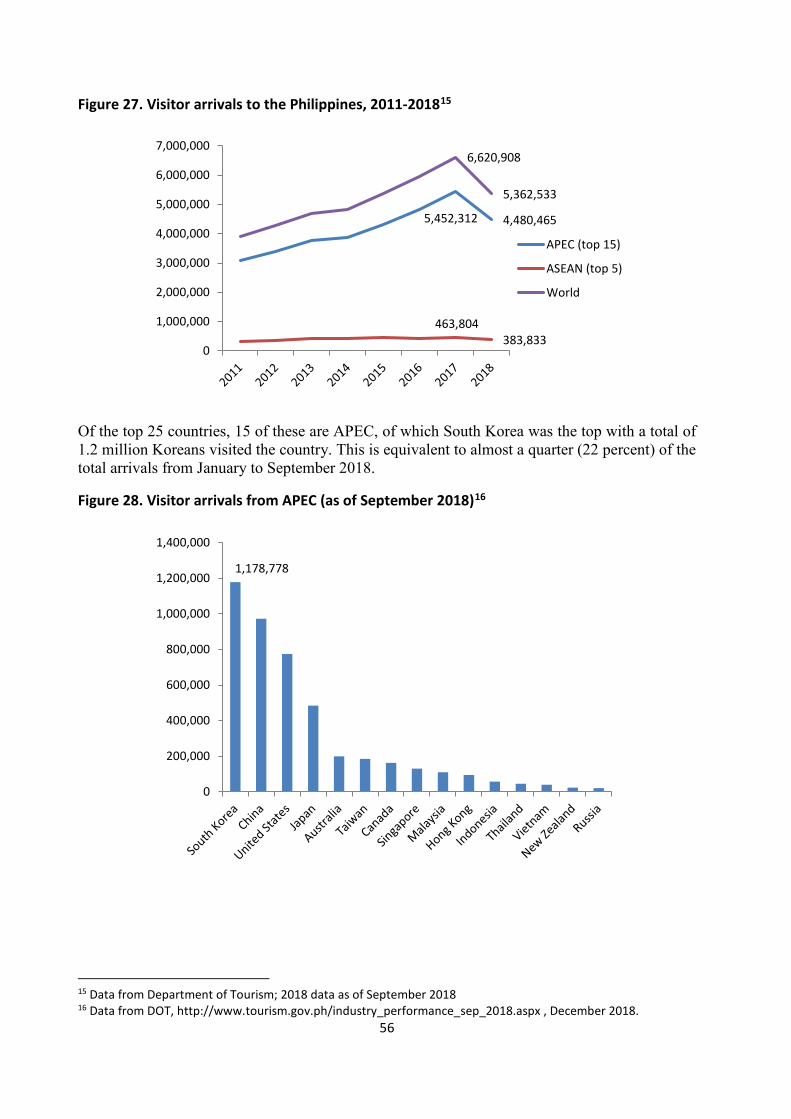
56
Figure 27. Visitor arrivals to the Philippines, 2011-201815
Of the top 25 countries, 15 of these are APEC, of which South Korea was the top with a total of 1.2 million Koreans visited the country. This is equivalent to almost a quarter (22 percent) of the total arrivals from January to September 2018.
Figure 28. Visitor arrivals from APEC (as of September 2018)16
15 Data from Department of Tourism; 2018 data as of September 2018 16 Data from DOT, http://www.tourism.gov.ph/industry_performance_sep_2018.aspx , December 2018.
5,452,312 4,480,465
463,804383,833
6,620,908
5,362,533
0
1,000,000
2,000,000
3,000,000
4,000,000
5,000,000
6,000,000
7,000,000
APEC (top 15)
ASEAN (top 5)
World
1,178,778
0
200,000
400,000
600,000
800,000
1,000,000
1,200,000
1,400,000
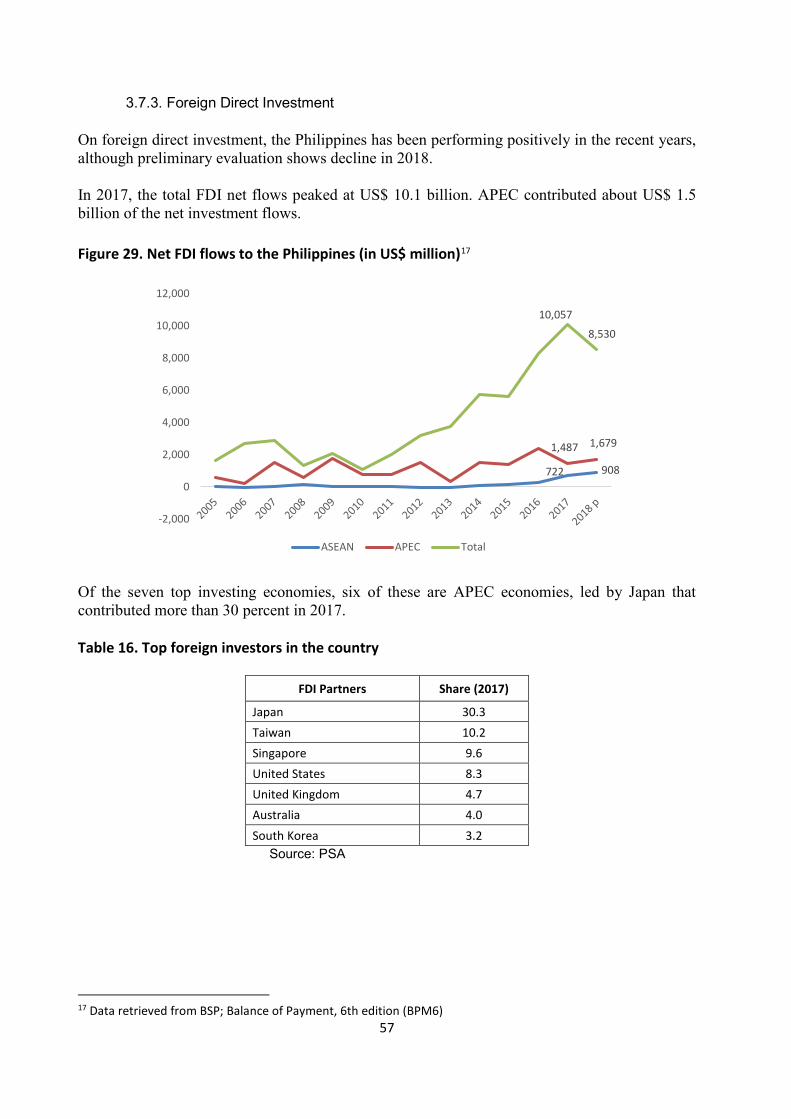
57
3.7.3. Foreign Direct Investment On foreign direct investment, the Philippines has been performing positively in the recent years, although preliminary evaluation shows decline in 2018. In 2017, the total FDI net flows peaked at US$ 10.1 billion. APEC contributed about US$ 1.5 billion of the net investment flows. Figure 29. Net FDI flows to the Philippines (in US$ million)17
Of the seven top investing economies, six of these are APEC economies, led by Japan that contributed more than 30 percent in 2017. Table 16. Top foreign investors in the country
FDI Partners Share (2017)
Japan 30.3 Taiwan 10.2 Singapore 9.6 United States 8.3 United Kingdom 4.7 Australia 4.0 South Korea 3.2
Source: PSA
17 Data retrieved from BSP; Balance of Payment, 6th edition (BPM6)
722 908
1,487 1,679
10,057
8,530
-2,000
0
2,000
4,000
6,000
8,000
10,000
12,000
ASEAN APEC Total
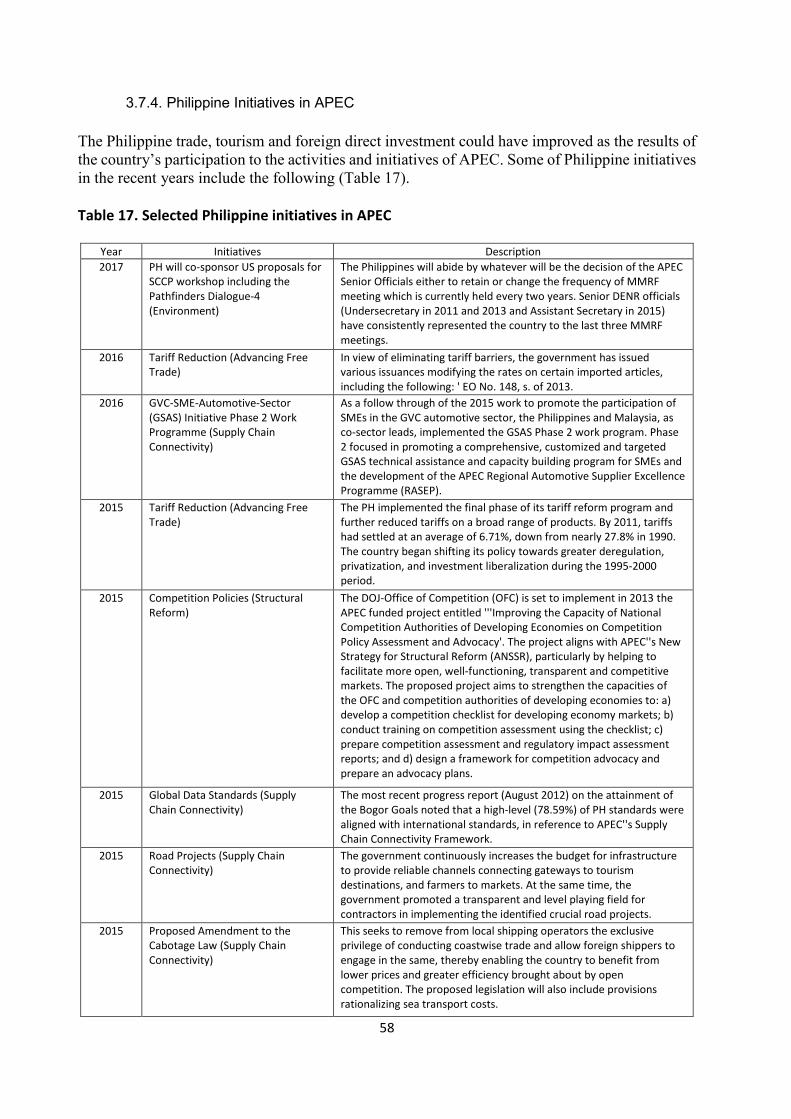
58
3.7.4. Philippine Initiatives in APEC The Philippine trade, tourism and foreign direct investment could have improved as the results of the country’s participation to the activities and initiatives of APEC. Some of Philippine initiatives in the recent years include the following (Table 17). Table 17. Selected Philippine initiatives in APEC
Year Initiatives Description 2017 PH will co-sponsor US proposals for
SCCP workshop including the Pathfinders Dialogue-4 (Environment)
The Philippines will abide by whatever will be the decision of the APEC Senior Officials either to retain or change the frequency of MMRF meeting which is currently held every two years. Senior DENR officials (Undersecretary in 2011 and 2013 and Assistant Secretary in 2015) have consistently represented the country to the last three MMRF meetings.
2016 Tariff Reduction (Advancing Free Trade)
In view of eliminating tariff barriers, the government has issued various issuances modifying the rates on certain imported articles, including the following: ' EO No. 148, s. of 2013.
2016 GVC-SME-Automotive-Sector (GSAS) Initiative Phase 2 Work Programme (Supply Chain Connectivity)
As a follow through of the 2015 work to promote the participation of SMEs in the GVC automotive sector, the Philippines and Malaysia, as co-sector leads, implemented the GSAS Phase 2 work program. Phase 2 focused in promoting a comprehensive, customized and targeted GSAS technical assistance and capacity building program for SMEs and the development of the APEC Regional Automotive Supplier Excellence Programme (RASEP).
2015 Tariff Reduction (Advancing Free Trade)
The PH implemented the final phase of its tariff reform program and further reduced tariffs on a broad range of products. By 2011, tariffs had settled at an average of 6.71%, down from nearly 27.8% in 1990. The country began shifting its policy towards greater deregulation, privatization, and investment liberalization during the 1995-2000 period.
2015 Competition Policies (Structural Reform)
The DOJ-Office of Competition (OFC) is set to implement in 2013 the APEC funded project entitled '''Improving the Capacity of National Competition Authorities of Developing Economies on Competition Policy Assessment and Advocacy'. The project aligns with APEC''s New Strategy for Structural Reform (ANSSR), particularly by helping to facilitate more open, well-functioning, transparent and competitive markets. The proposed project aims to strengthen the capacities of the OFC and competition authorities of developing economies to: a) develop a competition checklist for developing economy markets; b) conduct training on competition assessment using the checklist; c) prepare competition assessment and regulatory impact assessment reports; and d) design a framework for competition advocacy and prepare an advocacy plans.
2015 Global Data Standards (Supply Chain Connectivity)
The most recent progress report (August 2012) on the attainment of the Bogor Goals noted that a high-level (78.59%) of PH standards were aligned with international standards, in reference to APEC''s Supply Chain Connectivity Framework.
2015 Road Projects (Supply Chain Connectivity)
The government continuously increases the budget for infrastructure to provide reliable channels connecting gateways to tourism destinations, and farmers to markets. At the same time, the government promoted a transparent and level playing field for contractors in implementing the identified crucial road projects.
2015 Proposed Amendment to the Cabotage Law (Supply Chain Connectivity)
This seeks to remove from local shipping operators the exclusive privilege of conducting coastwise trade and allow foreign shippers to engage in the same, thereby enabling the country to benefit from lower prices and greater efficiency brought about by open competition. The proposed legislation will also include provisions rationalizing sea transport costs.

59
2015 Project NOAH (Disaster Risk Reduction)
Project NOAH Implementation of Rainfall Warning System in Metro Manila, Cebu, Negros, Bohol, CDO, Iligan, Legazpi, Albay, Misamis Oriental and Occidental, Bulacan, Pampanga, Subic, Clark and Tarlac. Established a total of sixty-nine (69) seismic stations and sixteen (16) intensity meters. Established tsunamin monitoring and warning systems for Lingayen Gulf and a Tsunami Scenario Database Provided 8,500 geohazard maps and advisories to LGUs indentified as prone to geohazards (with detailed mapping of at least 500 cities/municipalities).
2015 Philippine Government Electronic Procurement System (PhilGEPS)
All agencies are mandated to post their bid opportunities, notices, awards, and contracts in the PhilGEPS website. This has resulted in improved transparency in government procurement, enhanced competition and realization of value for money procurement, and reduced procurement costs, including newspaper advertisements.
2014 Regulatory Impact Assessment (RIA) (Structural Reform)
PH is developing competencies on RIA under a technical assistance grant from ADB. The RIA system targets the development of regulations in accordance with best practice principles. It is also characterized by: (1) more transparency, rigor, accountability, and consistency in the development and application of regulations; and (2) a focus on minimizing unnecessary and excessive regulation that diverts time and money away from more productive pursuits. It is being piloted in DOLE and DOT from 2012 to 2015. DOT assists LGUs in applying the RIA system on local ordinances that affect tourism, while DOLE applies it to the Modernizing Labor Regulations Project. At the end of the pilot, DOLE and DOT shall make recommendations on the government-wide implementation of the RIA system. The NEDA created a new office, the NEDA Governance Staff (NEDA-GS), to capacitate and mentor line agencies conducting their own RIAs. Full operation is expected to commence the by beginning of 2014.
2014 Business Permits and Licensing System (BPLS) (Travel Facilitation)
The program simplified permits and licenses at the local government level, making 421 out of 480 (87.7%) target LGUs business-friendly, while curbing opportunities for corruption. The Client Satisfaction Survey conducted by the National Competitiveness Council found that 529 (63%) of 838 respondents from 15 regions were satisfied with the streamlined BPLS. Philippine Business Registry (PBR). A web-based system that integrates the business registration processes of DTI, BIR, SSS, PhilHealth, and Pag-IBIG Fund, reducing processing time to 30 minutes from 4 to 5 days. Enhanced Business Name Registration System. Reduced information fields of paper application forms from 36 to 17, and the electronic application form from 9 pages to 1 page. The approval time for applications has also been reduced from 4 to 8 hours to less than 15 minutes. As a result, the number of business names registered increased from 278,802 in 2010 to 315,986 in 2011, the highest since 2004.
2013 Transparency Seal (Structural Reform)
To comply with the Transparency Seal requirement of the GAA, websites of 22 line departments, 35 executive offices now feature information about their respective budgets, bids, public offerings and project implementation status for public access and scrutiny. Access to Information. Online access to information also include the Budget ng Bayan and eTAILS Project and the Full Disclosure Policy for LGUs (also in print media).
2013 Fish Cage for Livelihood Program (Environment)
The Department of Agriculture is also implementing the Fish Cage for Livelihood Program to encourage fisherfolk to shift from fish hunting to the more productive fish farming.
2013 Fish Port Projects (Food Security) Twenty-one (21) fish port projects are up for development in 2014. Further, BFAR is in the process of purchasing a 20-footer container type mobile blast freezer and refrigeration equipment for Bataraza fish port project in Palawan.

60
2012 Tax Incentives for CSR (ICT) CSR in the Philippines. Large corporations have provided financing to smaller enterprises as part of their corporate social responsibility (CSR). The government''s tax code provides for CSR-related incentives to corporations such as: limited or full deductibility of contributions or gifts for income tax purposes, exemption from estate tax, and exemption from the donor''s tax.
2012 Agro-Industry Modernization Credit and Financing Program (Food Security)
In 2012, P1.12 billion was released under the Agro-Industry Modernization Credit and Financing Program (AMCFP), a 127 percent increase from the P495.4 million released in 2011. From 2010 to April 2013, a total of P2.56 billion was released to 100,648 farmers and fisherfolk.
2012 Cold-Chain Systems (Food Security) The government is targeting the establishment and operationalization of cold chain systems for fruits, vegetables, and hogs along the Benguet-Manila route. The project will be implemented by the Department of Agriculture under the PPP scheme.
Source: APEC Policy Tools
4. Conclusions and Recommendations This paper revisits the formation of APEC that can be traced back from the long desired new and unique brand of regionalism in Asia Pacific; a desire that emerged even decades before the formal establishment of APEC out of a sheer sense of lack of a multilateral system that suits the character of Asia Pacific community. For decades, APEC has strived to attain the reputation it is currently gaining. Striving to achieve open and free trade and investment and eventual economic integration, APEC is becoming more and more of greater importance in the region. Having the most distinguished economies and players in the region, APEC has the capacity to balance the geopolitics in the region. The interdependence that developed in the region led to a formal mutual agreement from which APEC operates the new approach to regional economic integration that remains conforming to the multilateral framework. Trade liberalization and facilitation in APEC could be unequivocally considered a successful undertaking that contributed to the reduction of trade costs and efficient movements of goods and services. However, despite what APEC has achieved, it remains insufficiently effective in many areas. In the Philippines alone, more efforts are required to significantly make progress in meeting its commitments in Bogor Goals. Nonetheless, APEC’s incremental achievement can be realized through strengthening negotiations, and enacting more effective guidance on trade and investments. The weaknesses of APEC can be linked to its non-institutionalization that results to APEC being misunderstood. When turned into a fully dedicated organization, APEC’s institutional capacity can be buttressed, increasing its potential to meeting its greater goal and lifting the world economy. Moreover, APEC works on the basis of non-binding and voluntary approach, a provision to economies in implementing, e.g. structural reforms, which may have surfaced out of its informality and lack of concrete legal foundation, disregarding any possible sanction or incentives in realizing the goals and commitments in APEC. The non-institutionalization character of APEC promoted a rather divided Asia-Pacific region, especially during the Asian financial crisis, which prompted the collapse of the Early Voluntary Sectoral Liberalization (EVSL). It is, therefore, urged that APEC may undergo institution-building to strengthen its structure and function. It is, however, arguable that APEC’s non-institutionalization suggests
61
some degree of flexibility that promotes regional integration. With diverse and highly dynamic economies, APEC requires a flexible liberalization and facilitation process to stabilize its deepening markets. APEC also accounts the different levels of development of its members, thus it upholds the principles of voluntarism and consensus-building, working together towards a common goal. Nevertheless, APEC has contributed in shaping the business environment of the Philippines, although plenty remains to be done especially in view of the challenges in expanding economic opportunities in industry and services, as cited in the Philippine Development Plan 2017-2022. This includes addressing the issues on logistics bottlenecks, mining, and natural disasters; cost of doing business; and improving the competitiveness of sectors; among others. The country remains to be inadequate with climate-resilient and reliable infrastructure, such as roads, bridges, and railways, as well as airports and seaports, stable power and internet connectivity. Mining, on one hand, remains concentrated on low-value adding activities. Much more, majority of investments and economic activities are concentrated in the national capital region, while some of the rest, such as the Autonomous Region in Muslim Mindanao (ARMM), barely attract investments. All of these contribute to the inhibition of domestic production and trade, thus delaying growth and development of the country. Similarly, the cost of doing business in the country remains high. Regulatory measures, including licensing procedures and permitting requirements, and other policies and laws need to be reviewed or amended. Addressing these domestic issues may help increase the competitiveness of different sectors and increase resilience against global market uncertainties. In consideration of these issues, it is important for the Philippines to (a) utilize trade agreements and trade facilitation, (b) upgrade domestic facilities to meet global standards, and (c) align domestic regulations. Trade facilitation initiatives in APEC include the APEC Business Travel Card, e-commerce best practices, paperless trading, customs-business partnership, among others. Trade agreements and facilitation initiatives may help stimulate and improve the competitiveness of domestic producers and sectors. These address behind-the-border barriers that limit the flow of goods and services, and eventually help expand the coverage of businesses to overseas markets. Additionally, trade agreements may also help firms access cheaper inputs and more advanced technologies and foster competition, which may lead to increase in higher productivity and growth.
5. Bibliography Acharya, A. 2009. Whose Ideas Matter? Agency and Power in Asian Regionalism. Cornell
University Press. Ampiah, K. 1995. Japan at the Bandung Conference: The Cat Goes to the Mice’s Convention.
Japan Forum, Vol. 7, No. 1, April. Asia-Pacific Economic Cooperation (APEC). 1993. 1993 APEC Ministerial Meeting Report.
https://www.apec.org/Meeting-Papers/Annual-Ministerial-Meetings/1993/. ———. 1995. 1995 APEC Ministerial Meeting Report. https://www.apec.org/Meeting-
Papers/Annual-Ministerial-Meetings/1995/.
62
———. 1997. 1997 APEC Ministerial Meeting Report. https://www.apec.org/Meeting-Papers/Annual-Ministerial-Meetings/1995/.
———. 2013. Appendix 4 – Supply-Chain Connectivity Action Plan (2013 update). Twenty-Fifth
APEC Ministerial Meeting, Bali, Indonesia, October 4-5, 2013. ———. 2018. Public Consultation Practices: Philippines Experience. Workshop on Peer Review
on Public Consultation Initiatives, Kuala Lumpur, Malaysia. July 17-18, 2018. 2018/EC/WKSP4/016. Session: 7.
———. 2018. Report to Implement the APEC Connectivity Blueprint. November 2014.
APEC#214-SE-01.15. Retrieved from file:///C:/Users/mbarral/Downloads/Report%20to%20Implement%20ACB5Nov2014Final.pdf.
———. 2018. Results of the Boracay Action Agenda Mid-term Review. Policy Dialogue on
Micro, Small and Medium Enterprises Internationalization Port Moresby, Papua New Guinea, September 10-11, 2018. 2018/SMEWG/DIA/006.
APEC Committee on Trade and Investment (CTI). 1996. 1996 CTI annual report to ministers.
Singapore: APEC Secretariat. ———. 1998. CTI annual report to ministers. Singapore: APEC Secretariat. ———. 1999. Annual report to ministers. Singapore: APEC Secretariat. ———. 2000. Annual report to ministers. Singapore: APEC Secretariat. ———. 2002. Committee on trade and investment: Annual report to ministers. Singapore:
APEC Secretariat. ———. 2014. Establishment of an APEC Cooperation Network on Green Supply Chain. Third
Senior Officials’ Meeting, Beijing, China, August 20-21, 2014. 2014/SOM3/045nx07. Agenda Item: 2.1.
———. 2016. Collective Strategic Study on Issues Related to the Realization of the FTAAP. 28th
APEC Ministerial Meeting, Lima, Peru, November 17-18, 2016. 2016/AMM/008aoo06 Agenda Item: 2.
APEC Secretariat. 1994. 1994 APEC Ministerial Meeting, Jakarta, Indonesia, 11 November 1994.
Retrieved from https://www.apec.org/Meeting-Papers/Annual-Ministerial-Meetings/1994/1994_amm
———. 1995. Selected APEC Documents 1989 – 1994. ———. 1996. 1996 Leaders’ Declaration. Retrieved from https://www.apec.org/Meeting-
Papers/Leaders-Declarations/1996/1996_aelm. ———. 1996. 1996 CTI annual report to ministers. Singapore: APEC Secretariat.

63
———. 2015a. 2015 Leaders’ Declaration. Retrieved from https://www.apec.org/Meeting-Papers/Leaders-Declarations/2015/2015_aelm.
———. 2015b. APEC Finance Ministers Launch Cebu Action Plan. Retrieved from
http://m.apec.org/Press/News-Releases/2015/0911_FM. ———. 2016. APEC’s Ease of Doing Business Interim Assessment 2009-2015. APEC Policy
Support Unit. August 2018. APEC#216-SE-01.10. ———. 2016. Collective Strategic Issues Related to the Realization of the FTAAP. 2016 Annual
Report to Ministers for Committee on Trade and Investment. ———. 2018. APEC’s Bogor Goals Dashboard. APEC Policy Support Unit. APEC#218-SE-
01.19. ———. 2018. APEC’s Bogor Goals Progress Report. APEC Policy Support Unit. APEC#218-
SE-01.18. ———. 2018. APEC Business Advisory Council. Retrieved from
https://www.apec.org/Groups/Other-Groups/APEC-Business-Advisory-Council. ———. 2018. Economic Committee. Retrieved from https://www.apec.org/Groups/Economic-Committee. ———. 2018. APEC Outcomes & Outlook 2017, 2018. Copyright @ 2018 APEC Secretariat,
APEC# 217-SE-05.1, ISSN: 0219-3752. ———. 2018. APEC in Charts 2017. APEC Policy Support Unit and APEC Secretariat.
Copyright © 2017 APEC Secretariat, APEC#217-SE-01.19, ISBN 978-981-11-4392-2. ———. 2018. APEC in Charts 2018. APEC Policy Support Unit and APEC Secretariat.
Copyright © 2018 APEC Secretariat, APEC#218-SE-01.17 ISBN 978-981-11-8893-0. ———. 2018. APEC’s Ease of Doing Business Interim Assessment 2015-2017. APEC Policy
Support Unit. August 2018. APEC#218-SE-01.11. ———. 2018. Milestones. https://www.apec.org/About-Us/About-APEC/History ———. 2018. Paperless System Speeds Up Trade. February 20, 2014. Retrieved from
https://www.apec.org/Press/Features/2014/0220_window.aspx. ———. 2018. Regional Economic Integration Agenda. Retrieved from
https://www.apec.org/About-Us/About-APEC/Fact-Sheets/Regional-Economic-Integration-Agenda.
———. 2018. Renewed APEC Agenda for Structural Reform (RAASR) – Mid-Term Review
Report. APEC Policy Support Unit. August 2018. APEC#218-SE-01.12.
64
———. 2018. Sub-Committee on Customs Procedures. September 2018. Retrieved from https://www.apec.org/Groups/Committee-on-Trade-and-Investment/Sub-Committee-on-Customs-Procedures.
Barrett, C. and H. Lim. 2009. Inividual Action Plan (IAP) Peer Review of the Philippines. Study
Report. Boney, J. 2011. Regional Economic Integration. 2011 APEC Themes Article retrieved through
http://www.uhero.hawaii.edu/assets/RegionalEconomicIntegration.pdf. Bureau of Customs. 2017. Enabling A Secured Cross-Border Trade. Annual Report 2017. Chang, B. 2014. The Sources of Japanese Conduct: Asymmetric Security Dependence, Role
Conceptions and the Reactive Behavior in Response to US Demands. Johns Hopkins University, Doctor of Philosophy Dissertation, Baltimore, Maryland, November 2014.
Chow D.C.K., I. Sheldon, and W. McGuire. 2018. How the United States Withdrawal from the
Trans-Pacific Partnership Benefits China. University of Pennsylvania Journal of Law & Public Affairs, Vol. 4, No. 1. Nov. 2018. 37-80. https://aede.osu.edu/sites/aede/files/publication_files/How%20the%20United%20States%20Withdrawal%20from%20the%20Trans-Pacific%20Partnersh.pdf
Dippelsman, R. J. 1990. APEC: Asia Pacific Economic Co-operation and Australia – Some
Statistical Perspectives. Legislative Research Service, Department of the Parliamentary Library, The Parliament of the Commonwealth of Australia. Retrieved from https://www.aph.gov.au/binaries/library/pubs/bp/1990/90bp15.pdf.
Dowling, M. 1997. Asia’s Economic Miracle: An Historical Perspective. The Australian
Economic Review, vol. 30, no. 1, pp. 113-23. Department of Trade and Industry. 2018. Asia Pacific Economic Cooperation (APEC). Retrieved
through https://www.dti.gov.ph/international-commitments/apec. ———. 2019. Briefer on RA 11032. Retrieved from https://www.dti.gov.ph/businesses/ease-of-
doing-business#ra-11032-ease-of-doing-business-and-efficient-government-service-delivery-act-of-2018.
———. 2019. Greening the Industry Roadmap. Retrieved through
https://www.dti.gov.ph/programs-projects/faps/greening-the-industry-roadmap. Europa Publications Limited (EPL). 2004. Europa World Year Book 2004. Vol. 1. London: EPL,
2004. Fergusson, I. F., M. A. McMinimy, and B. R. Williams. (2016). The Trans-Pacific (TPP): In Brief.
Congressional Research Service 7-5700, R442787. Retrieved through https://fas.org/sgp/crs/row/R44278.pdf.
Go, I. 2008. Regionalism in the Asia-Pacific and U. S. Interests. Nanzan Review of American
Studies, vol. 30 (2008): 167-174.
65
Goh, E. 2013. The Struggle for Order: Hegemony, Hierarchy, & Transition in Post-Cold War East Asia. Oxford University Press 198 Madison Avenue, New York, NY 10016, United States of America.
Hellmann, D. C. 1996. America, APEC, and the Road not Taken: International Leadership in the
Post-Cold War Interregnum in the Asia-Pacific. In America, Japan, and APEC: The Challenge of Leadership in the Asia-Pacific, edited by The National Bureau of Asian Research, APEC Study Center at the University of Washington, ANALYSIS Vol. 6, No. 3, pp. 5-22.
Hirano, A. 1996. Legal Aspects of the Institutionalization of APEC, IDE-APEC Study Center
Working Paper Series 95/96-No. 6, Tokyo: Institute of Developing Economies. Hiroshi, N. 2011. The Gulf war and Japanese Diplomacy. Retrieved from
https://www.nippon.com/en/features/c00202/. History. 2018. Persian Gulf War. Retrieved from https://www.history.com/topics/middle-
east/persian-gulf-war. © 2018 A&E Television Networks, LLC. History. 2018. World Bank and IMF Established. Retrieved from
https://www.historychannel.com.au/this-day-in-history/world-bank-and-imf-are-established/. Foxtel Management Pty Ltd 2018.
Hsieh, P. L. 2017. The RCEP, New Asian Regionalism and the Global South. Institute for
International Law and Justice (IILJ) Working Paper 2017/4 (MegaReg Series) ISSN: 1552-6275.
Janow, M. E. 1997. Assessing APEC’s Role in Economic Integration in the Asia-Pacific Region.
17 Nw. J. Int’l L. & Bus. 947 (1996-1997). Kim, Y.C. (Ed.). 2016. RCEP vs. TPP: The Pursuit of Eastern Dominance. In Chinese Global
Production Networks in ASEA, Understanding China, DOI 10.1007/978-3-319-24232-3_2. Langdon, F. and B. L. Job. 1997. APEC Beyond Economies: The Politics of APEC. The Helen
Kellogg Institute for International Studies. Working Paper #243 – October 1997. Lumumba-Kasongo, T. 2015. Rethinking the Bandung Conference in an Era of ‘unipolar Liberal
Globalization’ and Movements Toward a ‘Multipolar Politics’. Bandung: Journal of the Global South (2015) 2:9. https://core.ac.uk/download/pdf/81541995.pdf
Manila Times. 2015. PH Highlights MSMEs’ Role in Green Supply Chain. News Article, May
21, 2015. Retrieved through http://industry.gov.ph/ph-highlights-msmes-role-in-green-supply-chain/.
Ministry of Foreign Affairs (MOFA) of Japan. 2014. Statement by Foreign Minister Kono. The
Sixth APEC Ministerial Meeting, Jakarta, Indonesia, November 11-12, 1994. Retrieved from https://www.mofa.go.jp/policy/economy/apec/1995/info/statement.html.
NCAPEC. nd. What is APEC and What can it do for Business? Retrieved from
https://www.ncapec.org/docs/what_is_apec.pdf.

66
Ogita, T. 2001. On Principles of APEC. IDE APEC Study Center Working Paper Series 00/91 –
No. 4. Patalinghug, E. E. 2015. Supply Chain Connectivity: Enhancing Participation in the Global
Supply Chain. PIDS Discussion Paper Series No. 2015-14. Philippine Nuclear Research Institue. 2010. Philippine Government National Single Window.
September 30, 2010. Retrieved from http://www.pnri.dost.gov.ph/index.php/20-news-updates/132-philippine-government-national-single-window.
PNA. 2018. PRRD Approves 11th Regular Foreign Investment Negative List. Accessed through
http://www.pna.gov.ph/articles/1052724. Portcalls Asia. 2017. TradeNet is Online Platform for H National Single Window. September 20,
2017. Retrieved from https://www.portcalls.com/tradenet-online-platform-ph-national-single-window/.
Suryanarayanan, O. 2002. Bandung Conference and the Evolution of Non-Alignment.
Department of History, University of Connecticut, Thesis, 2002. Terada, T. 1998. The Origins of Japan’s APEC Policy: Foreign Minister Takeo Miki’s Asia-
Pacific Policy and Current Implications. The Pacific Review, Vol.11 No. 3 1998:337-363. United Nations. 2011. Globally Harmonized System of Classification and Labelling of Chemicals
(GHS). 4th revision. Copyright © United Nations 2011. USDS. nd. Occupation and Reconstruction of Japan, 1945–52. Office of the Historian, United
States Department of States. Retrieved through https://history.state.gov/milestones/1945-1952/japan-reconstruction.
Urata, S. 2014. A Stages Approach to Regional Economic Integration in Asia Pacific: The RCEP,
TPP, and FTAAP. In New Directions in Asia-Pacific Economic Integration, edited by Amb. Tang Guoqiang and Peter A. Petri (Eds.), 2014. China National Committee for Pacific Economic Cooperation (CNCPEC) and United States Asia Pacific Council (USAPC), pp. 119-137. Copyright © 2014 by the East-West Center.
Watanabe, A. and T. Kikuchi. 1995. Japan's Perspective on APEC: Community Or Association?,
in NBAR 1996. In America, Japan, and APEC: The Challenge of Leadership in the Asia-Pacific, edited by The National Bureau of Asian Research, APEC Study Center at the University of Washington, ANALYSIS Vol. 6, No. 3, pp. 23-36.
Wilson, J. D. 2015. Mega-regional trade deals in the Asia-Pacific: choosing between the TPP and
RCEP? J Contemp Asia 45(2):345–353. Yamazawa, I. 2012. APEC: New Agenda in its Third Decade. Institute of Southeast Asian Studies,
20 Heng Mui Keng Terrace, Pasir Panjang, Singapore 119614. Yoshida, T. 2004. East Asian Regionalism and Japan. IDE APEC Study Center Working Paper
Serues 03/04 – No. 9.
![APEC Connectivity Blueprint[2] - espas.euespas.eu/orbis/sites/default/files/generated/document/en/APEC... · APEC CONNECTIVITY BLUEPRINT FOR 2015-2025 ... Engagement with APEC Business](https://static.fdocuments.net/doc/165x107/5affac897f8b9a54578b773e/apec-connectivity-blueprint2-espas-connectivity-blueprint-for-2015-2025-.jpg)