
The Evidence for Current Cardiovascular Disease … · Cardiovascular Disease Prevention...
74
The Evidence for Current Cardiovascular Disease Prevention Guidelines: Cholesterol, Cholesterol Therapies, and Cholesterol Guidelines Ty J. Gluckman, Ryan J. Tedford, Andrew P. DeFilippis, James Mudd, Catherine Campbell, & Roger S. Blumenthal The Johns Hopkins Ciccarone Center for the Prevention of Heart Disease
Transcript of The Evidence for Current Cardiovascular Disease … · Cardiovascular Disease Prevention...
The Evidence for Current
Cardiovascular Disease Prevention
Guidelines:
Cholesterol, Cholesterol Therapies,
and Cholesterol Guidelines
Ty J. Gluckman, Ryan J. Tedford, Andrew P. DeFilippis, James
Mudd, Catherine Campbell, & Roger S. Blumenthal
The Johns Hopkins Ciccarone Center for the Prevention of Heart Disease
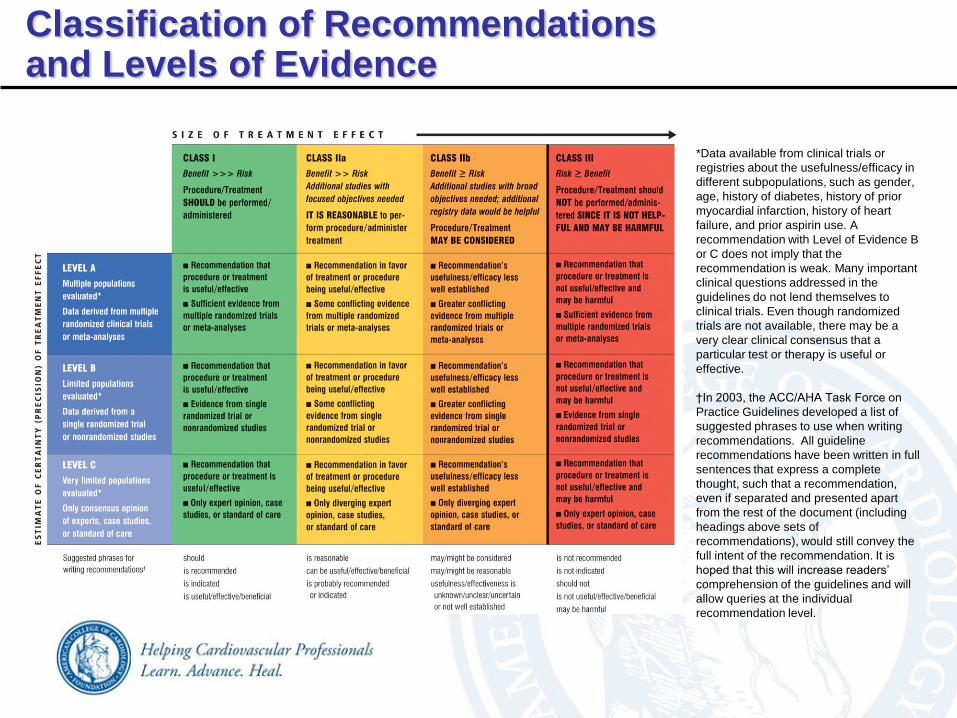
*Data available from clinical trials or
registries about the usefulness/efficacy in
different subpopulations, such as gender,
age, history of diabetes, history of prior
myocardial infarction, history of heart
failure, and prior aspirin use. A
recommendation with Level of Evidence B
or C does not imply that the
recommendation is weak. Many important
clinical questions addressed in the
guidelines do not lend themselves to
clinical trials. Even though randomized
trials are not available, there may be a
very clear clinical consensus that a
particular test or therapy is useful or
effective.
†In 2003, the ACC/AHA Task Force on
Practice Guidelines developed a list of
suggested phrases to use when writing
recommendations. All guideline
recommendations have been written in full
sentences that express a complete
thought, such that a recommendation,
even if separated and presented apart
from the rest of the document (including
headings above sets of
recommendations), would still convey the
full intent of the recommendation. It is
hoped that this will increase readers’
comprehension of the guidelines and will
allow queries at the individual
recommendation level.
Classification of Recommendations and Levels of Evidence
I IIa IIb III
I IIa IIb III
I IIa IIb III
I IIa IIb III I IIa IIb III
I IIa IIb III
I IIa IIb III
I IIa IIb III
I IIa IIb III
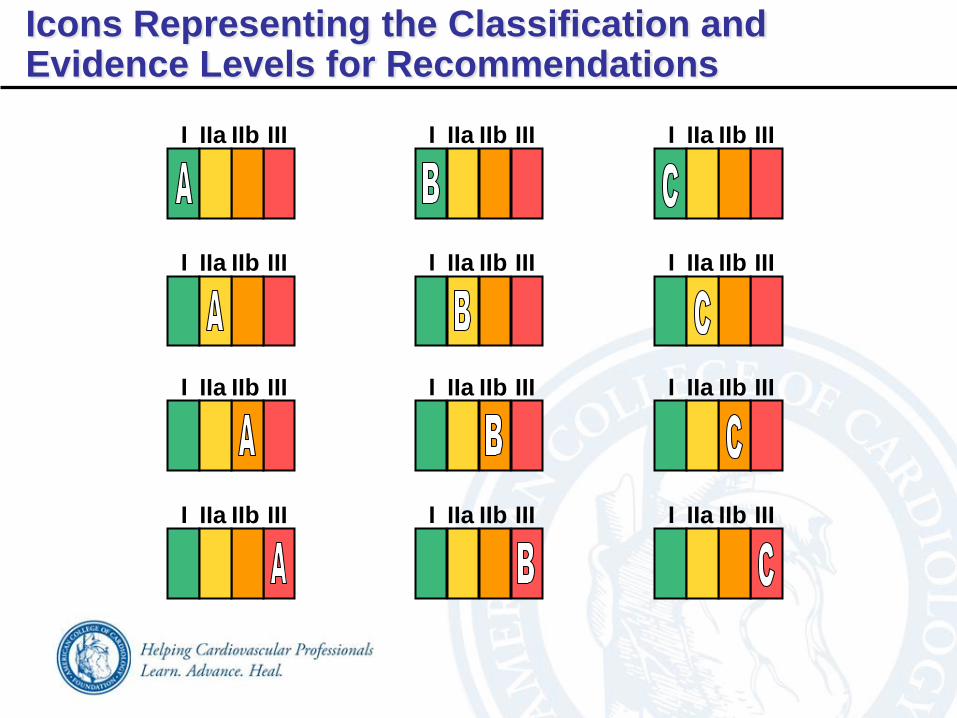
Icons Representing the Classification and Evidence Levels for Recommendations
I IIa IIb III
I IIa IIb III
I IIa IIb III
Cholesterol, Cholesterol Therapies,
and Cholesterol Guidelines
Evidence for Current Cardiovascular Disease
Prevention Guidelines
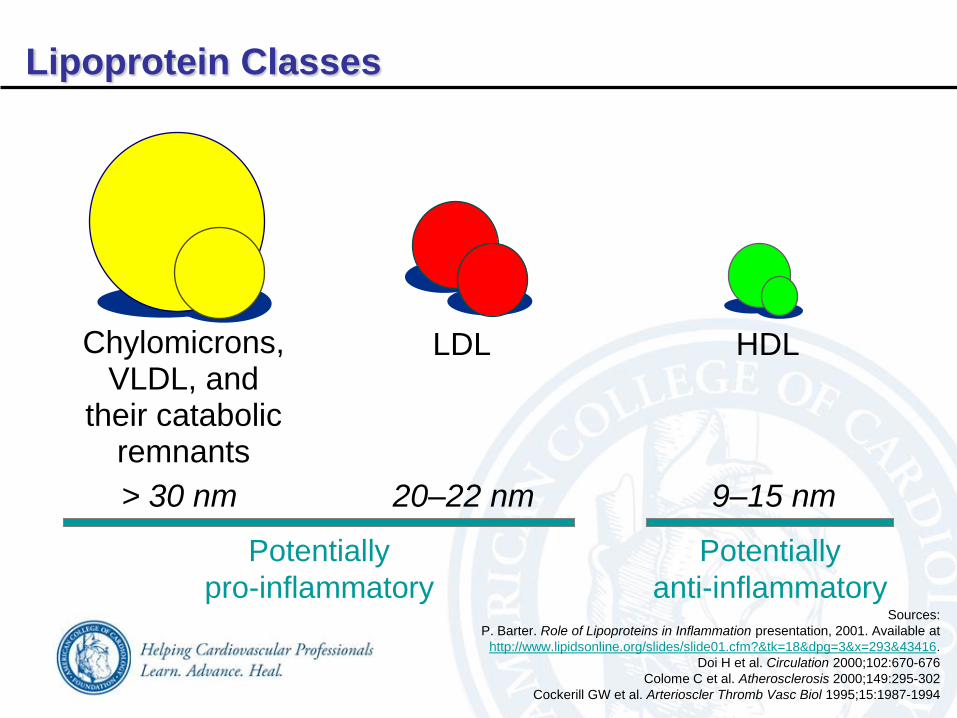
Sources:
P. Barter. Role of Lipoproteins in Inflammation presentation, 2001. Available at
http://www.lipidsonline.org/slides/slide01.cfm?&tk=18&dpg=3&x=293&43416.
Doi H et al. Circulation 2000;102:670-676
Colome C et al. Atherosclerosis 2000;149:295-302
Cockerill GW et al. Arterioscler Thromb Vasc Biol 1995;15:1987-1994
HDLLDLChylomicrons,VLDL, and
their catabolic remnants
> 30 nm 20–22 nm
Potentially
pro-inflammatory
9–15 nm
Potentially
anti-inflammatory
Lipoprotein Classes

HDL
LiverOxidative
modificationof LDL
LDL+
VLDL
Cholesterol
excreted
High plasma
LDL
LDL infiltration
into intima
+Macrophages
Foam cells
Fatty streak
Advancedfibrocalcific
lesion
Endothelial
injury
Adherence
of platelets
Release
of PDGFOther
growth
factors
LCAT
APO-A1
APO-A1=Apolipoprotein A1, HDL=High density lipoprotein,
LCAT=Lecithin cholesterol acyltransferase, LDL=Low density lipoprotein,
PDGF=Platelet-derived growth factor, VLDL=Very low density lipoprotein
Role of Lipoproteins in Atherogenesis
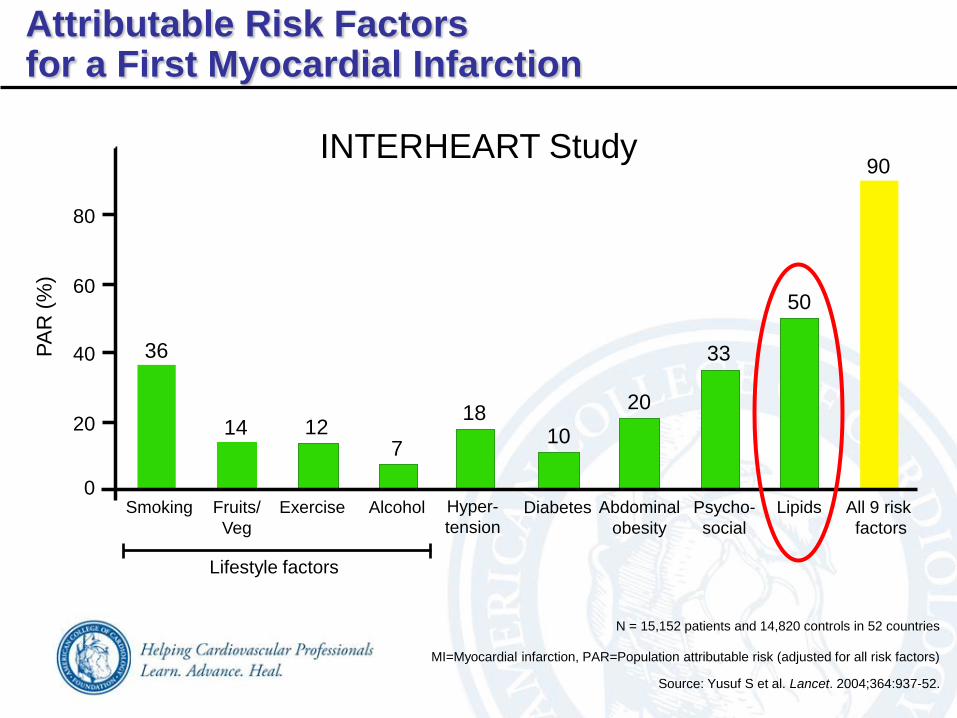
Source: Yusuf S et al. Lancet. 2004;364:937-52.
36
127
10
20
33
0
20
40
60
80
100
Smoking Fruits/
Veg
Exercise Alcohol Psycho-
social
Lipids All 9 risk
factors
PA
R (
%)
1418
90
Diabetes Abdominal
obesity
Hyper-
tension
Lifestyle factors
50
INTERHEART Study
N = 15,152 patients and 14,820 controls in 52 countries
MI=Myocardial infarction, PAR=Population attributable risk (adjusted for all risk factors)
Attributable Risk Factorsfor a First Myocardial Infarction
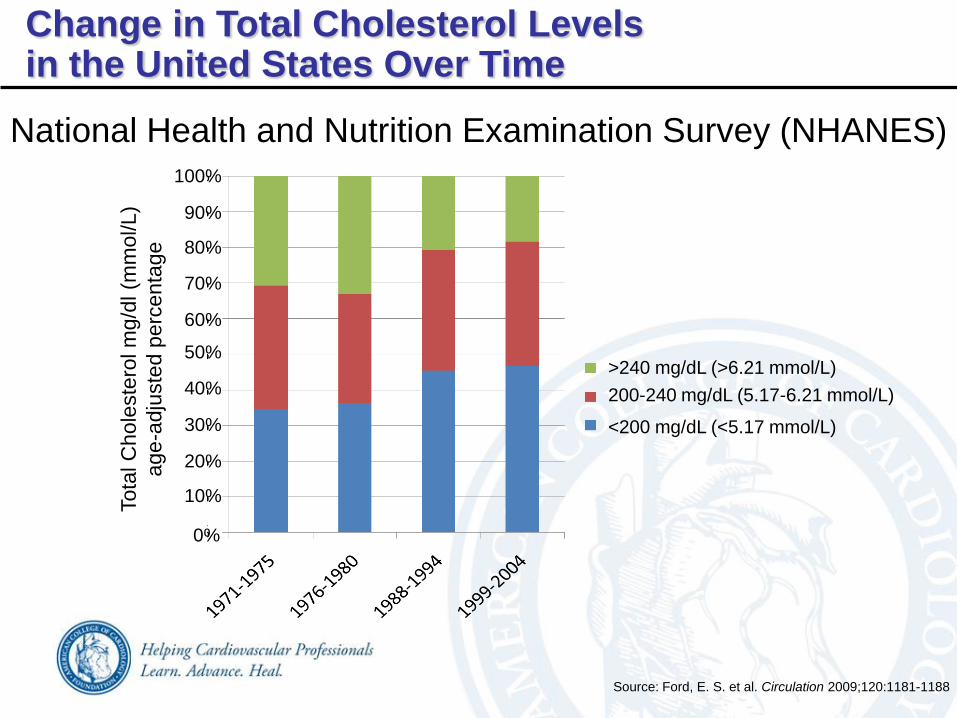
Change in Total Cholesterol Levelsin the United States Over Time
Source: Ford, E. S. et al. Circulation 2009;120:1181-1188
0%
10%
20%
60%
40%
50%
30%
70%
80%
90%
100%
>240 mg/dL (>6.21 mmol/L)
Tota
l C
hole
ste
rol m
g/d
l (m
mol/L)
ag
e-a
dju
ste
d p
erc
en
tage
National Health and Nutrition Examination Survey (NHANES)
200-240 mg/dL (5.17-6.21 mmol/L)
<200 mg/dL (<5.17 mmol/L)
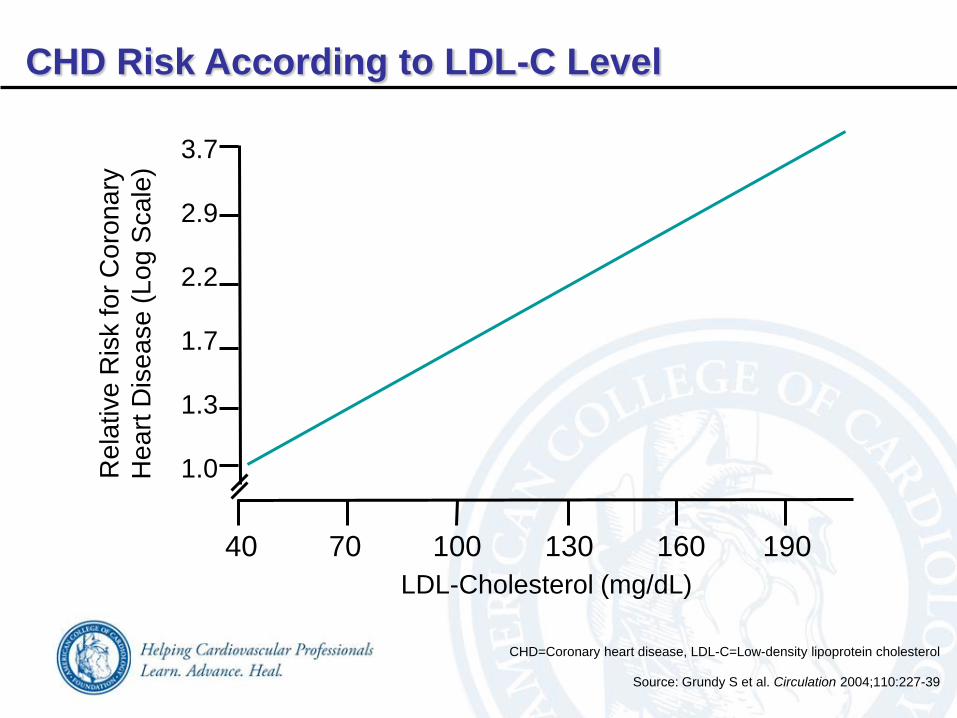
3.7
2.9
2.2
1.7
1.3
1.0
40 70 100 130 160 190
Rela
tive R
isk for
Coro
nary
He
art
Dis
ea
se
(L
og
Sca
le)
LDL-Cholesterol (mg/dL)
Source: Grundy S et al. Circulation 2004;110:227-39
CHD=Coronary heart disease, LDL-C=Low-density lipoprotein cholesterol
CHD Risk According to LDL-C Level
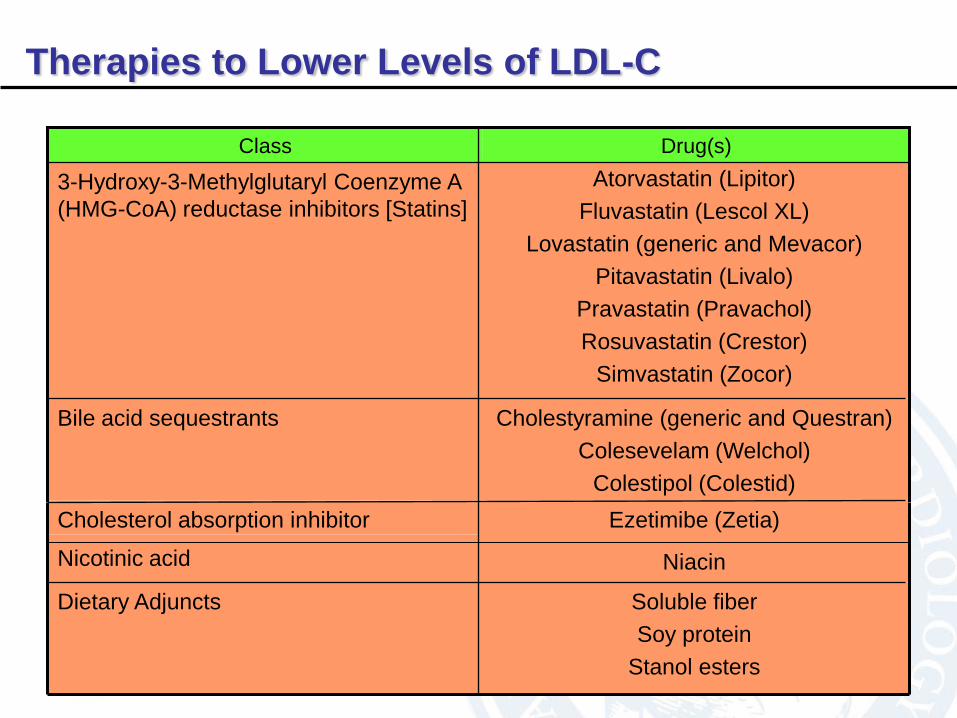
Soluble fiber
Soy protein
Stanol esters
Dietary Adjuncts
Ezetimibe (Zetia)Cholesterol absorption inhibitor
Cholestyramine (generic and Questran)
Colesevelam (Welchol)
Colestipol (Colestid)
Bile acid sequestrants
Atorvastatin (Lipitor)
Fluvastatin (Lescol XL)
Lovastatin (generic and Mevacor)
Pitavastatin (Livalo)
Pravastatin (Pravachol)
Rosuvastatin (Crestor)
Simvastatin (Zocor)
3-Hydroxy-3-Methylglutaryl Coenzyme A
(HMG-CoA) reductase inhibitors [Statins]
Drug(s)Class
Nicotinic acid Niacin
Therapies to Lower Levels of LDL-C
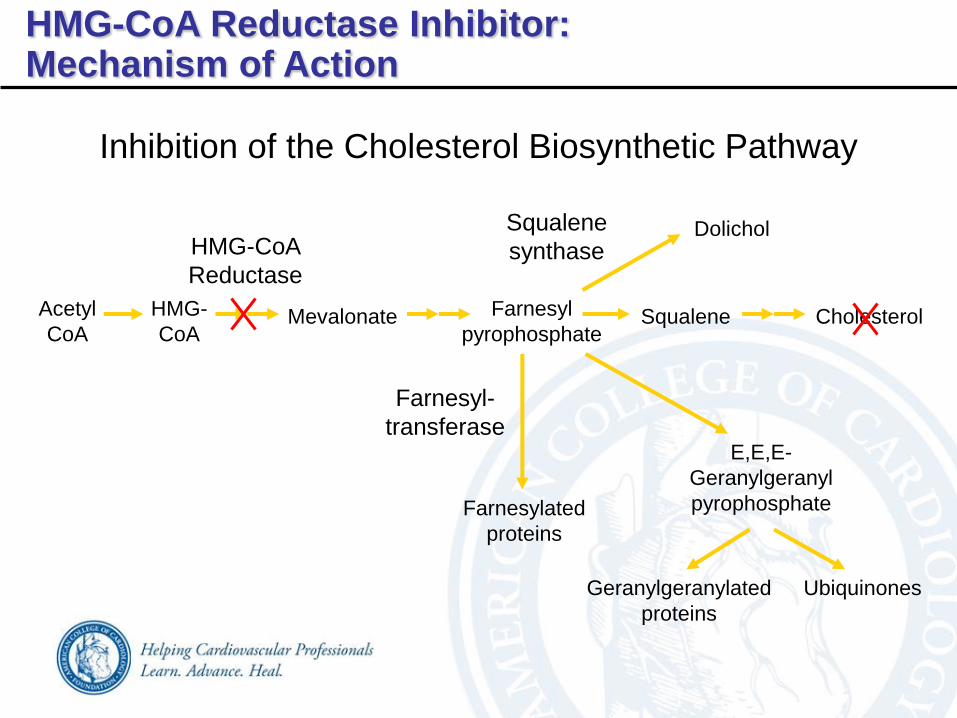
Acetyl
CoA
HMG-
CoAMevalonate Farnesyl
pyrophosphateSqualene Cholesterol
Squalene
synthaseDolichol
Farnesyl-
transferase
Farnesylated
proteins
E,E,E-
Geranylgeranyl
pyrophosphate
Geranylgeranylated
proteins
Ubiquinones
HMG-CoA
Reductase
Inhibition of the Cholesterol Biosynthetic Pathway
HMG-CoA Reductase Inhibitor:Mechanism of Action
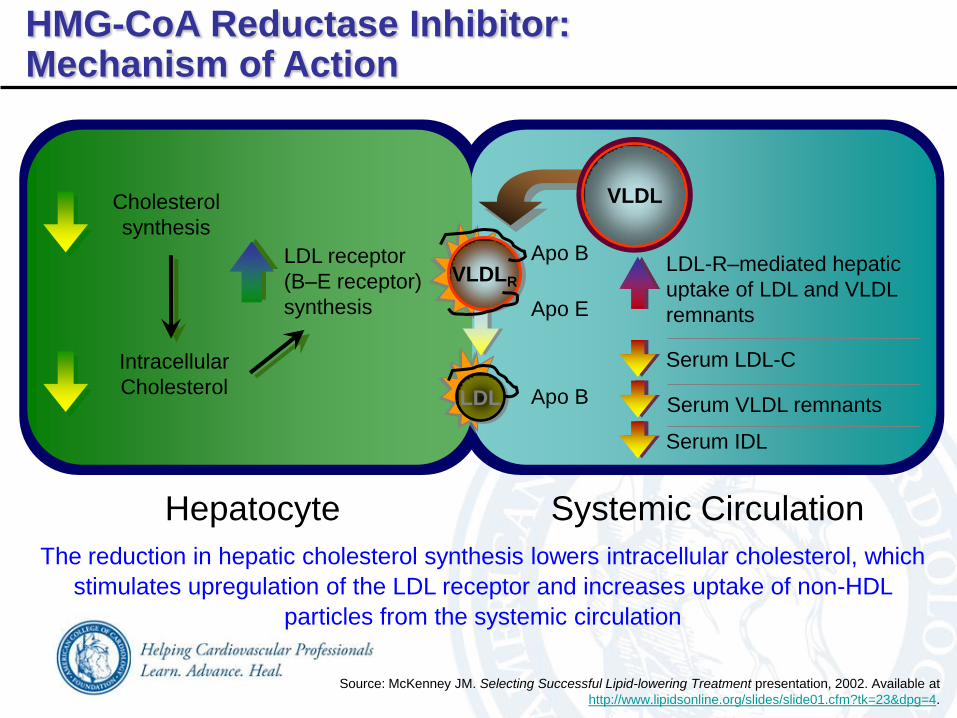
LDL-R–mediated hepatic
uptake of LDL and VLDL
remnants
Serum VLDL remnants
Serum LDL-C
Cholesterol
synthesis
LDL receptor
(B–E receptor)
synthesis
Intracellular
Cholesterol
Apo B
Apo E
Apo B
Systemic CirculationHepatocyte
The reduction in hepatic cholesterol synthesis lowers intracellular cholesterol, which
stimulates upregulation of the LDL receptor and increases uptake of non-HDL
particles from the systemic circulation
LDL
Serum IDL
VLDLR
VLDL
HMG-CoA Reductase Inhibitor:Mechanism of Action
Source: McKenney JM. Selecting Successful Lipid-lowering Treatment presentation, 2002. Available at
http://www.lipidsonline.org/slides/slide01.cfm?tk=23&dpg=4.
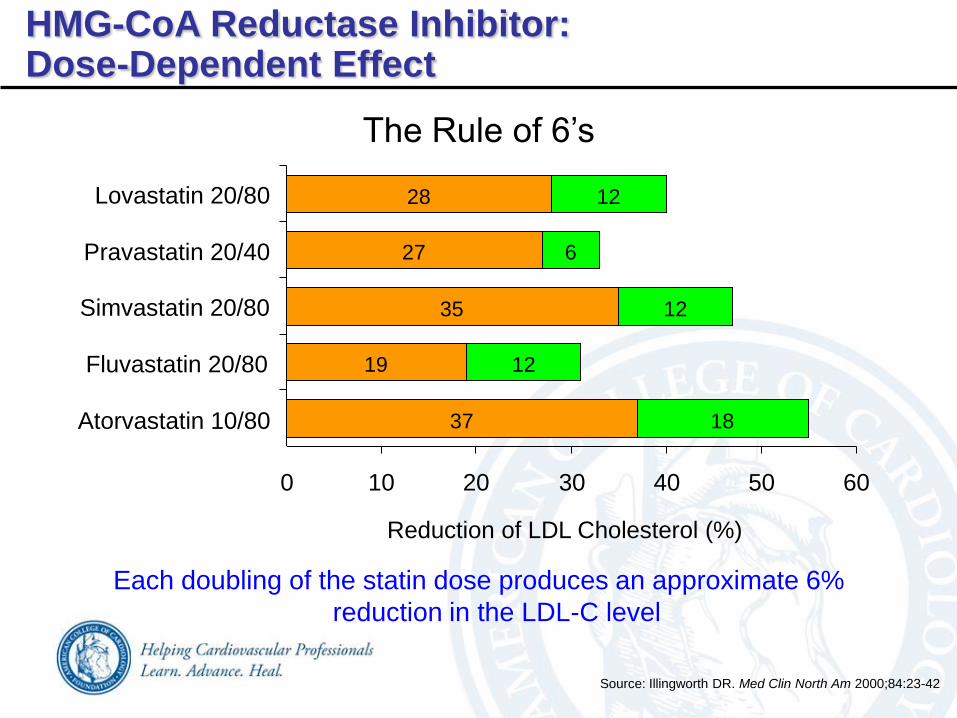
Source: Illingworth DR. Med Clin North Am 2000;84:23-42
The Rule of 6’s
Each doubling of the statin dose produces an approximate 6%
reduction in the LDL-C level
HMG-CoA Reductase Inhibitor:Dose-Dependent Effect
37
19
35
27
28
18
12
12
6
12
0 10 20 30 40 50 60
Atorvastatin 10/80
Fluvastatin 20/80
Simvastatin 20/80
Pravastatin 20/40
Lovastatin 20/80
Reduction of LDL Cholesterol (%)
Source: Law MR et al. BMJ 2003;326:1423-1427
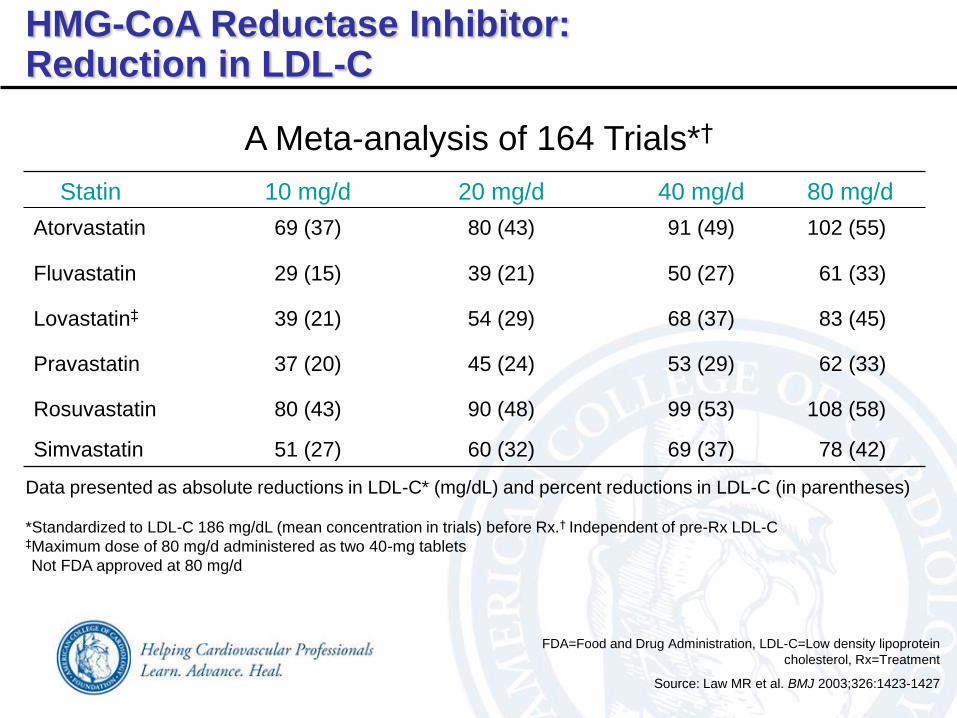
78 (42)69 (37)60 (32)51 (27)Simvastatin
108 (58)99 (53)90 (48)80 (43)Rosuvastatin
62 (33)53 (29)45 (24)37 (20)Pravastatin
83 (45)68 (37)54 (29)39 (21)Lovastatin‡
61 (33)50 (27)39 (21)29 (15)Fluvastatin
102 (55)91 (49)80 (43)69 (37)Atorvastatin
80 mg/d40 mg/d20 mg/d10 mg/dStatin
Data presented as absolute reductions in LDL-C* (mg/dL) and percent reductions in LDL-C (in parentheses)
*Standardized to LDL-C 186 mg/dL (mean concentration in trials) before Rx.† Independent of pre-Rx LDL-C‡Maximum dose of 80 mg/d administered as two 40-mg tablets
Not FDA approved at 80 mg/d
A Meta-analysis of 164 Trials*†
FDA=Food and Drug Administration, LDL-C=Low density lipoprotein
cholesterol, Rx=Treatment
HMG-CoA Reductase Inhibitor:Reduction in LDL-C
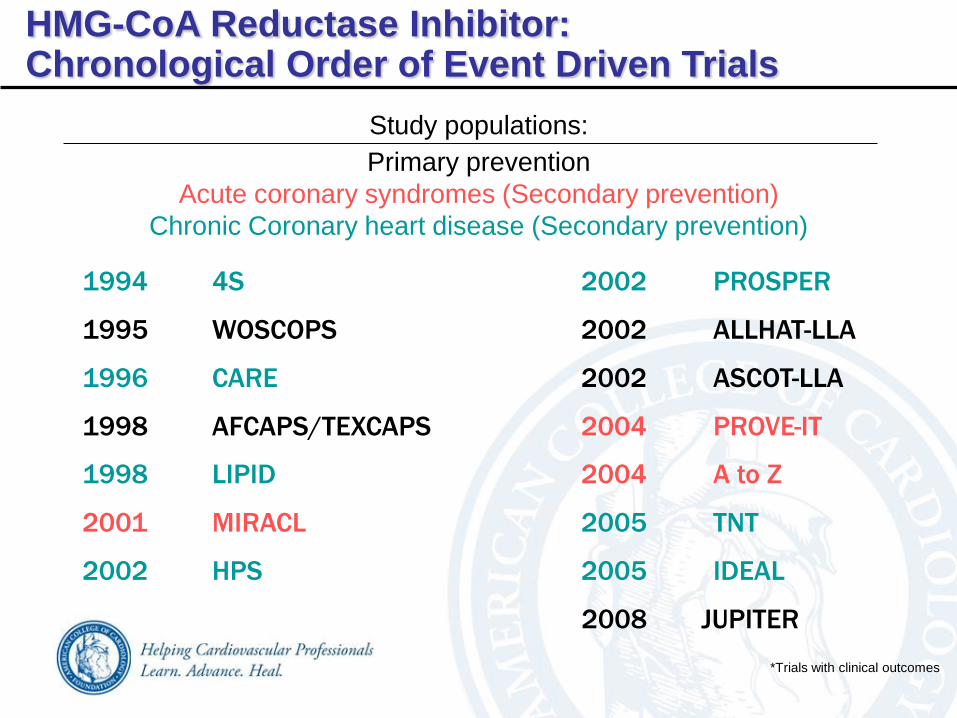
Study populations:
Primary prevention
Acute coronary syndromes (Secondary prevention)
Chronic Coronary heart disease (Secondary prevention)
*Trials with clinical outcomes
HMG-CoA Reductase Inhibitor:Chronological Order of Event Driven Trials
1994 4S 2002 PROSPER
1995 WOSCOPS 2002 ALLHAT-LLA
1996 CARE 2002 ASCOT-LLA
1998 AFCAPS/TEXCAPS 2004 PROVE-IT
1998 LIPID 2004 A to Z
2001 MIRACL 2005 TNT
2002 HPS 2005 IDEAL
2008 JUPITER

West of Scotland Coronary Prevention Study
(WOSCOPS)
CHD=Coronary heart disease, MI=Myocardial infarction,
RRR=Relative risk reduction
Source: Shepherd J et al. NEJM 1995;333:1301-1307
Placebo
7.5
Pravastatin
9
6
3
0
5.3
P<0.001
31% RRR
Rate
of
MI
or
CH
D
death
(%
)
HMG-CoA Reductase Inhibitor Evidence:Primary Prevention
6,595 men with moderate hypercholesterolemia randomized to pravastatin
(40 mg) or placebo for 5 years
A statin provides significant benefit in those with average cholesterol levels
Ris
k o
f M
I or
CH
D d
eath
(%
)
CHD=Coronary heart disease, MI=Myocardial infarction,
RRR=Relative risk reduction
Source: Ford I et al. NEJM 2007;357:1477-86
West of Scotland Coronary Prevention Study
(WOSCOPS)
HMG-CoA Reductase Inhibitor Evidence:Primary Prevention
Long-term follow-up at 5 and 10 years after conclusion of the study
A statin provides long-term benefit in those with average cholesterol levels
Rate
of
MI, u
nsta
ble
angin
a, or
SC
D (
%)
Placebo
5.5
Lovastatin
6
4
2
0
3.5
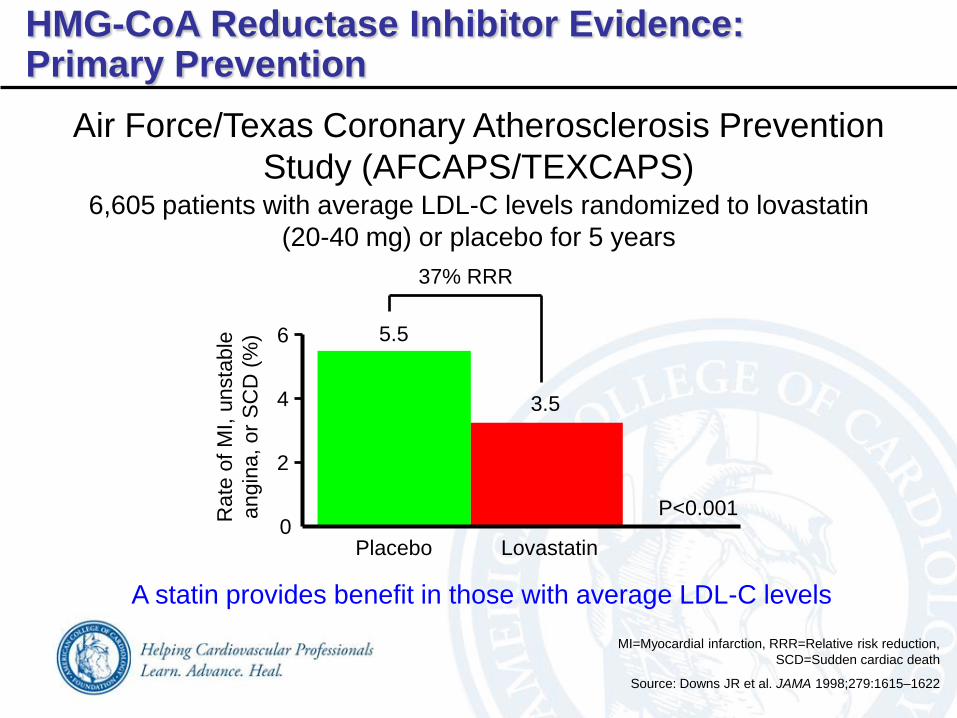
Air Force/Texas Coronary Atherosclerosis Prevention
Study (AFCAPS/TEXCAPS)
P<0.001
37% RRR
MI=Myocardial infarction, RRR=Relative risk reduction,
SCD=Sudden cardiac death
Source: Downs JR et al. JAMA 1998;279:1615–1622
HMG-CoA Reductase Inhibitor Evidence:Primary Prevention
6,605 patients with average LDL-C levels randomized to lovastatin
(20-40 mg) or placebo for 5 years
A statin provides benefit in those with average LDL-C levels
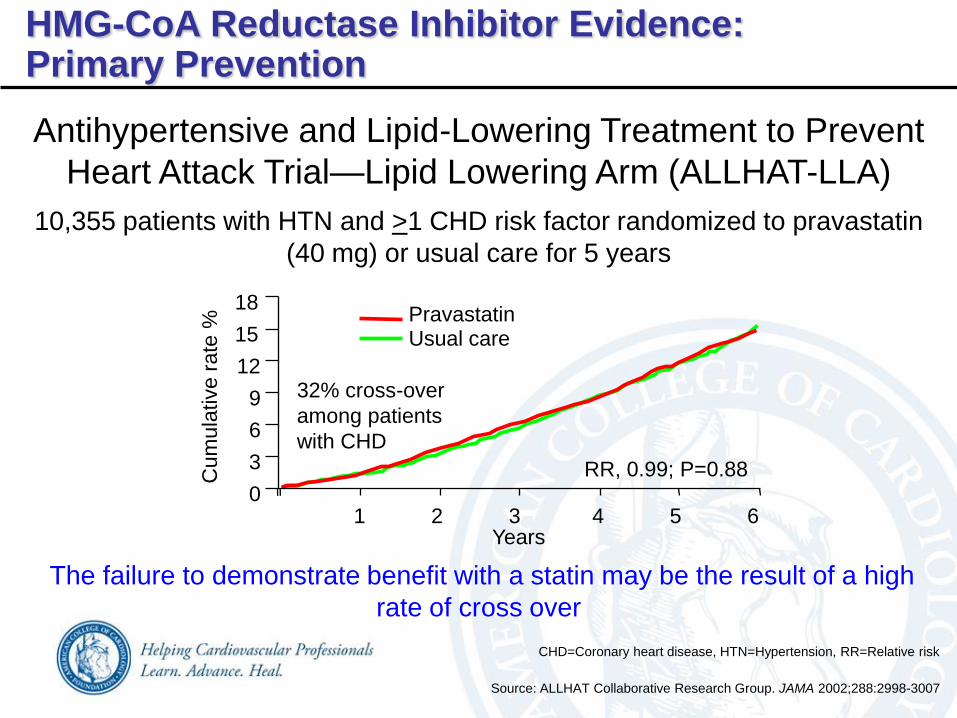
Antihypertensive and Lipid-Lowering Treatment to Prevent
Heart Attack Trial—Lipid Lowering Arm (ALLHAT-LLA)
Source: ALLHAT Collaborative Research Group. JAMA 2002;288:2998-3007
CHD=Coronary heart disease, HTN=Hypertension, RR=Relative risk
HMG-CoA Reductase Inhibitor Evidence:Primary Prevention
RR, 0.99; P=0.88
1 2 3 4 5 6
32% cross-over
among patients
with CHD
Cum
ula
tive r
ate
%
PravastatinUsual care
0
3
6
9
12
15
18
Years
10,355 patients with HTN and >1 CHD risk factor randomized to pravastatin
(40 mg) or usual care for 5 years
The failure to demonstrate benefit with a statin may be the result of a high
rate of cross over
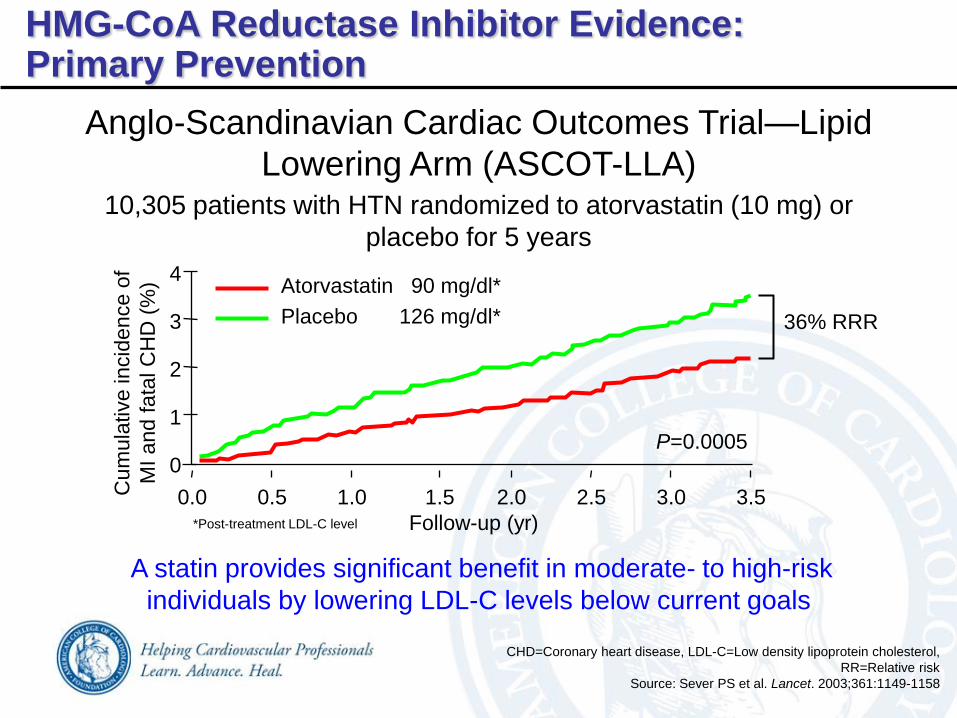
Anglo-Scandinavian Cardiac Outcomes Trial—Lipid
Lowering Arm (ASCOT-LLA)
Source: Sever PS et al. Lancet. 2003;361:1149-1158
*Post-treatment LDL-C level
CHD=Coronary heart disease, LDL-C=Low density lipoprotein cholesterol,
RR=Relative risk
HMG-CoA Reductase Inhibitor Evidence:Primary Prevention
0
1
2
3
4
0.0 0.5 1.0 1.5 2.0 2.5 3.0 3.5
Atorvastatin 90 mg/dl*
Placebo 126 mg/dl*
P=0.0005
Cum
ula
tive incid
ence o
f
MI and
fata
l C
HD
(%
)
Follow-up (yr)
36% RRR
10,305 patients with HTN randomized to atorvastatin (10 mg) or
placebo for 5 years
A statin provides significant benefit in moderate- to high-risk
individuals by lowering LDL-C levels below current goals
Source: O’Keefe JH Jr et al. JACC 2004;43:2142-6
–1
10
0
2
4
6
8
Statin
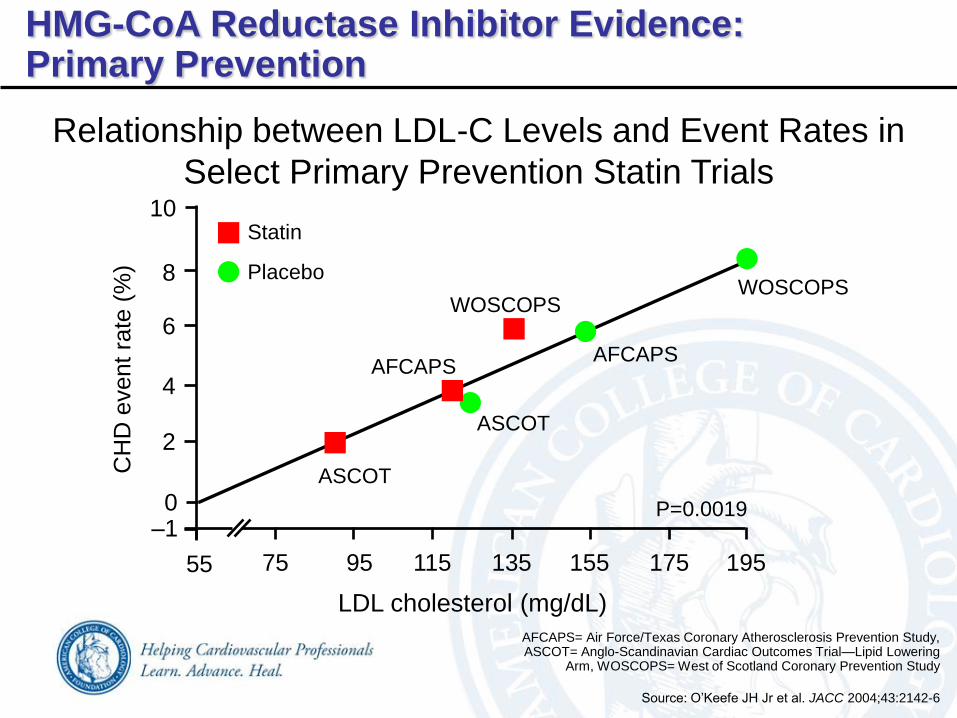
PlaceboWOSCOPS
AFCAPS
LDL cholesterol (mg/dL)
55 1951751551351159575
CH
D e
vent ra
te (
%)
WOSCOPS
ASCOT
AFCAPS
ASCOT
P=0.0019
Relationship between LDL-C Levels and Event Rates in
Select Primary Prevention Statin Trials
AFCAPS= Air Force/Texas Coronary Atherosclerosis Prevention Study, ASCOT= Anglo-Scandinavian Cardiac Outcomes Trial—Lipid Lowering
Arm, WOSCOPS= West of Scotland Coronary Prevention Study
HMG-CoA Reductase Inhibitor Evidence:Primary Prevention
Nu
mbe
r of
ad
vers
e C
V
even
ts*
pe
r 10
00
pe
rson
yea
rs
Placebo
5.0
Pravastatin
6
4
2
0
3.3
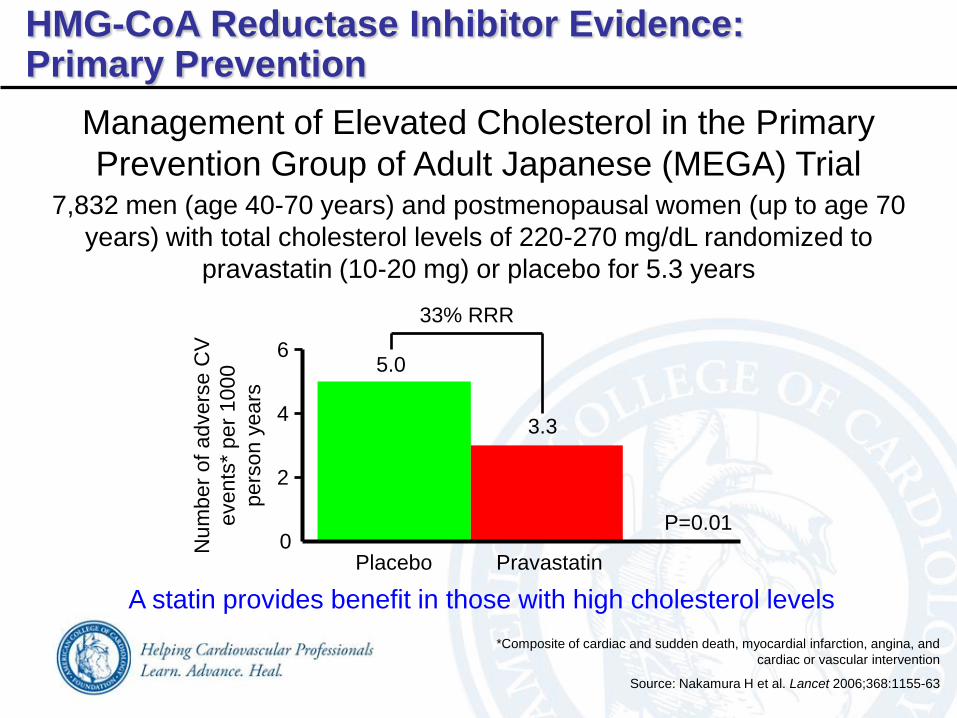
Management of Elevated Cholesterol in the Primary
Prevention Group of Adult Japanese (MEGA) Trial
P=0.01
33% RRR
Source: Nakamura H et al. Lancet 2006;368:1155-63
*Composite of cardiac and sudden death, myocardial infarction, angina, and
cardiac or vascular intervention
7,832 men (age 40-70 years) and postmenopausal women (up to age 70
years) with total cholesterol levels of 220-270 mg/dL randomized to
pravastatin (10-20 mg) or placebo for 5.3 years
A statin provides benefit in those with high cholesterol levels
HMG-CoA Reductase Inhibitor Evidence:Primary Prevention
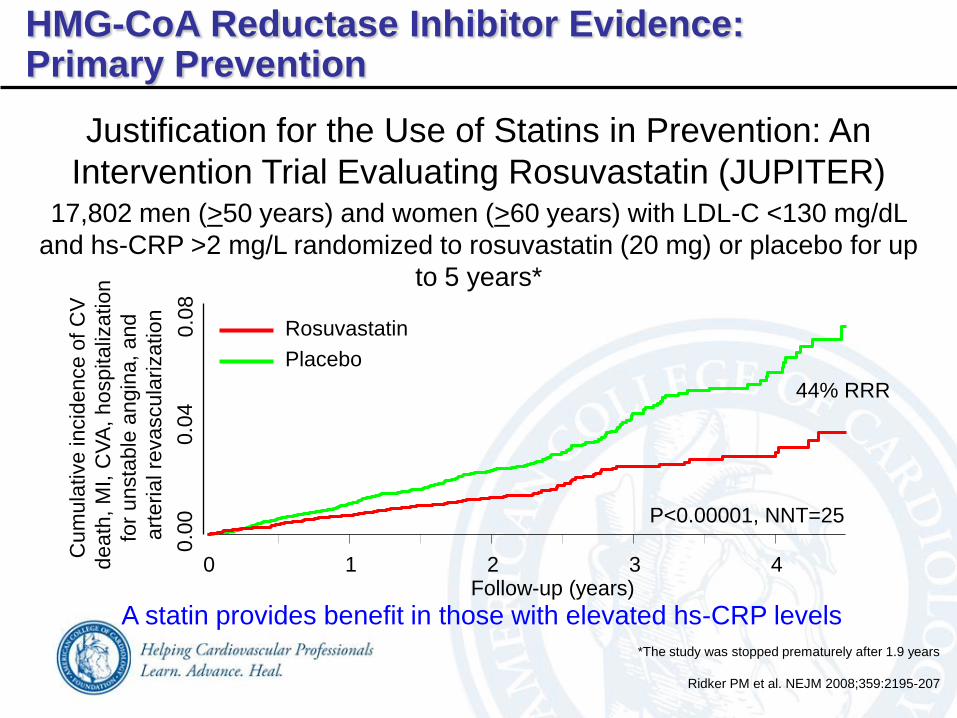
Justification for the Use of Statins in Prevention: An
Intervention Trial Evaluating Rosuvastatin (JUPITER)17,802 men (>50 years) and women (>60 years) with LDL-C <130 mg/dL
and hs-CRP >2 mg/L randomized to rosuvastatin (20 mg) or placebo for up
to 5 years*
A statin provides benefit in those with elevated hs-CRP levels
0 1 2 3 4
0.0
00.0
40
.08
Follow-up (years)
Rosuvastatin
Placebo
44% RRR
P<0.00001, NNT=25
Cum
ula
tive incid
ence o
f C
V
death
, M
I, C
VA
, hospitaliz
ation
for
unsta
ble
angin
a, and
art
erial re
vascula
rization
Ridker PM et al. NEJM 2008;359:2195-207
*The study was stopped prematurely after 1.9 years
HMG-CoA Reductase Inhibitor Evidence:Primary Prevention
0
5
10
15
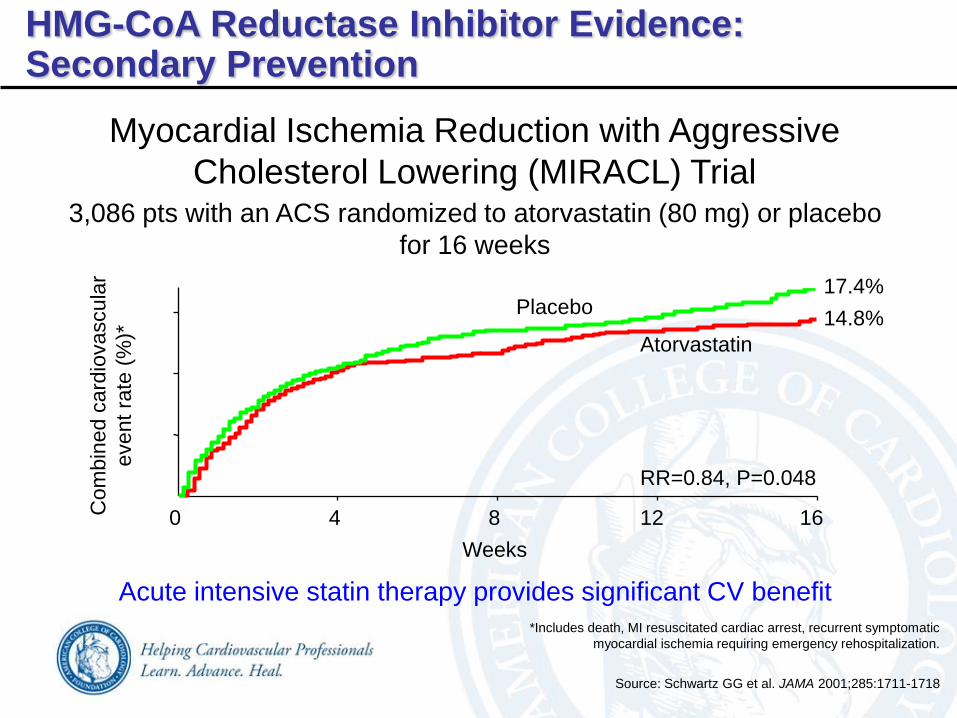
Myocardial Ischemia Reduction with Aggressive
Cholesterol Lowering (MIRACL) Trial
17.4%
14.8%
RR=0.84, P=0.048
Co
mb
ine
d c
ard
iova
scu
lar
event ra
te (
%)*
Weeks
*Includes death, MI resuscitated cardiac arrest, recurrent symptomatic
myocardial ischemia requiring emergency rehospitalization.
4 8 12 160
Atorvastatin
Source: Schwartz GG et al. JAMA 2001;285:1711-1718
HMG-CoA Reductase Inhibitor Evidence:Secondary Prevention
Placebo
3,086 pts with an ACS randomized to atorvastatin (80 mg) or placebo
for 16 weeks
Acute intensive statin therapy provides significant CV benefit
Pravastatin or Atorvastatin Evaluation and Infection
Therapy (PROVE-IT)—TIMI 22 Study
ACS=Acute coronary syndrome, CV=Cardiovascular,
MI=Myocardial infarction, UA=Unstable angina
Source: Cannon CP et al. NEJM 2004;350:1495-1504
4,162 pts with an ACS randomized to atorvastatin (80 mg) or pravastatin
(40 mg) for 24 months
Acute intensive statin therapy provides significant CV benefit
HMG-CoA Reductase Inhibitor Evidence:Secondary Prevention
Follow-up (months)3 6 9 12 15 18 21 24 27 30
30
25
20
15
10
5
0
P =0.005
Recurr
ent
MI, c
ard
iac d
eath
,
UA
, re
vascula
rization, or
str
oke
16% RRR
Atorvastatin
Pravastatin
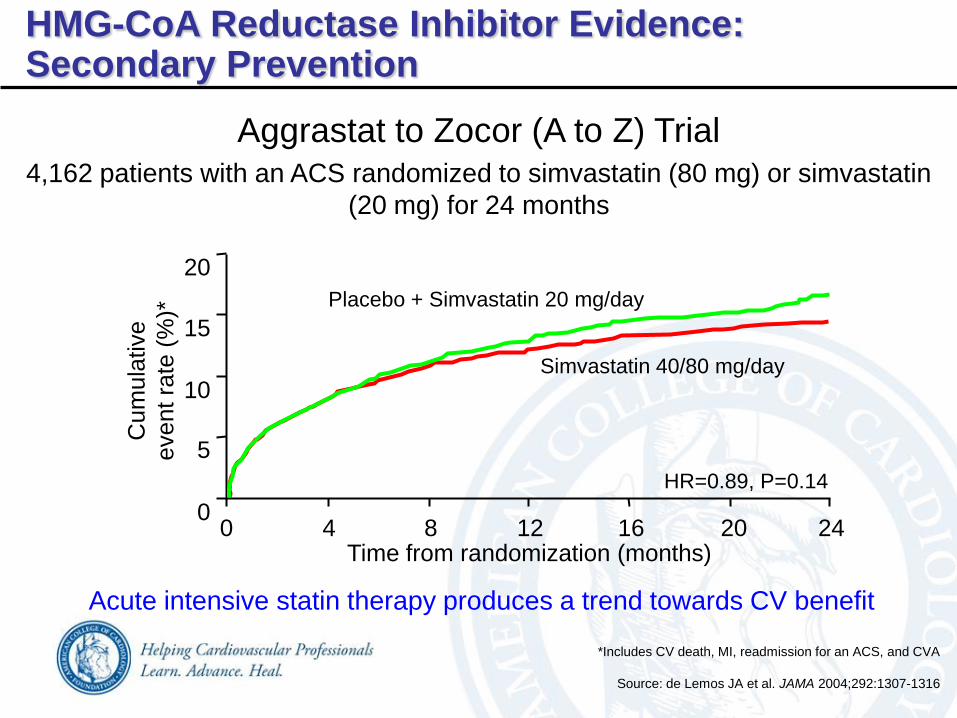
Aggrastat to Zocor (A to Z) Trial
Source: de Lemos JA et al. JAMA 2004;292:1307-1316
*Includes CV death, MI, readmission for an ACS, and CVA
HMG-CoA Reductase Inhibitor Evidence:Secondary Prevention
Time from randomization (months)
Cum
ula
tive
event ra
te (
%)*
0
5
10
15
20
0 4 8 12 16 20 24
Placebo + Simvastatin 20 mg/day
HR=0.89, P=0.14
Simvastatin 40/80 mg/day
4,162 patients with an ACS randomized to simvastatin (80 mg) or simvastatin
(20 mg) for 24 months
Acute intensive statin therapy produces a trend towards CV benefit
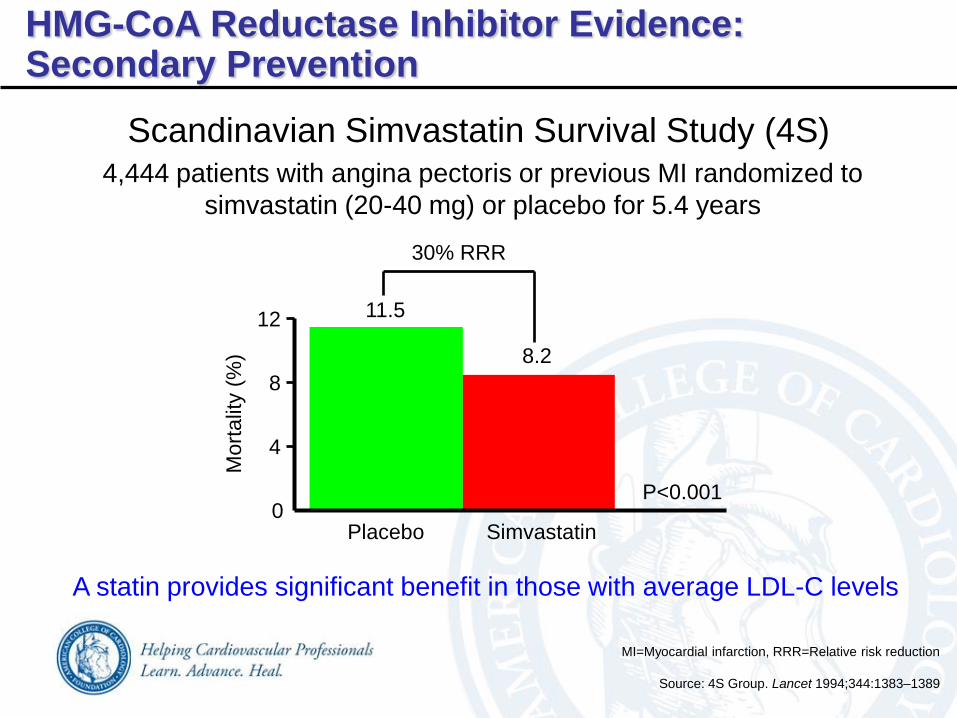
Scandinavian Simvastatin Survival Study (4S)
Mort
alit
y (
%)
Placebo
11.5
Simvastatin
12
8
4
0
8.2
P<0.001
30% RRR
Source: 4S Group. Lancet 1994;344:1383–1389
MI=Myocardial infarction, RRR=Relative risk reduction
4,444 patients with angina pectoris or previous MI randomized to
simvastatin (20-40 mg) or placebo for 5.4 years
A statin provides significant benefit in those with average LDL-C levels
HMG-CoA Reductase Inhibitor Evidence:Secondary Prevention
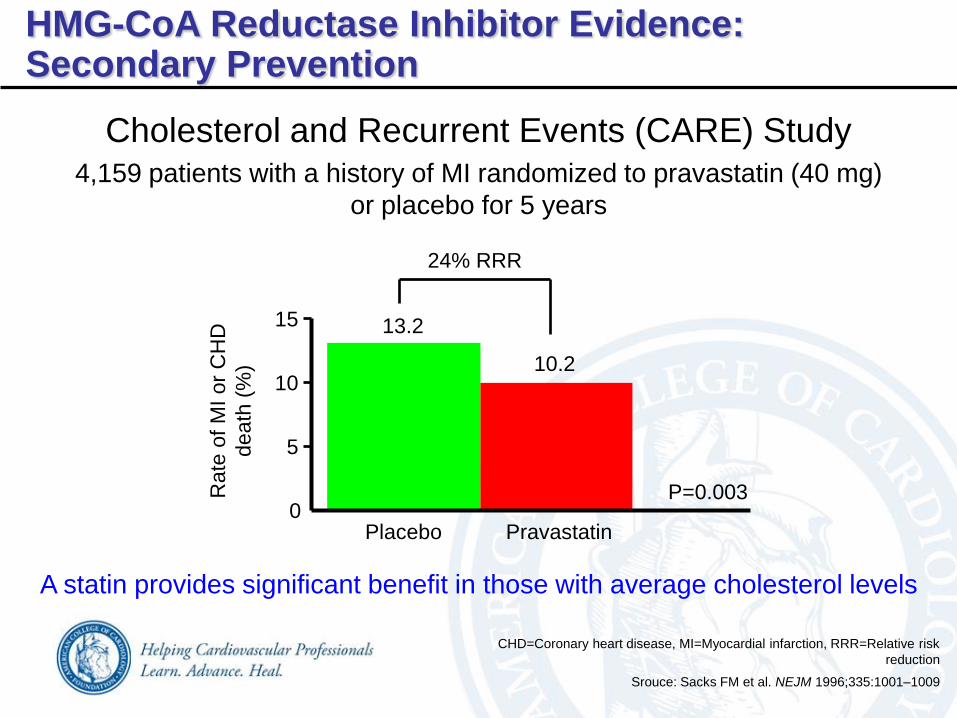
Cholesterol and Recurrent Events (CARE) Study
Placebo
13.2
Pravastatin
15
10
5
0
10.2
P=0.003
24% RRR
Rate
of
MI
or
CH
D
death
(%
)
Srouce: Sacks FM et al. NEJM 1996;335:1001–1009
CHD=Coronary heart disease, MI=Myocardial infarction, RRR=Relative risk
reduction
4,159 patients with a history of MI randomized to pravastatin (40 mg)
or placebo for 5 years
A statin provides significant benefit in those with average cholesterol levels
HMG-CoA Reductase Inhibitor Evidence:Secondary Prevention
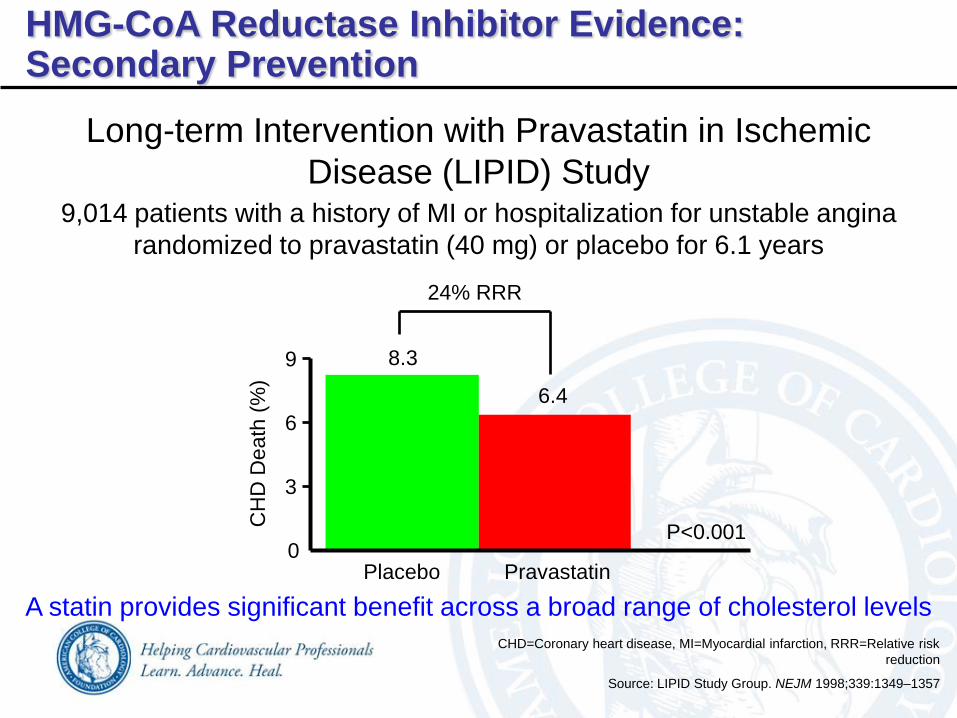
Long-term Intervention with Pravastatin in Ischemic
Disease (LIPID) Study
CH
D D
eath
(%
)
Placebo
8.3
Pravastatin
9
6
3
0
6.4
P<0.001
24% RRR
CHD=Coronary heart disease, MI=Myocardial infarction, RRR=Relative risk
reduction
Source: LIPID Study Group. NEJM 1998;339:1349–1357
9,014 patients with a history of MI or hospitalization for unstable angina
randomized to pravastatin (40 mg) or placebo for 6.1 years
A statin provides significant benefit across a broad range of cholesterol levels
HMG-CoA Reductase Inhibitor Evidence:Secondary Prevention
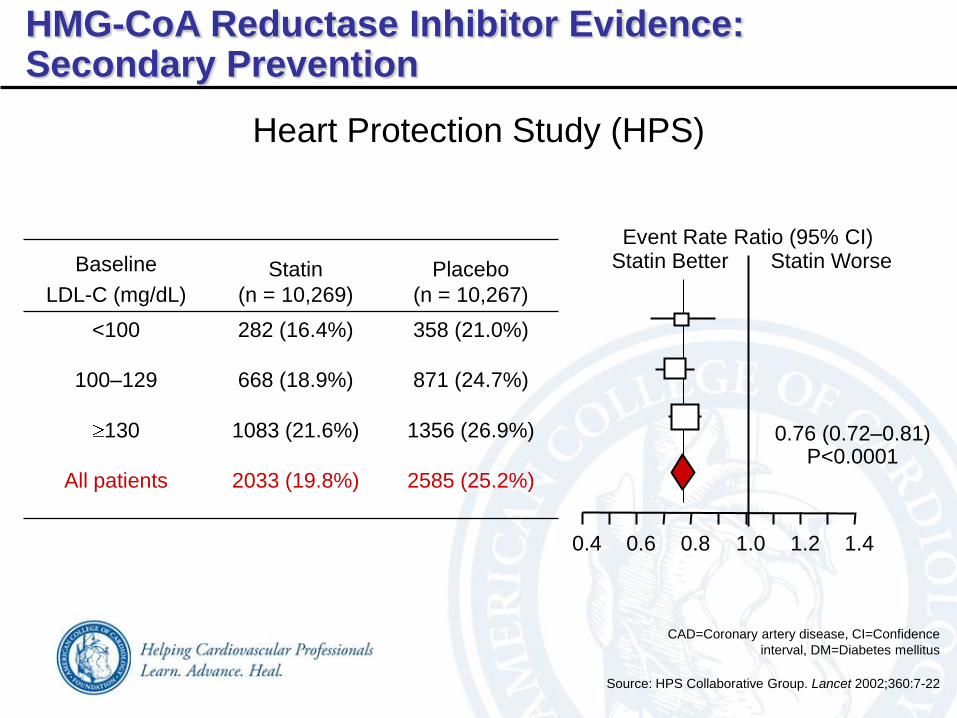
Baseline
LDL-C (mg/dL)
Statin
(n = 10,269)
Placebo
(n = 10,267)
<100 282 (16.4%) 358 (21.0%)
100–129 668 (18.9%) 871 (24.7%)
130 1083 (21.6%) 1356 (26.9%)
All patients 2033 (19.8%) 2585 (25.2%)
Event Rate Ratio (95% CI)Statin Better Statin Worse
0.4 0.6 0.8 1.0 1.2 1.4
0.76 (0.72–0.81)P<0.0001
Heart Protection Study (HPS)
CAD=Coronary artery disease, CI=Confidence
interval, DM=Diabetes mellitus
Source: HPS Collaborative Group. Lancet 2002;360:7-22
HMG-CoA Reductase Inhibitor Evidence:Secondary Prevention
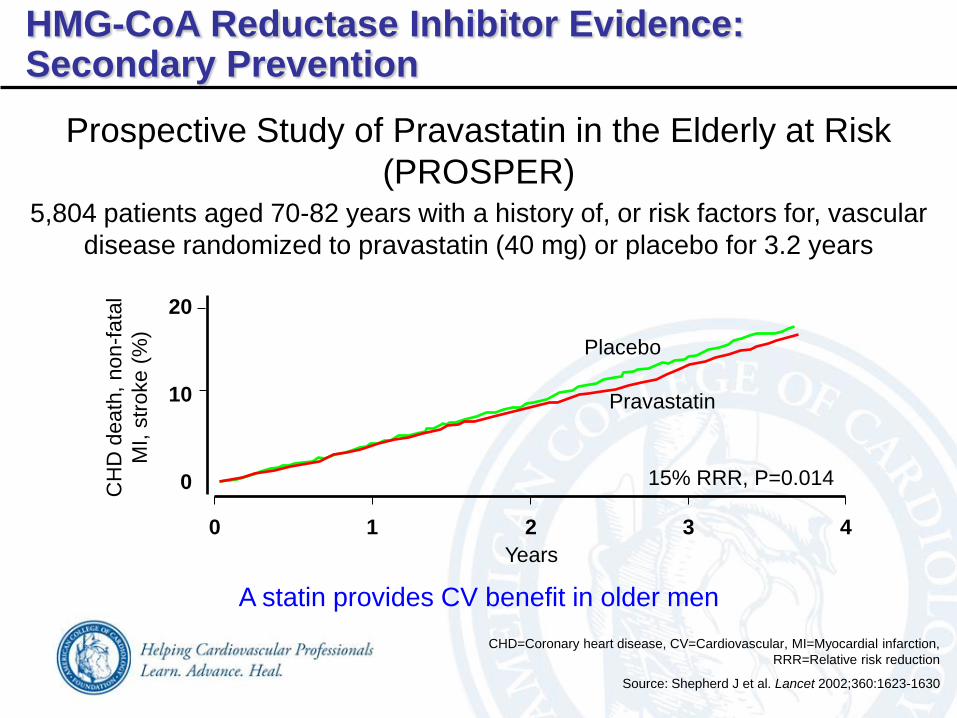
Source: Shepherd J et al. Lancet 2002;360:1623-1630
Prospective Study of Pravastatin in the Elderly at Risk
(PROSPER)
CHD=Coronary heart disease, CV=Cardiovascular, MI=Myocardial infarction,
RRR=Relative risk reduction
HMG-CoA Reductase Inhibitor Evidence:Secondary Prevention
0
10
20
0 1 2 3 4
CH
D d
eath
, non
-fata
l
MI, s
troke (
%)
Years
Placebo
15% RRR, P=0.014
Pravastatin
5,804 patients aged 70-82 years with a history of, or risk factors for, vascular
disease randomized to pravastatin (40 mg) or placebo for 3.2 years
A statin provides CV benefit in older men
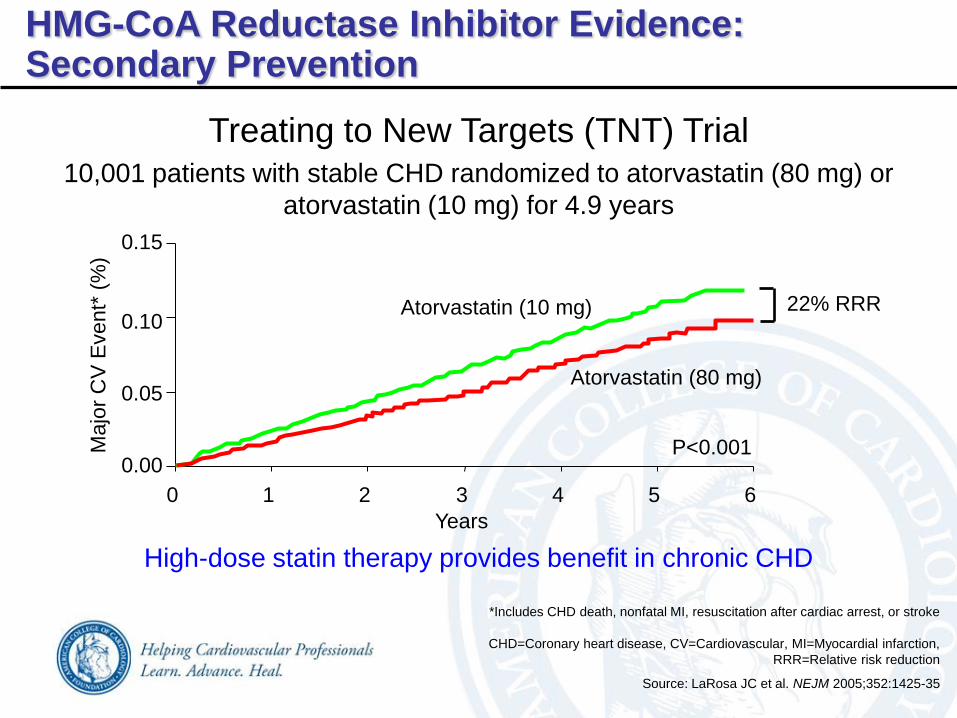
Treating to New Targets (TNT) Trial
CHD=Coronary heart disease, CV=Cardiovascular, MI=Myocardial infarction,
RRR=Relative risk reduction
Source: LaRosa JC et al. NEJM 2005;352:1425-35
*Includes CHD death, nonfatal MI, resuscitation after cardiac arrest, or stroke
HMG-CoA Reductase Inhibitor Evidence:Secondary Prevention
Years
Ma
jor
CV
Eve
nt*
(%
)
0 1 2 3 4 5 6
P<0.001
22% RRRAtorvastatin (10 mg)
0.00
0.05
0.10
0.15
Atorvastatin (80 mg)
10,001 patients with stable CHD randomized to atorvastatin (80 mg) or
atorvastatin (10 mg) for 4.9 years
High-dose statin therapy provides benefit in chronic CHD
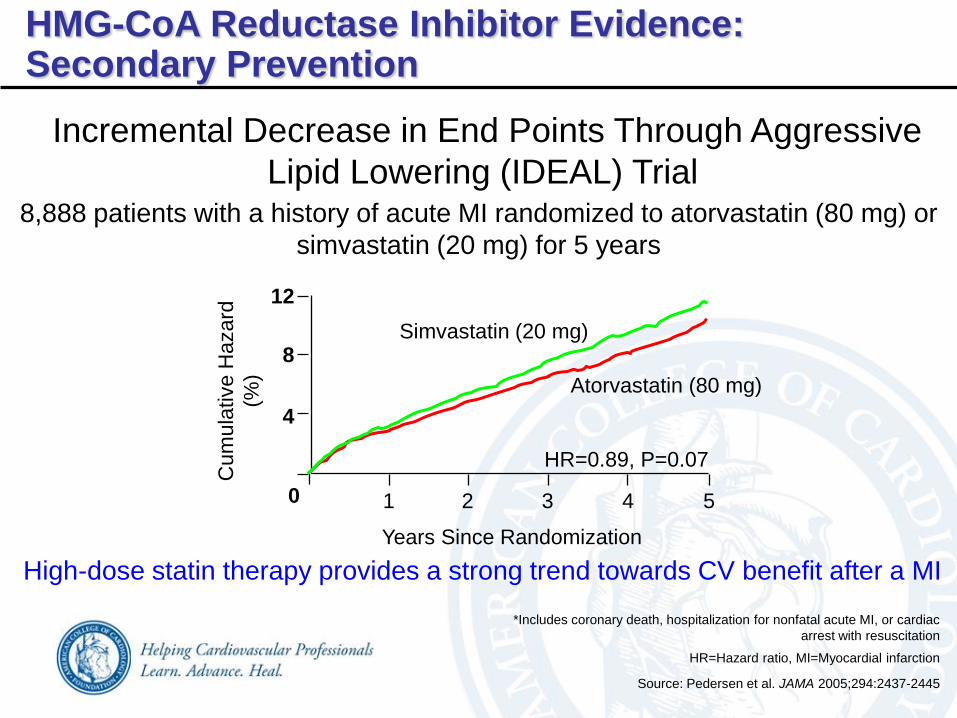
Incremental Decrease in End Points Through Aggressive
Lipid Lowering (IDEAL) Trial
Source: Pedersen et al. JAMA 2005;294:2437-2445
HR=Hazard ratio, MI=Myocardial infarction
*Includes coronary death, hospitalization for nonfatal acute MI, or cardiac
arrest with resuscitation
8,888 patients with a history of acute MI randomized to atorvastatin (80 mg) or
simvastatin (20 mg) for 5 years
High-dose statin therapy provides a strong trend towards CV benefit after a MI
HMG-CoA Reductase Inhibitor Evidence:Secondary Prevention
Cum
ula
tive H
azard
(%)
Years Since Randomization
0 1 2 3 4 5
4
8
12
HR=0.89, P=0.07
Simvastatin (20 mg)
Atorvastatin (80 mg)
Source: LaRosa JC et al. NEJM 2005;352:1425-1435
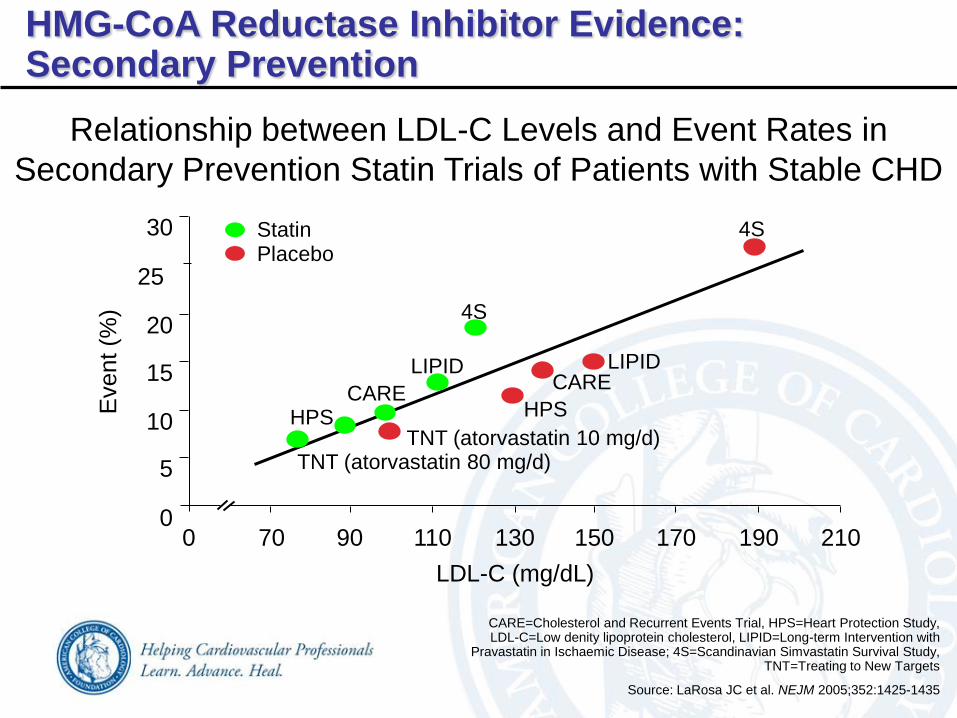
CARE=Cholesterol and Recurrent Events Trial, HPS=Heart Protection Study, LDL-C=Low denity lipoprotein cholesterol, LIPID=Long-term Intervention with
Pravastatin in Ischaemic Disease; 4S=Scandinavian Simvastatin Survival Study, TNT=Treating to New Targets
Relationship between LDL-C Levels and Event Rates in
Secondary Prevention Statin Trials of Patients with Stable CHD
HMG-CoA Reductase Inhibitor Evidence:Secondary Prevention
30
25
20
15
10
5
00 70 90 110 130 150 170 190 210
LDL-C (mg/dL)
TNT (atorvastatin 80 mg/d)TNT (atorvastatin 10 mg/d)
HPS
CARELIPIDLIPID
CAREHPS
Event (%
) 4S
4SStatinPlacebo
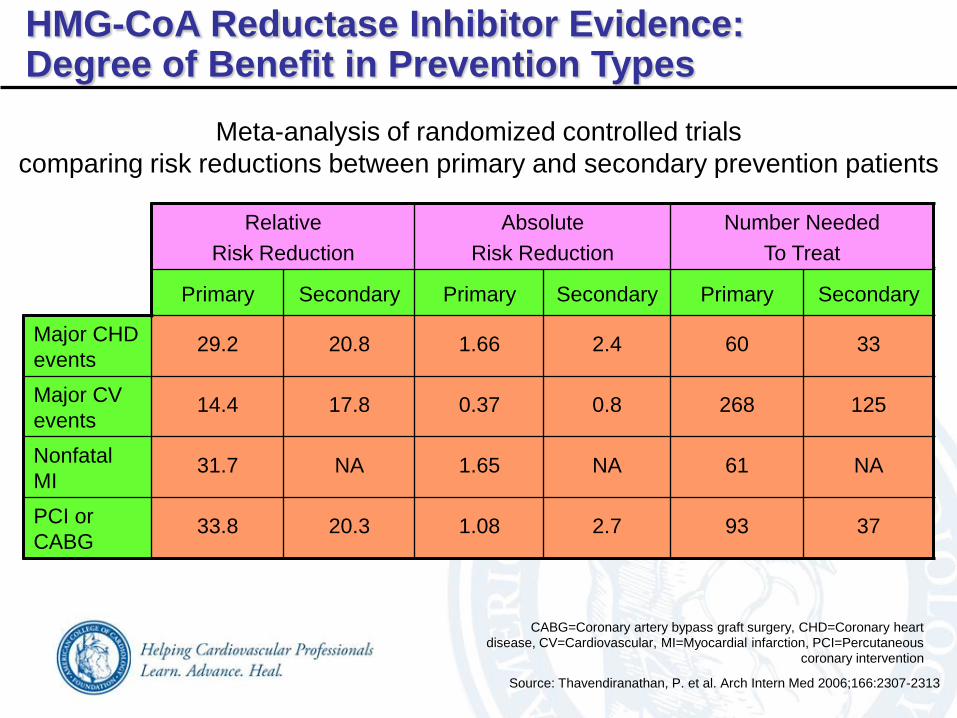
Source: Thavendiranathan, P. et al. Arch Intern Med 2006;166:2307-2313
Meta-analysis of randomized controlled trials
comparing risk reductions between primary and secondary prevention patients
Primary Secondary Primary Secondary Primary Secondary
Major CHD
events29.2 20.8 1.66 2.4 60 33
Major CV
events14.4 17.8 0.37 0.8 268 125
Nonfatal
MI31.7 NA 1.65 NA 61 NA
PCI or
CABG33.8 20.3 1.08 2.7 93 37
Relative
Risk Reduction
Absolute
Risk Reduction
Number Needed
To Treat
CABG=Coronary artery bypass graft surgery, CHD=Coronary heart disease, CV=Cardiovascular, MI=Myocardial infarction, PCI=Percutaneous
coronary intervention
HMG-CoA Reductase Inhibitor Evidence:Degree of Benefit in Prevention Types
Source: Cannon CP et al. JAMA 2005;294:2492-2494
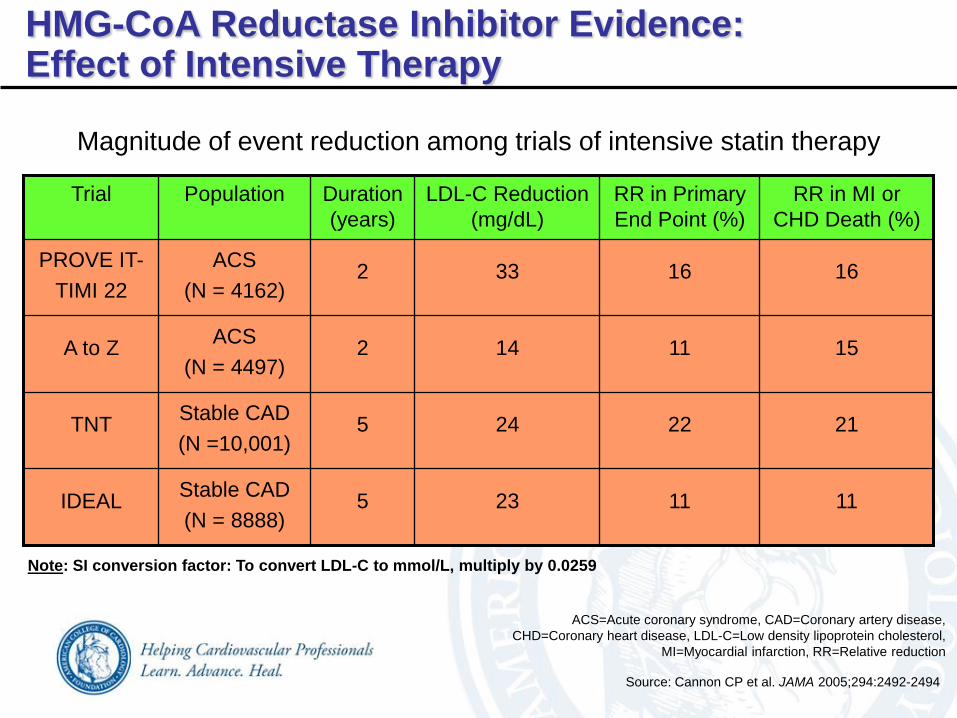
RR in MI or
CHD Death (%)
RR in Primary
End Point (%)
LDL-C Reduction
(mg/dL)
Duration
(years)
PopulationTrial
1111235Stable CAD
(N = 8888)IDEAL
2122245Stable CAD
(N =10,001)TNT
1511142ACS
(N = 4497)A to Z
1616332ACS
(N = 4162)
PROVE IT-
TIMI 22
Note: SI conversion factor: To convert LDL-C to mmol/L, multiply by 0.0259
ACS=Acute coronary syndrome, CAD=Coronary artery disease,
CHD=Coronary heart disease, LDL-C=Low density lipoprotein cholesterol,
MI=Myocardial infarction, RR=Relative reduction
HMG-CoA Reductase Inhibitor Evidence:Effect of Intensive Therapy
Magnitude of event reduction among trials of intensive statin therapy
Source: Kashani A et al. Circulation 2006;114:2788-97
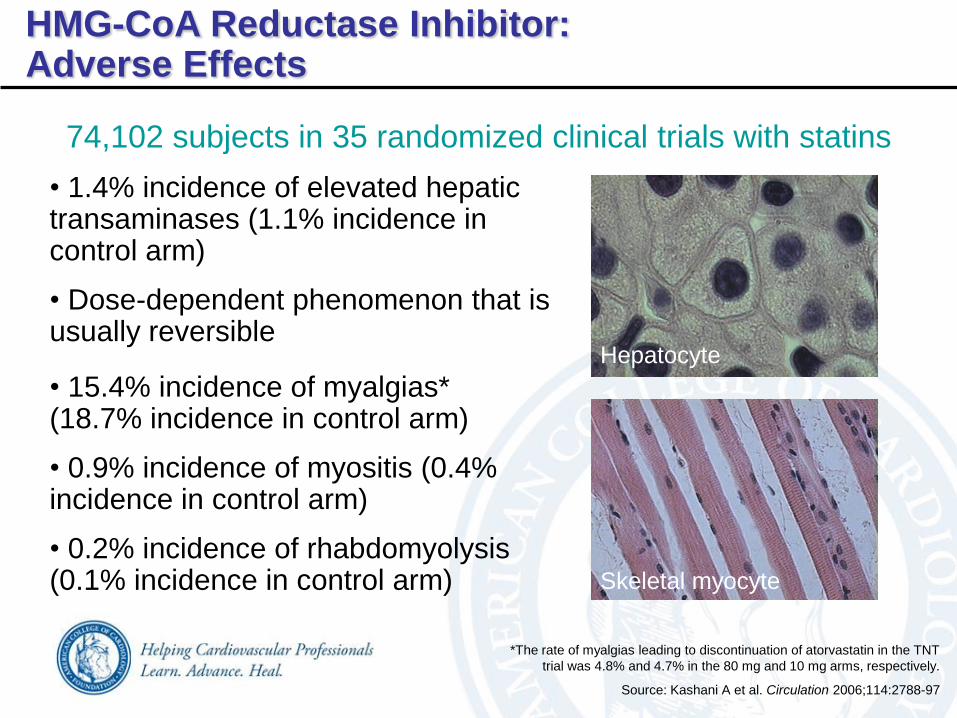
• 1.4% incidence of elevated hepatic transaminases (1.1% incidence in control arm)
• Dose-dependent phenomenon that is usually reversible
• 15.4% incidence of myalgias* (18.7% incidence in control arm)
• 0.9% incidence of myositis (0.4% incidence in control arm)
• 0.2% incidence of rhabdomyolysis (0.1% incidence in control arm)
74,102 subjects in 35 randomized clinical trials with statins
*The rate of myalgias leading to discontinuation of atorvastatin in the TNT
trial was 4.8% and 4.7% in the 80 mg and 10 mg arms, respectively.
HMG-CoA Reductase Inhibitor:Adverse Effects
Hepatocyte
Skeletal myocyte
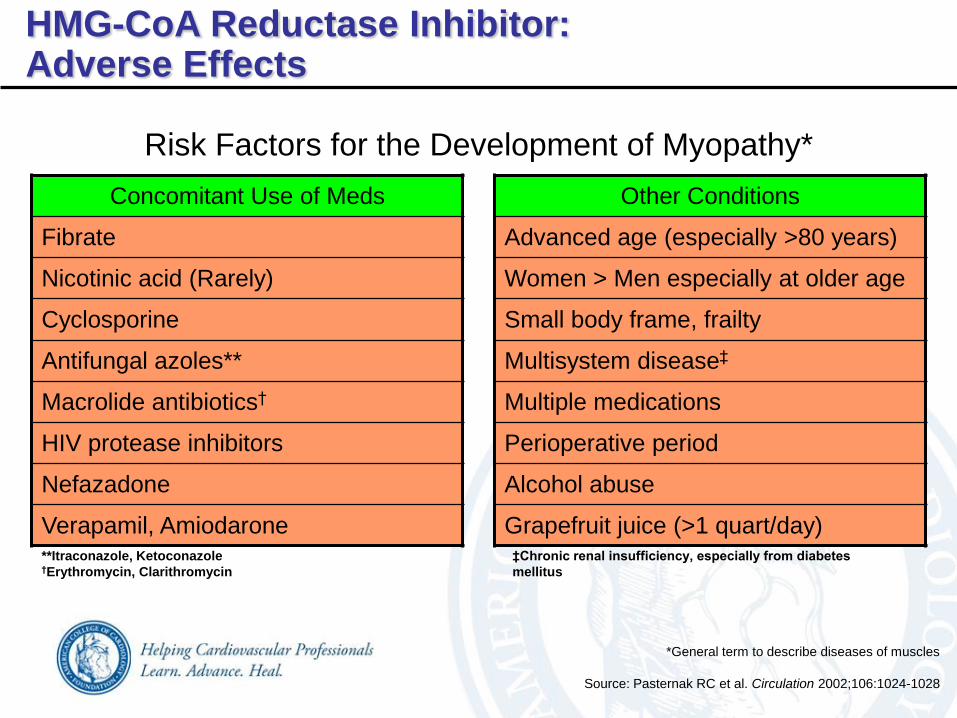
Concomitant Use of Meds
Fibrate
Nicotinic acid (Rarely)
Cyclosporine
Antifungal azoles**
Macrolide antibiotics†
HIV protease inhibitors
Nefazadone
Verapamil, Amiodarone
Other Conditions
Advanced age (especially >80 years)
Women > Men especially at older age
Small body frame, frailty
Multisystem disease‡
Multiple medications
Perioperative period
Alcohol abuse
Grapefruit juice (>1 quart/day)
Risk Factors for the Development of Myopathy*
Source: Pasternak RC et al. Circulation 2002;106:1024-1028
**Itraconazole, Ketoconazole†Erythromycin, Clarithromycin
HMG-CoA Reductase Inhibitor:Adverse Effects
‡Chronic renal insufficiency, especially from diabetes
mellitus
*General term to describe diseases of muscles
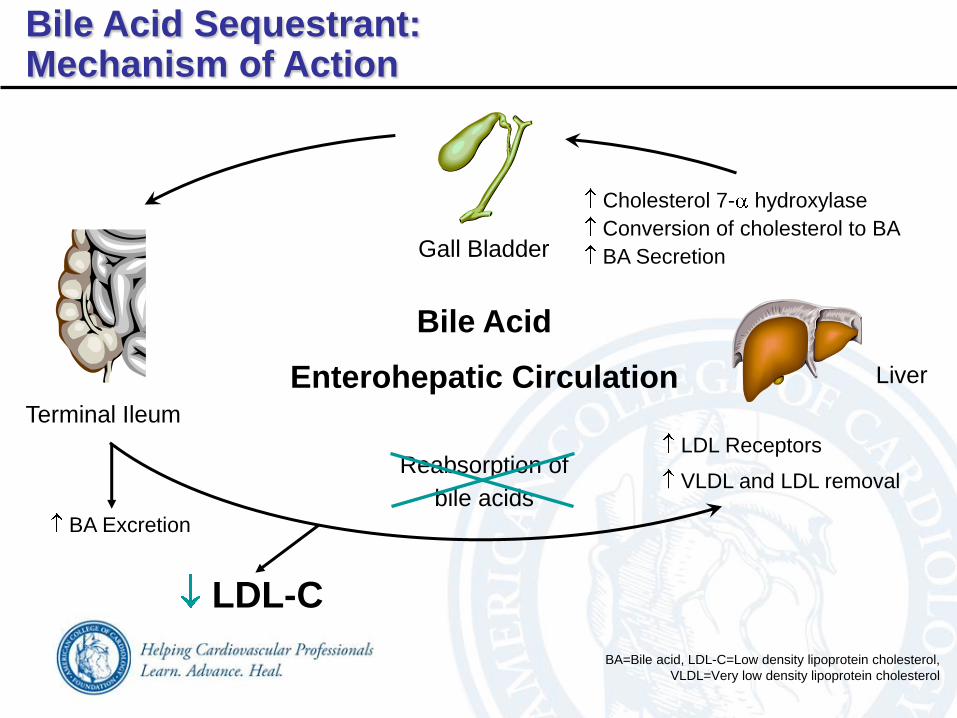
Gall Bladder
LDL Receptors
VLDL and LDL removal
Cholesterol 7- hydroxylase
Conversion of cholesterol to BA
BA Secretion
Liver
BA Excretion
Terminal Ileum
Bile Acid
Enterohepatic Circulation
Reabsorption of
bile acids
LDL-C
BA=Bile acid, LDL-C=Low density lipoprotein cholesterol,
VLDL=Very low density lipoprotein cholesterol
Bile Acid Sequestrant:Mechanism of Action
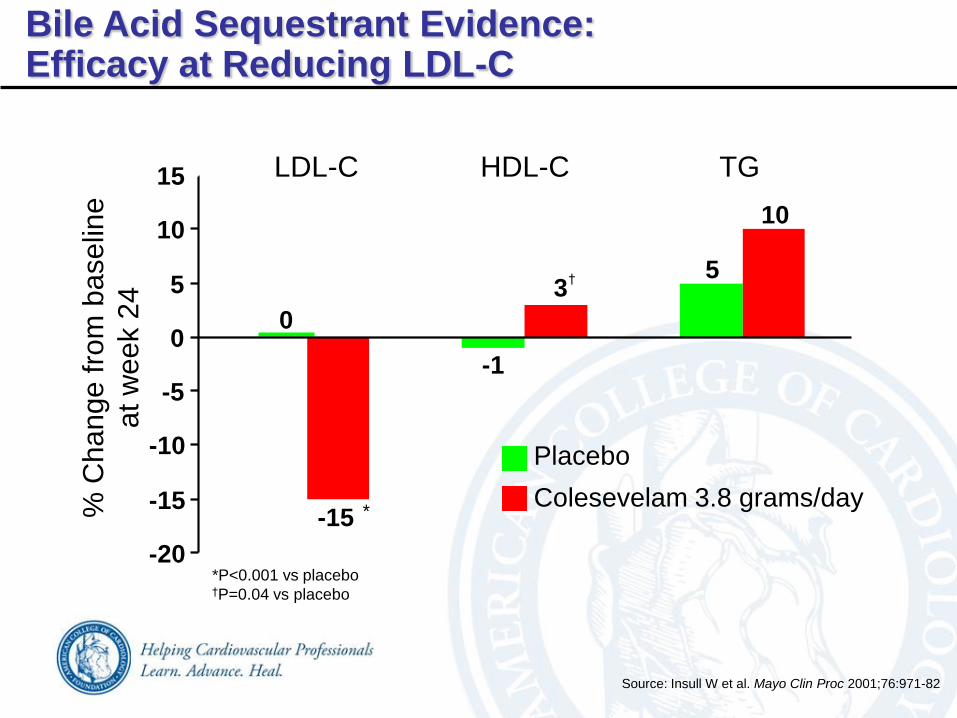
Source: Insull W et al. Mayo Clin Proc 2001;76:971-82
*P<0.001 vs placebo†P=0.04 vs placebo
% C
han
ge f
rom
baselin
e
at w
eek 2
4
TGHDL-CLDL-C
*
†
Placebo
Colesevelam 3.8 grams/day
Bile Acid Sequestrant Evidence:Efficacy at Reducing LDL-C
5
-1
0
10
3
-15
-20
-15
-10
-5
0
5
10
15

Lipid Research Clinics-Coronary Primary Prevention
Trial (LRC-CPPT)
Placebo
8.6
Cholestyramine
9
6
3
0
7.0
P<0.05
19% RRR
Rate
of
MI
or
CH
D
death
(%
)
Source: The LRC-CPPT Investigators. JAMA 1984;251:351-64
CHD=Coronary heart disease, MI=Myocardial infarction, RRR=Relative risk
reduction
3,806 men with primary hypercholesterolemia randomized to cholestyramine
(24 grams) or placebo for 7.4 years
A bile acid sequestrant provides benefit in those with high cholesterol levels
Bile Acid Sequestrant Evidence:Primary Prevention

Dietary cholesterol
Production in liver Absorption from intestine
Bloodstream
LDL-C VLDL
Cholesterolsynthesis
Biliary cholesterol
Chylomicrons
Fecal sterols and neutral sterols
Ezetimibe:Mechanism of Action
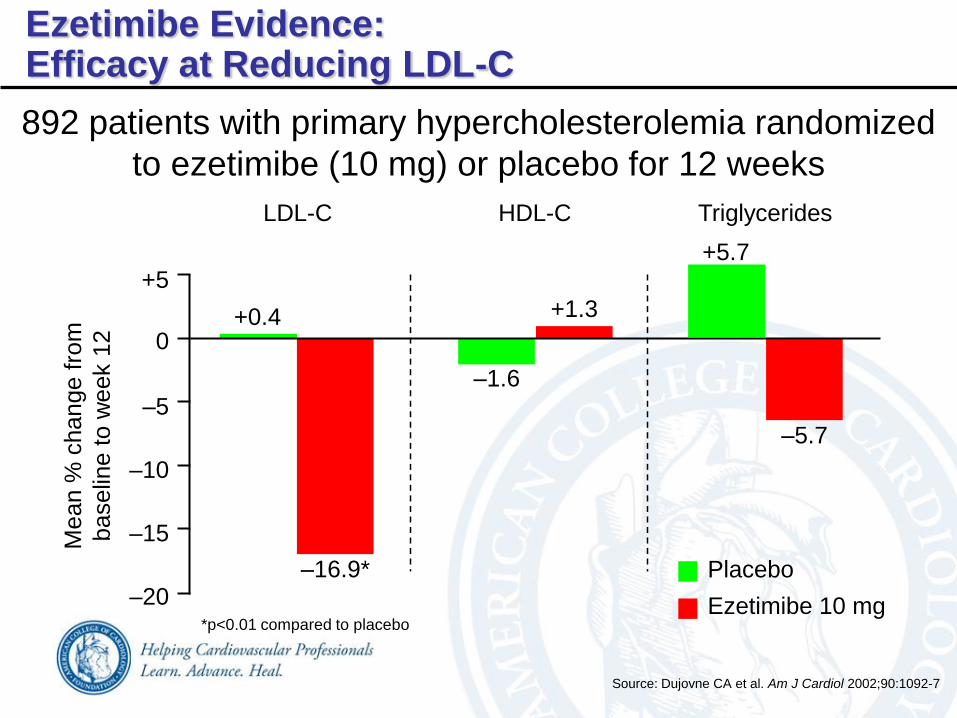
LDL-C
Mean %
change f
rom
baselin
e t
o w
eek 1
2
–20
–15
–10
–5
0
+5
–16.9*
+0.4
Triglycerides
–5.7
HDL-C
–1.6
+1.3
Placebo
Ezetimibe 10 mg
892 patients with primary hypercholesterolemia randomized
to ezetimibe (10 mg) or placebo for 12 weeks
*p<0.01 compared to placebo
Source: Dujovne CA et al. Am J Cardiol 2002;90:1092-7
Ezetimibe Evidence:Efficacy at Reducing LDL-C
+5.7

Therapy Dose (g/day) Effect
Dietary soluble fiber 5-10 (psyllium) LDL-C 10-15%
Soy protein 20-30 LDL-C 5-7%
Stanol esters 1.5-2 LDL-C 15-20%
Sources:
Kwiterovich Jr PO. Pediatrics 1995;96:1005-9
Lichtenstein AH. Curr Atheroscler Rep 1999;1:210-214
Miettinen TA et al. Ann Med 2004;36:126-34
Dietary Adjuncts Evidence:Efficacy at Reducing LDL-C

4.0
3.0
2.0
1.0
25 45 65HDL-C (mg/dL)
CH
D r
isk r
atio
2.0
1.0
0
4.0
Framingham Study
Source: Kannel WB. Am J Cardiol 1983;52:9B–12B
CHD=Coronary heart disease, HDL-C=High-density lipoprotein cholesterol
CHD Risk According to HDL-C Level

Decreased hepatic production of VLDL and uptake of apolipoprotein A-1 results in
reduced LDL-C levels and increased HDL-C levels
Liver Circulation
HDL
Serum VLDL
results in reduced
lipolysis to LDL
Serum LDL
VLDL
VLDL
secretion
Apo B
Hepatocyte Systemic Circulation
Mobilization of FFA
TG
synthesis
VLDL
LDL
FFA=Free fatty acids, HDL=High density lipoprotein, LDL=Low density
lipoprotein, TG=Triglyceride, VLDL=Very low density lipoprotein
Nicotinic Acid:Mechanism of Action
Source: McKenney JM. Selecting Successful Lipid-lowering Treatments presentation,
2002. Available at http://www.lipidsonline.org/slides/slide01.cfm?tk=23&dpg=14

Me
an
ch
an
ge
fro
m B
ase
line
Source: Goldberg A et al. Am J Cardiol 2000;85:1100-1105
500
HDL-C
LDL-C
TG
–9%
–14%
–22% –21%–17%
30%30%26%
22%15%
10%
–28%
–35%
–44%–39%
–11%
–5%
1000 1500 2000 2500Dose (mg) 3000
Nicotinic Acid Evidence:Effect on Lipid Parameters
-50
-40
-30
-20
-10
0
10
20
30
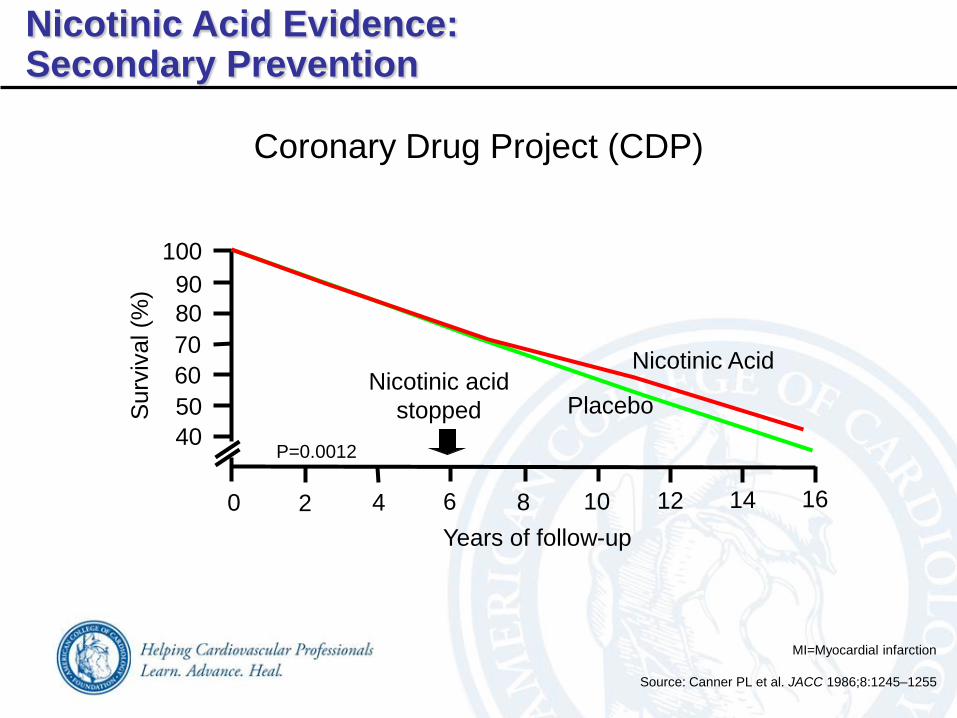
P=0.0012
100
90
80
70
60
50
40
0 2 4 6 8 10 12 14 16
Years of follow-up
Surv
ival (%
)
Source: Canner PL et al. JACC 1986;8:1245–1255
Nicotinic acid
stopped
Coronary Drug Project (CDP)
Nicotinic Acid
MI=Myocardial infarction
Nicotinic Acid Evidence:Secondary Prevention
Placebo
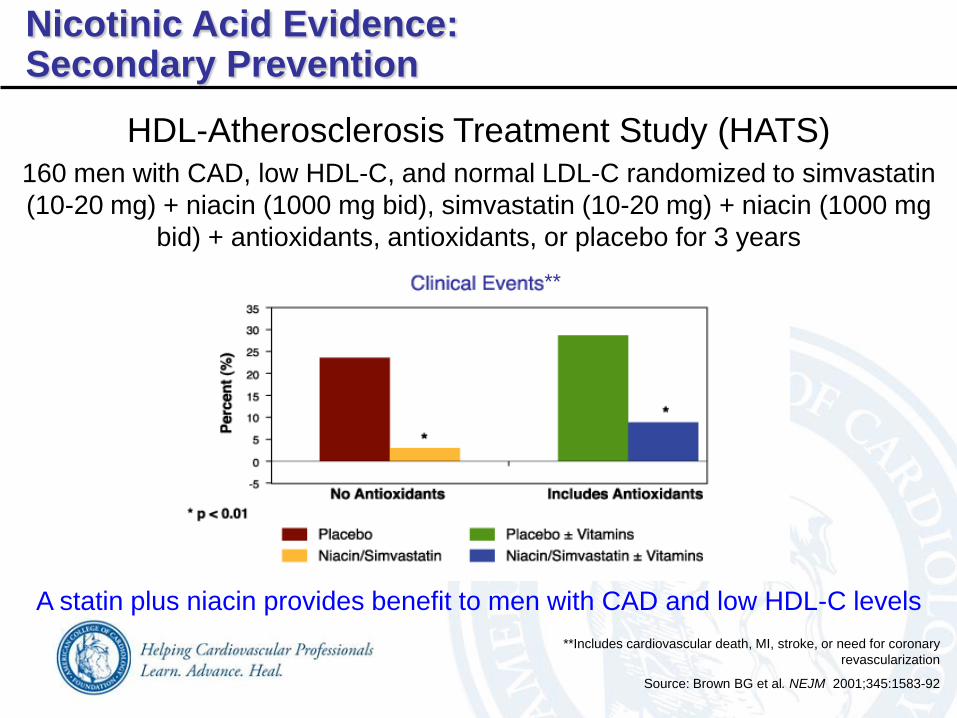
Source: Brown BG et al. NEJM 2001;345:1583-92
HDL-Atherosclerosis Treatment Study (HATS)
**
**Includes cardiovascular death, MI, stroke, or need for coronary
revascularization
Nicotinic Acid Evidence:Secondary Prevention
160 men with CAD, low HDL-C, and normal LDL-C randomized to simvastatin
(10-20 mg) + niacin (1000 mg bid), simvastatin (10-20 mg) + niacin (1000 mg
bid) + antioxidants, antioxidants, or placebo for 3 years
A statin plus niacin provides benefit to men with CAD and low HDL-C levels
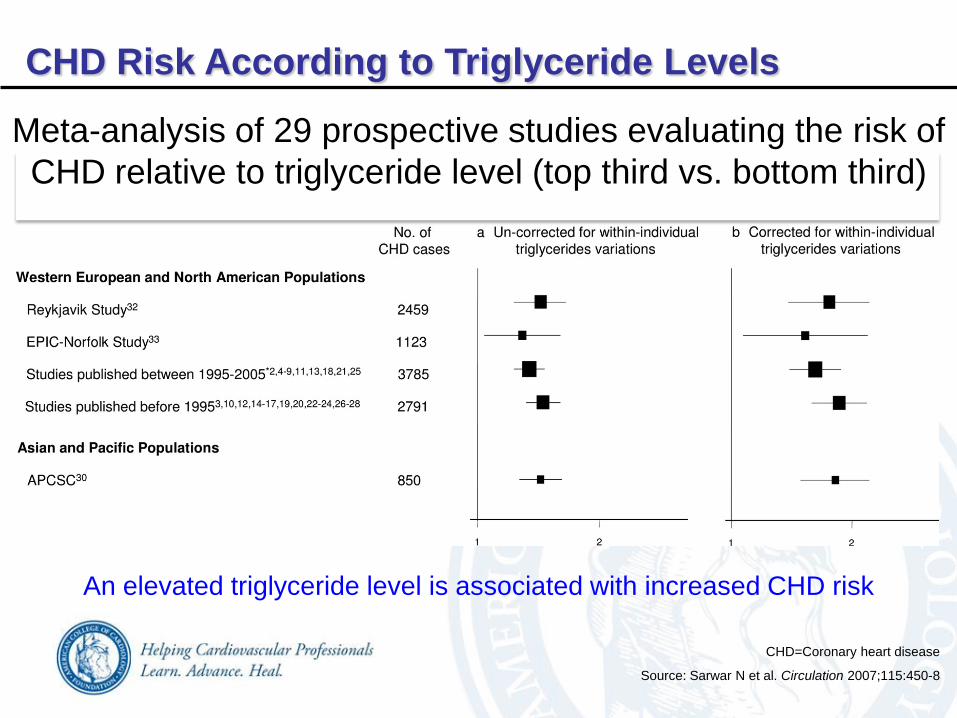
Source: Sarwar N et al. Circulation 2007;115:450-8
CHD=Coronary heart disease
CHD Risk According to Triglyceride Levels
Meta-analysis of 29 prospective studies evaluating the risk of
CHD relative to triglyceride level (top third vs. bottom third)
An elevated triglyceride level is associated with increased CHD risk
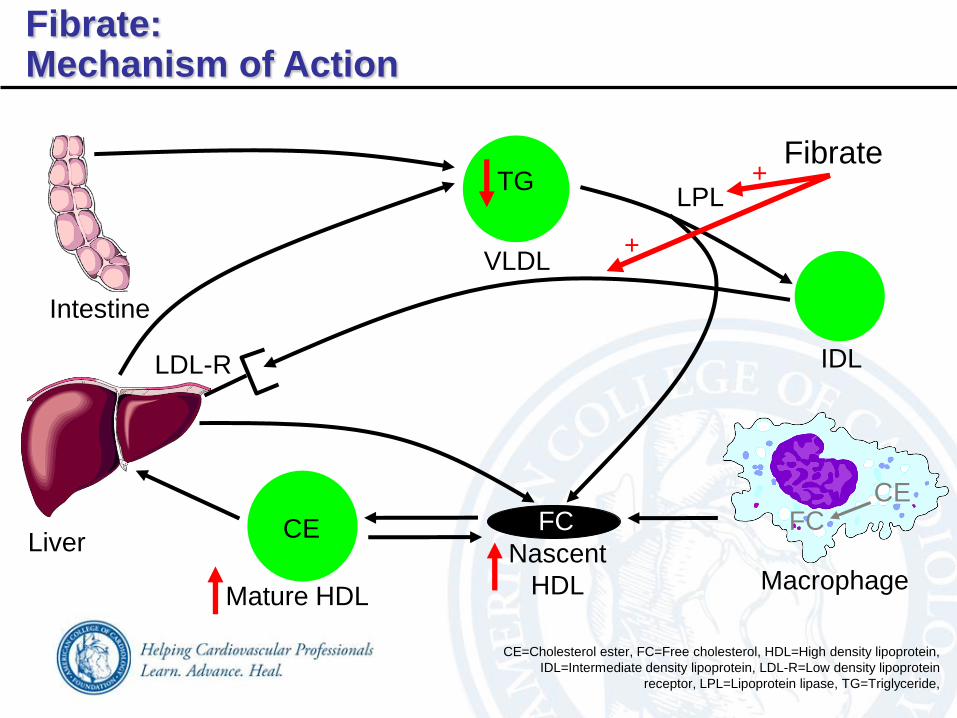
Liver
TG
IDL
VLDL
LPL
CE
CE FCFC
MacrophageMature HDL
Nascent
HDL
LDL-R
Intestine
CE=Cholesterol ester, FC=Free cholesterol, HDL=High density lipoprotein,
IDL=Intermediate density lipoprotein, LDL-R=Low density lipoprotein
receptor, LPL=Lipoprotein lipase, TG=Triglyceride,
Fibrate+
+
Fibrate:Mechanism of Action
Source: Knopp RH et al. Am J Med 1987;83:50-9
-20*
+11*
-38*
+15*
-45*
-60
-50
-40
-30
-20
-10
0
10
20
30
40
50Type IIa hyperlipidemia Type IIb hyperlipidemia
Me
an %
change f
rom
baselin
e
HDL=High density lipoprotein cholesterol,
LDL=Low density lipoprotein cholesterol, TG=Triglyceride
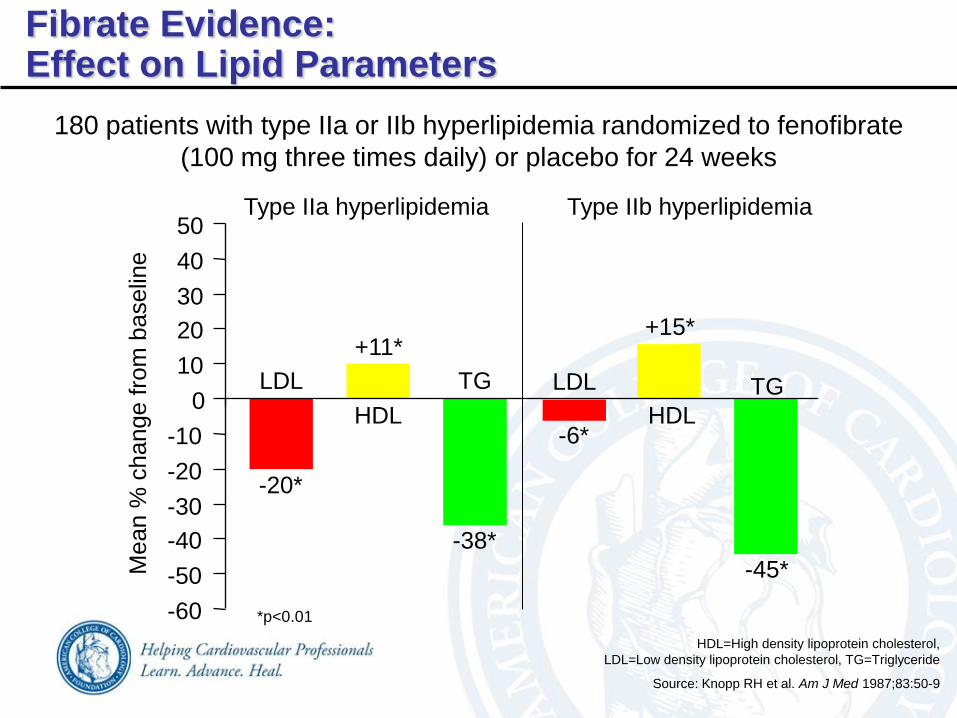
180 patients with type IIa or IIb hyperlipidemia randomized to fenofibrate
(100 mg three times daily) or placebo for 24 weeks
LDL TG
HDL
TG
HDL
Fibrate Evidence:Effect on Lipid Parameters
-6*
LDL
*p<0.01

Sources:
Frick MH et al. NEJM 1987;317:1237-1245
Manninen V et al. Circulation 1992;85:37-45
BIP Study Group. Circulation 2000;102:21-27
Rubins HB et al. NEJM 1999;341:410-418
*Post hoc analysis of subgroup with TG >200 mg/dL and HDL-C <42 mg/dL
**Post hoc analysis of subgroup with TG 200 mg/dL and HDL-C <35 mg/dL
***Difference between placebo and Rx for primary endpoint was statistically significant (p < 0.05)
0
5
10
15
20
25
30
% C
HD
De
ath
/No
nfa
tal M
I Rx
Placebo
2.7 4.1*** 2.7
8
13.615
13
22
17
22***
66%
34%
9%
42%
22%
PRIMARY PREVENTION SECONDARY PREVENTIONHHS HHS* BIP BIP** VA-HIT
Fibrate Evidence:Primary and Secondary Prevention
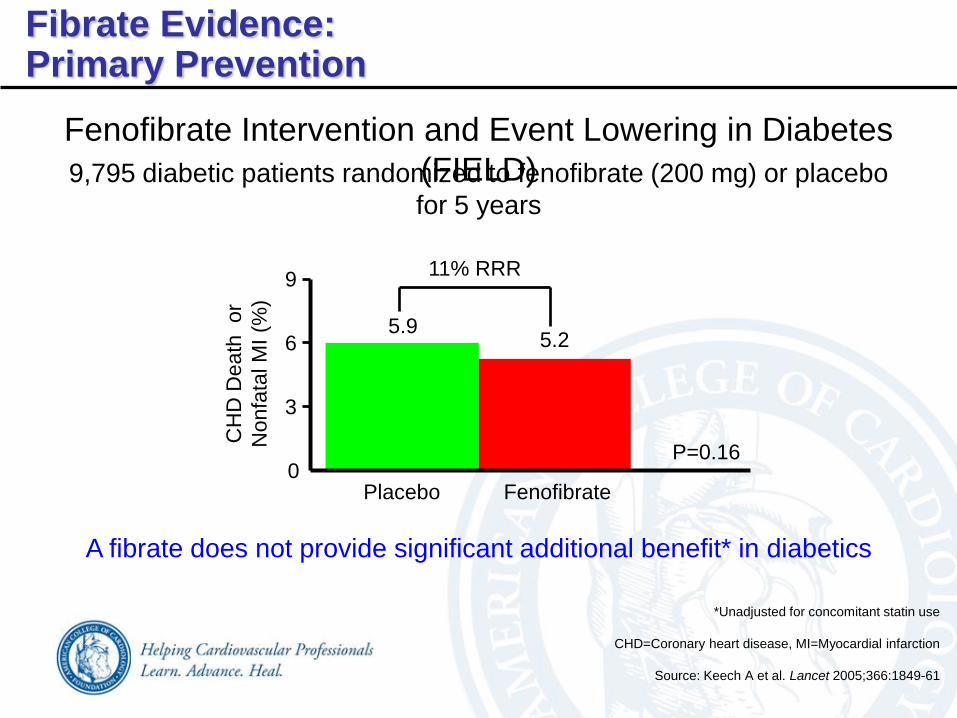
Fenofibrate Intervention and Event Lowering in Diabetes
(FIELD)
CH
D D
eath
or
Nonfa
tal M
I (%
)
Placebo
5.9
Fenofibrate
9
6
3
0
5.2
P=0.16
11% RRR
9,795 diabetic patients randomized to fenofibrate (200 mg) or placebo
for 5 years
A fibrate does not provide significant additional benefit* in diabetics
Source: Keech A et al. Lancet 2005;366:1849-61
*Unadjusted for concomitant statin use
CHD=Coronary heart disease, MI=Myocardial infarction
Fibrate Evidence:Primary Prevention
Fibrate Evidence:Primary and Secondary Prevention
Action to Control Cardiovascular Risk in Diabetes
(ACCORD) Lipid Trial5,518 diabetic patients on statin therapy randomized to fenofibrate
(160 mg) or placebo for 4.7 years
On a background of statin therapy, a fibrate does not reduce CV events
in diabetics
CV
death
, nonfa
tal
str
oke o
r nonfa
tal
MI (%
/yea
r)
Placebo
2.4
Fenofibrate
3
2
1
0
2.2
P=0.32
8% RRR
Source: ACCORD study group. NEJM 2010;Epub ahead of print
CV=Cardiovascular, MI=Myocardial infarction, RRR=Relative risk reduction

HDL-C=High-density lipoprotein cholesterol, LDL-C=Low-density lipoprotein
cholesterol, TC=Total cholesterol, TG=Triglycerides
Good- 9%+ 1%- 18%- 13%Ezetimibe
Good- 14-29%+ 4-12%- 25-50%- 19-37%Statins*
Good- 30%+ 11-13%- 4-21%- 19%Fibrates
Reasonable
to Poor- 30-70%+ 14-35%- 10-20%- 10-20%Nicotinic acid
PoorNeutral or + 3%- 10-18%- 7-10%Bile acid
sequestrants
Patient
tolerabilityTGHDL-CLDL-CTCTherapy
Effect of Pharmacotherapyon Lipid Parameters
*Daily dose of 40mg of each drug, excluding rosuvastatin
% R
ed
uctio
n
Triglyceride
*P<0.05
-10
-20
-30
-40
-50
0
-46*
-21*
Total Cholesterol
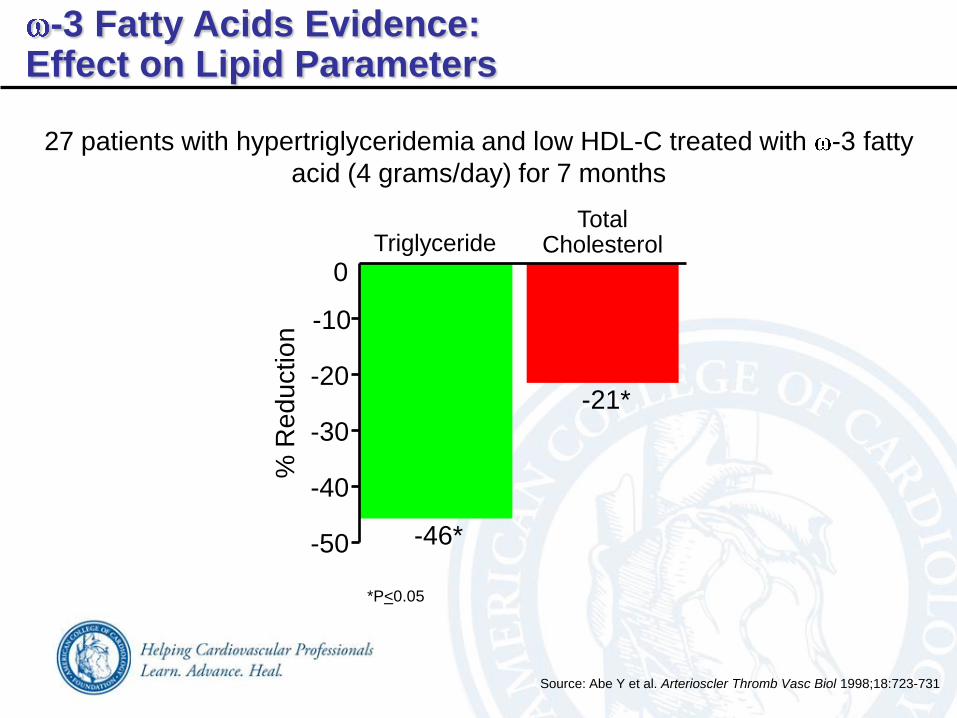
Source: Abe Y et al. Arterioscler Thromb Vasc Biol 1998;18:723-731
27 patients with hypertriglyceridemia and low HDL-C treated with -3 fatty
acid (4 grams/day) for 7 months
-3 Fatty Acids Evidence:Effect on Lipid Parameters
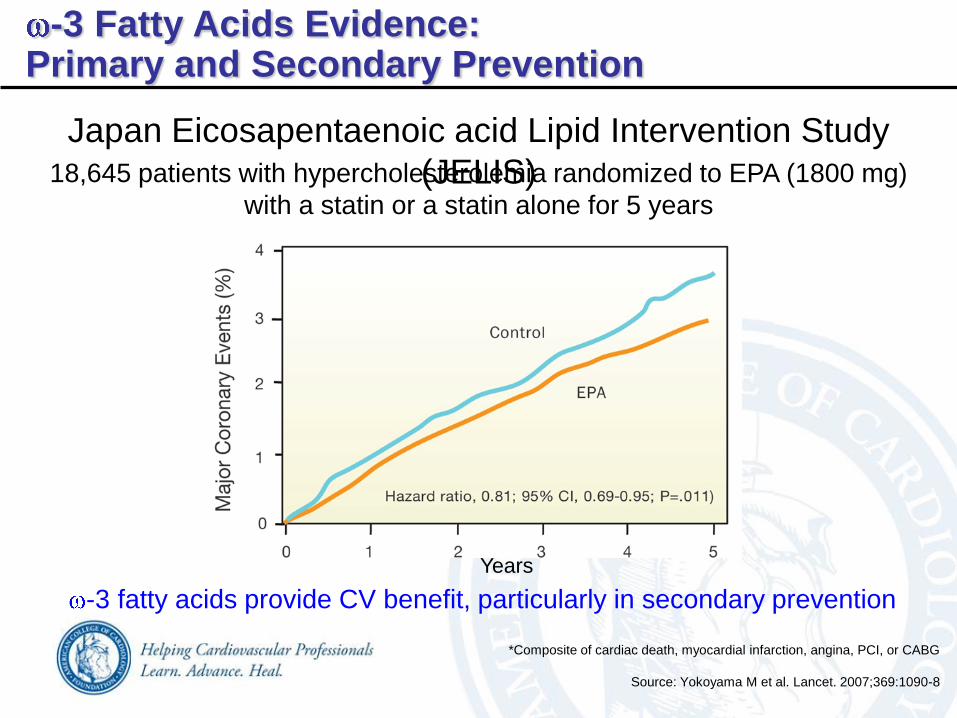
Source: Yokoyama M et al. Lancet. 2007;369:1090-8
Japan Eicosapentaenoic acid Lipid Intervention Study
(JELIS)
*Composite of cardiac death, myocardial infarction, angina, PCI, or CABG
Years
-3 Fatty Acids Evidence:Primary and Secondary Prevention
18,645 patients with hypercholesterolemia randomized to EPA (1800 mg)
with a statin or a statin alone for 5 years
-3 fatty acids provide CV benefit, particularly in secondary prevention
-3 Fatty Acids Evidence:Secondary Prevention
**p<0.05
0.0%
1.0%
2.0%
3.0%
4.0%
5.0%
6.0%
7.0%
8.0%
N-3 Fatty Acids
Placebo
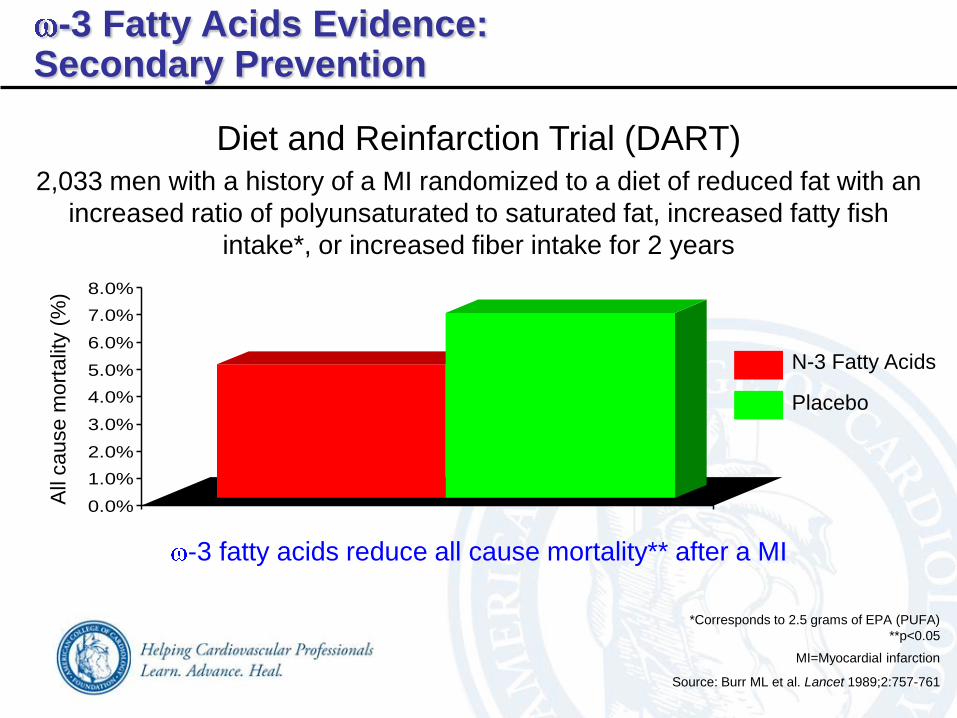
Source: Burr ML et al. Lancet 1989;2:757-761
Diet and Reinfarction Trial (DART)
All
cause m
ort
alit
y (
%)
2,033 men with a history of a MI randomized to a diet of reduced fat with an
increased ratio of polyunsaturated to saturated fat, increased fatty fish
intake*, or increased fiber intake for 2 years
-3 fatty acids reduce all cause mortality** after a MI
*Corresponds to 2.5 grams of EPA (PUFA)
MI=Myocardial infarction
11,324 patients with a history of a MI randomized to -3 polyunsaturated
fatty acids [PUFA] (1 gram), vitamin E (300 mg), both or none for 3.5 years
-3 fatty acids provide significant CV benefit after a MI
Source: GISSI Investigators. Lancet 1999;354:447-455
-3 Fatty Acids Evidence:Secondary Prevention
Gruppo Italiano per lo Studio della Sopravvivenza nell’Infarto
miocardico (GISSI-Prevenzione)
CV=Cardiovascular, MI=Myocardial infarction, NF=Non-fatal
Perc
ent of
patients
P=0.048P=0.053
P=0.023
P=0.008
stroke stroke
02468
10121416
Death,
NF MI,
NF stroke
(2 way)
CV
death,
NF MI,
and NF
Death,
NF MI,
NF stroke
(4 way)
CV
death,
NF MI,
and NF
N-3 PUFA
Placebo
3,827 patients 3-14 days following a MI randomized to -3 fatty acids (460
mg EPA + 380 mg DHA) or placebo for 1 year
-3 fatty acids provide no benefit following a MI in those with high
utilization of risk reducing therapies
OMEGA Trial
Source: Senges J et al. Presented at the Annual Scientific Sessions of the
American College of Cardiology, March 2009, Orlando, FL
Placebo
8.8
Fatty acids
12
8
4
0
10.4
P=0.10Rate
of
rein
farc
tion,
str
oke,
or
death
* (%
)
MI=Myocardial infarction
*This is a secondary endpoint
-3 Fatty Acids Evidence:Secondary Prevention

0 10 20
2 RFs
0-1 RFs
CAD or Risk
Equivalent**
A risk assessment tool* is needed for individuals with >2 RFs
Source: Expert Panel on Detection, Evaluation, and Treatment of High Blood Cholesterol
in Adults. JAMA 2001;285:2486-97
CAD=Coronary artery disease, CHD=Coronary heart disease,
DM=Diabetes mellitus, RF=Risk factor
**Includes DM, non-coronary atherosclerotic vascular disease, and
>20% 10-year CHD risk by the FRS*Such as the Framingham Risk Score (FRS)
10-year CHD Risk
Risk Assessment forLDL-C Lowering
Years Points
20-34 -9
35-39 -4
40-44 0
45-49 3
50-54 6
55-59 8
60-64 10
65-69 11
70-74 12
75-79 13
Step 1: Age Points
TC (mg/dl)
Age 20-39
Age 40-49
Age 50-59
Age 60-69
Age 70-79
<160 0 0 0 0 0
160-199 4 3 2 1 0
200-239 7 5 3 1 0
240-279 9 6 4 2 1
>280 11 8 5 3 1
Step 2: Total Cholesterol Points
HDL-C (mg/dl) Points
>60 -1
50-59 0
40-49 1
<40 2
Step 3: HDL-C Points
SBP (mmHg)
If untreated
If treated
<120 0 0
120-129 0 1
130-139 1 2
140-159 1 2
>160 2 3
Step 4: SBP Points
Age 20-39
Age 40-49
Age 50-59
Age 60-69
Age 70-79
Nonsmoker 0 0 0 0 0
Smoker 8 5 3 1 1
Step 5: Smoking Status Points
Age
Total Cholesterol
HDL-C
Systolic Blood Pressure
Smoking Status
Point Total
Step 6: Sum of Points
Point Total
10-year Risk
Point Total
10-year Risk
Point Total
10-year Risk
<0 <1% 6 2% 13 12%
0 1% 7 3% 14 16%
1 1% 8 4% 15 20%
2 1% 9 5% 16 25%
3 1% 10 6% >17 >30%
4 1% 11 8%
5 2% 12 10%
Step 7: 10-year CHD Risk
Risk Stratification:Framingham Risk Score for Men
Source: Framingham Heart Study. Hard Coronary Heart Disease (10-year risk). Available at
http://www.framinghamheartstudy.org/risk/hrdcoronary.html.
Step 1: Age Points
TC (mg/dl)
Age 20-39
Age 40-49
Age 50-59
Age 60-69
Age 70-79
<160 0 0 0 0 0
160-199 4 3 2 1 1
200-239 8 6 4 2 1
240-279 11 8 5 3 2
>280 13 10 7 4 2
Step 2: Total Cholesterol Points
HDL-C (mg/dl) Points
>60 -1
50-59 0
40-49 1
<40 2
Step 3: HDL-C Points
SBP (mmHg)
If untreated
If treated
<120 0 0
120-129 1 3
130-139 2 4
140-159 3 5
>160 4 6
Step 4: SBP Points
Age 20-39
Age 40-49
Age 50-59
Age 60-69
Age 70-79
Nonsmoker 0 0 0 0 0
Smoker 9 7 4 2 1
Step 5: Smoking Status Points
Age
Total Cholesterol
HDL-C
Systolic Blood Pressure
Smoking Status
Point Total
Step 6: Sum of Points
Point Total
10-year Risk
Point Total
10-year Risk
Point Total
10-year Risk
<9 <1% 15 3% 22 17%
9 1% 16 4% 23 22%
10 1% 17 5% 24 27%
11 1% 18 6% >25 >30%
12 1% 19 8%
13 2% 20 11%
14 2% 21 14%
Step 7: 10-year CHD Risk
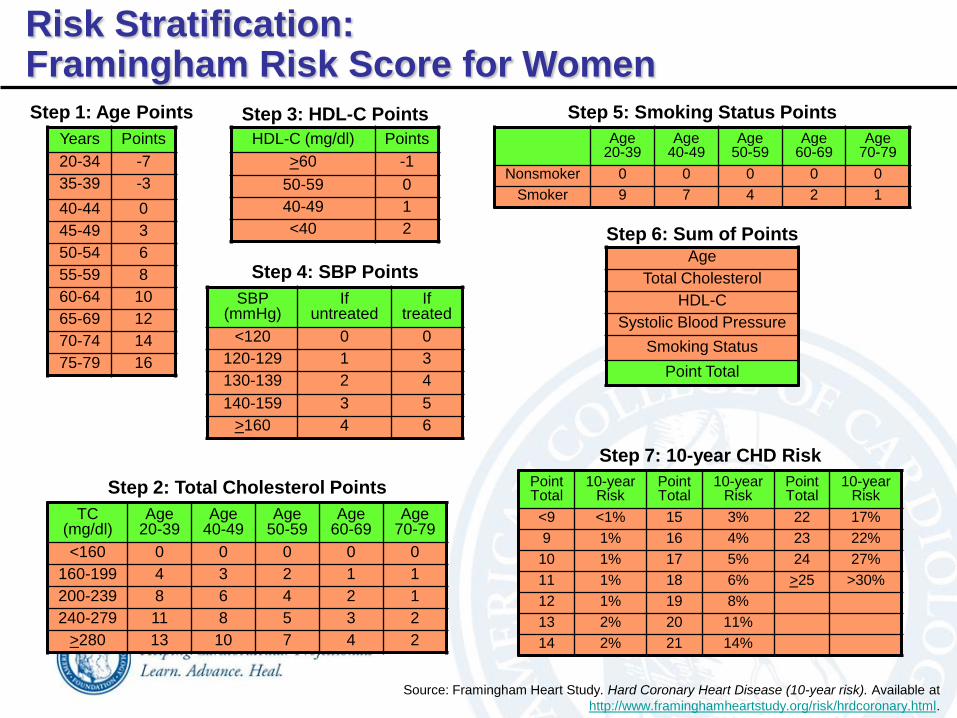
Risk Stratification:Framingham Risk Score for Women
Years Points
20-34 -7
35-39 -3
40-44 0
45-49 3
50-54 6
55-59 8
60-64 10
65-69 12
70-74 14
75-79 16
Source: Framingham Heart Study. Hard Coronary Heart Disease (10-year risk). Available at
http://www.framinghamheartstudy.org/risk/hrdcoronary.html.
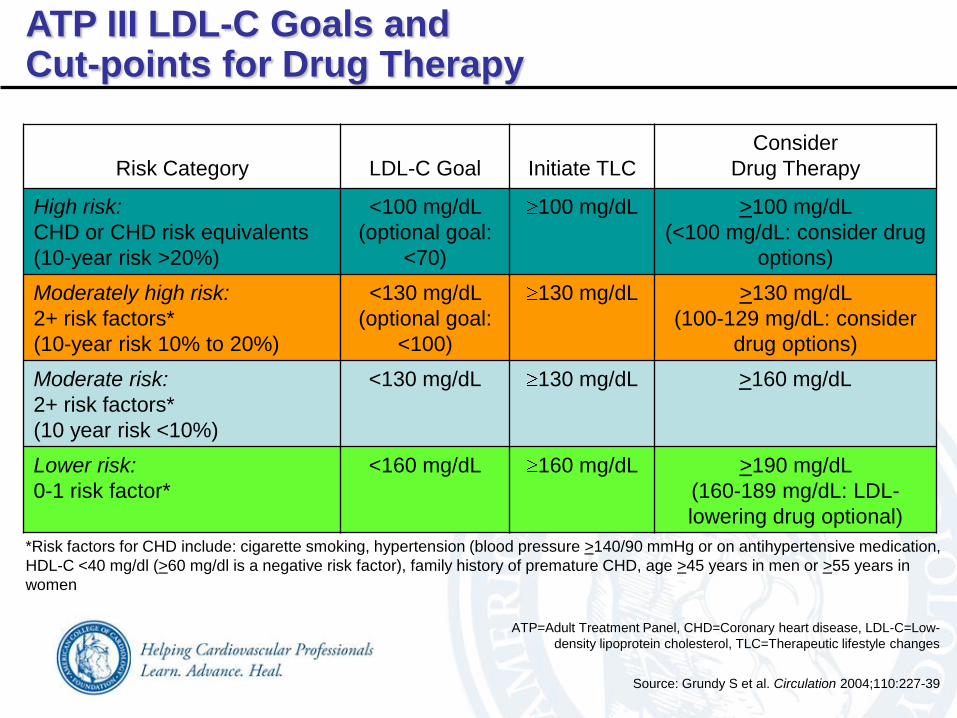
Risk Category LDL-C Goal Initiate TLC
Consider
Drug Therapy
High risk:
CHD or CHD risk equivalents
(10-year risk >20%)
<100 mg/dL
(optional goal:
<70)
100 mg/dL >100 mg/dL
(<100 mg/dL: consider drug
options)
Moderately high risk:
2+ risk factors*
(10-year risk 10% to 20%)
<130 mg/dL
(optional goal:
<100)
130 mg/dL >130 mg/dL
(100-129 mg/dL: consider
drug options)
Moderate risk:
2+ risk factors*
(10 year risk <10%)
<130 mg/dL 130 mg/dL >160 mg/dL
Lower risk:
0-1 risk factor*
<160 mg/dL 160 mg/dL >190 mg/dL
(160-189 mg/dL: LDL-
lowering drug optional)
Source: Grundy S et al. Circulation 2004;110:227-39
ATP=Adult Treatment Panel, CHD=Coronary heart disease, LDL-C=Low-
density lipoprotein cholesterol, TLC=Therapeutic lifestyle changes
*Risk factors for CHD include: cigarette smoking, hypertension (blood pressure >140/90 mmHg or on antihypertensive medication,
HDL-C <40 mg/dl (>60 mg/dl is a negative risk factor), family history of premature CHD, age >45 years in men or >55 years in
women
ATP III LDL-C Goals andCut-points for Drug Therapy
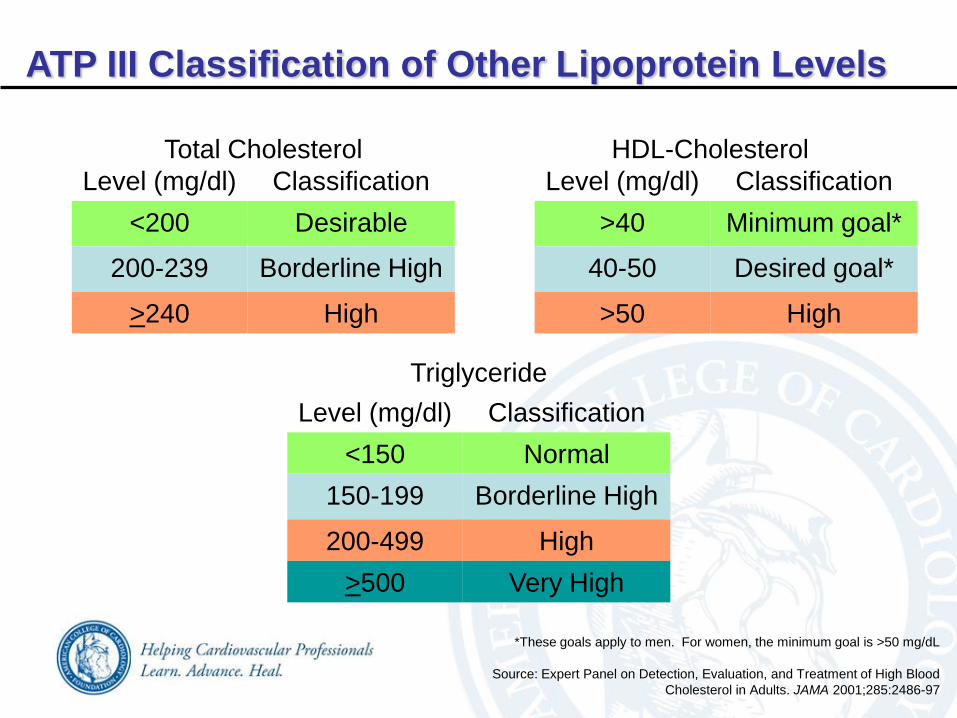
Level (mg/dl) Classification
<200 Desirable
200-239 Borderline High
>240 High
Level (mg/dl) Classification
>40 Minimum goal*
40-50 Desired goal*
>50 High
Level (mg/dl) Classification
<150 Normal
150-199 Borderline High
200-499 High
>500 Very High
Total Cholesterol HDL-Cholesterol
Triglyceride
Source: Expert Panel on Detection, Evaluation, and Treatment of High Blood
Cholesterol in Adults. JAMA 2001;285:2486-97
ATP III Classification of Other Lipoprotein Levels
*These goals apply to men. For women, the minimum goal is >50 mg/dL
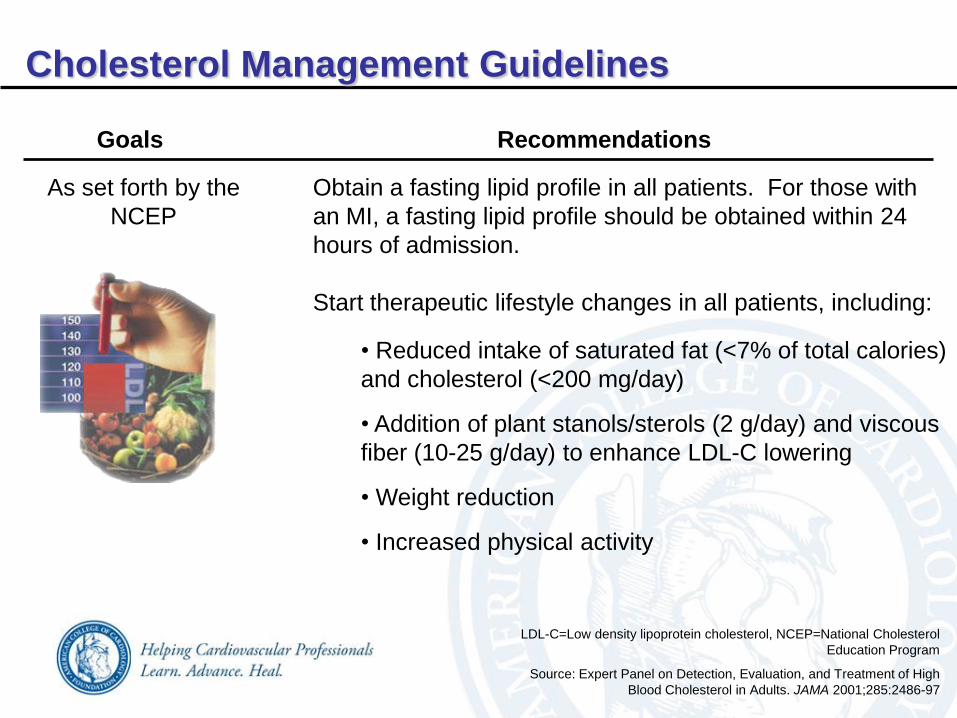
Goals Recommendations
As set forth by the
NCEP
Obtain a fasting lipid profile in all patients. For those with
an MI, a fasting lipid profile should be obtained within 24
hours of admission.
Start therapeutic lifestyle changes in all patients, including:
• Reduced intake of saturated fat (<7% of total calories)
and cholesterol (<200 mg/day)
• Addition of plant stanols/sterols (2 g/day) and viscous
fiber (10-25 g/day) to enhance LDL-C lowering
• Weight reduction
• Increased physical activity
Source: Expert Panel on Detection, Evaluation, and Treatment of High
Blood Cholesterol in Adults. JAMA 2001;285:2486-97
LDL-C=Low density lipoprotein cholesterol, NCEP=National Cholesterol
Education Program
Cholesterol Management Guidelines
Goals Recommendations
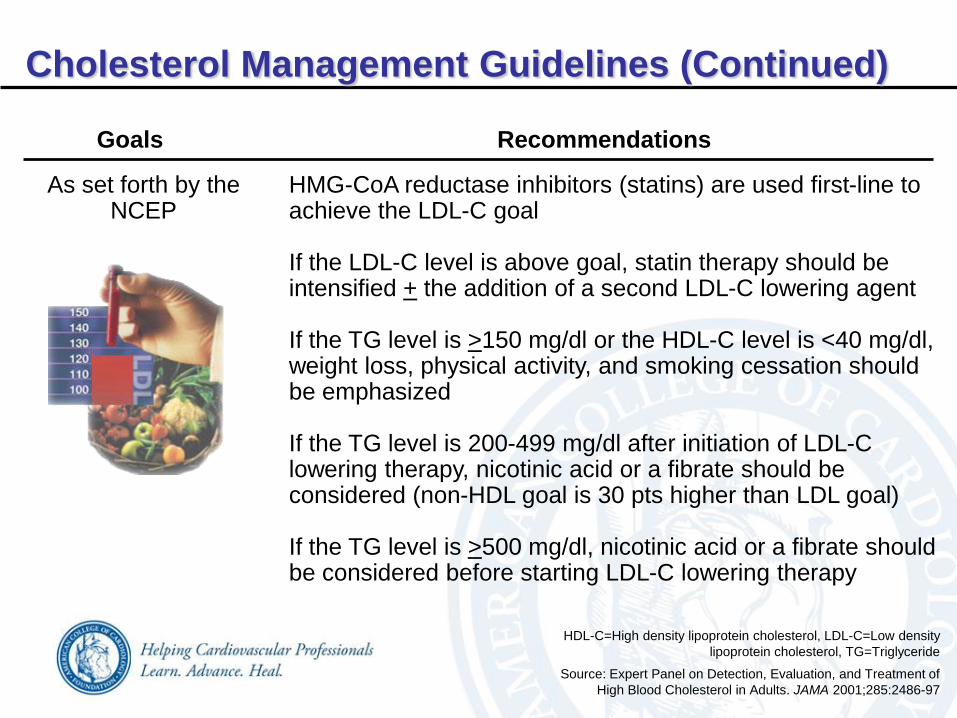
As set forth by the NCEP
HMG-CoA reductase inhibitors (statins) are used first-line to achieve the LDL-C goal
If the LDL-C level is above goal, statin therapy should be intensified + the addition of a second LDL-C lowering agent
If the TG level is >150 mg/dl or the HDL-C level is <40 mg/dl, weight loss, physical activity, and smoking cessation should be emphasized
If the TG level is 200-499 mg/dl after initiation of LDL-C lowering therapy, nicotinic acid or a fibrate should be considered (non-HDL goal is 30 pts higher than LDL goal)
If the TG level is >500 mg/dl, nicotinic acid or a fibrate should be considered before starting LDL-C lowering therapy
Source: Expert Panel on Detection, Evaluation, and Treatment of
High Blood Cholesterol in Adults. JAMA 2001;285:2486-97
HDL-C=High density lipoprotein cholesterol, LDL-C=Low density
lipoprotein cholesterol, TG=Triglyceride
Cholesterol Management Guidelines (Continued)

Secondary Prevention
Reduce intake of saturated fat (<7% of total
calories), trans-fatty acids, and cholesterol (<200
mg/day), add plant stanols/sterols (2 grams/day)
and viscous fiber (>10 grams/day), and promote
daily physical activity and weight management
Increase -3 fatty acid consumption in the form of
fish or in capsule form (1 gram/day). Higher doses
are usually required for the treatment of elevated
triglycerides
Source: Smith SC Jr. et al. JACC 2006;47:2130-9
Cholesterol Management Guidelines (Continued)
I IIa IIb III
I IIa IIb III
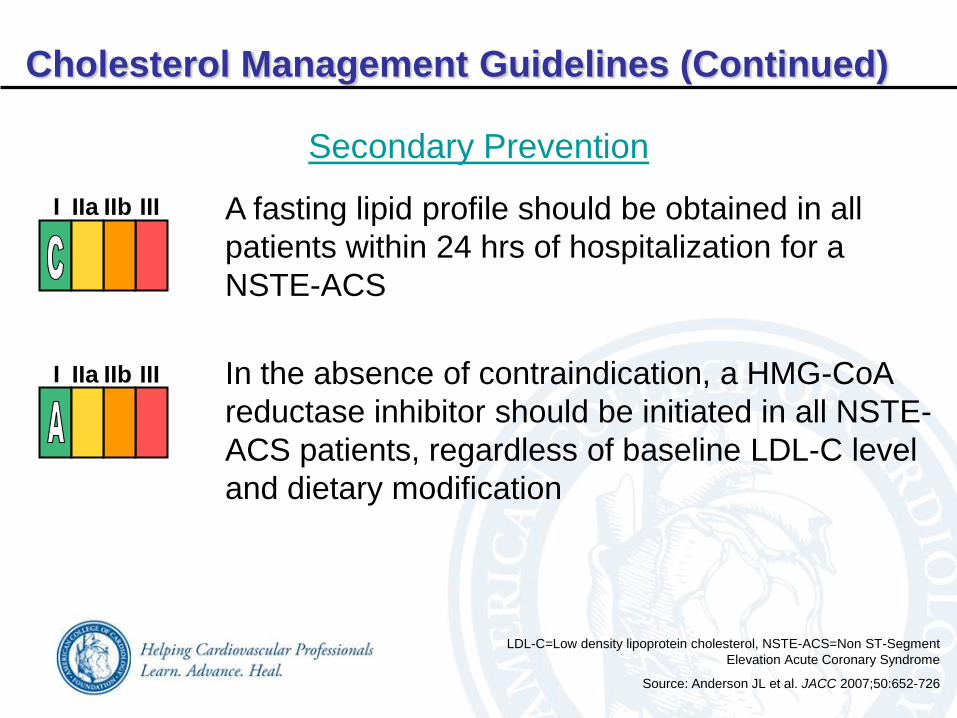
Cholesterol Management Guidelines (Continued)
A fasting lipid profile should be obtained in all
patients within 24 hrs of hospitalization for a
NSTE-ACS
In the absence of contraindication, a HMG-CoA
reductase inhibitor should be initiated in all NSTE-
ACS patients, regardless of baseline LDL-C level
and dietary modification
Secondary Prevention
LDL-C=Low density lipoprotein cholesterol, NSTE-ACS=Non ST-Segment
Elevation Acute Coronary Syndrome
Source: Anderson JL et al. JACC 2007;50:652-726
I IIa IIb III
I IIa IIb III
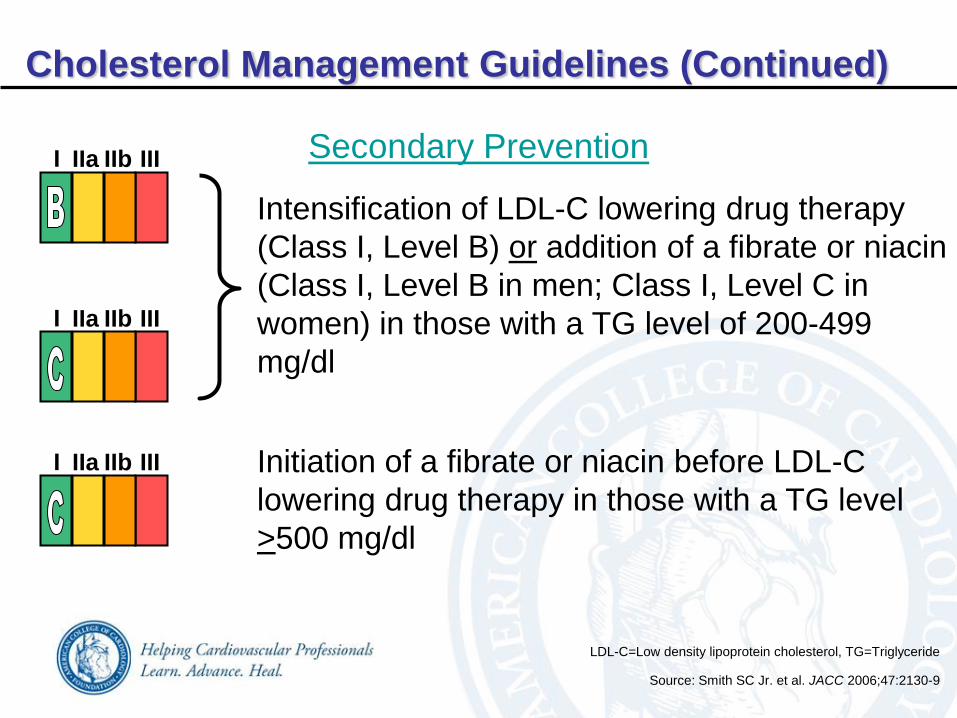
Intensification of LDL-C lowering drug therapy
(Class I, Level B) or addition of a fibrate or niacin
(Class I, Level B in men; Class I, Level C in
women) in those with a TG level of 200-499
mg/dl
Initiation of a fibrate or niacin before LDL-C
lowering drug therapy in those with a TG level
>500 mg/dl
LDL-C=Low density lipoprotein cholesterol, TG=Triglyceride
Cholesterol Management Guidelines (Continued)
Source: Smith SC Jr. et al. JACC 2006;47:2130-9
Secondary PreventionI IIa IIb III
I IIa IIb III
I IIa IIb III
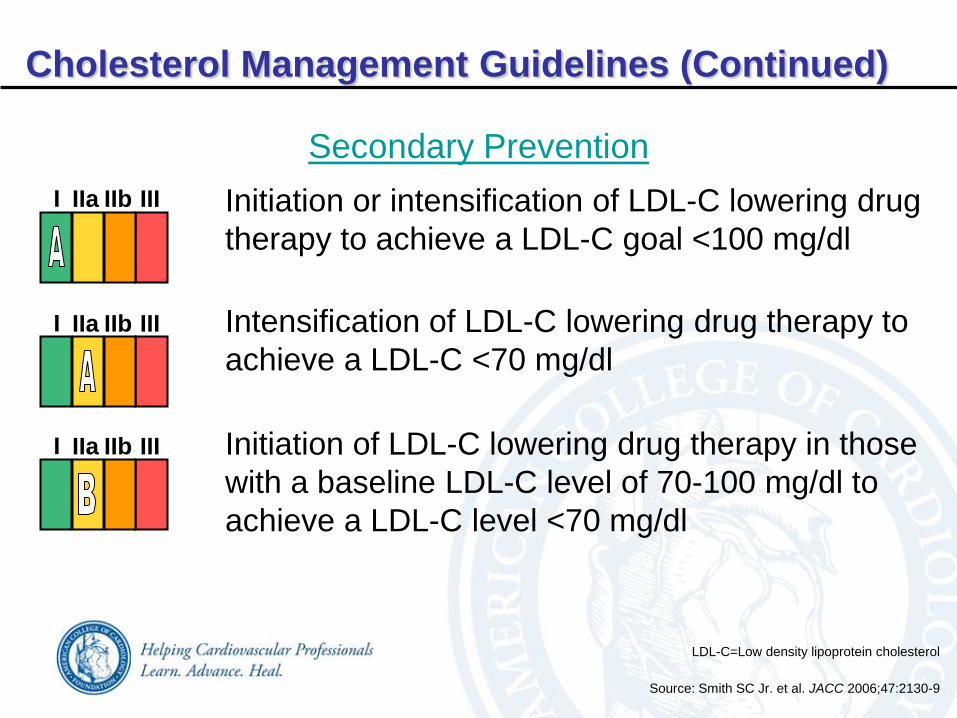
Cholesterol Management Guidelines (Continued)
Initiation or intensification of LDL-C lowering drug
therapy to achieve a LDL-C goal <100 mg/dl
Intensification of LDL-C lowering drug therapy to
achieve a LDL-C <70 mg/dl
Initiation of LDL-C lowering drug therapy in those
with a baseline LDL-C level of 70-100 mg/dl to
achieve a LDL-C level <70 mg/dl
LDL-C=Low density lipoprotein cholesterol
Source: Smith SC Jr. et al. JACC 2006;47:2130-9
Secondary Prevention
I IIa IIb III
I IIa IIb III
I IIa IIb III
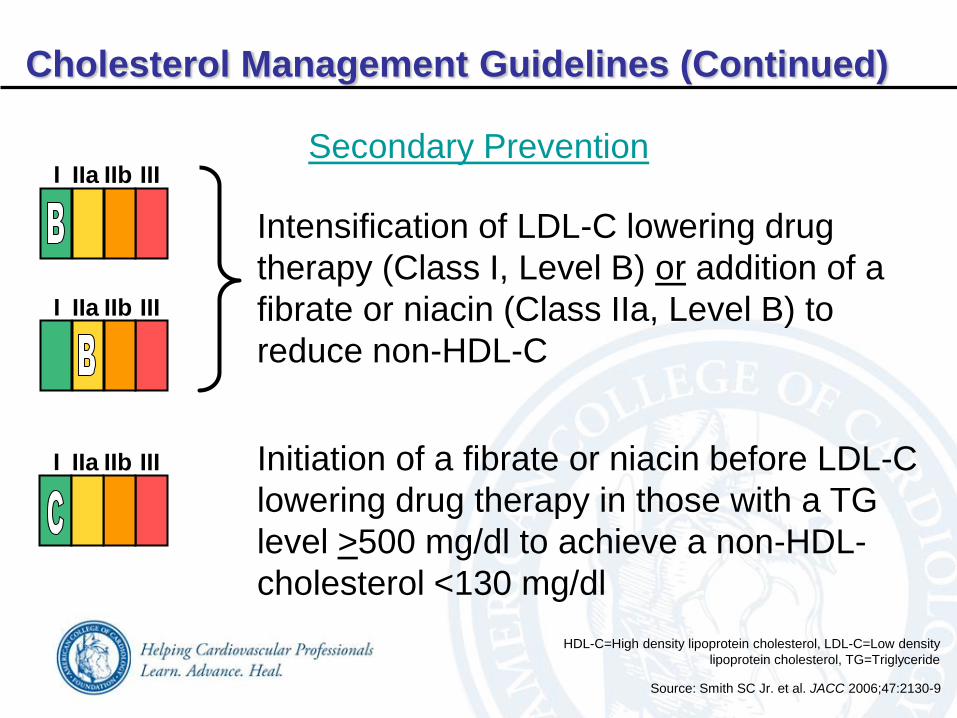
Cholesterol Management Guidelines (Continued)
Intensification of LDL-C lowering drug
therapy (Class I, Level B) or addition of a
fibrate or niacin (Class IIa, Level B) to
reduce non-HDL-C
Initiation of a fibrate or niacin before LDL-C
lowering drug therapy in those with a TG
level >500 mg/dl to achieve a non-HDL-
cholesterol <130 mg/dl
HDL-C=High density lipoprotein cholesterol, LDL-C=Low density
lipoprotein cholesterol, TG=Triglyceride
Source: Smith SC Jr. et al. JACC 2006;47:2130-9
Secondary Prevention
I IIa IIb III
I IIa IIb III
I IIa IIb III

Cholesterol Management Guidelines (Continued)
Reduction of non-HDL-cholesterol to <130 mg/dl in
those with a TG level of 200-499 mg/dl
Reduction of non-HDL-cholesterol to <100 mg/dl in
those with a TG level of 200-499 mg/dl
HDL-C=High density lipoprotein cholesterol, TG=Triglyceride
Source: Smith SC Jr. et al. JACC 2006;47:2130-9
Secondary Prevention
I IIa IIb III
I IIa IIb III


