The Even-Odd Nature of Audit Committees and Corporate ... · The Even-Odd Nature of Audit...
43
The Even-Odd Nature of Audit Committees and Corporate Earnings Quality * Huasheng Gao Nanyang Business School Nanyang Technological University S3-B1A-06, 50 Nanyang Avenue, Singapore 639798 65.6790.4653 [email protected] Jun Huang Institute of Accounting and Finance Shanghai University of Finance and Economics No.777 Guoding Road, Shanghai 200433 86.21.6590.4822 [email protected] This version: December 2015 Journal of Accounting, Auditing and Finance forthcoming Abstract: We apply voting theory to the context of audit committees and examine how the even- odd nature of audit committees is related to earnings quality. We hypothesize that an audit committee with an odd number of directors can improve the committee’s voting efficiency by better aggregating directors’ information and thus enhance the quality of committee decisions, as compared to an audit committee with an even number of directors. Supporting this implication, we find that an odd audit committee is associated with lower likelihood of financial restatements than an even audit committee and that this relation is stronger when the committee members have more heterogeneous opinions, hold less equity ownership, are in a smaller audit committee, and face an more entrenched management. Keywords: Voting Efficiency, Audit Committee, Financial Restatement, Earnings Quality, Even, Odd JEL Classification: G30, G38 * We thank Bin Ke, Xia Chen, Qiang Cheng, and the seminar participants at Nanyang Technological University and Singapore Management University for helpful comments. Gao acknowledges the financial support from Singapore Ministry of Education Academic Research Fund Tier 1 (Reference Number: RG 54/12). Huang acknowledges the financial support from the National Natural Science Foundation of China (No. 71102136, No. 71272008, and No. 71372038), the MOE Project for Key Research Institutes of Humanities and Social Science in Universities (No. 14JJD630010), the Innovation Program of the Shanghai Municipal Education Commission (14ZS078), and the Program for Innovative Research Team of Shanghai University of Finance and Economics. All errors are ours.
-
Upload
phamnguyet -
Category
Documents
-
view
228 -
download
0
Transcript of The Even-Odd Nature of Audit Committees and Corporate ... · The Even-Odd Nature of Audit...

The Even-Odd Nature of Audit Committees and Corporate Earnings Quality*
Huasheng Gao Nanyang Business School
Nanyang Technological University S3-B1A-06, 50 Nanyang Avenue, Singapore 639798
65.6790.4653 [email protected]
Jun Huang Institute of Accounting and Finance
Shanghai University of Finance and Economics No.777 Guoding Road, Shanghai 200433
86.21.6590.4822 [email protected]
This version: December 2015
Journal of Accounting, Auditing and Finance forthcoming
Abstract: We apply voting theory to the context of audit committees and examine how the even-odd nature of audit committees is related to earnings quality. We hypothesize that an audit committee with an odd number of directors can improve the committee’s voting efficiency by better aggregating directors’ information and thus enhance the quality of committee decisions, as compared to an audit committee with an even number of directors. Supporting this implication, we find that an odd audit committee is associated with lower likelihood of financial restatements than an even audit committee and that this relation is stronger when the committee members have more heterogeneous opinions, hold less equity ownership, are in a smaller audit committee, and face an more entrenched management.
Keywords: Voting Efficiency, Audit Committee, Financial Restatement, Earnings Quality, Even, Odd
JEL Classification: G30, G38
* We thank Bin Ke, Xia Chen, Qiang Cheng, and the seminar participants at Nanyang Technological University and Singapore Management University for helpful comments. Gao acknowledges the financial support from Singapore Ministry of Education Academic Research Fund Tier 1 (Reference Number: RG 54/12). Huang acknowledges the financial support from the National Natural Science Foundation of China (No. 71102136, No. 71272008, and No. 71372038), the MOE Project for Key Research Institutes of Humanities and Social Science in Universities (No. 14JJD630010), the Innovation Program of the Shanghai Municipal Education Commission (14ZS078), and the Program for Innovative Research Team of Shanghai University of Finance and Economics. All errors are ours.

1
1. Introduction
Understanding the relation between the characteristics of audit committees and the
corporate earnings quality is an important issue that has attracted considerable research interests.
Extant finance and accounting literature has put under scrutiny the effects of key characteristics
of audit committees, including the size, the independence, the existence of financial expertise,
and the meeting frequency, on corporate earnings quality. 1 This paper extends the existing
literature by examining the link between the voting efficiency in the audit committee and quality
of earnings, where the voting efficiency refers to the extent to which voting outcomes aggregate
committee members’ information. Since major decisions in the audit committee are generally
preceded by a voting process, voting efficiency can be of critical importance to the quality of
committee decisions.
The committee characteristic we focus on relates to the even-odd nature of members in
the audit committee. This focus is motivated in part by anecdotal evidence suggesting that the
even-odd characteristic of audit committees may influence the committee’s voting process
significantly. For example, the American Institute of CPAs recommends that audit committees be
composed of an odd number of members to better handle the matters requiring a vote.2 Deloitte
also makes a similar recommendation in its Audit Committee Brief of 2012.3
[Insert Figure 1 Here]
1A partial list of the previous studies include Klein (2002), Abbott, Parker and Peters (2004), Anderson, Mansi and Reeb (2004), and Krishnan (2005). 2http://www.aicpa.org/ForThePublic/AuditCommitteeEffectiveness/AuditCommitteeBrief/DownloadableDocuments/AnOftenOverlookedResource_apr2010.pdf 3http://www.corpgov.deloitte.com/binary/com.epicentric.contentmanagement.servlet.ContentDeliveryServlet/USEng/Documents/Deloitte%20Periodicals/Audit%20Committee%20Brief/ACbrief_May2012.pdf

2
Our focus on the even-odd characteristic of audit committees is also motivated by
Yermack’s (1996) classical study on corporate board. While Yermack (1996) focuses on the
effects of board size on firm valuation, his findings also reveal a possible relation between the
even-odd characteristic of boards and firm values. In particular, Figure 1, reproduced from
Yermack (1996), shows that odd boards tend to be associated with a higher Tobin’s Q relative to
even boards, especially among small boards.4
The intuition for an odd number of voters being associated with better efficiency is as
follows. Two factors come into play in deciding the direction of a vote: a performance
preference and a conformity preference. The performance preference motivates the director to
vote independently based on her own judgment and available information. The conformity
preference, on the other hand, induces the director to vote for the decision favored by a majority
of other directors.5 In an odd audit committee, each director faces an even number of other
directors. Since, on average, opposing votes among an even number of directors tend to balance
out one another, the conformity preference becomes moot and the performance preference causes
each director to vote based on her own information. In contrast, in an even audit committee, each
director faces an odd number of other directors, among whom opposing votes generally do not
balance out one another. Consequently, a strong conformity preference can cause a director to
vote in accordance to the anticipated net vote by other directors, even if her own information
suggests otherwise. For example, for a director in a four-member audit committee, there are three
other votes in addition to her own. Those three votes cannot be split evenly, so any individual
4 Reading from Figure 1, for example, the average Tobin’s Q is 2.1 and 1.7 for five-member and seven-member boards, respectively. In contrast, for four-member, six-member, and eight-member boards, the averages of Tobin’s Q assume much smaller values of 1.6, 1.55, and 1.5, respectively. 5 Director conformity preference has been employed previously by several theoretical studies to provide insights to a multitude of empirical regularities of corporate boards (Gillette, Noe and Rebello, 2003; Chemmanur and Fedaseyeu, 2012; Malenko, 2014).

3
member in the audit committee is likely to vote based on the way she thinks the majority of those
three members will vote to be on the “winning” side.
Our study employs the firm’s financial restatements as the measure of the decision-
quality of the audit committee. Based on a large sample of firms over the period from 1998 to
2010, we find that the audit committees with an odd number of directors (as compared to the
ones with an even number of directors) are associated with 1.5 percentage points lower
likelihood of financial restatements, relative to the unconditional likelihood of 10 percentage
points. This relation is both economically and statistically significant after controlling for various
firm, audit committee and board characteristics.
To further examine whether improved voting efficiency by mitigating the directors’
conformity preference is the source of these benefits, we conduct interaction analysis. First,
directors’ conformity preference is less likely to reduce voting efficiency when directors have
homogenous opinions. For this reason, the extent of information aggregation in decisions should
be more important when directors are likely to have different opinions. We use R&D expenditure
and stock return volatility to proxy for the uncertainty of the firm’s operation and thus the degree
to which directors may have different views. We expect that the difference in earnings quality
between audit committees with even and odd directors is particularly pronounced among firms
with high R&D expenditures and high stock volatility. Second, directors with high ownership
tend to have stronger performance preference, and thus are less affected by the conformity
preference. Therefore, the positive association between odd audit committees and corporate
earnings quality should be especially evident in firms with low ownership by audit committee
members. Third, it is possible that the conformity preference weakens as there are more votes on
each side and we expect the even-odd effects to diminish as the size of the audit committee

4
increases (as documented by Yermack (1996) for boards). Lastly, considering that directors have
greater incentives to conform when facing entrenched management, we expect the even-odd
effects to be more pronounced when the firm is controlled by entrenched management. Our
interactive analyses based on R&D expenditure, stock volatility, director ownership, committee
size, and CEO tenure confirm the above predictions and provide further evidence that improved
voting efficiency associated with an odd audit committee is the source for the better earnings
quality.
Endogeneity problems are less of a concern for our study as compared to other papers on
audit committees. For example, while the size of the audit committee may well be related to
economic factors that affect the accuracy of the firm’s financial reports, the choice of an odd or
even number of directors is less likely to have such a relationship. The corporate structure that
determines the even-odd nature of the audit committee could be set up at the time of the IPO and
unrelated to the current economic structure of the firm. The various interactive analyses
discussed above, in effect, could be viewed as evidence of a causal relationship (Rajan and
Zingales, 1998) under the assumption that the even-odd structure of the audit committee is not
systematically related to these economic factors.
Finally, we employ four alternative measures of earnings quality: discretionary accruals
(Jones, 1991; Dechow, Sloan and Sweeney, 1995; Kothari, Leone and Wasley, 2005), cash flow
predictability (Dechow, Kothari and Watts, 1998; Barth, Cram and Nelson, 2001), earnings
informativeness (Warfield, Wild and Wild, 1995; Fan and Wong, 2002; Francis, Schipper and
Vincent, 2005), and timely loss recognition (Basu, 1997; Ball, Kothari and Robin, 2000; Ball,
Robin and Wu, 2003), and we still find that an odd audit committee is associated with better
earnings quality than an even one.

5
A seemingly alternative explanation to our results is that an odd audit committee can
enhance voting efficiency by better avoiding tie voting than an even one, and this has little to do
with directors’ conformity preference. First, it is unclear whether the fact that a “difficult”
decision is resolved one way or the other necessarily predicts that the decision itself is of higher
quality. Second, most companies have tie-break procedures, perhaps involving the entire board,
so it is not evident that the possibility of tied votes leads to less efficient decisions.
If our findings suggest genuine benefits of odd audit committees, it might appear that
firms should invariably opt for odd audit committees. Yet, many firms in our sample have an
even number of directors in their audit committees. There could be at least two reasons for a firm
to stay with an even audit committee. First, the structure of the board may be determined by the
need for particular types of expertise rather than considerations of whether it is odd or even. The
efficient management of the company may determine the committee structure and the quality of
financial reports may not be as important as other factors. For example, if the company is overall
profitable, a small increase in restatements risk would be worthwhile. Second, as pointed out by
Adams, Hermalin and Weisbach (2010) and Coles, Daniel and Naveen (2014), each firm
operates within the confines of its exogenously given environment. If changing the environment
is costly or takes time, a firm may optimally adopt an even audit committee as the best solution
to the constrained optimization problem relating to the design of the committee. For instance, a
firm wishing to switch from an even audit committee to an odd one may be constrained from
doing so when the supply of competent directors is limited, and thus staying with an even audit
committee may be the firm’s solution to the constrained optimization problem.
This paper makes two important contributions to the literature. First, while there is
voluminous literature on group voting in economics and political science, the finance and

6
accounting literature on board voting remains small and mostly theoretical in nature (e.g.,
Warther, 1998; Gillette, Noe and Rebello, 2003; Raheja, 2005; Harris and Raviv, 2008;
Baranchuck and Dybvig, 2009; Chemmanur and Fedaseyeu, 2012; Malenko, 2014). Lack of
sufficiently detailed data on the process and outcome of board voting renders challenging direct
tests. Perhaps for this reason, empirical analysis on board voting remains scarce. Our study, on
the other hand, focuses on an easily measurable committee characteristic: the even-odd nature of
the number of directors. Our findings help establish an empirical link between board
characteristics and board voting efficiency in the audit committee.
Second, we complement the existing literature on audit committees by identifying the
even-odd characteristic of committees as a measure of the committees’ voting efficiency in
improving corporate earnings quality. Our analysis suggests that this new measure represents an
economically significant yet under-explored aspect of audit committees that is distinct from those
captured by the conventional measures.
2. A Simple Model of Audit Committee Voting
The usual work of audit committees includes ensuring the soundness and quality of
internal control practices, reviewing the corporation’s financial statements, selection of external
auditors, and so on. Suppose the audit committee is considering one of two actions: sticking to
the existing internal control practice (status quo), denoted as a = 0, or adopting a new internal
control practice, denoted as a = 1. The firm’s improvement in earnings quality 𝑣(𝜃,𝑎) depends
on the suitability of the new internal control practice 𝜃 to the firm, which can be either high
𝜃 = 𝜃ℎ or low 𝜃 = 𝜃𝑙, and the action undertaken:
𝑣(𝜃,𝑎 = 0) = 0; (1)
𝑣(𝜃ℎ ,𝑎 = 1) = 1, 𝑣(𝜃𝑙 ,𝑎 = 1) = −1. (2)

7
From Eq. (1), if the existing internal control practice is maintained, the improvement in
earnings quality is invariably 0. On the other hand, from Eq. (2), adopting the new internal
control practice enhances the firm’s earnings quality if it is highly suitable to the firm, but leads
to a decline in earnings quality if its suitability is low.
The audit committee has n > 1 directors and determines the choice of action through
voting. Prior to casting their votes, the directors learn aspects of the new internal control practice.
Specifically, director i, i = 1, 2, …, n, can privately learn the ith aspect of the new internal control
practice 𝜙𝑖 , which is equally likely to be good, 𝜙𝑖 = 1, or bad, 𝜙𝑖 = −1. Since 𝜙𝑖s represent
distinct aspects of the new internal control practice, they are independently distributed.
Collectively, the various aspects of the new strategy stochastically determine its
suitability. Specifically, let Φ = (𝜙1,…, 𝜙𝑛) be the set of the directors’ information, and Γ(Φ) =
(∑ 𝜙𝑖)𝑛𝑖=1 be the n directors’ collective information about the new internal control practice. The
probabilities of high and low suitability conditional on Γ(Φ) are:
𝑓(𝜃 = 𝜃ℎ|Γ(Φ)) = 12
+ 12𝑛Γ(Φ), (3)
𝑓(𝜃 = 𝜃𝑙|Γ(Φ)) = 12− 1
2𝑛Γ(Φ). (4)
Eqs. (3) and (4) suggest that positive (negative) collective information, i.e., Γ(Φ) > 0
(Γ(Φ) < 0), is indicative of high (low) suitability. Moreover, as Γ(Φ) increases, high suitability
becomes increasingly more likely. In the limit when all the directors receive positive (negative)
information, i.e., 𝜙𝑖 = 1 (𝜙𝑖 = −1) for all i, suitability 𝜃 = 𝜃ℎ (𝜃 = 𝜃𝑙) with certainty. Note that
before the directors obtain their information, according to the common prior belief, 𝜃 = 𝜃ℎ and
𝜃 = 𝜃𝑙 are equally likely. Suitability 𝜃 is likely to reflect the aggregate of the differences
between the two internal control practices in multiple aspects. Collectively, the differences in
these aspects determine which one is likely to be a better fit to the company.
8
Upon obtaining information about 𝜃, each director votes for either 𝑎 = 1 or 𝑎 = 0.6 In
casting his vote, a director does not know the information that other directors have or how each
of the other directors votes, but holds rational expectations about others’ information and voting
strategies. After the directors cast their votes, each vote is revealed, and the audit committee
chooses the action to implement based on the simple majority rule, so that the new internal
control practice is adopted, i.e., 𝑎 = 1, if the number of directors voting for 𝑎 = 1 is greater than
the number of directors voting for 𝑎 = 0.
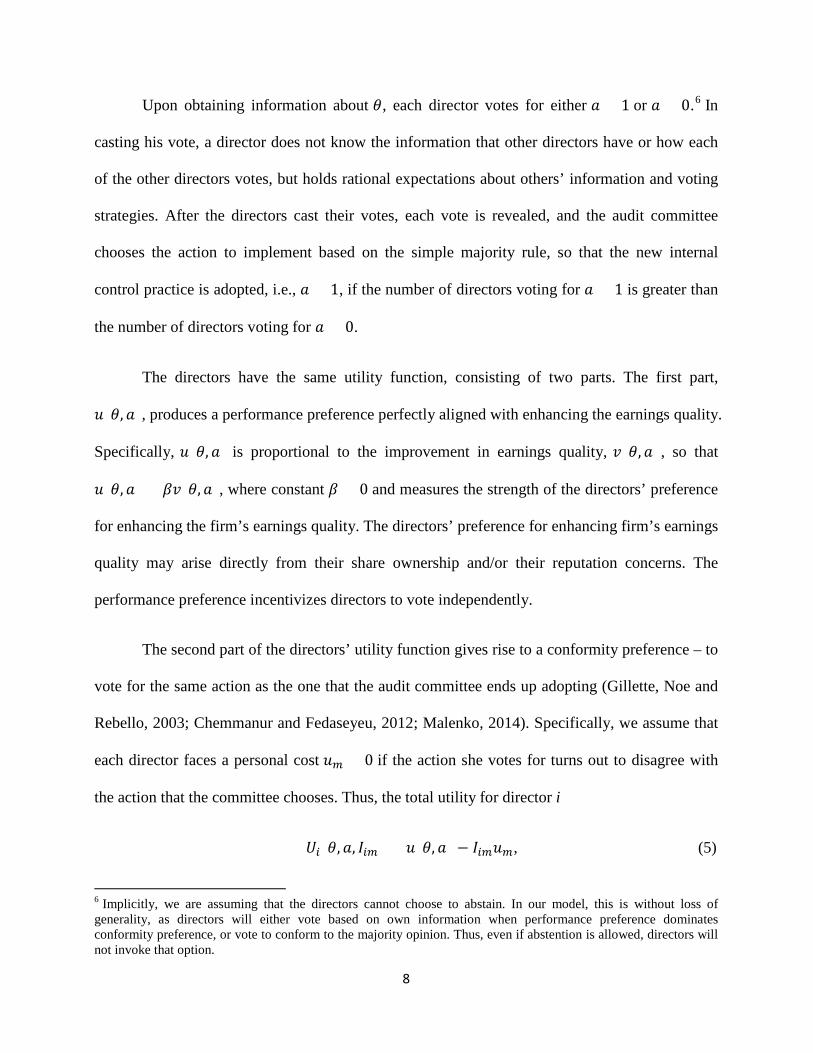
The directors have the same utility function, consisting of two parts. The first part,
𝑢(𝜃,𝑎), produces a performance preference perfectly aligned with enhancing the earnings quality.
Specifically, 𝑢(𝜃,𝑎) is proportional to the improvement in earnings quality, 𝑣(𝜃,𝑎), so that
𝑢(𝜃,𝑎) = 𝛽𝑣(𝜃,𝑎), where constant 𝛽 > 0 and measures the strength of the directors’ preference
for enhancing the firm’s earnings quality. The directors’ preference for enhancing firm’s earnings
quality may arise directly from their share ownership and/or their reputation concerns. The
performance preference incentivizes directors to vote independently.
The second part of the directors’ utility function gives rise to a conformity preference – to
vote for the same action as the one that the audit committee ends up adopting (Gillette, Noe and
Rebello, 2003; Chemmanur and Fedaseyeu, 2012; Malenko, 2014). Specifically, we assume that
each director faces a personal cost 𝑢𝑚 > 0 if the action she votes for turns out to disagree with
the action that the committee chooses. Thus, the total utility for director i
𝑈𝑖(𝜃,𝑎, 𝐼𝑖𝑚) = 𝑢(𝜃,𝑎) − 𝐼𝑖𝑚𝑢𝑚, (5)
6 Implicitly, we are assuming that the directors cannot choose to abstain. In our model, this is without loss of generality, as directors will either vote based on own information when performance preference dominates conformity preference, or vote to conform to the majority opinion. Thus, even if abstention is allowed, directors will not invoke that option.

9
where 𝐼𝑖𝑚 is an indicator function that takes the value of one if director i’s vote disagrees with
the audit committee’s decision and zero otherwise. Cost 𝑢𝑚 measures the strength of the
directors’ conformity preference. The conformity preference incentivizes directors to herd.
Appendix 1 presents a formal analysis of the model. As predicted by the model, in an odd
audit committee, the marginal director votes based on her own information and thus the voting
outcomes reflect the director’s information regarding which action can better improve the firm’s
earnings quality. In an even audit committee, on the contrary, the marginal director votes based
on her belief of how other directors vote and thus the voting outcomes do not reflect the
director’s information on which action improves the firm’s earnings quality but reflect the
director’s conjecture about how to vote consistently with other directors. In summary, an odd
audit committee enhances the firm’s earnings quality by better aggregating directors’ information
and making better committee decisions than an even audit committee does. Previous studies
show that the improved oversight and function by audit committees leads to increased earnings
quality (Klein, 2002; Abbott, Parker and Peters, 2004; Anderson, Mansi and Reeb, 2004). For
these reasons, we expect that firms with an odd audit committee have better earnings quality than
firms with an even audit committee do.
In summary, the discussion above leads to the following empirical implication:
All else equal, the audit committees with an odd number of directors are associated with better
earnings quality than the audit committees with an even number of directors are.
3. Sample and Descriptive Statistics
Our empirical analysis is performed on firms covered in RiskMetrics, which provides
firms’ director information. Further, we obtain auditor information from Audit Analytics, stock

10
price information from CRSP, and financial information from Compustat. Our final sample
consists of 5,384 firm-year observations with even audit committees and 6,687 firm-year
observations with odd audit committees from 1998 to 2010.
The literature argues that a restatement of financial reports is strongly suggestive that the
financial statements are of low quality (Palmrose and Scholz, 2004; Srinivasan, 2005; Lennox
and Pittman, 2010; Dechow et al., 2011). The SEC also regards restatements as “the most visible
indicator of improper accounting” (Schroeder, 2001). We employ financial restatements as the
primary measure of earnings quality in this study. The data of financial restatements comes from
Audit Analytics. The database indicates the year the restated financial statements were originally
issued and we use this data to identify the firm-year observations with and without subsequent
financial statements during our sample period.
[Insert Table 1 Here]
As demonstrated in Table 1, the size of audit committees ranges from 2 to 11,7 with the
majority of three-member audit committees (40.78%) followed by four-member committees
(28.10%) and five-member committees (13.31%). Committees with six members or above are
only about 6% of our sample.
[Insert Table 2 Here]
Table 2 reports the descriptive statistics of variables. Their definitions are detailed in
Appendix 2. Of the total firm-year observations, 10% of them have subsequent financial
restatements. Our sample firms are relatively large with the median total assets of $2.27 billion.
7 There are 153 firm-year observations with only one member in the audit committees. Since these observations are extreme cases, we exclude them in our analysis.

11
The median firm is 22 years old and has a leverage ratio of 21%, stock volatility of 0.09, and
working capital accruals of -0.04. In terms of performance, the median firm is performing well
with an annual stock return of 10%, sales growth rate of 7%, market-to-book rate of 0.91, and
inverse interest coverage of 0.12. The average boards have nine directors and 88% of them are
independent directors. Moreover, audit committees are usually dominated by independent
directors. Considering that RiskMetrics usually covers large firms, it is not surprising to see that
98% of sample firms are audited by the Big Four accounting firms.
4. Empirical Results
4.1. Financial Restatements
To test the relation between odd audit committees and the likelihood of financial
restatements, we estimate the following probit equation:
tt
ttttt
ttt
ttttt
tttttt
FEYearFEIndustryFEsizeCommitteetenureAuditLog
BigFinancingAMceindependenBoardsizeBoardLog
ceindependenCommitteeaccrualscapitalWorkingerageerestInverse
LossMBvolatilityStockturnageFirmLog
equityNegativegrowthSalesLeverageassetsTotalLogOdd
εα
ααααα
ααα
ααααα
αααααα
+++++
+++++
+++
+++++
+++++=
)(
4&)(
covint
Re)(
)(tRestatemen
19
1817161514
131211
109876
543210
(6)
The dependent variable is Restatementt, which takes the value of one if the financial
reports in a given fiscal year are restated subsequently, and zero otherwise. Following prior
literature (Lennox and Pittman, 2010; Dechow et al., 2011; Francis, Michas and Yu, 2013), we
control for firm size (Log(Total assets)t), leverage (Leveraget), growth opportunities (Sales
growtht, MBt), performance (Returnt, Inverse interest coveraget), risk (Negative equityt, Stock
volatilityt, Losst), and age (Log(Firm age)t). As Francis, Michas and Yu (2013) argue that high-
accrual firms are expected to have more restatements, we add the accrual variable (Working
Capital Accrualst). The model also controls for the size (Committee size FE) and independence

12
(Committee independencet) of audit committees since these variables may be correlated with the
even-odd nature of committee. In particular, the committee size fixed effects include a group of
dummy variables to flag the audit committees sized between 2 and 3, between 4 and 5, between 6
and 7, between 8 and 9. By doing so, the comparison between even and odd audit committees is
conducted with closely matched committee size. We also control for board size (Log(Board size)t)
and board independence (Board independencet) as two additional independent variables (Beasley,
1996; Dechow, Sloan and Sweeney, 1996; Klein, 2002). Based on Dechow et al. (2011) we
include some measures of firm off-balance sheet activities, for example, acquisition (M&At) and
financing (Financingt). Lennox and Pittman (2010) suggest that auditors play an important role
in preventing financial restatements. Thus, we add two variables to control for accounting firm’s
characteristics, the Big4t indicator and the auditor tenure (Log(Auditor tenure)t). Finally, Industry
and Year dummy variables are included to control for the industry and time effects.
[Insert Table 3 Here]
Table 3 presents the regression results of financial restatements. We report the marginal
effects of probit regression. In Column (1) of Panel A, the coefficient on Odd is –0.016 with a p-
value of 0.045, suggesting that odd audit committees are associated with lower likelihood of
financial restatements. In Column (2), we further control for the firm off-balance sheet activities.
The coefficient of Odd is –0.015 and significant at the 5% level. Column (3) further includes the
auditor variables. The marginal effect of audit committees remains significantly negative. The
economic impact of the even-odd nature of audit committees on financial restatements is also
sizeable. Firms with an odd audit committee have 1.5% lower possibility of restating financial
reports than firms with an even audit committee do, relative to the unconditional probability of

13
10% for all sample firms. The results of control variables show that loss firms are more likely to
restate financial reports and firms issuing securities have greater incentives to misreport.
As illustrated in Table 1, few audit committees have more than five members. To
examine whether our results are driven by these particularly large committees, we exclude the
audit committees with more than five members in Column (4) and still find a negative and
significant coefficient on the Odd indicator variable.
Overall, Table 3 reveals that audit committees with an odd number of directors have
better earnings quality (lower likelihood of financial restatement) than the ones with an even
number of directors do. This relation is robust after controlling for various firm, committee and
board characteristics.
4.2. Interactive Analysis
[Insert Table 4 Here]
Our theoretical arguments suggest that the improved voting efficiency of odd audit
committees is likely to be especially beneficial to firms, in which directors are more likely to
have different opinions.8 To test this prediction, we use two variables to proxy for the firm’s
information environment: R&D expense and stock return volatility. Firms with high R&D
expense and high stock volatility usually have more uncertainty and thus directors are more
likely to have a heterogeneous preference towards firms’ decisions. In Columns (1)–(2) of Table
4, we flag the high R&D indicator and high stock volatility indicator based on their sample
median values, respectively. The interactions, Odd × High R&D and Odd × High stock volatility,
8 If every director has the same preference towards a choice, there is no difference between an odd and an even audit committee.

14
both attract significant and negative coefficients.9 Consistent with our expectation, the difference
in odd and even audit committees is greater when firms have greater uncertainty (directors are
more likely to have different information).
Furthermore, our theory also suggests that the difference in earnings quality between
firms with odd and even audit committees narrows when the ownership by audit committee
members (directors’ performance preference) increases. In Column (3), we introduce the High
director ownership indicator based on the sample median of dollar-value director ownership in
the audit committee, which equals to the total shares owned by audit committee members times
the stock price at the end of fiscal year. We find that the coefficient on Odd × High director
ownership is positive and significant at the 5% level. This result indicates that the contrast in
earnings quality between even and odd audit committees is more evident when directors in the
audit committee have lower ownership.
Our theory also predicts that the even-odd effects are likely to diminish as the size of the
audit committee increases. In Column (4), we define the Big committee indicator based on the
sample median size of audit committees and include the interaction Odd × Big committee in the
regression. The coefficient on the interaction is positive and significant at the 5% level. Thus,
consistent with our prediction, the impact of odd audit committees in increasing earnings quality
is greater for firms with smaller audit committees.
Finally, directors in the audit committee are more likely to conform when they face
entrenched management, and thus have stronger conformity preference. Given that the
conformity preference is the underlying driving force for the even-odd effects, the difference in
9 We follow Ai and Norton’s (2003) approach to compute the marginal effects of interaction terms.

15
earnings quality between firms with odd and even audit committees is expected to be stronger
when firms are controlled by entrenched management. Using CEO tenure as a proxy for
managerial entrenchment, we define the High CEO tenure indicator variable (a proxy for more
entrenchment) based on the sample median value of CEO serving years and include the
interaction, Odd × High CEO tenure, in the regression. Consistent with the prediction above, we
find a negative and significant coefficient on this interaction, implying that the effect of odd audit
committees on enhancing firms’ earnings quality is greater when there is more severe managerial
entrenchment problem.
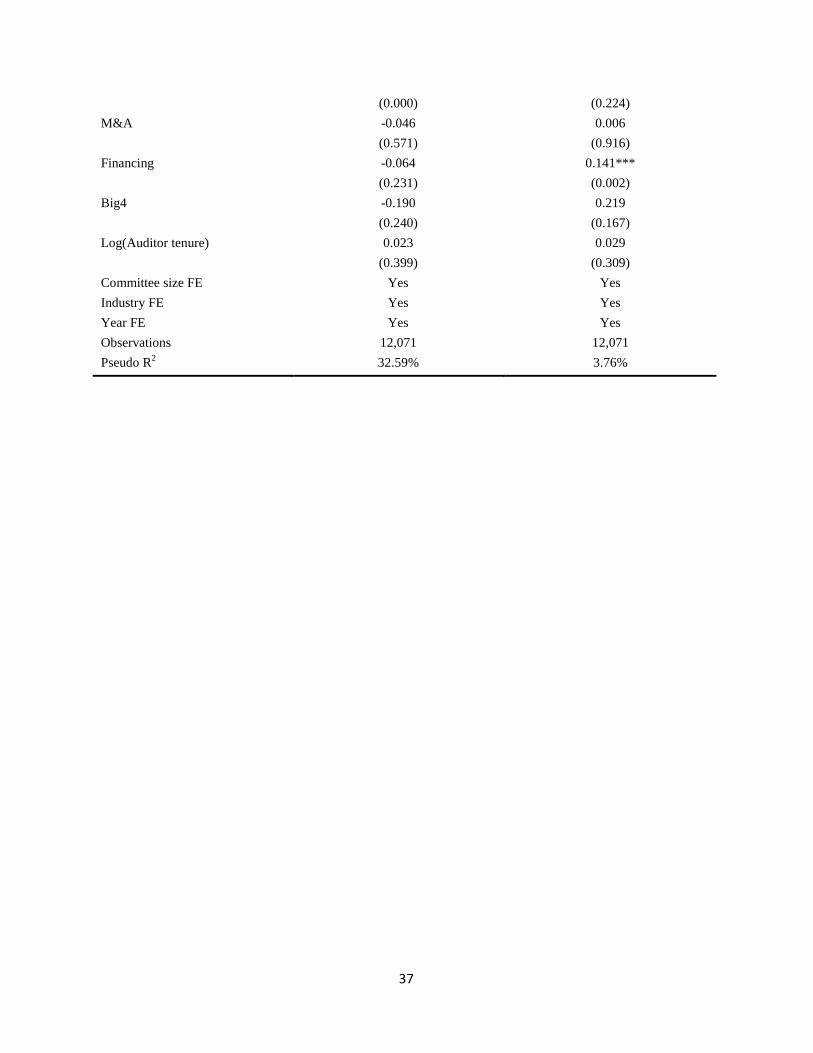
4.3. Instrument approach
To address the possible endogeneity problem of the even-odd nature of audit committees,
we employ the two-stage least squares (2SLS) regression. In the first step, we estimate the
propensity of a firm to have an odd audit committee. The instrumental variable is the prevalence
of odd audit committees in the state in which the firm is located, which is measured as the ratio
of the number of companies with an odd audit committee to the total number of companies in the
firm’s state. Since peer firms in the same geographic region tend to face a similar labor market
pool, an individual firm is likely to share a similar propensity to have an odd audit committee as
its peer firms are (Knyazeva, Knyazeva and Masulis, 2013). In other words, the instrument is
likely to satisfy the relevance condition. Furthermore, due to the exogeneity of state-level
variables, there are no clear reasons to believe that the instrument affects earnings quality after
directly controlling for various firm characteristics. Thus, the instrument is also likely to satisfy
the exogeneity condition. The other control variables used in the first-stage regression include the
full set of variables in Table 3.
[Insert Table 5 Here]
16
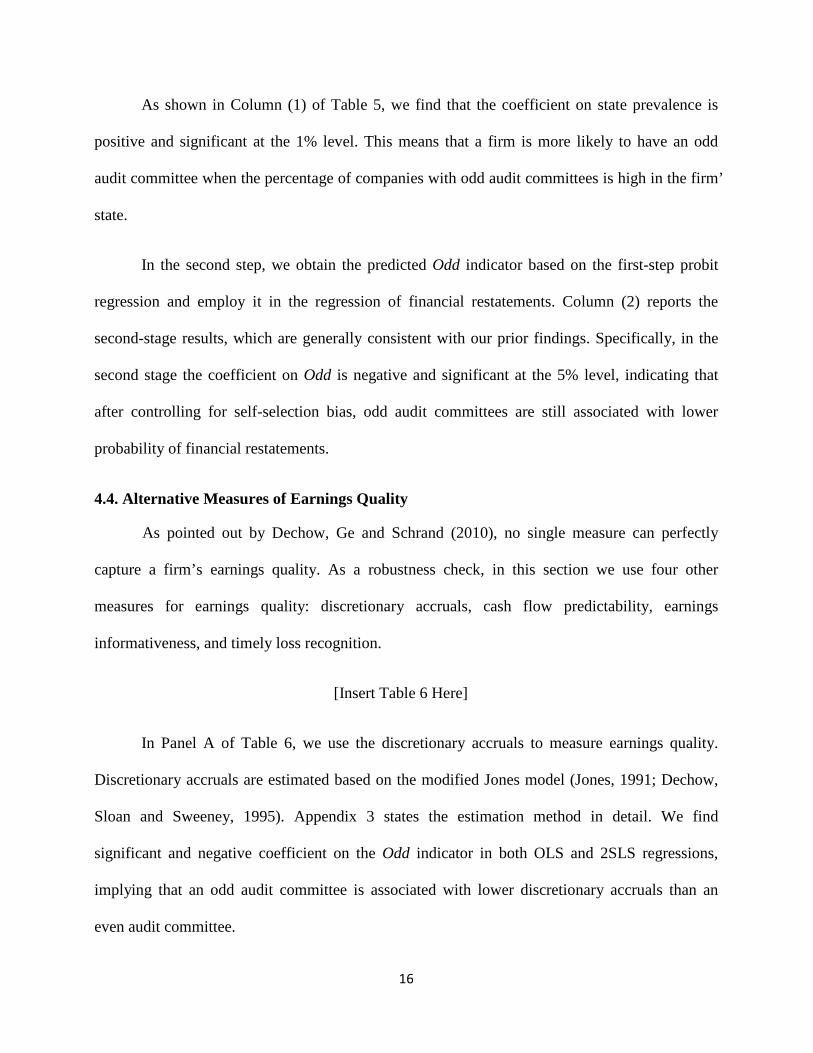
As shown in Column (1) of Table 5, we find that the coefficient on state prevalence is
positive and significant at the 1% level. This means that a firm is more likely to have an odd
audit committee when the percentage of companies with odd audit committees is high in the firm’
state.
In the second step, we obtain the predicted Odd indicator based on the first-step probit
regression and employ it in the regression of financial restatements. Column (2) reports the
second-stage results, which are generally consistent with our prior findings. Specifically, in the
second stage the coefficient on Odd is negative and significant at the 5% level, indicating that
after controlling for self-selection bias, odd audit committees are still associated with lower
probability of financial restatements.
4.4. Alternative Measures of Earnings Quality
As pointed out by Dechow, Ge and Schrand (2010), no single measure can perfectly
capture a firm’s earnings quality. As a robustness check, in this section we use four other
measures for earnings quality: discretionary accruals, cash flow predictability, earnings
informativeness, and timely loss recognition.
[Insert Table 6 Here]
In Panel A of Table 6, we use the discretionary accruals to measure earnings quality.
Discretionary accruals are estimated based on the modified Jones model (Jones, 1991; Dechow,
Sloan and Sweeney, 1995). Appendix 3 states the estimation method in detail. We find
significant and negative coefficient on the Odd indicator in both OLS and 2SLS regressions,
implying that an odd audit committee is associated with lower discretionary accruals than an
even audit committee.
17
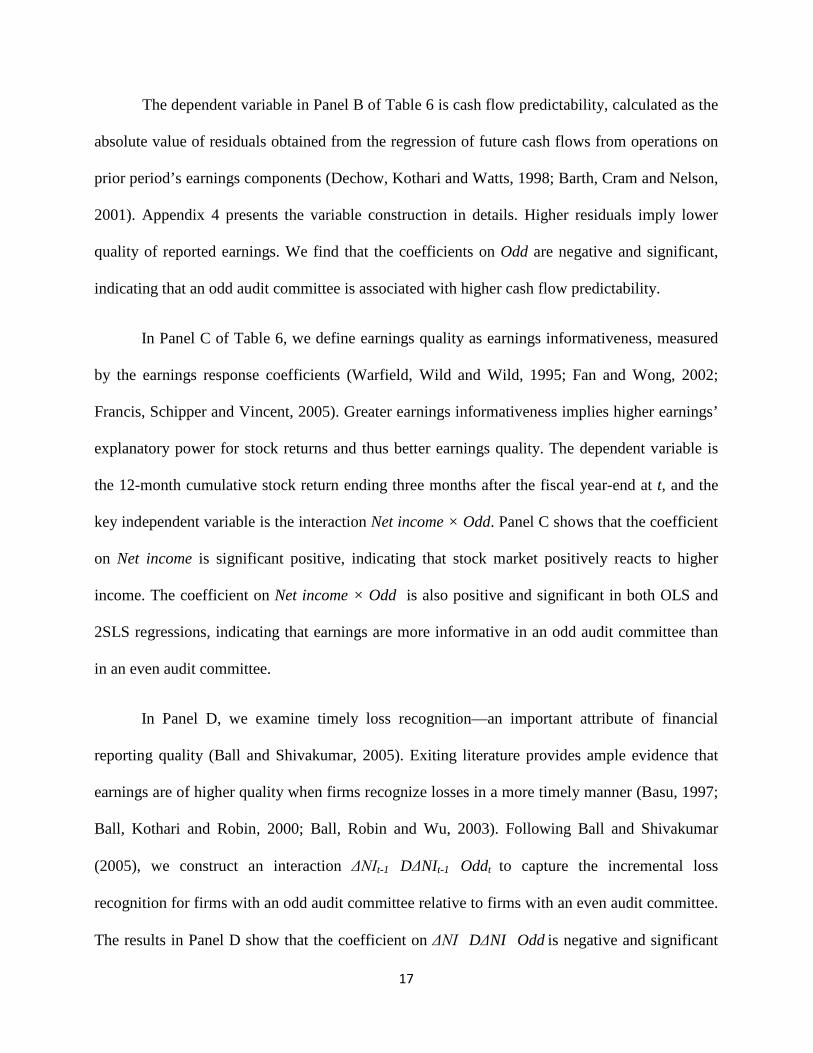
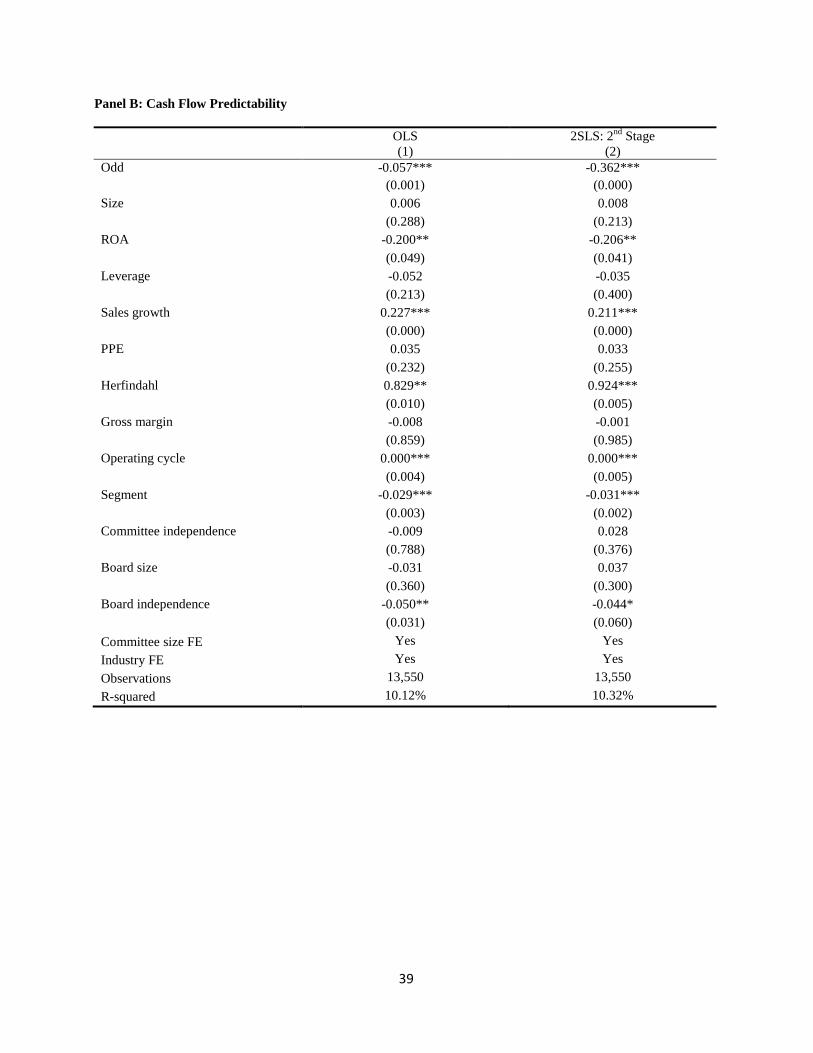
The dependent variable in Panel B of Table 6 is cash flow predictability, calculated as the
absolute value of residuals obtained from the regression of future cash flows from operations on
prior period’s earnings components (Dechow, Kothari and Watts, 1998; Barth, Cram and Nelson,
2001). Appendix 4 presents the variable construction in details. Higher residuals imply lower
quality of reported earnings. We find that the coefficients on Odd are negative and significant,
indicating that an odd audit committee is associated with higher cash flow predictability.
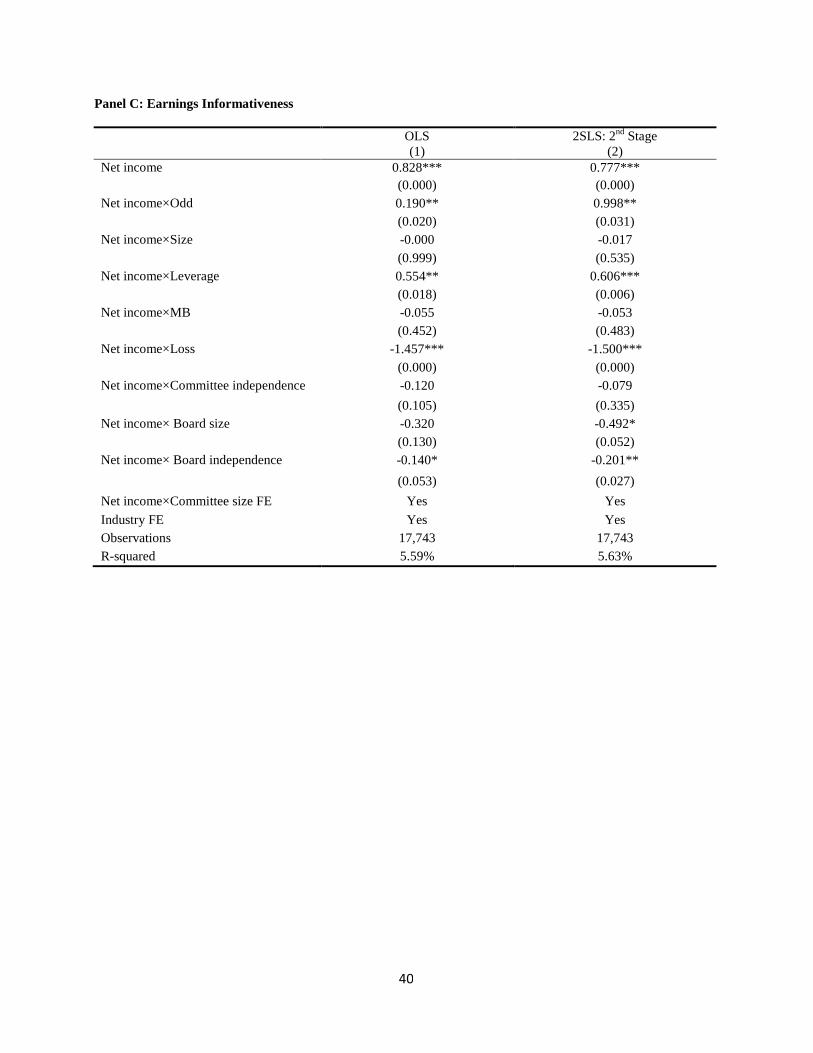
In Panel C of Table 6, we define earnings quality as earnings informativeness, measured
by the earnings response coefficients (Warfield, Wild and Wild, 1995; Fan and Wong, 2002;
Francis, Schipper and Vincent, 2005). Greater earnings informativeness implies higher earnings’
explanatory power for stock returns and thus better earnings quality. The dependent variable is
the 12-month cumulative stock return ending three months after the fiscal year-end at t, and the
key independent variable is the interaction Net income × Odd. Panel C shows that the coefficient
on Net income is significant positive, indicating that stock market positively reacts to higher
income. The coefficient on Net income × Odd is also positive and significant in both OLS and
2SLS regressions, indicating that earnings are more informative in an odd audit committee than
in an even audit committee.
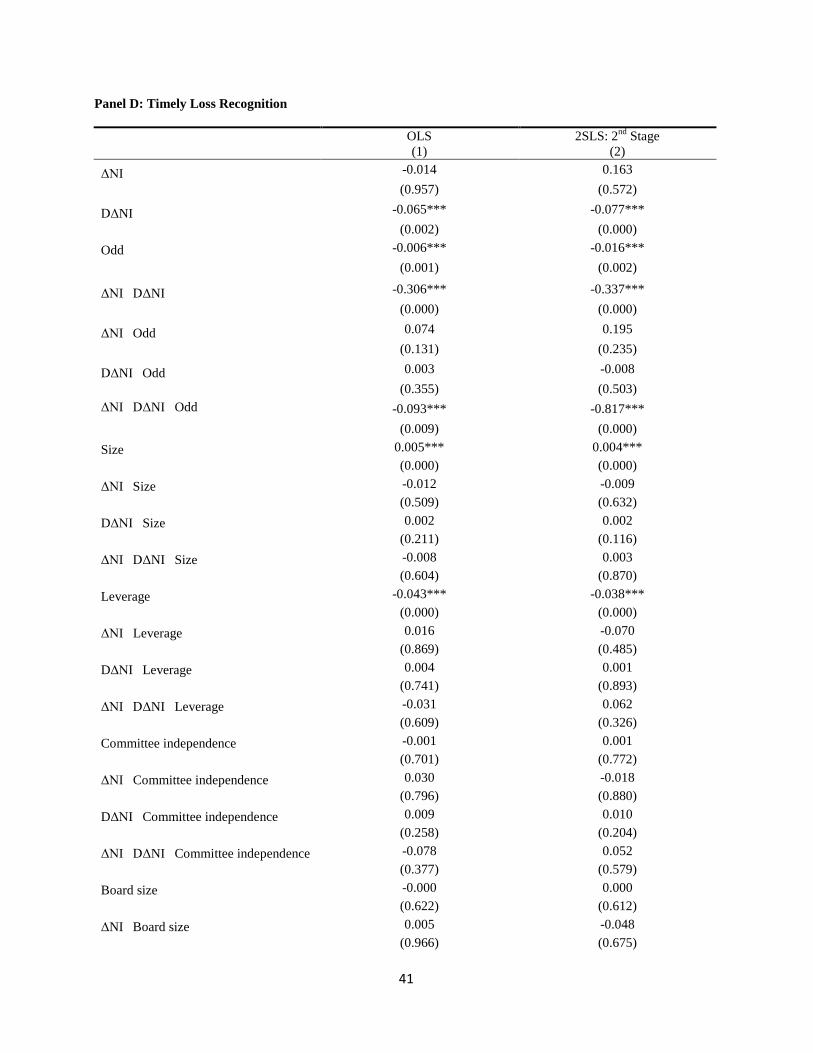
In Panel D, we examine timely loss recognition—an important attribute of financial
reporting quality (Ball and Shivakumar, 2005). Exiting literature provides ample evidence that
earnings are of higher quality when firms recognize losses in a more timely manner (Basu, 1997;
Ball, Kothari and Robin, 2000; Ball, Robin and Wu, 2003). Following Ball and Shivakumar
(2005), we construct an interaction ΔNIt-1×DΔNIt-1×Oddt to capture the incremental loss
recognition for firms with an odd audit committee relative to firms with an even audit committee.
The results in Panel D show that the coefficient on ΔNI×DΔNI×Odd is negative and significant

18
at the 1% level in both regressions, suggesting that an odd audit committee recognizes loss in a
more timely manner than an even committee.
Overall, the results that an odd audit committee is associated with better earnings quality
are robust to various measures of the quality of earnings.
5. Conclusions
This paper applies voting theory to audit committees and finds that the even-odd
characteristic of audit committees is related to the committees’ voting efficiency and corporate
earnings quality. A director in an odd audit committee tends to vote based on her own preference
(i.e., vote independently), because she faces an even number of other committee members who
are more likely to have a balanced opinion due to the nature of evenness. In contrast, a director in
an even audit committee tends to vote to conform to the committee’s majority (i.e., herd),
because she faces an odd number of other committee members who are more likely to have
dominant opinion due to the nature of oddness. Based on this intuition, we hypothesize that the
audit committee with an odd number of directors can enhance earnings quality by enabling better
aggregation of directors’ information and improving board voting efficiency relative to the audit
committee with an even number of directors.
Supporting this hypothesis, we empirically find that an odd audit committee is associated
with lower likelihood of financial restatements, compared with an even audit committee.
Furthermore, the cross-sectional variations in the benefits of odd audit committees are consistent
with improved voting efficiency as the source of these benefits. Taken together, our findings help
establish a link between the even-odd nature of audit committees and corporate earnings quality.

19
Finally, although our paper focuses on audit committees, the basic economic mechanisms
could be applied to the general board voting. It is likely that board voting efficiency has
important implication for various corporate decisions, such as investment, mergers and
acquisitions, and CEO turnover. Examining these issues could be an interesting area for future
research.

20
References
Abbott, L., Parker S., and Peters G., 2004, Audit committee characteristics and restatements, Auditing: A Journal of Practice & Theory 23, 69-87.
Adams, R., Hermalin B., and Weisbach M., 2010, The role of boards of directors in corporate governance: a conceptual framework and survey, Journal of Economic Literature 48, 58-107.
Ai, C., and Norton E., 2003, Interaction terms in logit and probit models, Economics Letters 80, 123-129.
Anderson, R., Mansi S., and Reeb D., 2004, Board characteristics, accounting report integrity, and the cost of debt, Journal of Accounting and Economics 37, 315-342.
Ball, R., Kothari S., and Robin A., 2000, The effect of international institutional factors on properties of accounting earnings, Journal of Accounting and Economics 29, 1-51.
Ball, R., Robin A., and Wu J., 2003, Incentives versus standards: properties of accounting income in four east Asian countries, Journal of Accounting and Economics 36, 235-270.
Ball, R., and Shivakumar L., 2005, Earnings quality in U.K. private firms: comparative loss recognition, Journal of Accounting and Economics 38, 83-128.
Baranchuck, N. and Dybvig P., 2009, Consensus in diverse corporate boards, Review of Financial Studies 22,716-747.
Barth, M., Cram D., and Nelson K., 2001, Accruals and the prediction of future cash flows, Accounting Review 76, 27-58.
Basu, S., 1997, The conservatism principle and asymmetric timeliness of earnings, Journal of Accounting and Economics 24, 3-37.
Beasley, M., 1996, An empirical analysis of the relation between the board of director composition and financial statement fraud, Accounting Review 71, 443-465.
Chemmanur, T. and Fedaseyeu V., 2012, A theory of corporate boards and forced CEO turnover, Working Paper, Boston College.
Coles, J., Daniel N., and Naveen L., 2014, Co-opted boards, Review of Financial Studies 27, 1751-1796.
Dechow, P., Ge W., Larson C, and Sloan R., 2011, Predicting material accounting misstatements, Contemporary Accounting Research 28, 17-82.
Dechow, P., Ge W., and Schrand C., 2010, Understanding earnings quality: a review of the proxies, their determinants and their consequences, Journal of Accounting and Economics 50, 344-401.
Dechow, P., Kothari S., and Watts R., 1998, The relation between earnings and cash flows, Journal of Accounting and Economics 25, 133-168.

21
Dechow, P., Sloan R., and Sweeney A., 1995, Detecting earnings management, Accounting Review 70, 193-225.
Dechow, P., Sloan, R., and Sweeney, A., 1996, Causes and consequences of earnings manipulation: an analysis of firms subject to enforcement actions by the SEC, Contemporary Accounting Research 13, 1-36.
Fan, J., and Wong T., 2002, Corporate ownership structure and the informativeness of accounting earnings in East Asia, Journal of Accounting and Economics 33, 401-425.
Francis, J., Michas P., and Yu M., 2013, Office size of Big 4 auditors and client restatements, Contemporary Accounting Research 30, 1626-1661.
Francis, J., Schipper K., and Vincent L., 2005, Earnings and dividend informativeness when cash flow rights are separated from voting rights, Journal of Accounting and Economics 39, 329-360.
Gillette, A., Noe T., and Rebello M., 2003, Corporate board composition, protocols, and voting behavior: Experimental evidence, Journal of Finance 58, 1997-2031.
Harris, M. and Raviv A., 2008, A theory of board control and size, Review of Financial Studies 21, 1797-1832.
Jones, J., 1991, Earnings management during import relief investigations, Journal of Accounting Research 29, 193-228.
Klein, A., 2002, Audit committee, board of director characteristics, and earnings management, Journal of Accounting and Economics 33, 375-400.
Knyazeva, A., Knyazeva D., and Masulis R., 2013, The supply of corporate directors and board independence, Review of Financial Studies 26, 1561-1605.
Kothari, S., Leone A., and Wasley C., 2005, Performance matched discretionary accrual measures, Journal of Accounting and Economics 39, 163-197.
Krishnan, J., 2005, Audit committee quality and internal control: an empirical analysis, Accounting Review 80, 649-675.
Lennox, C., and Pittman J., 2010, Big Five audits and accounting fraud, Contemporary Accounting Research 27, 209-247.
Malenko, N., 2014, Communication and decision-making in corporate boards, Review of Financial Studies 27, 1486-1532.
Palmrose, Z., and Scholz S., 2004, The circumstances and legal consequences of non-GAAP reporting: evidence from restatements, Contemporary Accounting Research 21, 139-180.
Raheja, C., 2005, Determinants of board size and composition: a theory of corporate boards Journal of Financial and Quantitative Analysis 40, 283-306.

22
Rajan, R., and Zingales L., 1998, Financial dependence and growth, American Economic Review 88, 559-586.
Reynolds, J., and Francis J., 2000, Does size matter? The influence of large clients on office-level auditor reporting decisions, Journal of Accounting and Economics 30, 375-400.
Schroeder, M., 2001, SEC list of accounting-fraud probes grows, Wall Street Journal, July 6, C1, C16.
Srinivasan, S., 2005, Consequences of financial reporting failure for outside directors: evidence from accounting restatements and audit committee members, Journal of Accounting Research 43, 291-334.
Warfield, T., Wild J., and Wild K., 1995, Managerial ownership, accounting choices, and informativeness of earnings, Journal of Accounting and Economics 20, 61-91.
Warther, V., 1998, Board effectiveness and board dissent: a model of the board’s relationship to management and shareholders, Journal of Corporate Finance 4, 53-70.
Yermack, D, 1996, Higher market valuation of companies with a small board of directors, Journal of Financial Economics 40, 185-211.

23
Appendix 1. Analysis of the Model
We denote directors’ voting profile as (𝑘0,𝑘1), when 𝑘0 of them vote for a = 0 and 𝑘1 of
them vote for a = 1.
Suppose first that n is an odd number. Given voting rule 𝑘𝑅 = (𝑛 + 1)/2, profile ((n-1)/2,
(n-1)/2) is the pivotal case, where the marginal director’s vote determines the audit committee’s
choice of action. Therefore, the pivotal case motivates the marginal director to vote
independently based on his own information. Consider next a non-pivotal case (𝑘0,𝑘1), where
𝑘0 < 𝑘1. In this case, the audit committee chooses a = 1 independent of the marginal director’s
vote, and by voting for a = 1, the marginal director avoids the disconformity cost. Therefore, the
marginal director will bias towards a = 1 regardless of his independent information. Similarly, in
the case of (𝑘1,𝑘0), the marginal director will bias towards a = 0. However, since the 𝜙𝑖s are
uncorrelated, the marginal director views profiles (𝑘0,𝑘1) and (𝑘1,𝑘0) as equally likely. Thus,
these two paring non-pivotal cases leave the marginal director indifferent between voting for a =
1 and for a = 0. Thus, in aggregate, the non-pivotal cases do not produce a strict preference for
the marginal director between the two internal control practices. This suggests that, in an odd
audit committee, each director voting independently based on his own information is the
equilibrium strategy.
Suppose next that n is an even number. Given voting rule 𝑘𝑅 = (𝑛/2) + 1, the marginal
director is pivotal when the other directors’ voting profile is ((n/2)-1, n/2). Clearly, in this case,
the marginal director will vote independently based on his own information. However, among the
(n-1) (odd number) non-pivotal cases, the case (n/2, (n/2)-1) does not have an equally probable
paring non-pivotal case. In this case, the audit committee adopts action a = 0 regardless of how
the marginal director votes. For this reason, the marginal director strictly prefers to vote for a =

24
0 to be on the “winning side”, even though his own preference is for a = 1. Because of the
conformity preference, therefore, the non-pivotal cases collectively produce a strict bias for the
marginal director to vote for a = 0.
In summary, for an even audit committee, the conformity preference can conflict with the
performance preference, and the directors may no longer vote informatively. In particular, even
after observing a good (bad) aspect of the new internal control practice, a director may vote for
𝑎 = 0 (𝑎 = 1) if he expects that other directors’ votes are likely to lead the audit committee to
stick to the existing internal control practice (adopt the new internal control practice).

25
Appendix 2. Variable Definition
Variable Definition Auditor tenure The number of years that the company is audited by the same accounting firm.
Big4 A dummy variable, taking the value of one if the company is audited by one of Big Four accounting firms and zero otherwise.
Big committee A dummy variable, taking the value of one if the number of directors in the audit committee is no less than the sample median value and zero otherwise.
Board independence A dummy variable, taking the value of one if more than half of directors on the board are independent and zero otherwise.
Board size The number of directors on the board.
CFO The operating cash flows scaled by total assets.
CFO predictability The absolute value of the residuals obtained by the regression of future operating cash flows on prior period’s earnings components for each fiscal year and each two-digit SIC code industry with at least 30 observations.
Committee independence A dummy variable, taking the value of one if more than two thirds of directors in the audit committees are independent and zero otherwise.
DΔNI A dummy variable, taking the value of one if ΔNI is negative and zero otherwise.
Discretionary accruals The absolute value of discretionary accruals estimated by the modified Jones model for each fiscal year and each two-digit SIC code industry with at least 30 observations.
Financing A dummy variable, taking the value of one if the company issues new debt or equity during the year and zero otherwise.
Firm age The number of years that the company is listed on Compustat.
Gross margin The gross margin.
Herfindahl The competition index, calculated as the sum of squares of firms’ market shares in the industry (two-digit SIC code).
High CEO tenure A dummy variable, taking the value of one if the year of CEOs serving in the firm is no less than the sample median value and zero otherwise.
High director ownership A dummy variable, taking the value of one if the dollar-value ownership of all audit committee members is no less than the sample median value and zero otherwise.
High R&D A dummy variable, taking the value of one if the firm’s R&D expenditures scaled by sales are no less than the sample median value and zero otherwise.
High stock volatility A dummy variable, taking the value of one if the firm’s standard deviation of monthly stock returns over the fiscal year is no less than the sample median value and zero otherwise.
Inverse interest coverage The ratio of interest expense to operating income before depreciation. The ratio is capped at 2.00 and is assigned a value of 2.00 if operating income before depreciation is negative.
Lagged accruals The prior year’s total accruals scaled by total assets.
Leverage The ratio of total debts to total assets.

26
Variable Definition
Loss A dummy variable, taking the value of one if the income before extraordinary items is negative and zero otherwise.
M&A A dummy variable, taking the value of one if the company has an acquisition contributing to sales during the year and zero otherwise.
MB The market-to-book rate.
Negative equity A dummy variable, taking the value of one if the book value of equity is negative and zero otherwise.
Net income The income before extraordinary items divided by the market value of equity at the beginning of the fiscal year.
ΔNI The change in net income scaled by total assets.
Odd A dummy variable, taking the value of one if an odd number of directors are in the audit committee and zero otherwise.
Operating cycle The operating cycle (in days), calculated as [(ARt+ARt-1)/2÷(Sale/360)] + [(INVt+INVt-1) /2÷(COGS/360)], where AR is the firm’s accounts receivable, Sale is the firm’s sale, INV is the firm’s inventory, and COGS is the firm’s cost of goods sold.
PPE The net plant, property and equipment divided by total assets.
Restatement A dummy variable, taking the value of one if the financial reports in the fiscal year are restated subsequently and zero otherwise.
Return The 12-month cumulative stock return ending three months after the fiscal year-end.
ROA The income before extraordinary items divided by total assets.
Sales growth The growth rate in sales.
Segment The number of business segments.
Stock volatility The standard deviation of monthly stock returns over the fiscal year.
Total assets The firm’s total assets in million.
Working capital accruals The working capital accruals, calculated as ([△Current assets – △Cash and short term investments] – [△Current liabilities – △Debt in current liabilities – △Taxes payable] – DEPR) ⁄ Average total assets, where △Current assets is the change of current assets, △Cash and short term investments is the change of cash and short term investments, △Current liabilities is the change of current liabilities, △Debt in current liabilities is the change of debt in current liabilities, △Taxes payable is the change of income taxes payable, and DEPR denotes the depreciation and amortization expenses.

27
Appendix 3. Estimation of Discretionary Accruals
We first estimate the parameters of the following equation for each fiscal year and each
two-digit SIC industry code with at least 30 observations:
(7)
where:
Accrualt = total accruals at t, scaled by total assets at t-1; total accruals are the income before extraordinary items minus operating cash flows;
Assett-1= total assets at t-1;
△REVt = change in revenues at t, scaled by total assets at t-1;
PPEt = net property, plant, and equipment at t, scaled by total assets at t-1.
We then use the estimated parameters to calculate expected accruals (EAccrual) by
Equation (8):
(8)
where:
△ARt = change in accounting receivables at t, scaled by total assets at t-1.
The discretionary accruals equal to the absolute value of difference between Accrualt and
EAccrualt. We take the absolute value in the regression because earnings management can
involve either income-increasing or income-decreasing accruals to meet earnings targets
(Warfield, Wild and Wild, 1995; Reynolds and Francis, 2000; Klein, 2002).
ttttt PPEREVAssetAccrual εααα ++∆+= − 3211 /1
ttttt PPEARREVAssetEAccrual 3
^
2
^
11
^)(/1 ααα +∆−∆+= −

28
Appendix 4. Measure of Cash Flow Predictability
We estimate the following equation to calculate the measure of cash flow predictability:
(9)
where:
CFOt= operating cash flows at t, scaled by total assets at t-1;
ΔARt= change in accounts receivable at t, scaled by total assets at t-1;
ΔINVt= change in inventory at t, scaled by total assets at t-1;
ΔAPt= change in accounts payable at t, scaled by total assets at t-1;
DEPRt= depreciation and amortization expenses at t, scaled by total assets at t-1;
OTHERt= net of all other accruals at t, scaled by total assets at t-1; all other accruals
are calculated as (EARN–(CFO+ΔAR+ΔINV–ΔAP–DEPR)), where EARN is the income before
extraordinary items.
We estimate the above equation for each fiscal year and each two-digit SIC code industry
with at least 30 observations. The empirical measure of cash flow predictability is the absolute
value of residuals: CFO predictability=|εt+1|.
165432101 ++ +++∆+∆+∆++= tttttttt OTHERDEPRAPINVARCFOCFO εδδδδδδδ

29
Figure 1. Board Size and Tobin’s Q
This graph is extracted from Figure 1 of Yermack (1996) and illustrates sample means and medians of Tobin’s Q for different sizes of boards of directors. Yermack’s sample consists of 3,438 annual observations from 452 firms between 1984 and 1991.

30
Table 1. Distribution of Audit Committee Size
The sample consists of 6,687 firm-year observations with an odd audit committee and 5,384 firm-year observations with an even audit committee during 1998–2010.
# of Directors in audit committees # of firm-year observations Percentage
2 1,370 11.35%
3 4,922 40.78%
4 3,392 28.10%
5 1,607 13.31%
6 570 4.72%
7 143 1.18%
8 50 0.41%
9 10 0.08%
10 2 0.02%
11 5 0.04%
Total 12,071 100%

31
Table 2. Summary Statistics
The sample consists of 6,687 firm-year observations with an odd audit committee and 5,384 firm-year observations with an even audit committee during 1998–2010. Appendix 2 provides the variable definitions.
Mean Median Std. P25 P75 Restatement 0.10 0.00 0.30 0.00 0.00 Total assets (million) 13,520 2,265 40,556 805 7,953 Leverage 0.22 0.21 0.18 0.06 0.33 Sales growth 0.05 0.07 0.20 -0.01 0.14 Negative equity 0.01 0.00 0.11 0.00 0.00 Firm age 27.63 22.00 16.73 13.00 43.00 Return 0.15 0.10 0.50 -0.15 0.36 Stock volatility 0.11 0.09 0.06 0.07 0.14 MB 1.27 0.91 1.21 0.48 1.62 Loss 0.14 0.00 0.35 0.00 0.00 Inverse interest coverage 0.47 0.12 0.73 0.05 0.32 Working capital accruals -0.04 -0.04 0.06 -0.07 -0.01 Committee independence 0.96 1.00 0.20 1.00 1.00 Board size 9.59 9.00 2.73 8.00 11.00 Board independence 0.88 1.00 0.32 1.00 1.00 M&A 0.11 0.00 0.31 0.00 0.00 Financing 0.60 1.00 0.49 0.00 1.00 Big4 0.98 1.00 0.15 1.00 1.00 Auditor tenure 21.05 14.00 20.85 6.00 28.00

32
Table 3. The Even-odd Nature of Audit Committees and Financial Restatements
The sample consists of 6,687 firm-year observations with an odd audit committee and 5,384 firm-year observations with an even audit committee during 1998–2010. The dependent variable is the indicator variable of financial restatements, which takes the value of one if the financial reports in the fiscal year are restated subsequently and zero otherwise. Odd is a dummy variable, taking the value of one if an odd number of directors are in the audit committee and zero otherwise. Appendix 2 provides the definitions of the other variables. Committee size FE includes a group of dummy variables to flag the audit committees sized between 2 and 3, between 4 and 5, between 6 and 7, between 8 and 9. Industry FE is based on 2-digit SIC code. All continuous variables are winsorized at the top and bottom 1%. The table presents the marginal effects of probit regression. P-values based on robust standard errors clustered at the firm level are reported in parentheses. Superscripts ***, **, and * denote statistical significance at the 1%, 5%, and 10% levels, respectively.
Dependent variable = Restatement dummy
Full sample Full sample Full sample
Excluding committees with more than five
members (1) (2) (3) (4)
Odd -0.016** -0.015** -0.015** -0.015* (0.045) (0.047) (0.044) (0.067) Log(Total assets) 0.005 0.005 0.004 0.004 (0.159) (0.205) (0.284) (0.322) Leverage -0.018 -0.042 -0.041 -0.050 (0.526) (0.159) (0.161) (0.102) Sales growth 0.006 0.002 0.003 0.002 (0.706) (0.891) (0.852) (0.911) Negative equity 0.016 0.024 0.024 0.033 (0.754) (0.643) (0.645) (0.541) Log(Firm age) -0.000 -0.000 -0.002 -0.005 (0.990) (0.978) (0.797) (0.551) Return -0.002 -0.001 -0.001 0.001 (0.796) (0.886) (0.880) (0.905) Stock volatility 0.096 0.084 0.086 0.081 (0.167) (0.220) (0.209) (0.253) MB -0.005 -0.007 -0.007 -0.009* (0.267) (0.145) (0.137) (0.094) Loss 0.029*** 0.028*** 0.028*** 0.030*** (0.007) (0.007) (0.008) (0.006) Inverse interest coverage -0.003 -0.003 -0.002 -0.005 (0.648) (0.703) (0.765) (0.503) Working capital accruals 0.027 0.028 0.029 0.035 (0.582) (0.560) (0.554) (0.496) Committee independence 0.026 0.027 0.027 0.029 (0.130) (0.113) (0.109) (0.102) Log(Board size) 0.029 0.030 0.028 0.028

33
(0.181) (0.169) (0.196) (0.210) Board independence -0.019 -0.019 -0.020 -0.023 (0.175) (0.160) (0.148) (0.117) M&A 0.000 0.001 0.002 (0.960) (0.933) (0.873) Financing 0.023*** 0.023*** 0.027*** (0.002) (0.002) (0.001) Big4 0.032 0.030 (0.152) (0.209) Log(Auditor tenure) 0.004 0.007
(0.348) (0.154)
Committee size FE Yes Yes Yes Yes Industry FE Yes Yes Yes Yes Year FE Yes Yes Yes Yes Observations 12,071 12,071 12,071 11,291 Pseudo R2 3.46% 3.68% 3.76% 3.69%

34
Table 4. Interactive Analysis
The sample consists of 6,687 firm-year observations with an odd audit committee and 5,384 firm-year observations with an even audit committee during 1998–2010. Appendix 2 provides the variable definitions. Committee size FE includes a group of dummy variables to flag the audit committees sized between 2 and 3, between 4 and 5, between 6 and 7, between 8 and 9. Industry FE is based on 2-digit SIC code. All continuous variables are winsorized at the top and bottom 1%. The table presents the marginal effects of probit regression. P-values based on robust standard errors clustered at the firm level are reported in parentheses. Superscripts ***, **, and * denote statistical significance at the 1%, 5%, and 10% levels, respectively.
Dependent variable = Restatement dummy (1) (2) (3) (4) (5)
Odd -0.009 -0.003 -0.029*** -0.031** -0.000 (0.302) (0.748) (0.002) (0.014) (0.985) Odd × High R&D -0.026* (0.089) Odd × High stock volatility -0.027** (0.031) Odd × High director ownership 0.028** (0.032) Odd × Big committee 0.035** (0.045) Odd × High CEO tenure -0.037** (0.011) High R&D -0.002 (0.893) High stock volatility 0.031*** (0.001) High director ownership -0.029*** (0.004) Big committee -0.037*** (0.005) High CEO tenure 0.026** (0.016) Log(Total assets) 0.005 0.005 0.005 0.004 0.004 (0.218) (0.222) (0.207) (0.352) (0.272) Leverage -0.044 -0.041 -0.041 -0.041 -0.042 (0.132) (0.161) (0.165) (0.171) (0.158) Sales growth 0.003 0.001 0.004 0.003 0.004 (0.829) (0.930) (0.770) (0.843) (0.805) Negative equity 0.023 0.024 0.023 0.024 0.027 (0.657) (0.645) (0.659) (0.645) (0.614) Log(Firm age) -0.003 -0.002 -0.003 -0.003 -0.002 (0.754) (0.815) (0.753) (0.720) (0.805)

35
Return -0.001 -0.001 -0.000 -0.001 -0.001 (0.806) (0.890) (0.938) (0.902) (0.901) Stock volatility 0.096 -0.004 0.078 0.084 0.086 (0.156) (0.959) (0.256) (0.219) (0.207) MB -0.006 -0.007 -0.006 -0.007 -0.007 (0.255) (0.161) (0.209) (0.161) (0.128) Loss 0.030*** 0.028*** 0.027** 0.029*** 0.029*** (0.004) (0.007) (0.011) (0.007) (0.006) Inverse interest coverage -0.001 -0.002 -0.002 -0.002 -0.002 (0.891) (0.795) (0.753) (0.780) (0.752) Working capital accruals 0.026 0.026 0.027 0.029 0.028 (0.585) (0.598) (0.578) (0.549) (0.561) Committee independence 0.027 0.027 0.025 0.029* 0.027 (0.113) (0.107) (0.143) (0.092) (0.106) Log(Board size) 0.026 0.028 0.028 0.022 0.029 (0.219) (0.195) (0.200) (0.284) (0.181) Board independence -0.018 -0.020 -0.020 -0.021 -0.020 (0.179) (0.149) (0.156) (0.127) (0.150) M&A 0.001 0.000 0.001 0.001 0.001 (0.946) (0.959) (0.953) (0.900) (0.901) Financing 0.023*** 0.024*** 0.024*** 0.024*** 0.023*** (0.002) (0.002) (0.001) (0.002) (0.002) Big4 0.032 0.033 0.034 0.032 0.032 (0.163) (0.144) (0.125) (0.158) (0.162) Log(Auditor tenure) 0.005 0.004 0.004 0.004 0.005
(0.327) (0.338) (0.339) (0.343) (0.322)
Committee size FE Yes Yes Yes No Yes Industry FE Yes Yes Yes Yes Yes Year FE Yes Yes Yes Yes Yes Observations 12,071 12,071 12,071 12,071 12,071 Pseudo R2 3.90% 3.92% 3.93% 3.74% 3.91%

36
Table 5. Two-stage Least Squares Regression
The sample consists of 6,687 firm-year observations with an odd audit committee and 5,384 firm-year observations with an even audit committee during 1998–2010. State-level odd equals to the number of companies with an odd audit committee divided by the total number of companies in the firm’s state. Appendix 2 provides the definitions of the other variables. Committee size FE includes a group of dummy variables to flag the audit committees sized between 2 and 3, between 4 and 5, between 6 and 7, between 8 and 9. Industry FE is based on 2-digit SIC code. All continuous variables are winsorized at the top and bottom 1%. P-values based on robust standard errors clustered at the firm level are reported in parentheses. Superscripts ***, **, and * denote statistical significance at the 1%, 5%, and 10% levels, respectively.
1st stage predicting Odd indicator 2nd stage on financial restatements
(1) (2) State-level odd 3.841*** (0.000) Predicted Odd -0.375** (0.049) Log(Total assets) 0.055** 0.029 (0.021) (0.224) Leverage -0.094 -0.264 (0.620) (0.141) Sales growth -0.010 0.015 (0.941) (0.864) Negative equity 0.167 0.153 (0.502) (0.595) Log(Firm age) 0.265*** -0.004 (0.000) (0.948) Return 0.109* -0.003 (0.058) (0.945) Stock volatility -1.598*** 0.475
(0.002) (0.252)
MB -0.046* -0.046 (0.089) (0.125) Loss 0.061 0.155*** (0.469) (0.010) Inverse interest coverage 0.002 -0.012 (0.961) (0.771) Working capital accruals 0.903** 0.209 (0.031) (0.481) Committee independence 0.384** 0.207* (0.011) (0.074) Log(Board size) 1.691*** 0.225 (0.000) (0.103) Board independence 0.502*** -0.099
37
(0.000) (0.224) M&A -0.046 0.006
(0.571) (0.916)
Financing -0.064 0.141*** (0.231) (0.002) Big4 -0.190 0.219 (0.240) (0.167) Log(Auditor tenure) 0.023 0.029
(0.399) (0.309)
Committee size FE Yes Yes Industry FE Yes Yes Year FE Yes Yes Observations 12,071 12,071 Pseudo R2 32.59% 3.76%

38
Table 6. Alternative Measures of Earnings Quality
This table presents the robustness check of alternative earnings quality measures. Odd is a dummy variable, taking the value of one if an odd number of directors are in the audit committee and zero otherwise. Appendix 2 provides the definitions of other variables. Committee size FE includes a group of dummy variables to flag the audit committees sized between 2 and 3, between 4 and 5, between 6 and 7, between 8 and 9. Industry FE is based on 2-digit SIC code. All continuous variables are winsorized at the top and bottom 1%. P-values based on robust standard errors clustered at the firm level are reported in parentheses. Superscripts ***, **, and * denote statistical significance at the 1%, 5%, and 10% levels, respectively. Panel A presents the analysis of discretionary accruals. Panel B presents the analysis of cash flow predictability. Panel C presents the analysis of earnings informativeness. Panel D presents the analysis of timely loss recognition.
Panel A: Discretionary Accruals
OLS 2SLS: 2nd Stage
(1) (2) Odd -0.005** -0.010** (0.013) (0.043) Log(Total assets) -0.003*** -0.003*** (0.000) (0.001) ROA -0.491*** -0.491*** (0.000) (0.000) Leverage 0.005 0.005 (0.401) (0.360) MB 0.007*** 0.006*** (0.000) (0.000) Loss -0.004 -0.004 (0.184) (0.170) CFO 0.328*** 0.328*** (0.000) (0.000) Lagged accruals -0.024* -0.024* (0.061) (0.065) Committee independence 0.004 0.005 (0.218) (0.176) Log(Board size) 0.005 0.006 (0.215) (0.125) Board independence -0.005** -0.005* (0.038) (0.054) Committee size FE Yes Yes Industry FE Yes Yes Year FE Yes Yes Observations 15,024 15,024 R-squared 23.45% 23.43%
39
Panel B: Cash Flow Predictability
OLS (1)
2SLS: 2nd Stage (2)
Odd -0.057*** -0.362*** (0.001) (0.000) Size 0.006 0.008 (0.288) (0.213) ROA -0.200** -0.206** (0.049) (0.041) Leverage -0.052 -0.035 (0.213) (0.400) Sales growth 0.227*** 0.211*** (0.000) (0.000) PPE 0.035 0.033 (0.232) (0.255) Herfindahl 0.829** 0.924*** (0.010) (0.005) Gross margin -0.008 -0.001 (0.859) (0.985) Operating cycle 0.000*** 0.000*** (0.004) (0.005) Segment -0.029*** -0.031*** (0.003) (0.002) Committee independence -0.009 0.028 (0.788) (0.376) Board size -0.031 0.037 (0.360) (0.300) Board independence -0.050** -0.044*
(0.031) (0.060)
Committee size FE Yes Yes Industry FE Yes Yes Observations 13,550 13,550 R-squared 10.12% 10.32%
40
Panel C: Earnings Informativeness
OLS (1)
2SLS: 2nd Stage (2)
Net income 0.828*** 0.777*** (0.000) (0.000) Net income×Odd 0.190** 0.998** (0.020) (0.031) Net income×Size -0.000 -0.017 (0.999) (0.535) Net income×Leverage 0.554** 0.606*** (0.018) (0.006) Net income×MB -0.055 -0.053 (0.452) (0.483) Net income×Loss -1.457*** -1.500*** (0.000) (0.000) Net income×Committee independence -0.120 -0.079 (0.105) (0.335) Net income× Board size -0.320 -0.492* (0.130) (0.052) Net income× Board independence -0.140* -0.201**
(0.053) (0.027)
Net income×Committee size FE Yes Yes Industry FE Yes Yes Observations 17,743 17,743 R-squared 5.59% 5.63%
41
Panel D: Timely Loss Recognition
OLS (1)
2SLS: 2nd Stage (2)
ΔNI -0.014 0.163
(0.957) (0.572)
DΔNI -0.065*** -0.077***
(0.002) (0.000)
Odd -0.006*** -0.016***
(0.001) (0.002)
ΔNI×DΔNI -0.306*** -0.337***
(0.000) (0.000)
ΔNI×Odd 0.074 0.195
(0.131) (0.235)
DΔNI×Odd 0.003 -0.008
(0.355) (0.503)
ΔNI×DΔNI×Odd -0.093*** -0.817***
(0.009) (0.000)
Size 0.005*** 0.004***
(0.000) (0.000)
ΔNI×Size -0.012 -0.009
(0.509) (0.632)
DΔNI×Size 0.002 0.002
(0.211) (0.116)
ΔNI×DΔNI×Size -0.008 0.003
(0.604) (0.870)
Leverage -0.043*** -0.038***
(0.000) (0.000)
ΔNI×Leverage 0.016 -0.070
(0.869) (0.485)
DΔNI×Leverage 0.004 0.001
(0.741) (0.893)
ΔNI×DΔNI×Leverage -0.031 0.062
(0.609) (0.326)
Committee independence -0.001 0.001
(0.701) (0.772)
ΔNI×Committee independence 0.030 -0.018
(0.796) (0.880)
DΔNI×Committee independence 0.009 0.010
(0.258) (0.204)
ΔNI×DΔNI×Committee independence -0.078 0.052
(0.377) (0.579)
Board size -0.000 0.000
(0.622) (0.612)
ΔNI×Board size 0.005 -0.048
(0.966) (0.675)

42
DΔNI×Board size 0.011 0.014*
(0.133) (0.081)
ΔNI×DΔNI×Board size -0.075 0.117
(0.411) (0.286)
Board independence 0.003 0.003
(0.248) (0.234)
ΔNI×Board independence 0.043 0.046
(0.501) (0.475)
DΔNI×Board independence -0.007 -0.006
(0.183) (0.279)
ΔNI×DΔNI×Board independence -0.013 0.028
(0.753) (0.513)
Committee size FE Yes Yes ΔNI×Committee size FE Yes Yes DΔNI×Committee size FE Yes Yes ΔNI×DΔNI×Committee size FE Yes Yes Industry FE Yes Yes Observations 18,065 18,065 R-squared 12.21% 12.40%